It is often important to convey and determine where knowledge, beliefs, and memories come from, using source monitoring abilities (Johnson, Hashtroudi, & Lindsay, Reference Johnson, Hashtroudi and Lindsay1993). Source monitoring devices in communication are used to indicate when, from whom, and through which means a speaker obtained the information being conveyed. Languages offer different means to communicate source of knowledge, and it is the linguistic marking of evidentiality that serves to specify the type of source of information conveyed in an utterance (Bybee, Reference Bybee1985). Evidentiality is a special grammatical system found approximately in one quarter of the world's languages, and usually implemented via closed-class verbal affixes and particles (Aikhenvald, Reference Aikhenvald2004). In languages with evidentials, a distinction is made between directly and indirectly obtained information, where the latter category usually includes information obtained via language, oral or written, and information obtained through making an inference (de Haan, Reference de Haan2001). In some languages there may be even finer distinctions specifying the type of source of directly acquired (e.g., vision, audition) or indirectly acquired (e.g., second-hand, folklore) information (Plungian Reference Plungian2001; Willett, Reference Willett1988).
Turkish is a language with evidential markers, where one has to choose between two verbal morphemes –DI and –mIş when uttering a sentence with past reference. The speaker has to specify in any sentence with reference to a past event whether the information conveyed in a sentence was accessed directly or indirectly. While the past tense inflection –DI is neutral, expressing what the speaker takes to be factual knowledge, it is considered to be a direct experience marker in view of its opposition to the evidential –mIş within the tense–aspect–modality system. To illustrate, if you wish to express that the professor arrived at her office, you have to make a choice between the sentences presented in the examples below. Example (1) indicates that the speaker has first-hand information about the content, such as observing the professor walking into her office.
(1) Hoca ofis-in-e gel-di.
professor office-poss-dat come-past.3sgFootnote 1
‘The professor came to her office (I saw her).’
If the speaker does not see the professor entering her office but infers this upon seeing that the door of her office is open, then the sentence in example (2) with the –mIş morpheme is the correct choice. The inference meaning that –mIş encodes is different from logical deduction from existing knowledge, but is rather based on some observable evidence, implying that the speaker made an inference about a process that led to that evidence. In example (2), seeing the office door open is the evidence for the speaker to make the assumption that the professor arrived at her office.
(2) Hoca ofis-in-e gel-miş.
professor office-poss-dat come-past-evid.3sg
‘The professor came to her office (I inferred it from evidence / I heard it from someone).’
Finally, the speaker can also obtain information about the professor from other people or sources such as newspapers or television. When conveying this hearsay information, again the verbal form in example (2) is used. Moreover, unlike –DI, the event time can be non-past. In example (3), the event time is specified by the future marker –EcEk, and the particle –mIş just indicates hearsay.
(3) Hoca ofis-in-e gel-ecek-miş.
professor office-poss-dat come-fut-evid.3sg
‘The professor will come to her office (I heard it from someone).’
The functions of the –mIş particle are not limited to inference and hearsay. This verbal affix is particularly interesting because it is also used to talk about the nonfactual realm, as in stories, folktales, and pretend play, and in directly encountered states of affairs experienced by the speaker as new or unexpected information. By pragmatic extension, it is used in the expression of surprise, irony, and compliment (Aksu-Koç & Slobin, Reference Aksu-Koç, Slobin, Chafe and Nichols1986; DeLancey, Reference DeLancey2001; Slobin & Aksu, Reference Slobin, Aksu and Hopper1982). Hence, the –mIş affix expresses different degrees of psychological distance to the event encoded in language, and therefore it is a marker of speaker stance as well as information source (Aksu-Koç, Reference Aksu-Koç1988, Reference Aksu-Koç, Güven, Akar, Öztürk and Kelepir2016; Johanson, Reference Johanson, Aikhenvald and Dixon2003).
The only existing observational study conducted on the acquisition of Turkish evidentials (Aksu-Koç, Reference Aksu-Koç1988) examined the speech of three children between 21 and 30 months while interacting with an experimenter. This study revealed that the children first produced the direct experience marker –DI before two years of age, and the production of the –mIş affix came only a few months later. The indirect experience marker was usually first used in contexts of shared attention with the caregiver to talk about perceptually available states or properties of objects just noticed as new information. The inferential function emerged later and was at first used for simple inferences based on changes of state in familiar objects. Children then started using the form in its hearsay function and thus could convey information obtained from other sources.
Experimental studies conducted on the comprehension and production of the –DI and –mIş markers showed that children are able to produce these suffixes in experimental environments at later ages than in spontaneous speech. To examine use of the inference function, Aksu-Koç (Reference Aksu-Koç1988) presented to children events with toys where they either viewed all phases of an event or just the end-state of an event and therefore had to infer the process that led to the end-state. The ability to use the form in its hearsay function was examined in a task where children had to role-play for one doll and report information heard from another doll to a third doll. Children used the direct experience marker –DI at earlier ages and more correctly compared to the indirect experience marker –mIş. The inferential function of the –mIş marker was found to be produced prior to its hearsay function, as was found for semi-naturalistic interaction data. Similar findings were reported by Ögel (Reference Ögel2007). In Ozturk and Papafragou's (Reference Ozturk and Papafragou2016) study, children watched videos of the end-state of an event in the inference condition (e.g., a child looking sad and holding an ice-cream cone while looking at an ice cream on the floor) and videos of someone telling an event in the hearsay condition. Contrary to Aksu-Koç’s (Reference Aksu-Koç1988) findings, children were more successful in using hearsay at earlier ages than inference, and overall children did not perform very well even at the later ages of six and seven. Finally, Ünal and Papafragou (Reference Ünal and Papafragou2016) used a similar version of Aksu-Koç’s (Reference Aksu-Koç1988) tasks and observed that three-year-olds were in general successful in producing the indirect experience marker in inference trials. However, comprehension followed production, which was taken to reflect the lack of perspective-taking skills necessary to reason about the nature of the speaker's information source.
When we turn to cross-linguistic investigations of spontaneous speech, we see different patterns for different languages, with the common finding that the markers for direct experience emerge earlier than the markers indicating indirect experience. Lee and Law (Reference Lee, Law and Clark2000) examined the spontaneous speech of three Cantonese-speaking children for a year, with the starting ages of observation ranging from 1;7 to 2;8. Only three instances of the hearsay marker were found, and children did not use the inference marker at all. Both hearsay and inference markers were also rare in child-directed speech as opposed to the frequent direct experience marker. Choi (Reference Choi1991) looked at three Korean-learning children's speech (aged between 1;8 and 2;11) in their home environment and observed a similar order of acquisition, where the marker for direct experience emerges first before two years of age and is followed by the appearance of the hearsay / indirect experience marker between the ages of 2;0 and 2;6. Japanese children also begin acquiring these markers of their language between ages 2;0 and 3;0 (Clancy, Reference Clancy and Slobin1985; Matsui & Yamomoto, Reference Matsui and Yamamoto2013; Shirai, Shirai, & Furuta, Reference Shirai, Shirai, Furuta, Perkins and Howard2000). Finally, Quechua-speaking children start producing the direct experience marker first around two years of age, but with the purpose of conveying certainty (Courtney, Reference Courtney2008). Then, at around age four, they use this form to convey information directly obtained while marking information gained through inference with a different form. The hearsay marker was rare in child speech between four and eight years of age.
Our goal in this paper is to pursue a comprehensive observational study in Turkish by making use of a relatively large, regularly collected longitudinal corpus of child–caregiver interactions, and provide answers to the following questions: (1) How frequently is the indirect experience marker –mIş used in child–caregiver interaction and how does this frequency change over time? (2) How are different functions of –mIş distributed in child and caregiver speech? (3) In which order do these different functions emerge in child speech, and does this order depend on the input the child receives? Additionally, we also closely examined nonfactual uses that were very common in the child–caregiver interactions but which have not yet received much attention as a separate category in the literature. Finally, we explored whether the evidential usage differs in families of different socioeconomic standing.
Corpus
In this study we used a longitudinal video corpus that was established to investigate the development of communication and language skills in Turkish-speaking children (Küntay, Koçbaş, & Taşçı, Reference Küntay, Koçbaş and Taşçı2015). The corpus consisted of video recordings of eight children (between 8 and 36 months) and their transcriptions during communication with their caregivers (e.g., mother, grandmother, babysitter) in their home environment. For this study, we examined the data of six children (4 girls and 2 boys), since the data of one child was terminated at the 21st month when the evidential marker was just emerging and the recordings of one other child were not yet fully transcribed at the time of the analysis. Three of the children came from low-SES (socioeconomic status) families (parental educational attainment of 8, 8, and 5 years), and three came from high-SES families (parental educational attainment of 15, 11, and 15 years, respectively). The families were each visited for a 1-hour recording of daily activities (e.g., eating, playing) twice a month for 29 months (see Table 1 for duration of recording for each child).
Mean Number of Child-Directed and Child-Produced Utterances per Session and the Proportion of Evidentials in Speech for Each Child

Coding
We first extracted utterances that contain the suffix –mIş from the transcriptions. An R script was written to obtain the utterances from the sample that contained the allomorphs of –mIş (mış, miş, muş, müş), pronunciations that included a lengthened vowel (mı:ş, mi:ş, mu:ş, mü:ş), and childlike pronunciations (mıç, miç, muç, müç). All utterances produced by the researcher and found in adult-to-adult conversations were eliminated, leaving only child speech (CS) and child-directed speech (CDS). Utterances where the particle was used in its participial function (e.g., kuru-muş çiçek ‘dried flower’) and when it had an aspectual usage preceding another tense–aspect–modality marker (e.g., git-miş-ti ‘s/he had gone’) were separated and not coded since the particle is devoid of its evidential meaning in these contexts (Göksel & Kerslake, Reference Göksel and Kerslake2005; Slobin & Aksu, Reference Slobin, Aksu and Hopper1982). The few utterances which contained an idiom with an evidential were coded as idioms but not analyzed further.
Each remaining utterance was coded in terms of which source of information it denotes, and which pragmatic function it conveys. If an utterance contained more than one –mIş, each was coded with respect to these dimensions. The first and the second authors each coded half of the utterances and checked the coding of the other half. In the case of unresolved disagreements after discussions, the third and the fourth authors were consulted. The following sections provide more details about coding. Figure 1 summarizes the coding scheme.
Coding scheme for each utterance containing the − mIş particle.

Source of information
We coded each evidential usage of the –mIş particle in terms of four categories of source of information: (1) perceptual, (2) inference, (3) hearsay, and (4) nonfactual.
A perceptual usage was coded when the utterance was about the here and now. The purpose of the speaker is to indicate a feature of an object or event that is either in active joint attention of the child and the caregiver or to draw the addressee's attention to such a feature of an object, event, or person (e.g., baba gel-miş ‘daddy came (home)’ upon seeing the father at the door; C2, CDS, 11 monthsFootnote 2). The perceptual usage shows that the indirect experience marker can be used in circumstances where the speaker has direct access to an event or information. In situations where the speaker wishes to indicate a new observation, a new experience, or a revision of the speaker's earlier belief, the perceptual function of −mIş can be used instead of the direct experience marker –DI (Göksel & Kerslake, Reference Göksel and Kerslake2005; Slobin & Aksu, Reference Slobin, Aksu and Hopper1982).
The inferential function was coded when talking about a past process inferred from a present observation (e.g., abla mı al-mış bunu? ‘did she buy this?’ while looking at a new object in the living room after the arrival of the researcher; C1, CDS, 33 months). The hearsay function was coded if the utterance contained information acquired from another person or source via speech (e.g., babam bana bir şey al-mış ama eve gelince gösterecek-miş ‘daddy (reportedly) bought me something but he is (reportedly) going to show it to me when he gets home’; C5, CS, 36 months). An utterance was coded as nonfactual if it contained information that does not have any basis in reality. Utterances that contained story-telling, children's songs, and nonfactual events in the play environment such as role assignment fell under this category (e.g., sen öğretmen-miş-sin tamam mı? ‘you'll be the teacher, ok?’; C6, CS, 36 months).
As we show with this corpus for the first time in the literature, another function of the nonfactual –mIş is to regulate the addressee's behavior. This can be done in several ways, for instance the speaker may direct the addressee's interest to an event, person, object, or idea to divert attention away from the current focused behavior or object (e.g., su kalma-mış bit-miş ‘we are out of water’ to stop the child from playing with water; C3, CDS, 20 months). We classified such utterances under the nonfactual category. Sometimes, nonfactual information is presented in hearsay form where the speaker acts as if she acquired the presented information from another source (e.g., ablanın başı ağrıyor-muş ‘she has a headache’ to stop the child from making noise with his toys; C4, CDS, 28 months). We coded these utterances as nonfactual–hearsay and analyzed them under the nonfactual category. An alternative coding for some of the nonfactual utterances could be treating them under the hearsay category. Matsui and Yamamoto's (Reference Matsui and Yamamoto2013) analysis of the use of the Japanese sentence-final hearsay particle tte in imaginary quotations in one child's interaction with her mother is an example. Here, imaginary quotations refer to utterances that the speaker produces, as if quoting the utterances of imaginary participants such as toys and animals. We preferred a different coding scheme for this type of utterances, since we think that the nonfactual category is essential in child–caregiver interaction, and some of the nonfactual utterances (e.g., events in pretend play) cannot be classified under the hearsay category.
Finally, speakers sometimes made errors in indicating source of information, using the evidential –mIş instead of –DI for the events that they directly experienced (e.g., şunu ısır-mış ‘(she) has bitten this one’ when showing her finger that her cousin bit; C1, CS, 32 months).
Pragmatic function
Each evidential utterance was further coded as to whether it conveys a pragmatic function. Based on the literature about Turkish evidentials and our observations in the present corpus, we used the following categories for coding pragmatic function: (1) narrative, (2) pretend play, (3) behavior regulation of the addressee, (4) surprise, (5) irony, and (6) compliment.
We coded each nonfactual utterance as narrative, pretend play, or behavior regulation of the addressee. Utterances that fell under other source of information categories did not always possess one of the pragmatic functions listed in Figure 1. Telling a story or a tale, inventing a story by looking at a picture or an object, and singing children's songs were treated as narrative. Talking about imaginary events and features in the play environment was classified as pretend play. Finally, utterances aimed at changing the addressee's behavior were coded as behavior regulation of the addressee. We identified three major ways of regulating the addressee's behavior through the usage of the evidential marker. These are orienting the addressee's attention to something other than their current focus, talking about positive outcomes of desired behavior, and mentioning negative outcomes of undesired behavior. So, we coded these different categories as (1) attention-getter (e.g., kuş gel-miş, ‘the bird came’ to distract the child from taking the pacifier; C3, CDS, 17 months), (2) positive consequence (e.g., sen onu ye çıkacak-mış, ‘if you eat that, (the rabbit) will come out’ to encourage the child to eat some food; C1, CDS, 31 months), and (3) negative consequence (e.g., abla gör-müş yiyor-muş ufak bebekleri, ‘she (= research assistant) saw that it eats small babies’ to stop the child from leaving the room with her bicycle; C5, CDS, 27 months). Attention-getters were not only used in nonfactual but also in perceptual and sometimes in inferential and hearsay utterances (e.g., bak burada neler var-mış ‘look what we've got here’ to make the child look up when drinking water; C5, CDS, 8 months).
Utterances that were classified as perceptual, inference, and hearsay sometimes conveyed surprise (e.g., ne yap-mış-sınız evime ‘what have you done to my house’; C6, CDS, 20 months), irony (e.g., ne güzel şeyler öğret-miş ‘(she) taught you some nice things’ after the child uttered some dirty words; C3, CDS, 30 months), and compliments (e.g., çok güzel yap-mış-sın anne ‘you did it very well mom’ when talking about a drink that her mother prepared; C2, CS, 35 months).
Data analysis and presentation
We used growth curve analysis to examine the change of the variables of interest over time. Growth curve analysis is a mixed-effects analysis suitable for longitudinal data and it allows the analysis of individual deviations from the average trajectory. Following the instructions in Singer and Willett (Reference Singer and Willett2003), we performed a step-by-step analysis that included building and testing models with increasing complexity.
For each analysis, an unconditional means model (i.e., a model without predictors) was constructed first that partitions the total variation across people without regard to time. This model is also referred to as a one-way ANOVA with random effects, where children or caregivers are allowed to have different intercepts, i.e., the individual children and caregivers were allowed to differ from each other with respect to their starting points but not the slope of their trajectory in time. This model indicates whether there is systematic variation that is worth exploring with more complex models.
In the second step, two models were constructed and compared statistically. One of these models was a linear regression with time as the predictor variable. The other model was the unconditional growth model (i.e., a model that has only time as the predictor variable) that allows the partitioning of the variation across both people and time. This growth model has time as a fixed effect and allows children/caregivers to have random intercepts. Comparison of these two models clarifies whether including random effects is necessary at all. If the comparison is not significant, then the linear regression model is preferred. If including random effects provides an advantage, then, in the next step, a more complex model is built which additionally allows for random slopes, in other words, different slopes for different children/caregivers. Another comparison between the growth model with random intercepts and the growth model with random intercepts and slopes determines whether the latter model provides an improvement over the former. If it does, then one can include level-2 predictors (i.e., between-subjects factors such as SES) if necessary, and/or change the geometric form of the model from linear to polynomial if, based on the distribution of datapoints, one is led to believe that a polynomial form would better fit the data. For instance, a second-order polynomial (i.e., quadratic) model fits a quadratic function to datapoints instead of a line. A comparison between linear and quadratic models based on a likelihood ratio test that compares the goodness of fit of the two models determines which form provides a better fit for the data.
The growth curve model analyses were run with an R script utilizing nlme and lme4 packages (Bates, Maechler, Bolker, & Walker, Reference Bates, Maechler, Bolker and Walker2014; Pinheiro, Bates, DebRoy, Sarkar, & R Core Team, Reference Pinheiro, Bates, DebRoy and Sarkar2017). Graphics were created with packages lattice (Sarkar, Reference Sarkar2008), directlabels (Hocking, Reference Hocking2014), and ggplot2 (Wickham, Reference Wickham2009). Model comparisons for random effects were done by using the RLRsim package (Scheipl, Greven, & Kuechenhoff, Reference Scheipl, Greven and Kuechenhoff2008) (see supplementary material for an example script with comments, available at <https://doi.org/10.1017/S0305000917000526>).
We first present the analyses for the amount of speech in terms of the number of utterances directed to and produced by each child, and its change over time, with the purpose of providing information about individual differences. Second, we present our findings about the frequency and proportion of evidentials in CS and CDS by monitoring individual changes over time. Then, we turn to the use of different source of information categories, and when they emerge in child speech. Finally, we present different types of pragmatic uses of the nonfactual category and how caregivers of low- and high-SES differ from each other with respect to these pragmatic functions. Table 1 presents the mean number of utterances per session produced by and directed to each child, and the number and proportion of the utterances that contain an evidential.
The corpus from which we extracted the evidential marker included 83,580 child-produced and 113,301 child-directed utterances; 4,759 of child-directed (4.2%), and 1,823 of child-produced (2.2%) utterances contained the evidential –mIş, and were further coded.
Results
Amount of speech in CS and CDS
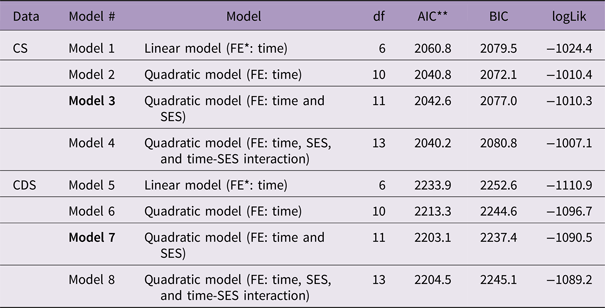
First, we analyzed how the mean number of utterances changes over time in CS and CDS. For CS, the first step in this analysis was to construct an unconditional means model to examine the partitioning of within- and between-person variation. An intra-class correlation coefficient of 0.08, calculated by dividing the between-person variance to total variance, indicated that 8% of the total variation in the amount of speech produced by children was attributable to the differences between children. Then, a linear unconditional growth model was built, where the time dimension (8 to 36 months) was included as a fixed effect, and children were allowed to have random intercepts. This random intercept model was significantly different from a linear regression model without random effects (p < .001). Hence, the inclusion of random effects provided a better model fit. Next, we checked whether the addition of random slopes would provide a better fit. The model with both random intercepts and slopes to allow for individual variation for starting points and slope of the trajectory in time was significantly different (p = .014) from the model with only random intercepts. Furthermore, 69% of the within-person variation was associated with linear time. To calculate this value, the difference between the residual variance in the unconditional means model and in the unconditional growth model with random intercepts and slopes was taken and divided by the residual variance in the unconditional means model. Since plotted graphs of the raw data (see Figures 7–10 in the ‘Appendix’) suggested that a quadratic model would be a better fit, we next built a quadratic model with time as a fixed effect and child random effects on all time terms. We used a second-order orthogonal polynomial to capture the shape of the change in time. Using orthogonal polynomials is beneficial to avoid collinearity problems. Since the linear unconditional growth model is nested within the quadratic model, a comparison of model fit indices of the linear and quadratic models was possible. This comparison showed that the quadratic model provided a better fit with lower AIC and BIC values (χ 2(4) = 27.9, p < .001). Adding SES as a predictor in the model did not improve model fit; low- and high-SES children did not differ from each other significantly with respect to the average amount of speech and trajectory in time. Table 2 shows the comparison of different models in terms of model fit. The selection of the models depended on the model fit indices Akaike (AIC) and Bayesian information criteria (BIC), where models with lowest AIC and BIC values were selected for CS and CDS.
Comparison of Linear and Quadratic Models for the Amount of Speech in CS and CDS (Lower AIC and BIC Values Indicate Better Fit. Best Fitting Models are shown in bold)

Notes. * FE: Fixed effect; ** AIC: Akaike information criterion; BIC: Bayesian information criterion.
In the preferred quadratic model, there was a significant effect of the linear term (Estimate = 1927.4, SE = 172.3, p < .001), indicating an increase in the mean number of utterances over time when averaged across children. The degree of curvature did not vary significantly on the average, i.e., the speed of development did not change across time on the average.
The preferred model is plotted in Figure 2. In this figure, the bold line indicates the average curve of the children. The other curves correspond to individual children's growth curves. Although the children did not differ from each other much in the earlier months, the differences began to emerge in later months. Some children increased the amount of their speech slowly but steadily, whereas others showed a faster increase early on followed by a slower increase or a decrease in later months.
Estimated individual growth curves for the mean number of utterances in CS. Average curve is drawn with a bold line.

For the amount of speech in CDS, we applied the same analytic procedure. The intra-class correlation coefficient in the unconditional means model indicated that 40% of the total variation was attributable to differences between caregivers. The unconditional growth model with random intercepts for each child's caregivers was significantly different from the linear regression model (p < .001). This showed that inclusion of individual variation improved the model fit. Therefore, the unconditional growth model with random intercepts and slopes was built and compared to the model with random intercepts only. The former provided a better fit (p < .001), and 14% of the within-person variance was associated with time. Again, the inspection of the plotted raw data suggested that a quadratic model could explain the data better. A model with a second-order orthogonal polynomial with time as a fixed effect and child random effects on all time terms provided a better fit for the data compared to the linear model (χ 2(4) = 28.5, p < .001) (see Table 2 for model comparisons). When SES was included as a fixed effect in the model, the new model was significantly different from the model without SES effects (χ 2(1) = 12.3, p < .001). However, a model with SES interaction effects did not provide a better fit.
Therefore, the model with SES and time as fixed effects, and child as random effects on all time terms was selected. The fixed effect for the linear term of time was not significant, i.e., no increase or decrease was observed in the mean number of caregiver utterances over time when averaged across caregivers. The fixed effect for the quadratic term of time was also not significant, indicating a stable rate of change across time averaged across children. However, the fixed effect for SES was significant (Estimate = –311.5, SE = 54.8, p = .005), indicating high-SES caregivers had higher amount of speech directed to the children on average than low-SES caregivers.
The model is plotted in Figure 3. Caregivers varied greatly in their average amount of speech, and also the form and speed of change over time. As Figure 3 shows, C1 is the child who consistently receives the least amount of input from her caregivers. Trajectories for C1, C5, and C6 are similar in that there is a downward trend starting from early months. On the other hand, for C2, C3, and C4, there is an increase in the amount of input in the earlier months, followed by a downward trend in the later months.
Estimated individual growth curves for the mean number of utterances in CDS. Average curves for high- and low-SES families are drawn with a bold line.

Use of the evidential –mIş in CS and CDS over the course of time
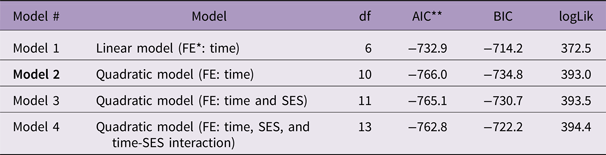
Table 1 shows the frequencies and proportions of the evidential –mIş in CDS and CS for each child. To capture the change in time, we again used growth curve models. For CDS, we first constructed the unconditional means model, which indicated that 6% of the total variation in caregivers’ usage of the evidential marker was associated with individual differences among caregivers. The unconditional growth model with time as fixed effect and random intercepts was different from a linear regression model (p < .001). In other words, the inclusion of random effects improved model fit. It was calculated that 40% of the within-person variation was associated with time. An improvement to the model was made with random slopes (p = .007). In the next step, we built a second-order orthogonal polynomial model with time as fixed effect and child as random effect on all time terms. This model provided a better fit for the data than the linear model (χ 2(4) = 41.1, p < .001) (see Table 3 for model comparisons). Adding SES as a predictor did not improve model fit.
Comparison of Linear and Quadratic Models for the Proportion of Evidentials in CDS (Lower AIC and BIC Values Indicate that Model 2 is the Best Fit)

Notes. * FE: Fixed effect; ** AIC: Akaike information criterion; BIC: Bayesian information criterion.
In the selected quadratic model, fixed effect for the linear term was significant (Estimate = 0.22, SE = 0.06, p < .001), indicating an increase in the percentage of evidentials over time averaged across caregivers. Fixed effect for the quadratic term was not significant, meaning that the average rate of change was stable across time.
Caregivers differed from each other with respect to their use of evidentials across time, as depicted in Figure 4. Caregivers of two children (C1 and C4) showed a steady increase, where caregivers of three children (C2, C3, and C6) showed an increase only after a certain time-point. In contrast to other caregivers, C5's caregivers demonstrated an increase up to a time-point and then a decrease. This pattern was observed due to the fact that caregivers of C5 produced the evidential −mIş much more (10.1%) than other children's caregivers (2.7%) between months 18 and 22. Between these months, C5's caregivers used −mIş during pretend play (31.3%) much more than the other caregivers (for C1: 0%, C2: 13.2%, C3: 5.4%, C4: 11.2%, C6: 18.7%).
Estimated individual growth curves for the mean number of utterances in CDS. Average curve is drawn with a bold line.

Finally, for child speech, 6% of the total variation in the usage of the evidential marker was associated with individual differences among children in the unconditional means model. However, a comparison of the linear regression model and the unconditional growth model with time as fixed effect and random intercepts for children did not yield a significant difference (p = .07). Thus, including individual deviations among children in the model did not improve model fit, and variations among children were negligible. A linear regression model was sufficient to explain children's use of the evidential − mIş over time. In this model, the fixed effect of time was close to significant (Estimate = 0.001, SE = 0.001, p = .057), indicating an increasing trend in terms of the percentage of the evidential − mIş in child speech over time. Figure 5 depicts this model where individual datapoints and a fitted regression line with a positive slope are shown. Time explained a small proportion of variance in children's use of the evidential marker (R 2 = .04). Including SES in the model did not improve model fit.
A linear regression model for the proportion of the evidential − mIş in CS over time. This model does not take individual variation into account. Individual datapoints and the fitted regression line are shown.

Source of information
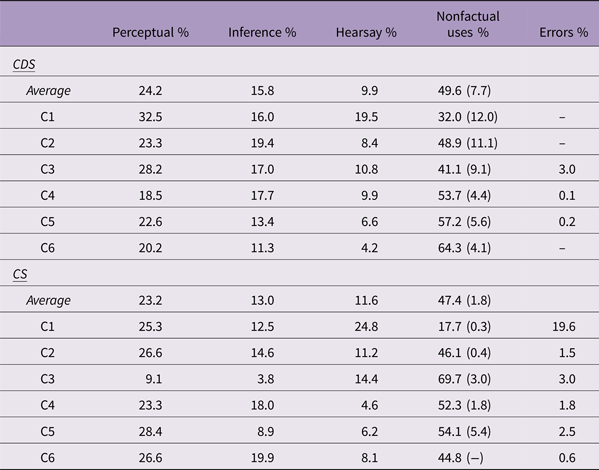
Here we present our analyses about the functions of –mIş to convey different types of information source. The inter-rater reliability for the raters calculated on 14% of evidential utterances was found to be κ = .93 (95% CI, [.91 to .98]) (p < .001). Table 4 shows the distribution of the perceptual, inference, hearsay, and nonfactual uses for each child in CS and CDS.
Percent Occurrence of Each Type of Source of Information out of All Utterances Containing the Particle –mIş within CDS and CS for Each Child

Note. Values in parentheses denote nonfactual-hearsay uses.
Mean distributions of different types of source of information are highly similar in CDS and CS (see Table 4), indicated by a high Pearson correlation (r(4) = .99, p = .005). On average, nonfactual uses are the most common, followed by perceptual, inferential, and hearsay uses. When we look at individual cases, we again observe that nonfactual uses are the most common, followed by perceptual uses. One exception is C1, where nonfactual uses are less frequent compared to the other children, and do not constitute the most common category. The function of inference is more commonly used than hearsay for five children in CDS and four children in CS.
Both children and caregivers committed some errors by using the indirect experience marker instead of the direct experience marker when they spoke about events that they directly experienced. Differently from other children, C1 has a high error rate, which is close to 20% in her speech. This high error rate may be due to the low amount of input the child receives from her caregivers with respect to the other children (see Figure 3). However, errors in other children's uses do not seem to be related either to the amount of input in CDS (as indicated by the mean number of total utterance and by the lack of a significant Pearson correlation when C1 is removed as an outlier) or to the percentage of the evidential marker –mIş in CDS. Another type of error observed early on is the use of the direct experience marker –DI in contexts that call for the use of –mIş (Aksu-Koç, Reference Aksu-Koç1988). Here, we cannot report on these errors since only those utterances marked with –mIş were included in the analysis.
Age of emergence
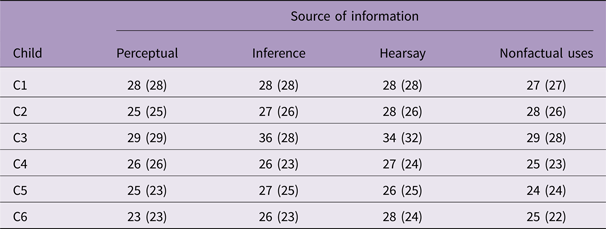
All six children were able to produce the indirect experience marker before age three, but they all started to produce it at different time-points. In the analyses we report below, we focused on two time-points where (1) children started using the marker appropriately (i.e., not instead of the –DI marker to indicate directly experienced events) for the first time and (2) children started using the marker productively, i.e., non-imitatively, for the first time. We defined a productive usage as the ability to produce the marker without using it with the same verbal root found within the previous 15 utterances of the caregivers’ speech. Table 5 lists these two time-points in months for each child.
First Month of Productive Usage for Each Child and for Each SOI Function (First Month of Correct Use Shown in Parentheses)

Children used the perceptual and nonfactual functions at first. Inference was productively used at the same time as or after the perceptual usage. No specific order appeared among the emergence of hearsay and inference. For three of the children, inference emerged earlier; for two, hearsay came first; and for one, both functions emerged at the same time.
Children in the high-SES group (M = 22.7, SD = 0.6) produced the marker correctly for the first time at younger ages in comparison to the low-SES group (M = 26.7, SD = 1.5) (t(4) = 4.2, p = .013, d = 3.5).
Pragmatic functions of nonfactual usage
Since the number of utterances that were coded as surprise, irony, and compliment was very low (2.9% and 1.1% of the evidentials in CDS and CS), we did not conduct any analyses for these categories of pragmatic function. Instead, we mainly focused on the pragmatic functions of nonfactual uses. The inter-rater reliability for the raters calculated on 12% of the nonfactual utterances was found to be κ = .98 (95% CI, [.97 to .99]) (p < .001).
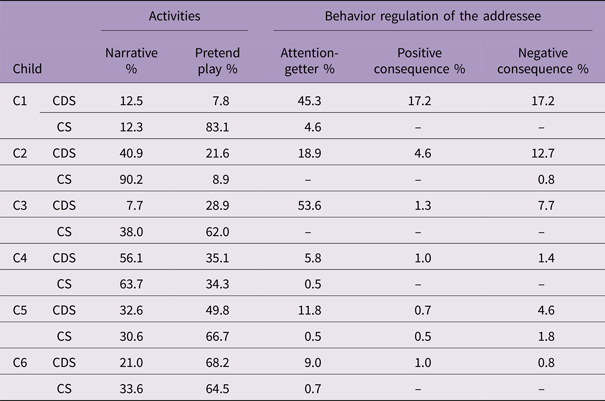
As we explained earlier, the following categories were used to code the nonfactual utterances: narrative, pretend play, attention-getter, positive consequence, and negative consequence. Table 6 shows the distribution of these categories in CS and CDS.
Percent Occurrence of Each Pragmatic Function of the Nonfactual Usage out of All Utterances With Nonfactual Usage, within CDS and CS for Each Child

Note. Some rows do not add up to 100% since some of the nonfactual uses were idioms and not classifiable under any category.
For further analyses, we merged these functions under two main categories: since narrative and pretend play uses occurred mostly during book reading, story-telling, and talking about imaginary events in the play environment, these were classified as ‘activities’. On the other hand, since attention-getter, and positive and negative consequence uses occurred for directing the addressee's behavior, these were classified as ‘behavior regulation of the addressee’.
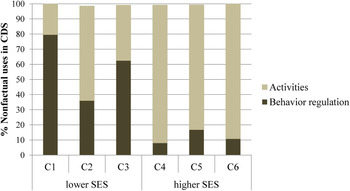
Independent-samples t-tests were conducted to compare high- and low-SES groups, where percentages were arcsine transformed. In terms of overall usage, caregivers in the high-SES group (M = 58.4, SD = 5.4) produced more nonfactuals than the low-SES group (M = 40.7, SD = 8.5) (t(4) = 3.0, p = .039, d = 2.5). Furthermore, we observed a difference between SES groups in terms of the frequency of nonfactual –mIş utterances used for activities and behavior regulation. This significant difference between SES groups is depicted in Figure 6 (t(4) = 3.9, p = .018, d = 3.2), indicating that the caregivers in the low-SES group (M = 59.5, SD = 22.0) tend to use evidential utterances for behavior regulation of the addressee more frequently than the caregivers in the high-SES group (M = 11.9, SD = 4.5).
Distribution of activity and behavior regulation of the addressee uses of nonfactual utterances in CDS according to SES. Note that some columns do not add up to 100% since some of the nonfactual uses were idioms and not classifiable under any category.

Discussion
In a first study of its kind examining Turkish evidentials in naturalistic child–caregiver interactions, we investigated the acquisition of the evidential marker − mIş by very young children. We described the types and frequency of different functions of the marker in a relatively large longitudinally collected corpus sampled from six children between 8 and 36 months of age and their caregivers. Using longitudinal and dense samples of naturalistic interactions is rare in the study of evidentials, and was needed to chart the development of these multi-functional but not very frequently produced linguistic devices (Matsui, Reference Matsui and Matthews2014).
Our major questions were whether individual differences exist in the development of use of the evidential marker, and how child patterns of use compare to patterns in the caregiver input. With respect to the average amount of total speech produced, the children exhibited individual differences. Furthermore, the children were exposed to different frequencies of the evidential marker in the input. There were individual differences with respect to the age of emergence of the evidential marker and its various functions in child speech. Children in the high-SES group produced the − mIş marker correctly (i.e., not for directly experienced events) for the first time almost 4 months earlier on the average than children in the low-SES group. This may be due to differences in the overall amount of input that both groups receive, where the high-SES children were exposed to more caregiver speech than the low-SES children in the observed period of time.
The development of use of the evidential marker followed a similar course across children in terms of its proportion within child speech. The proportion of children's use of evidentials within total speech showed an increasing trend over time, i.e., the percentage of the evidential marker increased within child speech over time, but no variation in overall average or rate of change was observed across children.
An ongoing debate in the literature about the acquisition of the Turkish evidential is whether the hearsay or the inference function emerges earlier in child speech. We found that the order of emergence followed a unique pattern for each child, although perceptual uses marking new information and nonfactual uses were in general the first functions to emerge. Contrary to previous proposals (Aksu-Koç, Reference Aksu-Koç1988; Ozturk & Papafragou, Reference Ozturk and Papafragou2016), Turkish-speaking children do not seem to acquire different evidential functions in a specific order (such as perceptual–hearsay–inference or perceptual–inference–hearsay), though the present results corroborate those of Aksu-Koç (Reference Aksu-Koç1988) that the perceptual and nonfactual uses emerge earlier than the other two categories. While frequency in child-directed speech appears to account for the earlier emergence of the perceptual and nonfactual uses, it does not fully explain the relative time of emergence of inference and hearsay. More precisely, four out of six children whose input had a higher percentage of utterances in the inference than hearsay function also produced higher proportions of inference than hearsay utterances, and the inferential uses appeared earlier than hearsay uses in their speech. That is, the function of higher frequency in the input was observed earlier in these children's output. The two exceptions to this pattern were children C3 and C1. C3 heard a higher percentage of inference than hearsay utterances in the input but used the evidential for inference at a later time than for hearsay. Child C1's input and output both displayed a higher percentage of hearsay than inference utterances, but both functions emerged at the same time in her speech. Thus, input frequency does not seem to be the sole determining factor of order of emergence of different evidential functions.
Several factors that might explain the later acquisition of inference and hearsay come to mind. The first relates to frequency in that the proportion of inference and hearsay utterances in CDS is much lower (ranging between 4.2% and 19.5%) compared to the proportion of perceptual and nonfactual utterances (ranging between 18.5% and 64.3%) in the period investigated, and it may be that input frequency below a threshold does not have a determining effect on time of emergence, a possibility which needs to be explored in future research.
Another explanation for the lack of a direct reflection of input frequency on the order of emergence of different evidential functions, a finding similar to the observations in Korean (Choi, Reference Choi1991) and in Japanese (Shirai et al., Reference Shirai, Shirai, Furuta, Perkins and Howard2000), is related to the conceptual complexity of the particular functions. Choi (Reference Choi1991) suggests that the lack of correlation between the frequency of different evidential forms in Korean input and children's order of acquisition of these forms may indicate that the acquisition of evidential forms is the result of an interaction between children's cognitive development and caregiver input. More precisely, she argues that when children are ready to acquire certain concepts, they pay attention to their encoding in the input language. For Japanese, Shirai et al. (Reference Shirai, Shirai, Furuta, Perkins and Howard2000) have a similar suggestion. Most frequent sentence-final particles in child-directed speech emerged earliest in children's speech, but it was suggested that the order of acquisition of less frequent ones depends on children's cognitive development. Children started to use particles that are about the here and now and were able to gradually express the comparison of real situation to their expectations.
Our results also suggest that, although high frequency in caregiver input may facilitate the acquisition of some functions (e.g., perceptual and nonfactual use), other functions may be cognitively more demanding. For example, for the decoding of the inferential meaning, contextual cues (e.g., the state of an object resultant from a non-witnessed process) may not be sufficiently helpful at a given point in development. Perceptual utterances, on the other hand, may be relatively easier to process than inference and hearsay utterances because perceptual ones map on to states in the here and now and mark them as information worth noting (e.g., çanta var-mış burada ‘here is a bag’, pointing to the bag on the camera screen; C2, CS, 27 months). Furthermore, their comprehension may be easier because in such contexts the caregiver's perspective is congruent with the child's perspective (e.g., both the mother and child see that the father comes home and the mother utters baba gel-miş ‘daddy came’), reducing the effort for source monitoring and understanding the speaker's mind.
For the early emergence of the nonfactual function, we can propose that the nature of the high-frequency input contexts makes a difference. The high frequency of nonfactual utterances in contexts of pretend play (e.g., çorba yap-mış-sın ‘you made soup’; C6, CDS, 26 months) and story-telling is likely to play a facilitative role for acquisition, as these contexts are interactive ones that provide the child with the opportunity to produce the evidential form as well as to grasp its function of marking the nonfactual domain and the narrative genre. We think that this may also explain why high-SES children produced the evidential marker earlier than low-SES children. In the present data, the predominant nonfactual function in low-SES caregiver speech was that of behavior regulation, which, however, is not a function appropriate or meaningful for children's use towards their caregivers. In high-SES households, however, the predominant use of nonfactual evidential utterances was in contexts of play and narratives, which are children's primary domains of talk observed to be shared with adults. The pragmatic (in)appropriateness of a high-frequency function for use by children in speech directed at adults thus appears to be another factor that tempers the effects of frequency. For more informed interpretations, future work needs to examine the discourse contexts that different evidential functions are found in. As for inference and hearsay, children were able to use the evidential form for these functions productively and frequently early on, as opposed to the findings in Cantonese (Lee & Law, Reference Lee, Law and Clark2000). Although this difference between the learners of these languages may be due to linguistic differences between Turkish and Cantonese, we think that this is a result of the fact that the usage of hearsay and inferential forms were almost null in child-directed input in Cantonese, whereas usage of these functions was frequently found in child-directed input in Turkish.
Overall, we observed some consistencies and some differences between the time of acquisition of different evidential functions and their frequency in different children's speech. These findings lead us to reject the idea that the acquisition of evidentials depends purely on the input or on the cognitive complexity of the different functions. We instead suggested a number of other factors that interactively determine the course of acquisition. One that remains to be considered is the interaction between the child's pattern recognition skills and language structure. The Turkish evidential is a single phonological form with multiple functions such that there is not a one-to-one correspondence between form and function. Since one form corresponds to several functions, children with better pattern recognition abilities may excel in decoding the different meanings that the marker conveys.
To conclude, our study has shown that the acquisition of the evidential marker in Turkish, a language where evidentiality is an obligatory grammatical distinction deeply situated in everyday discourse, begins early on, although the full development of the multiplicity of functions it presents in adult usage may be a gradual process. We suggest that children's cognitive skills, conceptual readiness, the nature of the contexts in which the evidential marker is heard, the pragmatic appropriateness and relevance of the function for children's communicative interests, and input frequency jointly determine the order of acquisition of the different evidential functions in children's speech.
Supplementary material
For supplementary for this paper, please visit https://doi.org/10.1017/S0305000917000526.
Appendix
Visualization of raw data
Raw data of each child, showing the distribution of the mean number of utterances in CS for each time-point.

Raw data of each child's caregiver, showing the distribution of the mean number of utterances in CDS for each time-point.

In Figures 9 and 10, the proportions of the evidential –mIş in CS and CDS correspond to the proportions of utterances that contain the marker within total child and child-directed speech.
Raw data of each child's caregiver, showing the distribution of the proportion of the evidential marker − mIş in CDS for each time-point.

Raw data of each child, showing the distribution of the proportion of the evidential marker − mIş in CS for each time-point.