Implications
The present research identified several markers and genomic regions associated with backfat fatty acid (FA) profile and underlined for the first time in Large White heavy pigs the role played by ELOVL fatty acid elongase 6 (ELOVL6) gene region in affecting porcine subcutaneous content of medium- and long-chain FAs. Markers in this genomic region may be of particular interest for performing a more precise genetic selection aimed at improving fat quality traits in pigs.
Introduction
Over the last decades, the interest in the FA composition of meat and other animal products has increased. Fat composition of both subcutaneous and intramuscular fat is an important factor influencing organoleptic and nutritional quality of animal products (Wood et al., 2008). In particular, FA composition strongly affects firmness, tenderness (Wood et al., 2008) and the technological quality of pork processed products. While pork rich in polyunsaturated fatty acids (PUFA) is preferable in healthy human diets (WHO, Reference Wang, Li, Wang, Kong, Qi, Quigg and Li2003), their higher susceptibility to oxidation (Shackelford et al., Reference Shackelford, Miller, Haydon, Lovegren, Lyon and Reagan1990) and the lower melting temperatures (Wood et al., 2008) make PUFA-rich pork cuts unsuitable for seasoning (Bosi et al., Reference Bosi, Cacciavillani, Casini, Lo Fiego, Marchetti and Mattuzzi2000). A higher amount of saturated FAs is instead preferable for pork industry, but on the other side they may result in undesirable effects on human health. The contrasting requests of consumers and pig meat industry raised in the last years the issue of selection schemes aimed at improving fat and meat FA composition. This goal appears to be still far from being reached and therefore a deeper knowledge of genes involved in FA biosynthesis and metabolism is needed (Zhang et al., Reference Zhang, Zhang, Cui, Ma, Chen, Ai, Xie, Li, Xiao, Huang, Ren and Yang2016). Among the instruments available for the modern genomic studies, genome-wide association (GWA) analyses are the most used tool for the identification of the molecular drivers underlying animal and human traits and diseases. Several GWA studies aimed at identifying loci associated with the different FA composition have been performed and different quantitative trait loci (QTL) regions harbouring candidate genes have been indicated for subcutaneous (Corominas et al., Reference Corominas, Marchesi, Puig-Oliveras, Revilla, Estellé, Alves, Folch and Ballester2013; Ros-Freixedes et al., Reference Ros-Freixedes, Gol, Pena, Tor, Ibáñez-Escriche, Dekkers and Estany2016; van Son et al., Reference Wood, Enser, Fisher, Nute, Sheard, Richardson, Hughes and Whittington2017) and intramuscular fat traits (Muñoz et al., Reference Muñoz, Rodríguez, Alves, Folch, Ibañez-Escriche, Silió and Fernández2013; Ros-Freixedes et al., Reference Ros-Freixedes, Gol, Pena, Tor, Ibáñez-Escriche, Dekkers and Estany2016; Zhang et al., Reference Zhang, Zhang, Cui, Ma, Chen, Ai, Xie, Li, Xiao, Huang, Ren and Yang2016). However, the knowledge on the genes involved in fat composition is still incomplete, and the results of the different studies do not always agree on the genomic regions associated with fat composition in pigs.
The main objective of this study was to detect the genetic markers that could be used in breeding programs and the genomic regions associated with the most important backfat FAs in a population of Italian Large White pigs.
Material and methods
Animals and samples
For the present study, 798 purebred Italian Large White pigs from 393 litters were used. These litters were produced by 83 sires and 360 dams and were from the Italian sib test genetic evaluation scheme performed by the Italian National Association of Pig Breeders (Associazione Nazionale Allevatori Suini (ANAS); www.anas.it). Since Italian sib test is based on triplets of siblings (two females and one barrow), the litter size ranged from one to three individuals per litter. The pigs were reared in the same environmental conditions at the genetic test station with a quasi ad libitum feeding level and fed with the same diet. At about 150 kg of live weight the animals were transported to a commercial abattoir and slaughtered following the European Council Regulations reported in Ethics statement section. Backfat thickness was measured with Fat-O-Meat’er (Carometec A/S, Smørum, Denmark) at 8 cm off the midline of the carcass at the level placed between the third and fourth last ribs. Hot carcass weight was measured just before the carcass was placed in the cooler. Samples of blood and backfat were gathered, immediately frozen in liquid nitrogen and stored at −20°C.
Analysis of backfat fatty acid composition
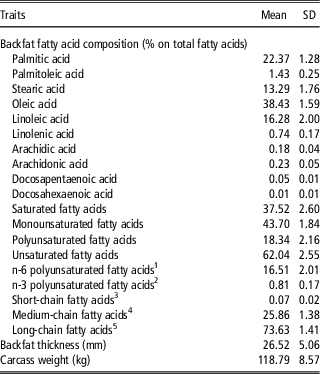
The backfat tissue samples collected after slaughtering were conserved at −20°C until processed. Backfat FA composition was detected by direct transesterification, following the protocol reported by Murrieta et al. (Reference Murrieta, Hess and Rule2003). For each sample, 50 mg of frozen backfat was used for the total lipid extraction and then in each tube 0.5 mg of C19:0 methyl ester in hexane was added as internal standard. Gas chromatography was performed on GC-2010 Plus High-end Gas Chromatograph (Shimadzu Corporation, Tokyo, Japan), using SPTM-2560 Capillary GC Column (Sigma-Aldrich, Merck, Darmstadt, Germany). Backfat FA composition was expressed as the ratio between each FA and the total. The means and the standard deviations of the phenotypic traits measured in the 798 animals used for the GWA are reported in Table 1.
Means and standard deviations of the measured traits in the studied Italian Large White pig population

1 n-6 polyunsaturated fatty acids included linoleic and arachidonic acids.
2 n-3 polyunsaturated fatty acids included linolenic, docosapentaenoic and docosahexaenoic acids.
3 Short-chain fatty acids included fatty acids with a chain length to 10 atoms of carbons.
4 Medium-chain fatty acids included fatty acids with a chain length from 12 to 16 atoms of carbons.
5 Long-chain fatty acids included fatty acids with a chain length from 17 atoms of carbons.
Genotyping data quality control and imputation of missing genotypes
Deoxyribonucleic acid was extracted from the blood samples. The animals were then genotyped using Illumina PorcineSNP60 v2 BeadChip (Illumina Inc., San Diego, CA, USA), which contains 61 565 single-nucleotide polymorphism (SNP) markers distributed across the whole genome. Quality control of the high-density SNP data was carried out on PLINK (Purcell et al., Reference Purcell, Neale, Todd-Brown, Thomas, Ferreira, Bender, Maller, Sklar, de Bakker, Daly and Sham2007): SNPs with more than 10% of missing genotypes, minor allele frequencies below 0.01, or deviations from Hardy–Weinberg equilibrium with P value below 0.001 were filtered out. After the quality control the data set included 49 662 markers. All individuals had a call rate greater than 0.90 and passed the quality control. Markers were then mapped using the pig genome assembly Sus scrofa build 10.2, and the unmapped SNPs were excluded. Markers located on sexual chromosomes were also excluded from the study. Finally, missing genotypes were imputed using Beagle version 3.3.2 (Browning and Browning, Reference Browning and Browning2009). The final number of SNPs included in the GWA was 45 704.
Genome-wide association study
A two-stage method was used in order to obtain residuals taking into account all the effects affecting backfat composition and deposition phenotypes. Before performing the GWA, the phenotypes of the 798 animals were adjusted for carcass weight (as a covariate), slaughter day (27 slaughter batches), sex (castrate or female), animal (using a pedigree with 2301 individuals) and litter effects (393 litters) using a univariate animal model on TM software (Legarra et al., Reference Legarra, Varona and Lopez de Maturana2011). The average inbreeding coefficient of the pigs used for the analysis was 4.37%. After this adjustment, the residuals for FA and backfat thickness phenotypes were obtained and used in the subsequent GWA study.
The associations between the adjusted phenotypes (residuals) and the genotypes were assessed using the Bayes B approach as implemented in the GenSel software (Fernando and Garrick, Reference Fernando and Garrick2008). The model is as follows:
 $${\mib{\bf y}} \,{\equals}\,\mathop{\sum}\limits_{i{\equals}1}^k {{\mib{\bf z}} _{i} {\rm \ralpha}_{i} {\rm \rdelta }_{i} {\plus}\bf e} $$
where y is the vector of the adjusted phenotypes for each trait; z i the vector of the coded genotypes for a SNP at locus i (i=1 to k, where k is the number of SNPs); αi the effect of the allele substitution of the SNP at locus i; δ i a random 0/1 variable representing the absence (0) or the presence (1) of a SNP i in the model for a certain iteration of the Markov chain Monte Carlo procedure; and e the vector of random residuals normally distributed. Alternate homozygous genotypes were coded as −10 and 10, and heterozygotes as 0. The prior probability (π) that the SNPs had no effect (δ i =0) on the adjusted phenotypes was fixed at π=0.985, and consequently the prior probability of the markers having an effect on the adjusted phenotypes (δ i =1) was 1−π=0.015. Thus, the model fitted ~685 SNPs in each iteration. A total of 500 000 iterations were run, with a burn-in of 100 000.
Statistical relevance of markers and genomic regions was evaluated based on different statistics. First, Bayes factor (BF) was calculated for each SNP i (BF i ) to evaluate the statistical relevance of the association between each SNP and the adjusted phenotypes. The BF was calculated as follows:
 $${\rm BF}_{i} \,{\equals}\,{{{{\widehat{{\rm P_{i} }}} \over {1{\minus}\widehat{{\rm P_{i} }}}}} \over {{{1{\minus}\rm \rpi } \over \rm \rpi }}}$$
where
 $\widehat{{\rm P_{i} }}$
is the posterior probability of a marker i of being included in the model at a given iteration of the Markov chain Monte Carlo procedure. Generally, for BF above 3.2 the marker association with the trait is considered substantial, strong for BF between 10 and 100, and decisive for BF>100 (Kass and Raftery, Reference Kass and Raftery1995).
Additional statistics were obtained for consecutive non-overlapping 1-Mb windows of markers adjacent in Sus scrofa assembly build 10.2. This approach permitted taking into consideration the combined effects of the closely located SNPs. For each window we estimated the predicted collective genetic variance explained by the SNPs included in the windows and their average posterior probability of inclusion
 $(\hat{\rm P})$
in the model. Windows explaining at least 0.5% of the genetic variance were considered relevant, using the same cut-off threshold reported in Reyer et al. (Reference Reyer, Hawken, Murani, Ponsuksili and Wimmers2015). Contiguous 1-Mb windows that explained at least 0.5% of the total genetic variance were merged and considered together. Additionally, the upper limit of the posterior type I error rate for each window was calculated as
 ${\rm 1}{\minus}\hat{\rm P}$
(Fernando et al., Reference Fernando, Toosi, Wolc, Garrick and Dekkers2017).
Within each window, when possible, a ‘top SNP’ was identified as the one with the strongest association with the trait in terms of BF.
Functional characterisation of mapped genes mapped in candidate regions
Candidate genes located in the regions explaining at least 0.5% of the genetic variance for a given trait were identified through Ensembl (EMBL-EBI) using the BioMart tool (http://www.ensembl.org/biomart/). Subsequently, their functional gene annotation was analysed with Enrichr (Kuleshov et al., Reference Kuleshov, Jones, Rouillard, Fernandez, Duan, Wang, Koplev, Jenkins, Jagodnik, Lachmann, McDermott, Monteiro, Gundersen and Ma’ayan2016) (http://amp.pharm.mssm.edu/Enrichr/). In particular, the Reactome Pathway Database (Fabregat et al., Reference Fabregat, Sidiropoulos, Garapati, Gillespie, Hausmann, Haw, Jassal, Jupe, Korninger, McKay, Matthews, May, Milacic, Rothfels, Shamovsky, Webber, Weiser, Williams, Wu, Stein, Hermjakob and D’Eustachio2016) and the KEGG Pathway Database (Kanehisa et al., Reference Kanehisa, Sato, Kawashima, Furumichi and Tanabe2016) were considered for unravelling the pathways underlying candidate regions. One of the regions associated with backfat FA composition included microRNAs. To identify whether adipogenesis and FA biosynthesis genes were amongst the microRNAs predicted targets, orthologous human microRNAs (hsa-miRNAs) were used on PicTar (http://pictar.mdc-berlin.de/) applying the algorithm for predictions in vertebrates.
The candidate regions were also compared with the information about the known QTLs reported on QTLdb (Hu et al., Reference Hu, Park and Reecy2016) (http://www.animalgenome.org/cgi-bin/QTLdb/index).
Estimation of genotypic effects
The difference between genotypes for the most relevant markers in the GWA was assessed using a model where the phenotypes were analysed including, in addition to the genotype, the slaughter day, sex, animal and litter as systematic effects and the carcass weight as a covariate. The model was solved using the Rabbit program (Blasco, Reference Blasco2012).
Results and discussion
Genome-wide association studies have become a commonly used analysis tool in genomics, allowing the identification of new regions and markers on a wider level compared with single marker association studies. With the spreading use of GWA, some issues regarding the most appropriate statistical approach to be used were raised. In particular, there is still debate on the use of frequentist or Bayesian approaches and on the application of univariate or multivariate models for the most accurate identification of associations between markers and traits. Even though multivariate models were proven to have increased power in presence of correlated traits – such as FA composition in different tissues – and to alleviate the multiple testing burden (Galesloot et al., Reference Galesloot, van Steen, Kiemeney, Janss and Vermeulen2014), results obtained from multivariate approaches may be hard to interpret. In the present research, we applied Bayesian statistics considering that Bayesian models permit to overcome some of the limits highlighted by the application of linear models to GWA studies (Guo et al., Reference Guo, Su, Christensen, Janss and Lund2016). We opted for a two-stage Bayesian approach, constituted by an initial regression of the phenotypes – taking into account kinships and the systematic effects affecting backfat composition and deposition – and a subsequent GWA study performed between the residuals and the markers, in line with the method proposed by Aulchenko et al. (Reference Aulchenko, De Koning and Haley2007). These authors showed that, although this method leads to a loss of power, particularly for large sibling sizes, it is instead more robust against false positives. However, considering the pedigree structure of the pigs used for the analysis, with three siblings at most, little power reduction is expected. Despite the correlated nature of the analysed traits, this two-stage Bayesian approach was performed using univariate models since multivariate models would have removed more genetic variance, thus increasing the loss of power.
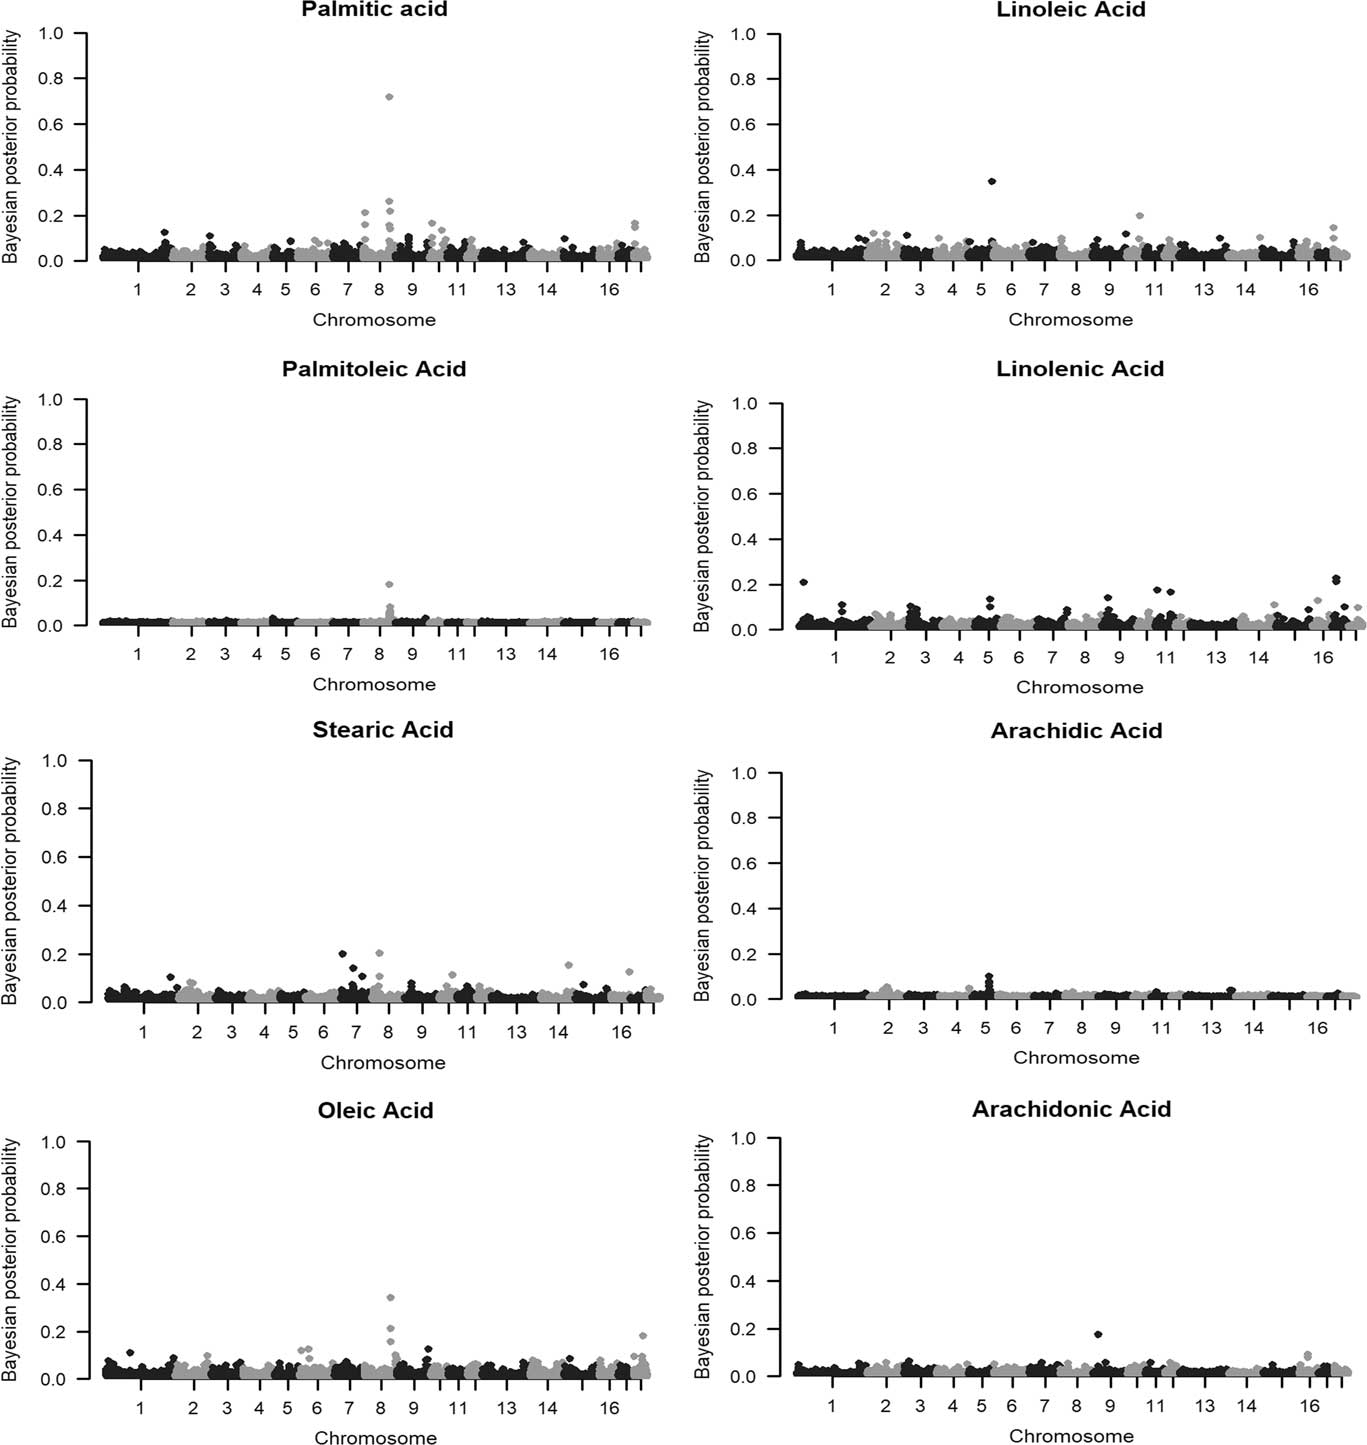
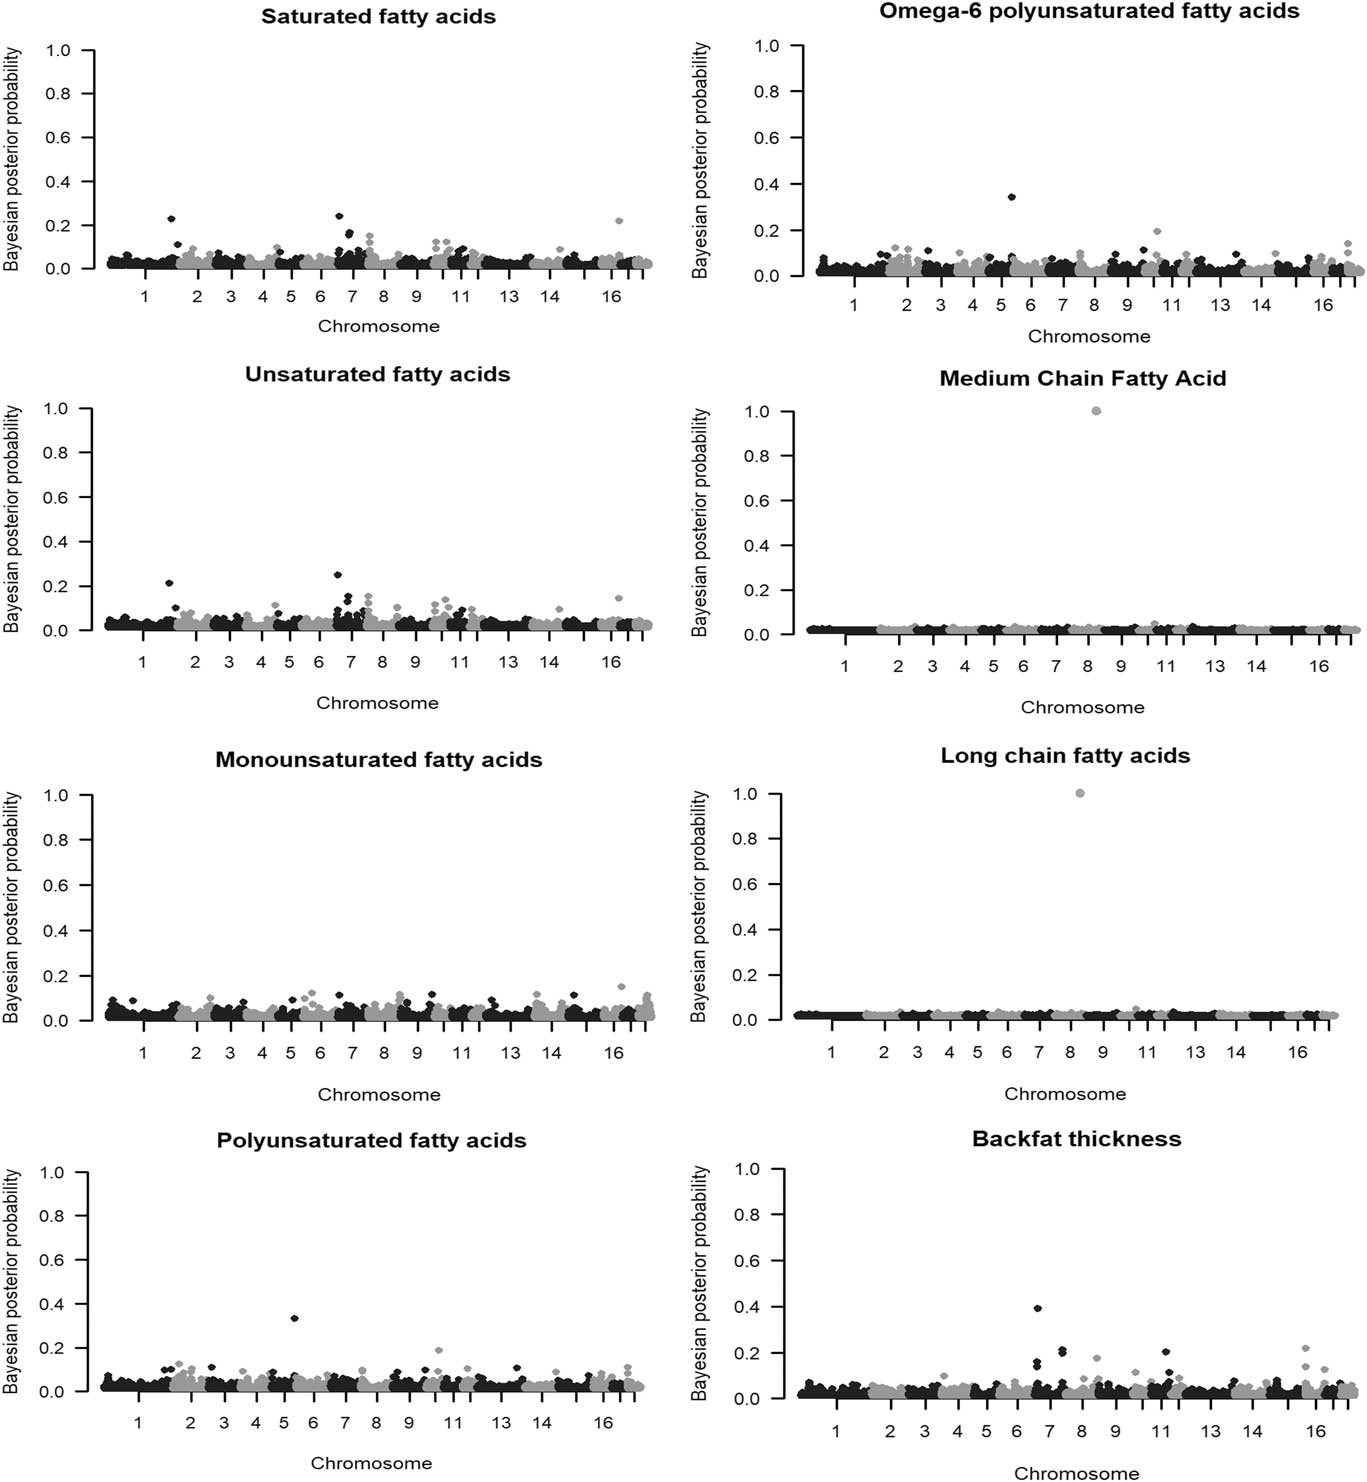
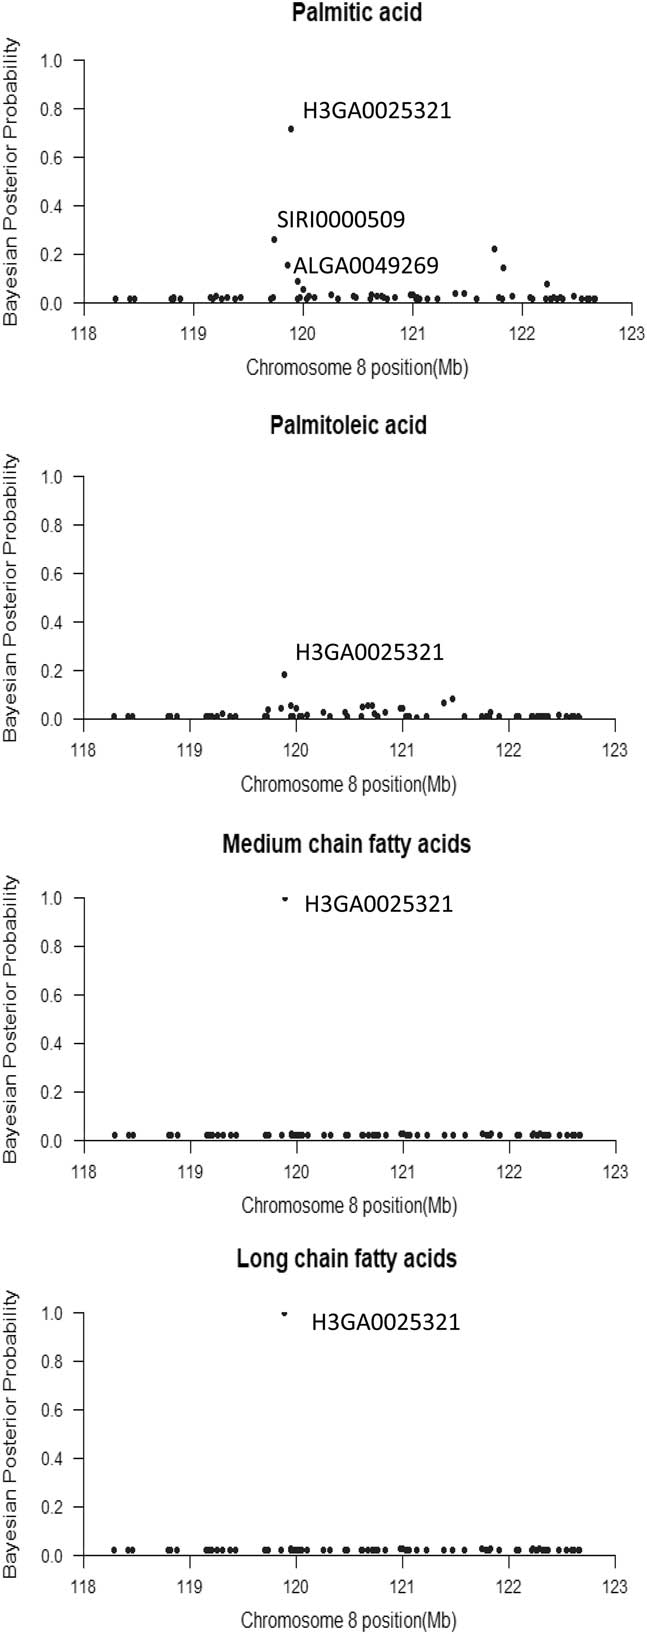
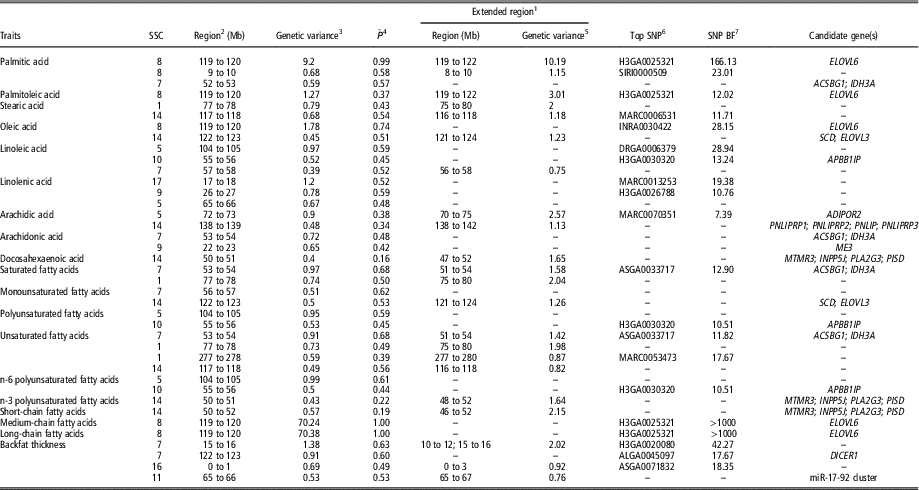
The proportions of variance explained by the analysed markers for the adjusted phenotypes of the traits and returned by GenSel software are reported in Supplementary Table S1. These proportions vary from 0.17 for docosahexaenoic acid to 0.60 for palmitic acid and represent the amount of variance of the adjusted phenotypes that can be explained by the markers. On the whole, 34 genomic regions were identified and compared with QTLs on databases. Among them, 15 genomic windows were consistent with QTLs found in previous studies and six were new, showing no referenced QTL on databases. The remaining 13 were located in regions where the reported QTLs were linked to FAs and traits other than the ones considered in the present study (Supplementary Table S2). The list of the genomic regions associated with each trait and the relative top SNP are reported in Table 2. For the discussion of the found regions were also taken into consideration the proportions of the trait genetic variance explained by the markers in the windows (Table 2), the percentage of the total variance of the traits accounted by the markers in the windows and the upper limit of posterior type I error rate estimates (Supplementary Table S3). Furthermore, all the markers with BF>3.2 are reported in Supplementary Table S4 and their posterior probabilities of inclusion in the models are plotted in Figure 1 for individual FAs, in Figure 2 for FA classes and in Figure 3 for the region included between 119 and 122 Mb on Sus scrofa chromosome (SSC) 8.
Manhattan plots of the posterior probability of inclusion of the markers in the model for individual fatty acids. Docosapentaenoic and docosahexaenoic acids were not reported because none of the markers showed consistent associations with these fatty acids.

Manhattan plots of the posterior probability of inclusion of the markers in the model for fatty acid classes and backfat thickness. Short-chain fatty acids and n-3 polyunsaturated fatty acids were not reported because none of the markers showed consistent associations with these traits.

Manhattan plots of the posterior probability of inclusion in the model of the markers on Sus scrofa chromosome 8 at 118 to 123 Mb region. The strongest associations were found for H3GA0025321 with medium- and long-chain fatty acids.

List of the windows and genomic regions explaining over 0.5% of the genetic variance associated with pigs backfat fatty acid composition and backfat thickness

SSC=Sus scrofa chromosome; BF=Bayes factor.
Docosapentaenoic acid (C22:5n-3) is not reported in the table because no marker window explained at least 0.5% of the genetic variance. For some windows we have not reported a top SNP because, even if these regions explained more than 0.5% of the genetic variance, no single marker showed a BF greater than 3.2.
1 Extended region comprising contiguous windows explaining at least 0.5% of the genetic variance.
2 Windows positions referred to Sus scrofa assembly Build 10.2, expressed in Mb.
3 Proportion of the genetic variance that is explained by the markers in the window.
4
Posterior probability of inclusion in the model for the markers in the window. The average posterior probability of inclusion in the model for windows explaining less than 0.5% of genetic variance was 0.09. The upper limit of the posterior type I error rate is
${\rm 1}{\minus}\hat{\rm P}$
.
5 The proportion of genetic variance explained by the markers placed in the neighbouring windows of the extended regions.
6 SNP with highest BF in the 1 Mb window.
7 SNP Bayes factor.
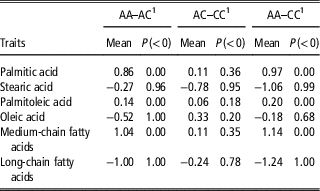
The region included between 119 and 122 Mb on SSC8 showed the lowest posterior type I error rate estimates (0.00 for medium-chain fatty acids (MCFA) and long-chain fatty acids (LCFA); 0.01 for palmitic acid; Supplementary Table S3) and explained a great proportion of the genetic variance associated to MCFA and LCFA, about the 70% of the genetic variance calculated on the adjusted phenotypes (Table 2). Moreover, this region also explained a smaller part of the genetic variance associated with palmitic, palmitoleic and oleic acids (10%, 3% and 1.78%, respectively; Table 2). The proportion of genetic variance explained by this region for the adjusted contents of MCFA and LCFA may seem surprising at first, but similar results were already reported in literature for other loci thought to have a major effect on backfat FA composition (van Son et al., Reference Wood, Enser, Fisher, Nute, Sheard, Richardson, Hughes and Whittington2017). Three of the markers most associated with backfat FA composition were located in this region: H3GA0025321, SIRI0000509 and INRA0030422. Among them, the SNP that showed the highest BF was H3GA0025321, which was strongly associated with MCFA (BF>1000), with LCFA (BF>1000) and also with palmitic acid (BF>166) (Table 2). The same marker resulted to have a relevant effect also on palmitoleic and oleic acids (BF=12.02 and BF=10.05, respectively). Thus, the C allele of H3GA0025321 was strongly related to higher amounts of stearic, oleic and LCFA, causing at the same time a consistent decrease in MCFA and C16 acids (palmitic and palmitoleic) (Table 3). The H3GA0025321 marker has already been identified in other GWA (Corominas et al., Reference Corominas, Marchesi, Puig-Oliveras, Revilla, Estellé, Alves, Folch and Ballester2013; Zhang et al., Reference Zhang, Zhang, Cui, Ma, Chen, Ai, Xie, Li, Xiao, Huang, Ren and Yang2016). Corominas et al. (Reference Corominas, Marchesi, Puig-Oliveras, Revilla, Estellé, Alves, Folch and Ballester2013) found this polymorphism strongly associated with the palmitic and palmitoleic acid content in the intramuscular fat of Iberian×Landrace pigs’ Longissimus dorsi muscles. Furthermore, in agreement with Corominas et al. (Reference Corominas, Marchesi, Puig-Oliveras, Revilla, Estellé, Alves, Folch and Ballester2013), we have found that, together with H3GA0025321, SIRI0000509 and INRA0030422 markers were also associated with palmitic acid (Figure 3). These three markers were found to be in linkage disequilibrium with mutations located in the promoter sequence of the nearby gene ELOVL6 (Corominas et al., Reference Corominas, Marchesi, Puig-Oliveras, Revilla, Estellé, Alves, Folch and Ballester2013). This gene codes for an elongase, which catalyses the first and rate-limiting reaction of the four steps that constitute the LCFA elongation cycle. In a recent investigation, Corominas et al. (Reference Corominas, Ramayo-Caldas, Puig-Oliveras, Pérez-Montarelo, Noguera, Folch and Ballester2015) suggested that the causal mutation responsible for the strong association found for SSC8 119 to 120 Mb region could be ELOVL6:c.-394 G>A, a SNP located in ELOVL6 gene promoter region. In addition, the three identified markers (H3GA0025321, SIRI0000509 and INRA0030422) and ELOVL6 gene mapped in the same SSC8 region where QTLs associated with palmitoleic (Muñoz et al., Reference Muñoz, Rodríguez, Alves, Folch, Ibañez-Escriche, Silió and Fernández2013), palmitic and oleic acid contents (Revilla et al., Reference Revilla, Ramayo-Caldas, Castelló, Corominas, Puig-Oliveras, Ibáñez-Escriche, Muñoz, Ballester and Folch2014) have already been identified. These findings were recently supported by the results of van Son et al. (Reference Wood, Enser, Fisher, Nute, Sheard, Richardson, Hughes and Whittington2017) in Landrace purebred pigs, where the region on SSC8 between 120.5 and 121.4 Mb was associated with backfat content of palmitoleic acid.
Mean of the estimated marginal posterior distribution of differences between genotypes AA, AC and CC of the pig chromosome 8 marker H3GA0025321 and probability of the difference being lower than zero (P(<0)) for fatty acids showing association in the genome-wide association study

1 Estimated difference between the genotypes AA, AC and CC of H3GA0025321.
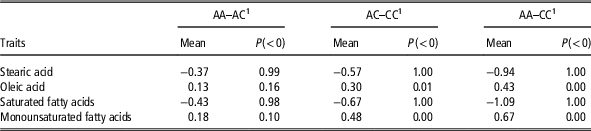
The other candidate regions located on SSC1, SSC5, SSC7, SSC8, SSC9, SSC10, SSC11, SSC14, SSC16, SSC17 and SSC18 presented less strong evidence of association and higher upper limits of posterior type I error rate estimates, ranging from 0.81 to 0.32 (Supplementary Table S3). However, all of them explained at least 0.5% of the traits genetic variance and harboured markers with BF greater than 3.2. These regions explained limited amounts of genetic variance (between 1.5% and 0.5%; Table 2) but could be anyway worth of interest as they harbour genes that play a relevant role in the metabolic pathways involved in FA synthesis and deposition. Among them, of particular concern is the region on SSC14 at 116 to 124 Mb, which was found to be associated with stearic acid (1.18% of its genetic variance), oleic acid (1.23%), monounsaturated fatty acids (MUFA) (1.26%) and unsaturated FAs content (0.82%; Table 2). MARC0006531 was the marker showing the highest BF for this SSC14 region, and individuals displaying the AA genotype for this locus resulted to be more prone towards backfat MUFA and oleic acid deposition (Table 4). These results are in line with previous studies (Uemoto et al., Reference Uemoto, Nakano, Kikuchi, Sato, Ishida, Shibata, Kadowaki, Kobayashi and Suzuki2011; Yang et al., Reference Yang, Zhang, Zhang, Fan, Xie, Ai, Ma, Xiao, Huang and Ren2013; Ros-Freixedes et al., Reference Ros-Freixedes, Gol, Pena, Tor, Ibáñez-Escriche, Dekkers and Estany2016) and show that this region may also be of interest in Italian Large White pigs. Two candidate genes are currently annotated in this region: stearoyl-CoA desaturase delta 9 (SCD) and ELOVL fatty acid elongase 3 (ELOVL3).
Mean of the estimated marginal posterior distribution of differences between genotypes AA, AC and CC of the pig chromosome 14 marker MARC0006531 and probability of the difference being lower than zero (P(<0)) for fatty acids showing association in the genome-wide association study

1 Estimated difference between the genotypes AA, AC and CC of MARC0006531.
The evidences obtained for the windows on SSC8 and SSC14 suggest that the identification of mutations in these regions may be of particular interest for the definition of a panel of markers useful for selection schemes aimed at improving FA composition in pork products. Indeed, SNPs located in these genomic regions were found both in this study and in literature to affect the intramuscular and backfat content of MUFA, a FA category that may exert positive effects on human health. Results regarding the effects of increased ingestion of MUFA in human diets are still contradictory, but several studies observed benefits of MUFA on cardiovascular risk factors, extensively reviewed in Schwingshackl and Hoffmann (Reference Schwingshackl and Hoffmann2012). Thus, replacing in seasoned products part of the saturated FAs with MUFA could be effective in increasing pork nutritional quality without eliciting the detrimental effects of PUFA-enriched pork cuts on technological and sensorial quality.
Furthermore, comparing the results reported in Table 2, it is possible to note that the genomic regions associated to short-chain FAs, arachidic, arachidonic, PUFA and n-6 PUFA (PUFAn-6) were other than those linked to palmitic, palmitoleic, stearic, oleic and MUFA. In particular, this difference was also reflected in the results obtained from the functional characterisation of the associated regions (Supplementary Table S5). On the one hand, the regions associated to the backfat contents of MUFA, unsaturated FAs, MCFA, LCFA, palmitic, palmitoleic and oleic acids clustered together and resulted to harbour mainly genes related to FA chain elongation, desaturation and de novo biosynthesis. The genes mapped inside these regions were involved in the ‘regulation of cholesterol biosynthesis by SREBP’ (SEC24 Homolog B, COPII Coat Complex Component (SEC24B), insulin-induced gene 1 (INSIG1) and ELOVL6 gene), the ‘synthesis of very long-chain fatty acyl-CoAs’ (ELOVL6 and very long-chain acyl-CoA synthetase (ACSBG1)), the ‘metabolism of lipids and lipoproteins’ (SEC24B, ELOVL6, phospholipase A2, group XIIA (PLA2G12A) and ethanolamine-phosphate phospho-lyase (ETNPPL)), the ‘biosynthesis of unsaturated FAs’ (SCD and ELOVL6 genes) and ‘FA elongation’ (ELOVL3 and ELOVL6) (Supplementary Table S5).
On the other hand, the genomic regions associated with arachidic, arachidonic acid, PUFA, PUFAn-6 and short-chain FAs showed to harbour mainly genes involved in dietary lipids digestion, mobilisation and transport, in pancreatic secretion, in carbohydrates metabolism and in the pathway regulating gastrin secretion (Table 2 and Supplementary Table S5). Among these genes, the one corresponding to the amyloid beta precursor protein-binding family B member 1 interacting protein (APBB1IP) is located on SSC10 while those for phospholipase A2 group III (PLA2G3), pancreatic lipase (PNLIP), pancreatic lipase-related protein 1 (PNLIPRP1) and pancreatic lipase-related protein 2 (PNLIPRP2) are lying on SSC14. The gene APBB1IP plays an essential role in mammalian energy metabolism, as inferred from results with APBB1IP knockout mice, which showed severe conditions of obesity, glucose intolerance, insulin resistance, liver steatosis and adipose tissue hypertrophy (Yeung et al., Reference Yeung, Ramírez, Mateos-Gomez, Pinzaru, Ceccarini, Kabir, Fernández-Hernando and Sfeir2013). The region from 138 to 142 Mb on SSC14 associated to arachidic acid harbours the genes encoding for pancreatic lipases (PNLIP, PNLIPRP1 and PNLIPRP2). These pancreatic-secreted lipases hydrolyse triglycerides and make the dietary fat digestion efficient (Berton et al., Reference Berton, Sebban-Kreuzer, Rouvellac, Lopez and Crenon2009). Their genes have been studied in medicine for their effect on obesity and diabetes, and a mutation in PNLIP gene sequence was related to human congenital pancreatic lipase deficiency and fat malabsorption (Behar et al., Reference Behar, Basel-Vanagaite, Glaser, Kaplan, Tzur, Magal, Eidlitz-Markus, Haimi-Cohen, Sarig, Bormans, Shohat and Zeharia2014). One possible hypothesis that can be put forth from the results of the present study is that mutations in the coding sequence of pancreatic lipase genes may be responsible for different lipids absorption in pigs, influencing also backfat FA synthesis and deposition. This hypothesis needs further studies to be confirmed.
Finally, in the present study four regions associated exclusively with backfat thickness trait and located from 10 to 16 Mb and from 122 to 123 Mb on SSC7, from 65 to 67 Mb on SSC11 and from 0 to 3 Mb on SSC16 were detected (Table 2). These associations were in agreement with literature (Supplementary Table S2) and it is worth noting that these windows of markers mainly harbour genes affecting microRNAs biogenesis (adjusted P value=2.38E−02, with the gene Dicer 1, ribonuclease type III (DICER1)) and haemostasis (adjusted P value=1.49E−02) (Supplementary Table S5). Among the genomic windows associated to backfat thickness, the chromosomal region from 64 to 67 Mb on SSC11 harbours exclusively the sequences of microRNAs taking part in the miR-17-92 cluster. This cluster is composed of ssc-mir-20a, ssc-mir-19a, ssc-mir-18a, ssc-mir-19b-1, ssc-mir-17 and ssc-mir-92a-1, which are known for promoting adipocyte differentiation in mouse preadipocytes by targeting Rb2/p130 gene (Wang et al., Reference van Son, Enger, Grove, Ros-Freixedes, Kent, Lien and Grindflek2008) and have predicted binding sites on several genes related to adipocyte differentiation and lipids metabolism (Supplementary Table S6). In a recent study carried out on porcine backfat tissue transcriptome, we found that microRNAs of the miR-17-92 cluster are expressed in pig adipose tissue (Davoli et al., Reference Davoli, Gaffo, Zappaterra, Bortoluzzi and Zambonelli2018), suggesting that this cluster may have a role also in swine adipocytes differentiation. However, further studies are needed to support the hypothesis that markers included in these regions affect backfat deposition.
To our knowledge, this is the first study performed in Large White pigs identifying markers and genomic regions associated with backfat FA composition. The results of the present research strengthen the hypothesis that both ELOVL6 and SCD genes play an important role in determining FA composition in pigs, but emphasise also the need to get new insight into the genes involved in feed digestion, as they too may affect backfat FA composition through changes in lipids absorption efficiency. The evidences obtained for the windows on SSC8 and SSC14, where ELOVL6 and SCD are located, respectively, suggest that the identification of causal mutations in these regions may be of particular interest for the definition of a panel of markers useful for selection schemes aimed at improving FA composition in pork products.
Acknowledgements
The authors thank Dr Luca Buttazzoni and Dr Maurizio Gallo from CREA and ANAS for providing the porcine backfat and Semimembranosus tissue samples and the information about the studied individuals. Our grateful acknowledgements also go to Dr. Andrea Serra and Prof. Marcello Mele of Pisa University for performing the FA analysis of the full sample set. This work was supported by ‘Progetto AGER – Hepiget’ (grant no. 2011-0279) and by PRIN 2015.
Declaration of interest
The authors declare that they have no competing interests.
Ethics statement
Sampling occurred with the permission of the Italian National Association of Pig Breeders (ANAS). Animal care and slaughter of the animals used in this study were performed in compliance with the European rules (Council Regulation (EC) No. 1/2005 and Council Regulation (EC) No. 1099/2009) on the protection of animals during transport and related operations and at the time of killing. All slaughter procedures were monitored by the veterinary team appointed by the Italian Ministry of Health.
Software and data repository resources
The data analysed in the current study and the produced outputs are available by request from the corresponding author.
Supplementary material
To view supplementary material for this article, please visit https://doi.org/10.1017/S1751731118000484