Implications
Calving is a challenge for the cow and involves extra work for the farmer. To reduce the frequency of calving, cows can be impregnated later and milked for a longer period of time. When these ‘extended lactations’ are applied for all cows, total milk production and the net partial cash flow (NPCF) decrease. If extended lactations are only applied for young cows, however, this hardly affects the NPCF. Moreover, if the milk production of cows is very persistent, extended lactations could increase the NPCF with a similar or smaller carbon footprint of milk production.
Introduction
The transition period around calving is the most critical period in the lactation cycle of dairy cows (Drackley, Reference Drackley1999). It is characterised by a large number of changes in physiology and management routine, and by a high incidence of diseases and culling (Ingvartsen, Reference Ingvartsen2006; Pinedo et al., Reference Pinedo, Daniels, Shumaker and De Vries2014). To reduce the impact of the transition period per unit time, it has been proposed to extend lactation length (Knight, Reference Knight2001; Dobson et al., Reference Dobson, Smith, Royal, Knight and Sheldon2007). With extended lactations, cows have fewer transition periods per unit time, farmers have less labour related with transition management and the number of surplus calves is reduced (Knight, Reference Knight2001).
Milk yield per cow per year and milk revenues were reduced in some studies when lactations were extended (Holmann et al., Reference Holmann, Shumway, Blake, Schwart and Sudweeks1984; Strandberg and Oltenacu, Reference Strandberg and Oltenacu1989; Inchaisri et al., Reference Inchaisri, Jorritsma, Vos, van der Weijden and Hogeveen2011), although other studies found no or opposite effects (Arbel et al., Reference Arbel, Bigun, Ezra, Sturman and Hojman2001; Lehmann et al., Reference Lehmann, Fadel, Mogensen, Kristensen, Gaillard and Kebreab2016). Production level and lactation persistency had a great impact on the simulated economic consequences when first insemination was delayed and calving intervals increased from 13 to 14 months (Inchaisri et al., Reference Inchaisri, Jorritsma, Vos, van der Weijden and Hogeveen2011). Extending lactations seemed more successful for heifers than older cows due to their greater lactation persistency (Arbel et al., Reference Arbel, Bigun, Ezra, Sturman and Hojman2001; Inchaisri et al., Reference Inchaisri, Jorritsma, Vos, van der Weijden and Hogeveen2011), and in herds that were specifically managed for extended lactations (i.e. deliberate delayed insemination) (Lehmann et al., Reference Lehmann, Fadel, Mogensen, Kristensen, Gaillard and Kebreab2016). Cows in these herds may have production characteristics that better support an extended lactation length; similar milk yields per day of calving interval were realised for cows with calving intervals of 13 and exceeding 19 months (Lehmann et al., Reference Lehmann, Fadel, Mogensen, Kristensen, Gaillard and Kebreab2016).
Extending lactations of dairy cows could have economic consequences besides changes in milk revenues. A reduced frequency of transition periods could reduce labour and the veterinary costs related to diseases in the transition period (Liang et al., Reference Liang, Arnold, Stowe, Harmon and Bewley2017), and involuntary culling (Pinedo et al., Reference Pinedo, Daniels, Shumaker and De Vries2014). Moreover, later first insemination, when the cow has a lower milk production and a better energy balance, could increase the conception rate and thus lower the costs of artificial insemination (AI) (Butler, Reference Butler2003; Inchaisri et al., Reference Inchaisri, Hogeveen, Vos, van der Weijden and Jorritsma2010a). Fewer cows in peak production per unit time might also reduce the kg concentrates fed per kilogram milk produced, and lower the costs per unit of feed energy (Dekkers et al., Reference Dekkers, Ten Hag and Weersink1998).
In addition, extending lactations could positively or negatively affect the environmental impact of milk production. Less frequent transition periods could reduce the number of cows culled per unit time (Lehmann, Reference Lehmann2016). A lower culling rate would increase the lifespan of the cow, which dilutes the greenhouse gas (GHG) emissions of youngstock rearing and reduces the GHG emissions per unit milk (Van Middelaar et al., Reference Van Middelaar, Berentsen, Dijkstra, Van Arendonk and De Boer2014; Kok et al., Reference Kok, Van Middelaar, Mostert, Van Knegsel, Kemp, De Boer and Hogeveen2017). Moreover, a possible reduction in disease incidence, or a reduction in kilogram concentrates per kilogram milk could reduce GHG emissions per unit milk (Van Middelaar et al., Reference Van Middelaar, Berentsen, Dijkstra, Van Arendonk and De Boer2014). A possible reduction in milk yield per day, however, could increase GHG emissions per unit milk (Van Middelaar et al., Reference Van Middelaar, Berentsen, Dijkstra, Van Arendonk and De Boer2014). Moreover, a reduction in the number of calves born and cows culled would reduce the ratio between produced meat and milk (Lehmann, Reference Lehmann2016), which could increase GHG emissions from the alternative production of meat (Cederberg and Stadig, Reference Cederberg and Stadig2003).
The first aim of this study is to assess the impact of 2 and 4 months extended lactations on overall milk yield and net partial cash flows (NPCF) at herd level, and on GHG emissions per unit milk in a stochastic simulation model. Simulations of milk production were based on milk production data from commercial dairy farms. The second aim of this study is to gain insight in the importance of production level and lactation persistency for the impact of extended lactations on overall milk yield, NPCF and GHG emissions. For the second aim, a sensitivity analysis was performed, in which the peak yield and lactation persistency of the lactation curves of cows with baseline lactation lengths (BLs) were step-wise increased to mimic lactation curves of cows managed for extended lactations. Possible impacts of extended lactations on culling probability, as well as costs associated with AI and calving management were included in the analysis.
Material and methods
This study used an adapted version of the model developed by Kok et al. (Reference Kok, Van Middelaar, Mostert, Van Knegsel, Kemp, De Boer and Hogeveen2017). The model was designed to stochastically simulate Dutch dairy herds of 100 cows with different dry period lengths, and subsequently compute NPCF per herd and GHG emissions per unit of fat- and protein-corrected milk (FPCM) produced. The model simulates individual lactations and calving intervals, with stochastic culling, comprising culling for fertility reasons and culling for other reasons (i.e. general culling). Net partial cash flows per herd per year included revenues from milk, surplus calves and culled cows, and costs for feed and rearing of youngstock. A life cycle approach from cradle to farm gate was used to compute GHG emissions per t FPCM. In the calculation of GHG emissions of milk production, system expansion was used to account for the production of meat from surplus calves and culled cows (Van Middelaar et al., Reference Van Middelaar, Berentsen, Dijkstra, Van Arendonk and De Boer2014; Kok et al., Reference Kok, Van Middelaar, Mostert, Van Knegsel, Kemp, De Boer and Hogeveen2017; Mostert et al., Reference Mostert, van Middelaar, Bokkers and de Boer2018). The production of meat was assumed to substitute the production of other meat on the basis of kilogram edible product, which avoided GHG emissions related to meat production elsewhere (Kok et al., Reference Kok, Van Middelaar, Mostert, Van Knegsel, Kemp, De Boer and Hogeveen2017).
Five different strategies for lactation length were evaluated in the herd simulation model. Cows in the reference scenario each had a BL sampled from the same dataset as the milk production data (Table 1; Kok et al., Reference Kok, Van Middelaar, Mostert, Van Knegsel, Kemp, De Boer and Hogeveen2017). In the extension strategies, lactations were extended by either 2 months or 4 months for all cows (All+2 and All+4), or for heifers only (H+2 and H+4). Baseline lactation lengths and lactation curves were based on 59 045 milk records from 5767 lactations of predominantly Holstein-Friesian and some mixed breed cows with a conventional dry period length (≥42 days) from 16 Dutch dairy farms (Kok et al., Reference Kok, Van Middelaar, Mostert, Van Knegsel, Kemp, De Boer and Hogeveen2017). Calving intervals in the extended lactation strategies were subsequently generated by shifting the baseline calving interval data by 60 or 120 days (i.e. 2 or 4 months), to represent a deliberate delay of first AI. The shape of the lactation curves was deliberately derived from production data of cows with baseline lactations, to assess the impact of extending lactations with current production characteristics (base curves). In the sensitivity analysis, the shape of the lactation curves was derived from 8020 milk production records from 480 lactations of Holstein cows of two Danish dairy herds that were managed for extended lactations (managed curves) (Lehmann et al., Reference Lehmann, Fadel, Mogensen, Kristensen, Gaillard and Kebreab2016). This contrast was included as a proof of concept, to evaluate how much better lactation curves of cows that were specifically managed for extended lactations performed in comparison with lactation curves of cows with baseline lactations. The model was run for 100 herds of 100 cows per lactation length strategy. At the start of year 1, cows were at a variable moment in lactation; the new lactation length strategy was applied from the moment a new lactation started. Results are presented for the third year that extended lactations are applied, to show the stabilised long-term consequences of extending lactations.
Mean, median, and 5 and 95 percentiles of calving intervals (CI) in days to simulate baseline lactation lengths and lactations extended by 2 and 4 months

Some further adjustments were made to the model of Kok et al. (Reference Kok, Van Middelaar, Mostert, Van Knegsel, Kemp, De Boer and Hogeveen2017) to enable the evaluation of extended lactations. The adjustments are described in the next sections. First, the shape of the lactation curve was adjusted to account for the (delayed) effect of gestation, and this new lactation curve was parameterised for every parity class (1, 2, >2). Second, model parameters regarding growth of parity 1 and parity 2 cows were adjusted for the increase in lactation length. Third, culling probability per lactation was adjusted for the increase in lactation length. Fourth, costs for AI and costs for calving management were added to the assessment of NPCF, to evaluate possible reductions associated with extended lactations. Ration, revenues and emission factors remained unchanged from the previous study (Kok et al., Reference Kok, Van Middelaar, Mostert, Van Knegsel, Kemp, De Boer and Hogeveen2017).
Lactation curves
The shape of the lactation curve was determined by the Wilmink lactation curve model (Wilmink, Reference Wilmink1987), extended with a linear negative effect of gestation on milk production, that starts with a fixed delay after conception (Strandberg and Lundberg, Reference Strandberg and Lundberg1991). Separating the gestation-related effect on lactation persistency may be especially relevant when lactations are extended, because this effect then starts later in lactation; simply extrapolating lactation curves to simulate extended lactations could underestimate milk production in late lactation. Individual milk production (MP) in kilogram of cow i in parity j at each day in milk (DIM) was calculated as:
 $$\eqalign{ MP_{{ij}} & {\equals}a_{j} {\plus}b_{j} {\times}{\rm DIM}{\plus}c_{j} {\times}{\rm exp}\left( {-k{\times}{\rm DIM}} \right){\plus}RPL_{i} {\times}ADY_{j} \cr \quad & \quad{\plus}b_{{{\rm gest}}} {\times}{\rm max}\left[ {\left( {D_{{\rm gest}} _{{_{i} }} -D_{{{\rm delay}}} } \right),0} \right]$$
where RPL i is the relative production level of cow i; ADY j the average daily 305-day yield in kilogram milk of a cow in parity j; a j, b j, c j and k model the shape of the lactation curve (Wilmink, Reference Wilmink1987); and b gest models the linear negative effect of days in gestation (D gest) from a fixed delay (D delay) after conception (Strandberg and Lundberg, Reference Strandberg and Lundberg1991). Parameters relate to the level of production (a j), lactation persistency after the peak yield (b j and b gest) and slope towards and moment of peak yield (c j and k).
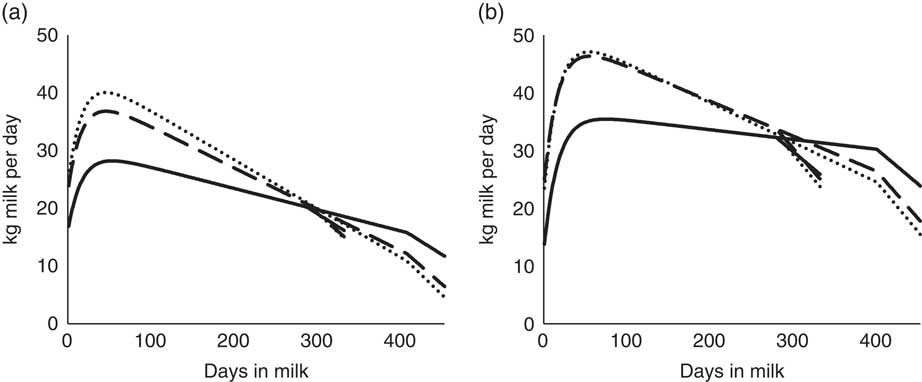
The base lactation curves were parameterised using milk records of 16 Dutch dairy farms that were managed for a BL and a conventional dry period (⩾42 days) (Table 2; Figure 1a; Kok et al., Reference Kok, Van Middelaar, Mostert, Van Knegsel, Kemp, De Boer and Hogeveen2017). The managed lactation curves were parameterised using milk records of two Danish dairy farms that deliberately extended lactations of Holstein cows (Figure 1b; data from Lehmann et al., Reference Lehmann, Fadel, Mogensen, Kristensen, Gaillard and Kebreab2016). Base and managed curves were fitted on the raw test-day milk records using a mixed model in R. In addition to the fixed effects for a j, b j, c j and b gest, the model included a random effect on a j, b j and c j for repeated measures per cow lactation within parity class, within herd, assuming an autoregressive covariance structure. A grid-search was performed to assess from which stage gestation affected yield, increasing D delay by 7 days from 84 days until 182 days after conception. The best model fit (based on lowest Bayesian information criterion value) was obtained for a delay of the effect of gestation of 175 days after conception for the base curves, and 168 days after conception for the managed curves. In combination with a dry period of 56 days before next calving, this implies that the effect of gestation on milk yield occurs in the last 49 days of lactation in the base curves, and in the last 56 days of lactation in the managed curves.
Lactation curves for parity 1 (solid line), 2 (dashed line) and >2 (dotted line) derived from cows with baseline lactation lengths (base; a) or managed for extended lactation lengths (managed; b), for calving intervals of 390 and 510 days. Lactation curves for different calving intervals differ in the moment that gestation linearly reduces persistency.

Lactation curve parameters per parity class of cows with baseline lactation length (base) and cows managed for extended lactations (managed)

Parameters relate to the level of production (a j), persistency after the peak yield (b j and b gest) and slope towards and moment of peak yield (c j) of the Wilmink lactation curve. ADY j is the average daily 305-day yield in kilogram milk of a cow with a calving interval of 390 days.
a b gest effect on persistency starts after 175 days in gestation for the base curve, and after 168 days in gestation for the managed curve.
Growth
Kok et al. (Reference Kok, Van Middelaar, Mostert, Van Knegsel, Kemp, De Boer and Hogeveen2017) assumed a fixed growth from 540 kg at first calving to 595 kg at second calving, to a mature BW of 650 kg at third calving (Centraal Veevoeder Bureau (CVB), 2012). Extending lactations, however, would under this assumption result in a slower growth. In the current model, therefore, growth was standardised to growth from 540 kg to mature weight of 650 kg in the 24 months following first calving. The net energy requirements for growth were 660 VEM (Dutch net energy system for lactation) per day in the first 12 months, and 330 VEM per day in the second 12 months following first calving (1000 VEM=6.9 megajoule (MJ) of net energy) (Van Es, Reference Van Es1975; CVB, 2012); the nitrogen fixation in the body during this growth was 16.6 g N/kg BW for the first 55 kg, and 22.5 g N/kg BW for the second 55 kg (RVO (Netherlands Enterprise Agency), 2015). Specifying this nitrogen fixation is relevant for the estimation of GHG emissions of N2O from manure, because these depend on the concentration of nitrogen in manure, which depends on nitrogen intake from feed, nitrogen deposited in milk, and nitrogen fixation during gestation and growth.
Culling
Kok et al. (Reference Kok, Van Middelaar, Mostert, Van Knegsel, Kemp, De Boer and Hogeveen2017) assumed a culling probability of 0.08 per lactation for fertility reasons, and 0.22 for other reasons (general culling). Extending lactations was assumed not to affect the culling probability for fertility reasons, whereas the probability of general culling per lactation was assumed to either be affected or unaffected. In case of an effect, culling probability per lactation was increased with a probability of 50/100 000 for each day the lactation was extended (Pinedo et al., Reference Pinedo, Daniels, Shumaker and De Vries2014). This culling probability was derived from mid-lactation, where culling probability was not increased by transition diseases or fertility problems (Pinedo et al., Reference Pinedo, Daniels, Shumaker and De Vries2014). The general culling probability per lactation was increased to 0.241 in case of extending the lactation with 60 days, and to 0.261 in case of extending the lactation with 120 days. In case of no effect, the probability of general culling remained 0.22 per lactation, assuming that culling probability is largely determined by the transition period.
Insemination and calving management costs
It was assumed that extended lactations are the result of a deliberate delay of first insemination. This could improve conception rate, because cows are inseminated in a later lactation stage, which is less influenced by health and fertility issues typical for early lactation (Butler, Reference Butler2003; Inchaisri et al., Reference Inchaisri, Hogeveen, Vos, van der Weijden and Jorritsma2010a). Extended lactations will reduce the frequency of calving, and could consequently reduce labour and veterinary services associated with calving. Costs for AI and calving management, therefore, were included in computation of NPCFs. The number of inseminations per conception was assumed to be 1.89 for a baseline lactation and 1.69 for an extended lactation (Inchaisri et al., Reference Inchaisri, Jorritsma, Vos, van der Weijden and Hogeveen2011). Costs associated with AI were assumed to be €20 per insemination (Inchaisri et al., Reference Inchaisri, Jorritsma, Vos, van der Weijden and Hogeveen2010b). Moreover, costs for calving management were assumed to be €152 per calving, including costs for labour, disorders in the transition period, drug delivery and dry-off treatment (Inchaisri et al., Reference Inchaisri, Jorritsma, Vos, van der Weijden and Hogeveen2010b). Net partial cash flows were presented including these costs for AI and calving management.
Sensitivity analysis
The aim of the sensitivity analysis was to gain insight in the importance of peak yield and lactation persistency for the impact of extended lactations. Base curves (Figure 1a) had a lower production level and lactation persistency than managed curves (Figure 1b), and managed curves were used to quantify a feasible increase in peak yield and lactation persistency. In four separate analyses, peak yield (a j) was increased by 2.5 and 5.0 kg/day (peak+2.5 and peak+5) and lactation persistency (b j) was increased by 0.01 and 0.02 kg per day (slope+0.01 and slope+0.02) to simulate the separate aspects of the lactation curves of cows managed for extended lactation. The importance of production level and lactation persistency for consequences of extended lactation on milk production, cash flows and GHG emissions was evaluated.
Results
Effect of extended lactations on production
The technical results per herd (of 100 cows) for all lactation length strategies are presented in Table 3, both for the model with base curves and the model with managed curves. This section describes the results for base curves only; results for managed curves are described in the sensitivity analysis. Moreover, unless explicitly stated, results refer to the model with general culling probabilities per lactation adjusted for lactation length.
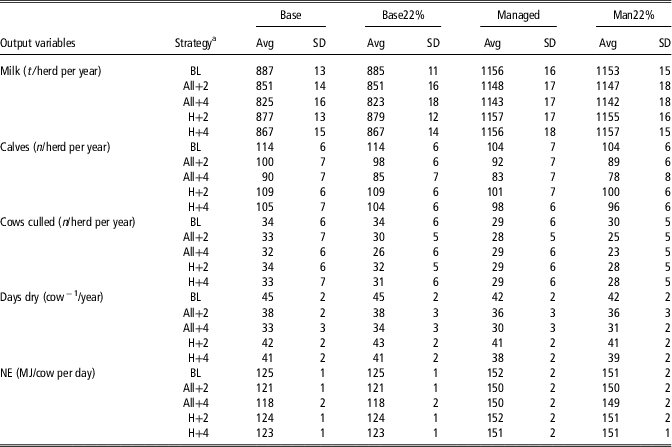
Milk yield, calves, cows culled, days dry and net energy requirement (NE) in megajoule (MJ) for different lactation length strategies, with lactation curves derived from cows with baseline lactations lengths (base) or managed for extended lactations (managed)

General culling probability per lactation was increased with increasing lactation length (base and managed) or kept constant at 0.22 (base22% and man22%).
a BL=baseline lactation length; All+2, All+4=lactations of all cows extended by 2 and 4 months; H+2, H+4=only lactations of heifers extended by 2 and 4 months.
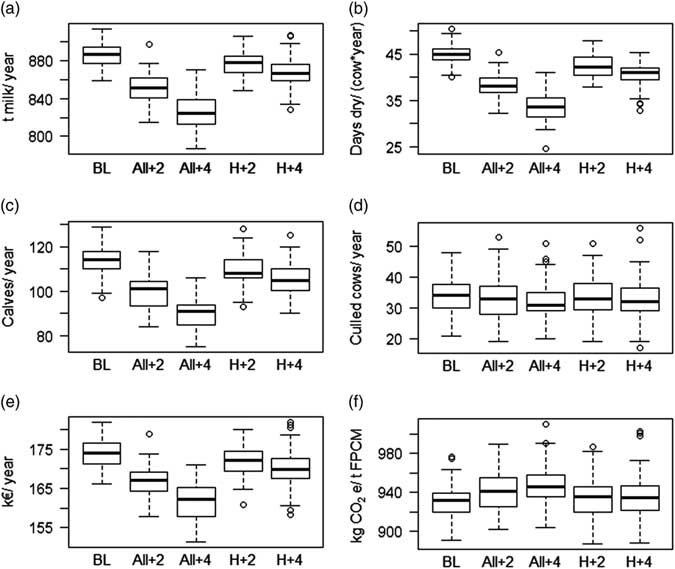
Compared with BL herds, that produced 887 t milk/herd per year, extending lactations reduced milk yield of the herd (Table 3; Figure 2a). Extending lactations for all cows by 4 months (All+4) resulted in the largest reduction in milk yield (−61 t/herd per year; −6.9%), followed by All+2 (−36 t/herd per year; −4.1%). Extending lactations for heifers only resulted in a smaller reduction in milk yield, on average 10 t/herd per year for H+2 (−1.1%) and 20 t/herd per year for H+4 (−2.2%). Extending lactations from the BL strategy reduced the number of days dry and the number of calves born per herd per year (Figure 2b and c). The reductions were larger when lactations were extended for all cows than for heifers only, and when lactations were extended for 4 months than for 2 months. The number of culled cows per herd per year was hardly affected by extending lactations when culling rates per lactation were adjusted for lactation length (Figure 2d). When the general culling probability was maintained at 0.22 per lactation, extending lactations reduced the number of culled cows per year, with the largest reduction (−8 cows per year) in All+4 herds.
Total herd milk yield (a), days dry (b), number of calves born (c), number of cows culled (d), net partial cash flows (e) and greenhouse gas emissions (f) for the baseline lactation length (BL), all lactations extended by 2 (All+2) or 4 months (All+4), and only lactations of heifers extended by 2 (H+2) or 4 months (H+4). Each value represents a herd of 100 cows with lactation curves derived from cows with baseline lactation lengths (base curves) and culling probability adjusted for lactation length. FPCM=fat- and protein-corrected milk.

Effect of extended lactations on net partial cash flows
In BL herds, the average NPCF was k€174 (SD: 4) per herd per year (Table 4). The NPCFs of herds with extended lactations were lower than that of BL herds (Table 5), and followed a similar pattern as the milk production of the herd (Figure 2a v. e), with a small impact of the number of culled cows and calves born. Reduced costs for AI and calving management compensated k€1 to k€5 of the reduced revenues for milk, with the largest effect in H+4 herds.
Average milk yield, net partial cash flows (NPCF) per herd and greenhouse gas (GHG) emissions per t fat- and protein-corrected milk (FPCM) for herds with baseline lactation lengths, for lactation curvesFootnote a differing in peak yield and persistency (slope) (n=100 herds; SD are similar to SD of Table 3)

a Lactation curves derived from cows with baseline lactation lengths (base) or managed for extended lactations (managed); and lactation curves where the peak yield (a i) was increased by 2.5 (peak+2.5) or 5 (peak+5) kg/day, and where persistency (b j) was increased by 0.01 (slope+0.01) or 0.02 (slope+0.02), compared with the base curve.
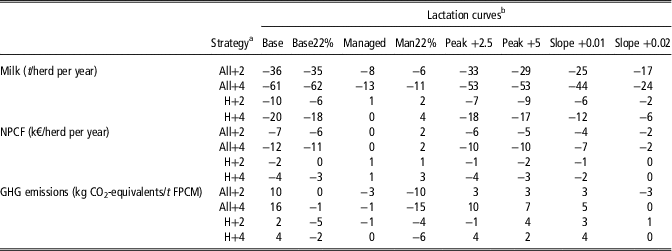
Change in milk yield, days dry, net partial cash flows (NPCF) and greenhouse gas (GHG) emissions per t fat- and protein-corrected milk (FPCM) for extended lactation strategiesFootnote a compared with baseline lactation length, for lactation curvesFootnote b differing in peak yield and persistency (slope)

Results are presented as average impact for each extended lactation length strategy, compared with herds with a baseline lactation length strategy.
a All+2, All+4=lactations of all cows extended by 2 and 4 months; H+2, H+4=only lactations of heifers extended by 2 and 4 months.
b Lactation curves derived from cows with baseline lactation lengths (base) or managed for extended lactations (man); and base curves where the peak yield (a i) was increased by 2.5 (peak+2.5) or 5.0 (peak+5) kg/day, and where persistency (b j) was increased by 0.01 (slope+0.01) or 0.02 (slope+0.02). General culling probability per lactation was increased with increasing lactation length, or kept constant at 0.22 (base22% and man22%).
Effect of extended lactations on greenhouse gas emissions
In BL herds, GHG emissions were 931 kg (SD: 16) CO2-equivalents/t FPCM (Table 4). Extending lactations increased GHG emissions in CO2-equivalents/t FPCM by 1.0% for All+2, by 1.7% for All+4, by 0.2% for H+2 and by 0.4% for H+4. The impact of extended lactations on GHG emissions per unit milk showed a pattern opposite to that of milk yield of the herd, although differences in GHG emissions between lactation length strategies were smaller than the variation between farms (Figure 2a v. f). When the probability of general culling was maintained at 0.22 per lactation, however, extending lactations resulted in a reduction of GHG emissions per t FPCM, which was largest for H+2 herds (−0.6%).
Sensitivity analysis: impact of production level and lactation persistency
The milk yield of BL herds increased when production level and lactation persistency were increased, which increased energy requirements per cow and the NPCF per herd, and reduced GHG emissions per t FPCM (Table 4). Using managed curves, annual milk production in the BL herds was 30% higher and energy requirements were 22% higher than using base curves. Moreover, BL herds with managed curves had fewer calves per year (104 v. 114), fewer culled cows per year (28 to 29 v. 32 to 42), and fewer days dry per year (42 v. 45 days) than BL herds with base curves.
In contrast to results with base curves, reductions in milk yield compared with BL herds with managed curves were only 8 t (0.7%) and 13 t (−1.1%) per herd per year for All+2 and All+4 herds, and milk yield was similar to BL herds in H+2 and H+4 herds. Together with the reduction in costs for AI and calving management, this resulted in no change in NPCF flow for All+2 and All+4 herds, and an increase in NPCF for H+2 and H+4 herds compared with BL herds. Moreover, GHG emissions per unit milk were equal to BL herds or reduced (0% to −0.3%) when lactations were extended, and were further reduced (−0.4% to −1.8%) when the probability of general culling was maintained at 0.22/lactation.
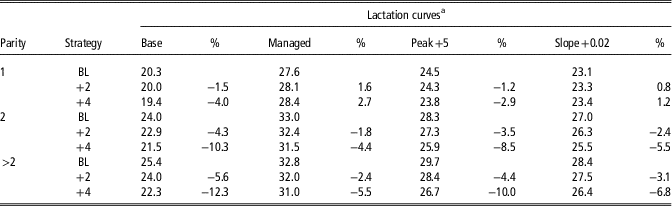
At herd level, extending lactations reduced milk yield compared with BL herds for all curves, except for H+2 and H+4 herds with managed curves (Table 5). At lactation level, extending lactations by 2 months reduced milk yield per day of calving interval of heifers by 1.5%, of second parity cows by 4.3%, and of older cows by 5.6% (Table 6). Milk losses compared with the BL scenario were reduced to a lesser extent when peak yield increased than when lactation persistency increased. Under the best lactation persistency scenario (i.e. slope+0.02 and managed curves), extending lactations increased milk yield per day of calving interval of heifers, whereas milk yield of older cows remained reduced compared with the BL. Therefore, the impact of extending lactations remained negative with peak+5 curves, whereas H+2 and H+4 had NPCFs equal to BL herds with slope+0.02 and managed curves. Total milk yield, however, was increased to a greater extent when peak yield increased than when lactation persistency increased. As a result, H+4 herds with peak+5 curves realised about 45 t milk/year more than H+4 herds with slope+0.02 curves.
Average milk yield per day (kg per day of calving interval) for cows of different parities with baseline (BL) or 2 or 4 months extended lactations, for lactation curvesFootnote a differing in peak yield and persistency (slope)

Percentages indicate the change in milk yield per day compared with the BL strategy.
a Lactation curves derived from cows with BL lengths (base) or managed for extended lactations (man); and base curves where the peak yield (a i) was increased by 5.0 (peak+5) kg/day, and where persistency (b j) was increased by 0.02 (slope+0.02).
Discussion
This study aimed to investigate how extending lactations of dairy cows by 2 or 4 months affects milk production and NPCF at herd level, and GHG emissions per unit milk, using a dynamic stochastic simulation model. Milk yield of BL herds averaged 8870 kg/cow per year with base curves. Annual milk yield of the herd decreased considerably when lactations of all cows were extended by 2 or 4 months (−4.1% and −6.9%), and to a lesser extent when lactations of heifers were extended by 2 or 4 months (−1.1% and −2.1%). A simulation study that postponed first insemination by 70 days also estimated a reduced annual milk yield, with a smaller reduction when only lactations of heifers were extended (Sørensen and Østergaard, Reference Sørensen and Østergaard2003).
The reductions in milk yield in case of extended lactations were smaller when lactation persistency was increased. In case of the best lactation persistency (i.e. managed curves), annual milk yield of the herd decreased only 1.1% when lactations of all cows were extended by 4 months, and extending lactations of heifers only did not lower milk production at herd level. Despite the same simulated calving intervals and culling rules, herds with base curves had more calves, culled cows, and days dry per year than herds with managed curves. This difference was caused by the prolonged presence of cows to be culled for fertility reasons in herds with managed curves: these cows were culled when their milk yield dropped below 15 kg/day, which resulted in long final lactations due to the high peak production and lactation persistency, thus delaying the moment of culling and replacement. Such long final lactations seem realistic, given that individual cows in the dataset of managed herds had milk records exceeding 15 kg milk/day beyond 800 days in milk.
At lactation level, milk yield per day of calving interval increased for highly persistent heifers, whereas it always decreased for older cows when lactations were extended. Extending lactations also increased milk yield per day of calving interval of heifers, and reduced milk yield of older cows in experimental studies with Swedish Holstein and Israeli Holstein cows (Rehn et al., Reference Rehn, Berglund, Emanuelson, Tengroth and Philipsson2000; Arbel et al., Reference Arbel, Bigun, Ezra, Sturman and Hojman2001). Despite the increase in milk yield per day for heifers, the annual milk yield of the entire herd generally decreased when lactations of heifers were extended. This can be explained by the lower milk production of heifers compared with older cows, and the increased ratio of heifers to older cows when only lactations of heifers are extended. Extending lactations of heifers using managed curves, however, did not reduce milk yield of the herd, because the reduced number of days dry and the increased production of heifers together compensated for the reduced presence of older cows. Our results for older cows seem to contradict a previous finding, where farmers who selected certain cows for extended lactations were able to maintain milk yield per day of calving interval with increasing lactation length (Lehmann et al., Reference Lehmann, Fadel, Mogensen, Kristensen, Gaillard and Kebreab2016). That finding may have been confounded with production level, however, because cows assigned to the longer lactations also had higher 305-day yields. Specifically extending lactations of high-producing heifers or highly persistent cows in the herd might be a strategy to reduce the impact of extended lactations on milk production and NPCFs. It should be considered, however, that predicting lactation persistency may be difficult in early lactation (Lehmann et al., Reference Lehmann, Mogensen and Kristensen2017), and that extending lactations could therefore bring the risk of longer dry periods when cows spontaneously dry off (Rehn et al., Reference Rehn, Berglund, Emanuelson, Tengroth and Philipsson2000; Lehmann et al., Reference Lehmann, Fadel, Mogensen, Kristensen, Gaillard and Kebreab2016).
Similar to the effect on milk yield, extending lactations with base curves had a negative impact on the NPCF, that was larger when lactations of all cows were extended than when lactations were extended for heifers only. Extending lactations of all cows or heifers by 2 months, accounting for costs related to AI and calving management, reduced the NPCF by k€7 or k€2/herd per year, or €70 or €19/cow per year, respectively. These results are similar to previously estimated costs of delaying insemination by 70 days for all cows (€53 to €70 euros/cow per year), or for heifers only (€18 or €24 euros/cow per year) (Sørensen and Østergaard, Reference Sørensen and Østergaard2003). In that estimate, it was assumed that milk production in the lactation after an extended lactation was up to 0.9% higher, due to a live weight closer to mature weight (Sørensen and Østergaard, Reference Sørensen and Østergaard2003), whereas milk production was only affected by parity in the current study. A reduction in NPCF of k€7/year would be a considerable burden for a farmer, compared with the average annual family labour income of Dutch dairy farmers of k€42 between 2008 and 2016 (Wageningen Economic Research, 2017). In case of extending lactations by 2 months for heifers only, losses could be compensated if the culling probability per lactation would remain the same. Given that culling rate is highest in the transition period and in late lactation, a lower culling rate per year may be expected when lactations are extended (Pinedo et al., Reference Pinedo, Daniels, Shumaker and De Vries2014). Moreover, reductions in NPCF in case of extended lactations were smaller in herds with higher lactation persistency. In case of the most persistent lactation curves evaluated in the current study, reduced costs for AI and calving management compensated for the reduced milk revenues when lactations of heifers were extended. The model did not account for possible changes in feed costs per MJ and in labour (e.g. for youngstock and milking) in case of extended lactations.
Estimated GHG emissions per unit milk increased when lactations were extended for base curves, by 1.0% when all lactations were extended by 2 months, and by 1.7% when all lactations were extended by 4 months. A larger increase in GHG emissions of 5.9% or 12.9% was previously estimated in a model study when lactations of all cows were extended by 65 or 135 days (Wall et al., Reference Wall, Coffey and Pollott2012). This increase was caused by an unexpected increase in enteric and manure emissions of methane per head per year in case of extended lactations (Wall et al., Reference Wall, Coffey and Pollott2012). If the culling probability per lactation would remain the same when lactations are extended, GHG emissions per unit milk would be reduced for all extended lactation strategies for base curves, despite the reduction in milk yield at herd level. This result was caused by a lower annual replacement rate, which reduced the GHG emissions from rearing replacement heifers. A simulation study of Australian dairy herds estimated that GHG emissions per unit milk (after mass allocation of emissions to milk and meat) would reduce when lactations were extended by 6 months, due to a 12% greater annual milk yield and a 9% lower replacement rate (Browne et al., Reference Browne, Behrendt, Kingwell and Eckard2015). In case of high lactation persistency, GHG emissions per unit milk were similar for baseline and extended lactation lengths even when culling probability was adjusted for extended lactation lengths.
It is unknown what specific factors of breeding or management cause the high peak yield and lactation persistency in the two Danish herds that manage cows for extended lactations. Although the farms differ in many aspects, milking frequency appears to be higher than twice daily in both herds, as cows were milked either three times daily or in an automatic milking system. Moreover, both herds are fed a high-energy total mixed ration (plus additional concentrates in the robot). Increasing production level and lactation persistency from base curves to these managed curves in the simulation model resulted in a great increase in milk yield per herd per year (30% for BL herds), an increase in NPCFs (k€27) and a reduction in GHG emissions per unit milk (−90 kg CO2-equivalents/t FPCM). These changes by far exceeded the changes due to extended lactations compared with a BL. The impact on NPCF and GHG emissions for all scenarios was evaluated using an average Dutch feed composition (CBS (Statistics Netherlands), 2014) with average costs and revenues (KWIN-V, 2014) and assuming no other changes, whereas changes in lactation curve and lactation length may be accompanied by changes in, for example, feed composition, milking frequency or crops grown by the farmer (Dekkers et al., Reference Dekkers, Ten Hag and Weersink1998; Sorensen et al., Reference Sorensen, Muir and Knight2008; Van Middelaar et al., Reference Van Middelaar, Berentsen, Dijkstra, Van Arendonk and De Boer2014). Because feed composition may change towards more energy-dense products to sustain a higher milk production, the estimates of NPCFs and GHG emissions of the managed herds and herds with increased milk production and lactation persistency may not be accurate. However, it can be assumed that similar investments in feed and milking capacity are required to increase peak yield and lactation persistency for BL herds and for herds with extended lactations. Therefore, the relative changes between herds with different lactation lengths but equal lactation curves are likely informative.
In conclusion, extending lactations by 2 or 4 months reduced milk production of the herd, except when only lactations of heifers were extended and lactation curves were very persistent. Consequently, whether the resulting NPCF was reduced or increased compared with BLs mainly depended on lactation persistency. In case of more persistent lactations, reduced revenues from milk could be compensated by reduced costs for AI and calving management. GHG emissions per unit milk increased when lactations were extended, except when lactations were very persistent or when the lifespan of cows increased by extending lactations.
Acknowledgements
This study was financed by DairyNL (Zuivel NL; organization of the Dutch dairy supply chain, The Hague, the Netherlands) and the Dutch Ministry of Economic Affairs (EZ, The Hague, the Netherlands), as part of the Sustainable Dairy Chain initiative (Duurzame Zuivelketen, The Hague, the Netherlands).
Declaration of interest
None.
Ethics statement
None.
Software and data repository resources
None of the data were deposited in an official repository.