Introduction
Contemporary consensus is to define retirement as a process (Shultz and Wang Reference Shultz and Wang2011) and, as a result, researchers now face the challenge of defining the role of the many variables within it (e.g. Beehr and Bennett Reference Beehr, Bennett, Shultz and Adams2007; Wang and Shultz Reference Wang and Shultz2010). Organising variables according to retirement phases has often provided a successful guide for discussion (e.g. Feldman and Beehr Reference Feldman and Beehr2011; Shultz and Wang Reference Shultz and Wang2011). However, the phases alone do not provide the requisite theoretical framework for an empirical investigation. The present article shows that by using both retirement phases and a theoretical framework we can lucidly represent the complexities of the retirement process.
Gaps in theoretical frameworks applied to retirement research
The three most commonly used theoretical perspectives in retirement research, namely lifecourse perspective, role theory and continuity theory, each only explain a subset of experiences (Wang Reference Wang2007). On the other hand, a resource perspective (explained in further detail below) provides a general mechanism that explains multiple patterns of change over the retirement process (Wang and Shultz Reference Wang and Shultz2010). However, this perspective does not offer specific detail on how resources are expected to influence the retirement process at various stages. Accordingly, it is the premise of this article that more specific hypotheses can be developed when a resource perspective is combined with our understanding of the phases of retirement. It is hoped that by introducing such a research framework we can improve how we research retirement, leading to more specific research questions, better consolidation of future research and tailored interventions. The following sections explain the derivation of the model and hypotheses that will be tested cross-sectionally in an Australian population of retirees.
Tools to organise variables: Retirement phases and a resource perspective
There are three phases of retirement that are generally agreed upon (Richardson Reference Richardson1993). A stage prior to retirement, in which the individual is principally engaged in work; a transition period, which may last varying lengths of time and involve multiple changes in employment status; and an adjustment stage, in which the individual is principally engaged in retirement (Borland Reference Borland2005). Each phase is a critical turning point where action (or inaction) will have a bearing on future functioning (Adams and Rau Reference Adams and Rau2011; Sterns and Subich Reference Sterns, Subich, Brown and Lent2004). We refer to these here as the Pre-retirement, Transition and Adaptation phases.
The Pre-retirement phase generally occurs in midlife, although the exact timing may differ widely between individuals (Ekerdt, Kosloski and Deviney Reference Ekerdt, Kosloski and Deviney2000). One's future disengagement from the workforce becomes salient and the individual may start thinking about, talking to others, planning or forming intentions on how to retire (Adams and Rau Reference Adams and Rau2011; Ekerdt, Kosloski and Deviney Reference Ekerdt, Kosloski and Deviney2000). Addressing issues early such as negative attitudes or poor preparation on the part of the individual could help to avert later problems (Sterns and Subich Reference Sterns, Subich, Brown and Lent2004; Taylor and Doverspike Reference Taylor, Doverspike, Adams and Beehr2003). The Transition phase centres on when and how individuals will retire (Richardson Reference Richardson1993). Decisions can be quite complex, as individuals consider options including not retiring, retiring fully or pursuing a number of employment options that bridge the time between full employment and full retirement, and when to begin any transition (Richardson Reference Richardson1993; Wang et al. Reference Wang, Adams, Beehr, Shultz, Baugh and Sullivan2009). At this stage, control over the transition is an important issue (Richardson Reference Richardson1993). Finally, the Adaptation phase concerns how individuals adjust to retirement. Adjustment is a dynamic and ongoing process (Sterns and Subich Reference Sterns, Subich, Brown and Lent2004; Wang, Henkens and van Solinge Reference Wang, Henkens and van Solinge2011), potentially with multiple alternating periods of stabilisation and re-adjustment. Of interest are the predictors of outcomes such as wellbeing, adjustment and satisfaction over time.
The theoretical framework for the present article is a resource-based dynamic perspective (Wang, Henkens and van Solinge Reference Wang, Henkens and van Solinge2011). Resources describe an individual's capacity to fulfil his or her cardinal needs, either because they are valued in themselves, e.g. health, or because they help individuals to achieve desirable ends, e.g. money (Hobfoll Reference Hobfoll2002). Individual wellbeing changes as this capacity fluctuates. Specifically, an improvement, depletion or maintenance of resource level predicts an increase, drop or stability in wellbeing, as individuals are more or less able to meet their personal needs (Wang Reference Wang2007). A resource perspective follows on from a long tradition of recognising that resources, specifically the balance of resources in favour of benefits rather than deficits, help individuals to negotiate transitions (e.g. Parker Reference Parker1982; Schlossberg Reference Schlossberg1981).
Selecting variables to describe the retirement process
Pre-retirement planning, exit conditions and resources are important variables that influence outcomes of retirement adjustment, wellbeing and life satisfaction. Note that these variables represent only a selection of those that describe the retirement process (for a comprehensive review, see Wang and Shultz Reference Wang and Shultz2010). A brief explanation justifying the selection of these variables and outlining expected relationships follows.
Planning is a key activity of Pre-retirement (Taylor and Doverspike Reference Taylor, Doverspike, Adams and Beehr2003). It refers to effort invested prior to retirement in order to secure future health, wealth and wellbeing (Muratore and Earl Reference Muratore and Earl2010). Planning may eliminate abrupt changes to wellbeing over the transition, improve relevant resources, or contribute to health and satisfaction in retirement (Adams and Rau Reference Adams and Rau2011; Noone, Stephens and Alpass Reference Noone, Stephens and Alpass2009; Taylor and Doverspike Reference Taylor, Doverspike, Adams and Beehr2003). Planning has been linked to post-retirement satisfaction, adjustment and attitudes (Topa et al. Reference Topa, Moriano, Depolo, Alcover and Morales2009; Wang and Shultz Reference Wang and Shultz2010). The mechanism that drives the relationship between planning and retirement outcomes is poorly understood (Taylor and Doverspike Reference Taylor, Doverspike, Adams and Beehr2003). Inconsistencies in measurement hamper comparison and consolidation of results (Noone, Stephens and Alpass Reference Noone, Stephens and Alpass2009; Topa et al. Reference Topa, Moriano, Depolo, Alcover and Morales2009). Accordingly, the present article uses a multi-domain planning measure (the RPQII; Muratore and Earl Reference Muratore and Earl2010) and examines potential direct and indirect effects of planning on retirement outcomes.
How one exits the workforce can have substantial and lasting consequences for adjustment (Crego, de la Hera and Martínez-Íñigo Reference Crego, de la Hera and Martínez-Íñigo2008; Kim and Moen Reference Kim and Moen2002; Wang Reference Wang2007). Typically five dimensions of workforce exit are measured: whether exit was gradual, choice over the decision, say in the timing of retirement, difficulty in making the decision and the level of preparation (Donaldson, Earl and Muratore Reference Donaldson, Earl and Muratore2010; Wells et al. Reference Wells, De Vaus, Kendig, Quine and Petralia2006; Wong and Earl Reference Wong and Earl2009). However, previous research including the dimensions of both gradual exit and control demonstrated that control was the more important dimension (Calvo, Haverstick and Sass Reference Calvo, Haverstick and Sass2009; de Vaus et al. Reference de Vaus, Wells, Kendig and Quine2007). Therefore, in the present study, gradual workforce exit was not measured. When the other four conditions are favourable, retirement outcomes should be improved.
Control over life transitions and the opportunity to retire at the expected time contributed to a positive retirement, higher life satisfaction, and heightened mental and physical health (Bacharach et al. Reference Bacharach, Bamberger, Biron and Horowitz-Rozen2008; Butterworth et al. Reference Butterworth, Gill, Rodgers, Anstey, Villamil and Melzer2006; Shultz, Morton and Weckerle Reference Shultz, Morton and Weckerle1998; Szinovacz and Davey Reference Szinovacz and Davey2005a). A substantial proportion of individuals approach the retirement decision with uncertainty and ambivalent feelings that can continue into retirement and contribute to poorer attitudes (Barnes and Parry Reference Barnes and Parry2004; Feldman and Beehr Reference Feldman and Beehr2011; Reitzes and Mutran Reference Reitzes and Mutran2004). Ambivalence is associated with discomfort, particularly when a decision must be made (van Harreveld et al. Reference van Harreveld, Rutjens, Rotteveel, Nordgren and van der Pligt2009). Therefore, individuals who approached retirement with ambivalent feelings may report that it was difficult to make the decision. Other research has linked feeling prepared with several improvements, including greater confidence in making the transition (Kim, Kwon and Anderson Reference Kim, Kwon and Anderson2005; Taylor and Doverspike Reference Taylor, Doverspike, Adams and Beehr2003). Therefore, a greater sense of preparation and an easier retirement decision should predict more desirable outcomes when decision and timing of retirement are the variables of interest.
Essential resources that improve retirement are economic situation, health and social relationships (Rohwedder Reference Rohwedder2006; Szinovacz Reference Szinovacz, Adams and Beehr2003; van Solinge and Henkens Reference van Solinge and Henkens2008). These appear to be the three main factors that individuals take into account when assessing their own wellbeing (Rohwedder Reference Rohwedder2006) and are frequently studied for their effects on the retirement experience (Kim and Moen Reference Kim, Moen and Lachman2001). In addition, control in the form of mastery may play a central role in how one copes with the many changes that occur in later life (Hobfoll Reference Hobfoll2002; Rijs, Cozijnsen and Deeg Reference Rijs, Cozijnsen and Deeg2012). Measuring positive aspects of retirees' relationships and sense of control are particularly important, as these have been under-researched (Wang, Henkens and van Solinge Reference Wang, Henkens and van Solinge2011). Accordingly, resources in finances, health and relationships, along with control in the form of mastery, will be investigated as key resources in the present article and are introduced in more detail below.
Adequate money improves access to desirable activities, such as travel and services, such as health care, and consistently predicts positive outcomes in older adults (Han and Hong Reference Han and Hong2011; Rohwedder Reference Rohwedder2006; von dem Knesebeck et al. Reference von dem Knesebeck, Wahrendorf, Hyde and Siegrist2007). Health is a central indicator of later-life wellbeing and successful ageing, including maintenance of cognitive functioning (Bowling Reference Bowling2008; Yaffe et al. Reference Yaffe, Fiocco, Lindquist, Vittinghoff, Simonsick, Newman, Satterfield, Rosano, Rubin, Ayonayon and Harris2009). Conversely, poor health can limit social interaction and leisure activity and associated medical costs or early retirement can reduce finances (Rohwedder Reference Rohwedder2006; Taylor and Doverspike Reference Taylor, Doverspike, Adams and Beehr2003; van Solinge and Henkens Reference van Solinge and Henkens2008). Relationships in retirement can provide individuals with material help, emotional support, companionship and a sense of identity, and predict positive affect, general life satisfaction and wellbeing (Hobfoll Reference Hobfoll2002; Reitzes and Mutran Reference Reitzes and Mutran2004; van Solinge and Henkens Reference van Solinge and Henkens2005). A retiree's partner may provide a particularly potent means of social support, evidenced in positive outcomes associated with being married and the negative repercussions when a partner is lost (Calvo, Haverstick and Sass Reference Calvo, Haverstick and Sass2009; van Solinge and Henkens Reference van Solinge and Henkens2008; Wong and Earl Reference Wong and Earl2009).
Within broader psychology, a sense of control is one of the most commonly investigated resources, consistently predicting superior outcomes (Hobfoll Reference Hobfoll2002). Mastery indicates the degree to which an individual feels in control of his or her life (Pearlin and Schooler Reference Pearlin and Schooler1978). It captures elements of self-efficacy, indicating ability to perform a specific task, and locus of control, indicating internal or external power (Skaff, Pearlin and Mullan Reference Skaff, Pearlin and Mullan1996), but is a global measure of control (Rijs, Cozijnsen and Deeg. Reference Rijs, Cozijnsen and Deeg2012). Mastery plays a central role in wellbeing and other positive outcomes across the lifespan (Hobfoll Reference Hobfoll2002; Quine et al. Reference Quine, Wells, De Vaus and Kendig2007). A higher level of mastery may help individuals to manage retirement, reducing potentially negative effects of the transition (Rijs, Cozijnsen and Deeg Reference Rijs, Cozijnsen and Deeg2012). Based on the central role that these resources play in the retirement experience (Hopkins, Roster and Wood Reference Hopkins, Roster and Wood2006; Taylor and Doverspike Reference Taylor, Doverspike, Adams and Beehr2003), in general, higher levels of resources should predict positive outcomes.
In the present study, retirement adjustment, wellbeing and life satisfaction are measured as dependent variables. Retirement adjustment directly evaluates retirement on a number of dimensions such as finances, lifestyle and other changes (Wells et al. Reference Wells, De Vaus, Kendig, Quine and Petralia2006). The construct is measured both by enjoyment of retired life and a sense of purpose or meaning. Wellbeing indicates ‘optimal experience and functioning’ (Ryan and Deci Reference Ryan and Deci2001: 141) and is measured by questions about a variety of psychological health experiences over the past two weeks (Goldberg and Williams Reference Goldberg and Williams1988). Like retirement adjustment, wellbeing is also underpinned by positive experiences and achievement of psychological growth, meaning and purpose (Lent Reference Lent2004; Ryan and Deci Reference Ryan and Deci2001). Finally, life satisfaction is measured by overall positive evaluations of life (Lent Reference Lent2004; Ryan and Deci Reference Ryan and Deci2001). By focusing on psychological outcomes of retirement, the present article addresses a neglected area in policy and economic research (Easterlin Reference Easterlin2009; Wong and Earl Reference Wong and Earl2009).
Options for specifying a model of the retirement process
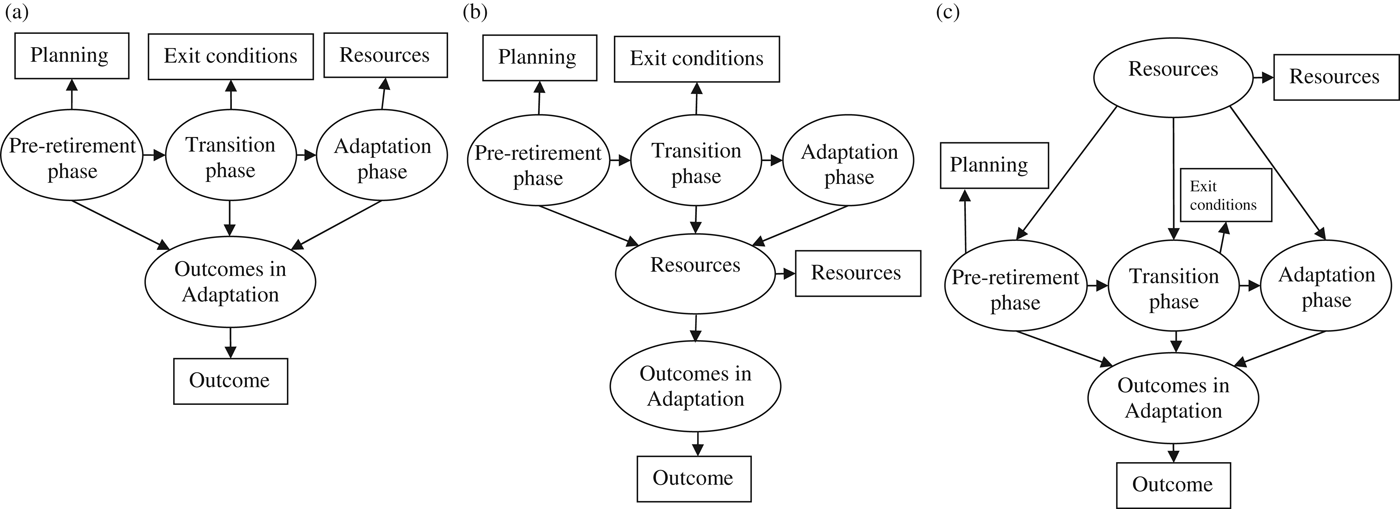
This section presents three options for representing the interplay amongst pre-retirement planning, exit conditions and resources that influence retirement outcomes (see Figure 1). The first option is to group these variables according to the phases of retirement. Organising these variables using the three retirement phases suggests that Pre-retirement (planning), Transition (exit conditions) and Adaptation (resources) affect Outcomes in Adaptation (Figure 1a). Note that resources could be associated with any of the three phases, however, they are included in the Adaptation phase here, because the sample population met criteria for being retired and so present resource level is assumed to have been measured in the Adaptation phase.
Three options for defining the role of variables in the retirement process for the model: (a) using the retirement phases; (b) using a resource perspective, as per Wang, Henkens and van Solinge (Reference Wang, Henkens and van Solinge2011); (c) combining the retirement phases and a resource perspective.
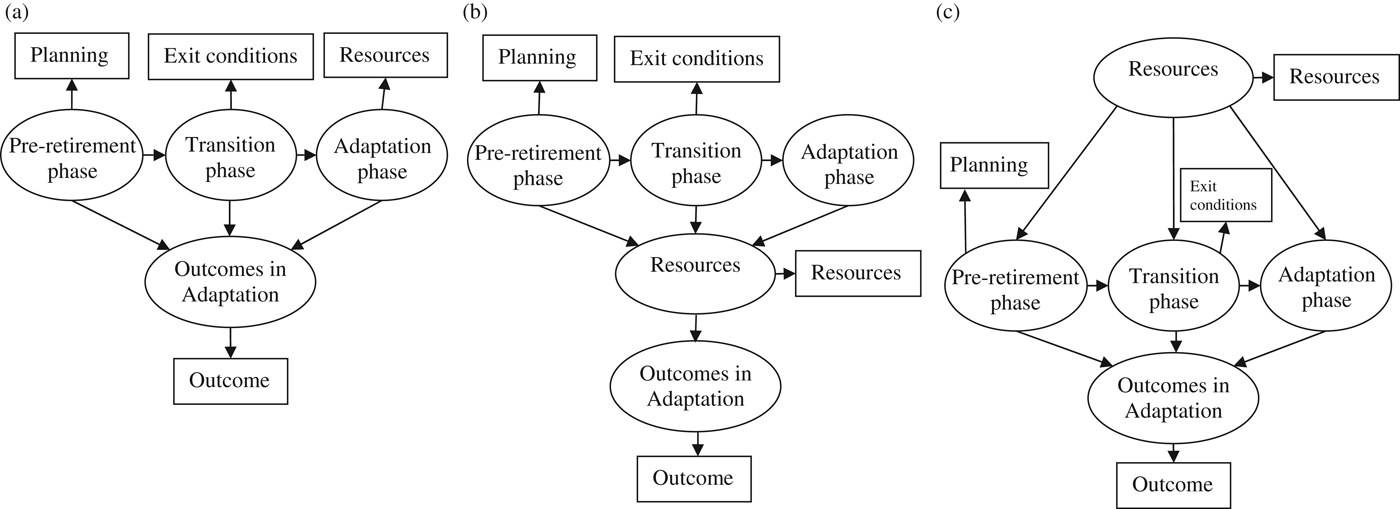
The second option is to define the role of variables according to a resource perspective (Wang, Henkens and van Solinge Reference Wang, Henkens and van Solinge2011). Following the arguments of Wang, Henkens and van Solinge (Reference Wang, Henkens and van Solinge2011), resources mediate the relationship between the Pre-retirement, Transition and Adaptation phases and outcomes observed in the Adaptation phase (see Figure 1b). In support of this, evidence suggests that circumstances in both the Pre-retirement and Transition phases can influence resources. Planning helps individuals to accumulate fiscal resources and improve a sense of control (Adams and Rau Reference Adams and Rau2011; Prenda and Lachman Reference Prenda and Lachman2001; Stawski, Hershey and Jacobs-Lawson Reference Stawski, Hershey and Jacobs-Lawson2007). Exiting the workforce at the wrong time may limit financial resources or affect marital satisfaction (McKelvey Reference McKelvey2009; Szinovacz Reference Szinovacz, Adams and Beehr2003; Szinovacz and Davey Reference Szinovacz and Davey2005b). In addition, a lack of say in the timing of retirement may undermine self-management and mastery (Quine et al. Reference Quine, Wells, De Vaus and Kendig2007; van Solinge and Henkens Reference van Solinge and Henkens2008).
The third option is to combine the phases of retirement and a resource perspective to assign more specific roles to resources during the retirement process. That is, specifying a model in which resources affect circumstances in the Pre-retirement, Transition and Adaptation phases which in turn affect Outcomes in Adaptation (see Figure 1c). Resources, such as better health, being married and higher wealth, have been associated with greater planning and more positive exit conditions (de Vaus et al. Reference de Vaus, Wells, Kendig and Quine2007; McMunn et al. Reference McMunn, Nazroo, Wahrendorf, Breeze and Zaninotto2009; Morgan and Eckert Reference Morgan and Eckert2004; Quine et al. Reference Quine, Wells, De Vaus and Kendig2007). Adequate finances are a prerequisite for saving and consistently predict financial planning behaviour (Hershey, Henkens and van Dalen Reference Hershey, Henkens and van Dalen2007; Morgan and Eckert Reference Morgan and Eckert2004; Muratore and Earl Reference Muratore and Earl2010). Similarly, a sense of control may facilitate planning (Moen et al. Reference Moen, Huang, Plassmann and Dentinger2006; Noone, Stephens and Alpass Reference Noone, Stephens and Alpass2010). An individual's financial situation, health and partner can influence the timing of his or her retirement (Feldman and Beehr Reference Feldman and Beehr2011; Flynn Reference Flynn2010; van Dam, van der Vorst and van der Heijden Reference van Dam, van der Vorst and van der Heijden2009; Zappalà et al. Reference Zappalà, Depolo, Fraccaroli, Guglielmi and Sarchielli2008). Control fosters the selection of effective coping strategies (Caplan and Schooler Reference Caplan and Schooler2007) and may similarly encourage an individual to transition in line with his or her preferences.
Based on the evidence reviewed previously, all three options are plausible models. However, establishing that resources affect circumstances in the three phases offers an advantage to intervention design (Figure 1c). First, consider the possibility that what occurs in the Pre-retirement, Transition and Adaptation phases directly influences outcomes (Figure 1a) or influences acquisition of resources, which in turn affects outcomes in the Adaptation phase (Figure 1b). In these cases, interventions should be designed to improve individual planning, expectations, decision making and retirement life, and be appropriately timed. Designing these interventions meets with two challenges. The first challenge is to identify the variables that should be targeted from the multitude that influence these constructs in intricate ways (Adams and Rau Reference Adams and Rau2011; Feldman and Beehr Reference Feldman and Beehr2011; Wang and Shultz Reference Wang and Shultz2010). The second challenge is to determine the optimal timing for interventions given that individuality in timing of and pathways to retirement are increasing (O'Rand and Henretta Reference O'Rand and Henretta1999; Shultz and Wang Reference Shultz, Wang and Wankel2008; Wang et al. Reference Wang, Adams, Beehr, Shultz, Baugh and Sullivan2009). In contrast, if resources play a role in determining an individual's circumstances in Pre-retirement, Transition and Adaptation (as in Figure 1c), this uncertainty is resolved. Education in how to accumulate and manage key resources could provide substantial help to anyone at any stage in the process. Consequently, it is this latter role for resources that is tested in the present article (Figure 1c).
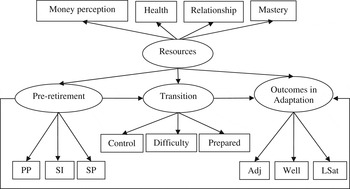
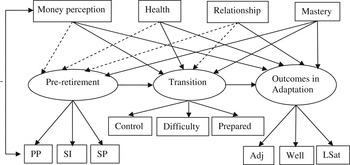
Wider literature on resources supports this latter pathway (Nimrod, Janke and Kleiber Reference Nimrod, Janke and Kleiber2009; Wells et al. Reference Wells, De Vaus, Kendig and Quine2009; Zacher and Frese Reference Zacher and Frese2011). Resources serve to reduce the likelihood of encountering negative circumstances and better equip individuals to obtain desirable outcomes when challenged (Hobfoll Reference Hobfoll2002). This means that resources may reduce the likelihood of a forced retirement as well as creating an insulating effect if plans are disrupted. Furthermore, this overarching role for resources helps to explain why advantages and disadvantages accumulate over time (O'Rand and Henretta Reference O'Rand and Henretta1999). Specifically, individuals with greater resources are better able to build or maintain their resources (Freund and Baltes Reference Freund and Baltes2002; Hobfoll Reference Hobfoll2002). Accordingly, the model specified for the present article posits that resources play a central role in the retirement process by improving the circumstances of Pre-retirement and Transition as well as directly influencing outcomes in Adaptation (full model and indicators are shown in Figure 2). As explained in Figure 1, predictor variables from the Adaptation phase are not included.
Hypothesised model with defined elements.

Expected relationships amongst latent variables
Direct effects of phases on outcomes
Phases are interconnected, e.g. decisions and experiences earlier in the retirement process can limit or enhance opportunities later on (e.g. Adams and Rau Reference Adams and Rau2011; Sterns and Subich Reference Sterns, Subich, Brown and Lent2004). Planning in Pre-retirement may affect how one exits the workforce during the Transition phase. This means that we need a model that simultaneously represents relationships amongst phases and outcomes, e.g. a structural equation model.
Indirect effect of pre-retirement planning on Outcomes in Adaptation
The indirect relationship between Pre-retirement and Outcomes in Adaptation via Transition warrants special mention (see Figure 2). Planning may indirectly influence outcomes in the Adaptation phase, by improving the sense of control, ease of making the decision or sense of preparation for retirement (circumstances in the Transition phase). Identifying indirect pathways such as these helps to illuminate how planning may improve retirement outcomes in the Adaptation phase, an area that is still poorly understood (Taylor and Doverspike Reference Taylor, Doverspike, Adams and Beehr2003; Wang and Shultz Reference Wang and Shultz2010).
Research suggests that planning has the potential to improve the transition as well as ameliorate negative exit conditions. Planning may help individuals to feel better able to make the transition (Taylor and Doverspike Reference Taylor, Doverspike, Adams and Beehr2003), e.g. by increasing feelings of preparation (Wong and Earl Reference Wong and Earl2009). Planning reduced depressive symptoms among retirees, who were forced to stop driving (Windsor et al. Reference Windsor, Anstey, Butterworth, Luszcz and Andrews2007). Similarly, planning reduced the negative effects of forced retirement due to redundancy or poor health (Elder and Rudolph Reference Elder and Rudolph1999).
Defining elements in the model
Described previously, the present article will test whether resources influence circumstances in the Pre-retirement and Transition phases and outcomes in the Adaptation phase. In addition, an indirect relationship between Pre-retirement and Outcomes in Adaptation via Transition will be tested. Having outlined the expectation for these relationships, the next step is to provide details about how these constructs will be formed (see Figure 2). Later, individual confirmatory factor analyses (CFA) are conducted to verify these formations statistically.
Resources are formed by money perception, health, relationship and mastery. Whilst conceptual categories of retirement resources have been suggested (Wang, Henkens and van Solinge Reference Wang, Henkens and van Solinge2011), whether these indicate a central resource factor or distinct latent variables has not been investigated empirically. Hobfoll (Reference Hobfoll2002) observed that levels of self-esteem, optimism and sense of control tend to be concurrently high within the one individual and, therefore, may indicate some higher-order personality resource. Applying this logic, if central retirement resources are highly correlated, they may similarly indicate a single latent factor.
Pre-retirement is indicated by public protection, self-insurance and self-protection. These represent government support, financial planning, and leisure and health planning, respectively (from the RPQII; Muratore and Earl Reference Muratore and Earl2010). As these domains come from a single retirement planning measure and quantify preparatory steps, they are expected to indicate a single latent factor.
Transition is formed by control, difficulty and preparedness. In previous research, these conditions have been typically combined into a single variable of conditions of exit (Donaldson, Earl and Muratore Reference Donaldson, Earl and Muratore2010; Wong and Earl Reference Wong and Earl2009). High reliability coefficients in these articles indicated that such combination was justified. In the present article, more substantive evidence is offered using CFA.
Outcomes in Adaptation is specified by retirement adjustment, wellbeing and life satisfaction. Described previously, these variables share common characteristics and all measure psychological retirement outcomes. Therefore, they should also share a substantial proportion of variation.
Aim and hypotheses
The aim of the present article is twofold. First, to demonstrate the advantage of combining conceptual and theoretical perspectives in defining the role of predictor variables in the retirement process. With such frameworks to guide retirement research, targeted hypotheses can be formed and tested and research can be better integrated. Second, to test the influence of resources on the retirement process proposed by this framework by developing and testing a model. The model developed in the present article clarifies several important details about the retirement process: (a) the existence of underlying constructs, (b) the role of resources, and (c) direct and indirect effects among phases themselves. Future research can build on these findings to determine which variables influence resources. Hypotheses are formally stated below, in the order that they are tested:
• Hypothesis 1: Individual CFAs will confirm latent variables for Resources, Pre-retirement, Transition and Outcomes in the Adaptation phase.
• Hypothesis 2: The hypothesised model displayed in Figure 2 will fit the data well with minimal modification.
• Hypothesis 3: Resources will have a significant influence on Pre-retirement, Transition and Outcomes in Adaptation.
• Hypothesis 4: Pre-retirement and Transition should influence Outcomes in Adaptation.
• Hypothesis 5: Pre-retirement should indirectly influence Outcomes in Adaptation via Transition, in view of evidence that planning can ease workforce exit (Taylor and Doverspike Reference Taylor, Doverspike, Adams and Beehr2003).
Method
Ethics approval for the study was submitted and provided by the university's Human Research Ethics Advisory Panel (Psychology) prior to data collection. Our goal was to secure a minimum sample of 500 participants so that we could factor analyse our measures and test our structural equation model with some confidence. The study was advertised electronically in the National Seniors Australia and Seniors Card newsletters, in which New South Wales members aged 45 years and over, who nominated themselves as having permanently left full-time work, were invited to complete an online survey by clicking a link or requesting a paper survey (equivalent versions were created). By telephoning a dedicated line or e-mailing a dedicated e-mail address and leaving their details, participants could request a paper version to be posted to them. In addition, 600 surveys were posted to a random selection of New South Wales members, to reach a sample of members who were not in e-mail contact. Participation was voluntary and no incentive was offered. Online, participants indicated their consent by clicking ‘I agree’ after reading the information sheet and in paper versions participants signed a consent form. Participants were screened from the study if they indicated their status as ‘not retired’ and either did not indicate a retirement age or reported engaging in full-time work that was paid (similar to established criteria used by Reitzes and Mutran Reference Reitzes and Mutran2004). Factor analysis, descriptive statistics and structural equation modelling analyses were conducted in Mplus 6.12 (Muthén and Muthén Reference Muthén and Muthén2010).
Participants
The final sample included 550 individuals, after excluding eight cases that were identified as multivariate outliers and excluded according to recommended criteria (Tabachnick and Fidell Reference Tabachnick and Fidell2007). Data from online and paper surveys were combined, after confirming that mean differences on all outcome variables were non-significant.
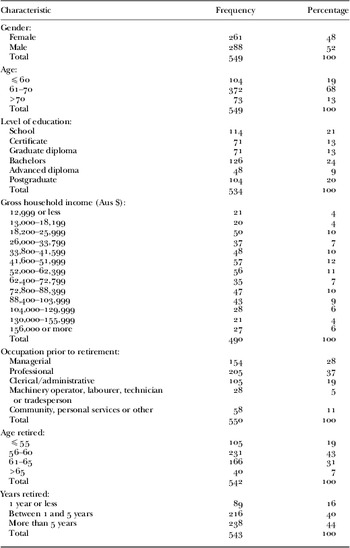
Slightly more males (52%) than females (48%) participated, with an average age of 64.26 years (standard deviation (SD)=5.30). Participants retired at the average age of 58.80 (SD=4.63), and had spent an average of 5.39 years (SD=4.85) in retirement. Approximately 16 per cent of the sample had spent a year or less in retirement. The median income bracket of the sample was Aus $52,000–62,399. Participants were highly educated, with 51 per cent holding a bachelor degree or above (including 19% with a postgraduate degree). The majority of participants held managerial (28%), professional (37%), or clerical or administrative (19%) roles prior to retirement. For more detail, see Table 1.
Sample demographics

Notes: Total indicates the total number of participants who responded to that question.
Measures
Sample characteristics
Single items were used to measure age, gender, gross household income, education, occupation prior to retirement and number of years retired.
RPQII
Retirement planning was measured using the RPQII (Muratore and Earl Reference Muratore and Earl2010). The RPQII measures planning across the three domains of public protection (behaviours aimed at accessing government benefits), self-insurance (personal financial preparations made by individuals to optimise wealth in later life) and self-protection (personal non-financial preparations made by individuals to maintain health and wellbeing in later life). The measure represents progress towards comprehensive measurement of retirement preparation (Adams and Rau Reference Adams and Rau2011).
Participants rated the planning effort that they had invested in each of the 28-items from 1 (a very small amount of effort) to 5 (a very large amount of effort). Sample items include: ‘looking into and/or applying for an Age Pension, Pension Loans Scheme (income and age eligibility criteria)’ (public protection); ‘calculated your living cost in retirement, or estimated your financial needs during retirement’ (self-insurance); and ‘developed new interests or skills with formal instruction or your own initiative’ (self-protection). Average planning effort was calculated for each domain, such that a higher score indicated greater planning effort. The factors have shown good internal consistency (α=0.85 for public protection, 0.88 for self-insurance and 0.80 for self-protection; Muratore and Earl Reference Muratore and Earl2010). In the present sample, Cronbach α for the domains were: 0.86 for public protection, 0.89 for self-insurance and 0.84 for self-protection.
Exit conditions
Exit conditions were measured by degree of choice in the decision to retire (1=no choice at all to 4=complete choice); amount of say in the timing of retirement (1=no say at all to 4=complete say); difficulty in making the decision (1=very difficult to 5=very easy); and how prepared the individual was for retirement (1=not at all prepared to 5=extremely well prepared) (Wells et al. Reference Wells, De Vaus, Kendig, Quine and Petralia2006). In the present study, a new variable, named control, was created by combining scores from choice in the decision and say in the timing, because preliminary analysis showed that these variables were highly correlated (r=0.80). These items were combined to avoid problems of multicollinearity (Tabachnick and Fidell Reference Tabachnick and Fidell2007).
Financial resources
Money perception was measured using a single item (1=not enough money, 2=just enough, 3=comfortably well off). Subjective indicators are expected to capture more accurately the gap between expenses and available funds and hence be more strongly related to outcomes such as adjustment and wellbeing (Burr, Santo and Pushkar Reference Burr, Santo and Pushkar2011). Preliminary analysis revealed that only 5.6 per cent of the sample (or 31 participants) selected the bottom category of not enough money and so the lower two categories were combined.
Health resources
Participants were asked to rate their current physical health (1=poor to 5=excellent), as per previous research (Han and Hong Reference Han and Hong2011; Kosloski, Ekerdt and Deviney Reference Kosloski, Ekerdt and Deviney2001; van Solinge and Henkens Reference van Solinge and Henkens2008). Subjective indicators of health provide important information and sound predictive validity (Franklin and Tate Reference Franklin and Tate2009; Schwingel et al. Reference Schwingel, Niti, Tang and Ng2009).
Relationship
Relationship was measured by two items indicating status (1=married or partnered, 2=widowed, divorced, separated, single or dating) and satisfaction (1=completely dissatisfied to 10=completely satisfied). These were combined into a single item indicating relationship status and satisfaction (1=partnered dissatisfied, 2=partnered satisfied, 3=no partner, 4=partnered highly satisfied, 5=partnered completely satisfied). Preliminary analysis of outcome means for each of the categories confirmed that this ordering was appropriate.
Mastery
Mastery was measured using the Mastery Scale (Pearlin and Schooler Reference Pearlin and Schooler1978). Example items include ‘I often feel helpless in dealing with the problems of life’ and ‘What happens to me in the future mostly depends on me’. Participants rate the seven items from 1=strongly disagree to 4=strongly agree, so that higher scores indicate greater mastery. Previous research has found good internal consistency of 0.84 (e.g. Kim and Moen Reference Kim and Moen2002). The Cronbach α coefficient for the present sample was 0.88.
Retirement adjustment
Retirement adjustment was measured using the 13-item scale from the Healthy Retirement Project (Wells et al. Reference Wells, De Vaus, Kendig, Quine and Petralia2006). Participants rated their agreement from 1=strongly disagree to 5=strongly agree to statements such as ‘I am well adjusted to the changes’ and ‘People don't respect me as much now that I'm retired’. The scale has shown high internal consistency (Cronbach α coefficient=0.81 and 0.83; Wells et al. Reference Wells, De Vaus, Kendig, Quine and Petralia2006; Wong and Earl Reference Wong and Earl2009). In the present study, the Cronbach α coefficient was 0.90.
Wellbeing
Psychological wellbeing was measured using the General Health Questionnaire (GHQ-12; Goldberg and Williams Reference Goldberg and Williams1988). The GHQ-12 has shown particular utility with older individuals and in community-based surveys (Bowling Reference Bowling1997; Cheung Reference Cheung2002; Clarke and Clarkson Reference Clarke and Clarkson2009). Example items include ‘I have recently been able to face up to my problems’ and ‘I have recently lost much sleep over worry’. Participants rated the frequency with which they had experienced each of the 12 items over the past two weeks from 0=not at all to 3=much more than usual. In the present study, the Cronbach α coefficient was 0.87, comparable to previous studies.
Life satisfaction
Life satisfaction was rated using a single item, ‘Overall, how satisfied are you nowadays with your life as a whole?’ from 1=completely dissatisfied to 10=completely satisfied (Campbell, Converse and Rodgers Reference Campbell, Converse and Rodgers1976; Easterlin Reference Easterlin2009; Rodgers and Converse Reference Rodgers and Converse1975). Similar measures with seven or more scale points have produced sufficient variability for investigation and are considered meaningful (Easterlin Reference Easterlin2009; Gerstorf et al. Reference Gerstorf, Ram, Estabrook, Schupp, Wagner and Lindenberger2008; Pinquart and Schindler Reference Pinquart and Schindler2007).
Data analysis and fit statistics
The decisions and assumptions required by structural equation models are reviewed next. To ensure completeness of reporting and validity of results, contemporary guidelines were followed (Brown Reference Brown2006; Kline Reference Kline2011). Analyses were conducted in Mplus 6.12 (Muthén and Muthén Reference Muthén and Muthén2010) and maximum likelihood estimation was used. Maximum likelihood is the most widely recommended and used estimator in structural equation models (Kline Reference Kline2011). Research suggests that where categorical variables have at least five responses and are relatively normally distributed, the maximum likelihood estimation can be used without substantial bias in results (Hancock and Mueller 2006). For dichotomous variables (e.g. money perception), maximum likelihood estimation with integration can be used (Muthén and Muthén Reference Muthén and Muthén1998–2010).
Given the continued debate on the extent of the influence of non-normality and the difficulty in establishing multivariate normality (Tabachnick and Fidell Reference Tabachnick and Fidell2007), an estimator that adjusted for non-normality was chosen. The MLR estimator in Mplus was used, because it provides maximum likelihood estimation with robust standard errors and uses full information maximum likelihood (FIML) to address missing data (Muthén and Muthén Reference Muthén and Muthén1998–2010). The MLR estimator has been used in wider research to address non-normality and missing data (Bossaert et al. Reference Bossaert, Doumen, Buyse and Verschueren2011; Chen et al. Reference Chen, Hughes, Liew and Kwok2010; Natale, Aunola and Nurmi Reference Natale, Aunola and Nurmi2009).
Consensus about the degree to which variables can deviate from normality without substantially biasing results has not been reached (Hancock and Mueller 2006). Statistical tests of these parameters can be sensitive to sample size and so recommendations to evaluate absolute values were followed (Kline Reference Kline2011). In the present sample, skewness values ranged from −1.53 to 0.85. Kurtosis values ranged from −1.97 to 2.05. These values suggested that results should not be unduly biased by univariate non-normality (Hancock and Mueller 2006). Nevertheless, univariate normality does not guarantee multivariate normality, which cannot be readily established (Tabachnick and Fidell Reference Tabachnick and Fidell2007).
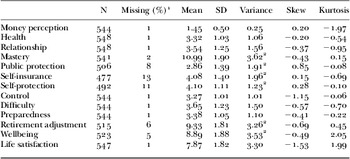
The data set was relatively complete (see Table 2); only five of the variables had greater than 3 per cent missing data, with the highest proportion of missing data on the self-insurance subscale of the RPQII (13%). The sample as a whole contained 64 per cent complete cases. Listwise deletion only produces unbiased results in an structural equation model if cases are missing completely at random (a strict assumption that does not often hold in reality; Enders Reference Enders2010). Furthermore, the number of available cases would drop from approximately 550 to 353, reducing power. Accordingly, FIML was used in the present study, because it estimates parameters using all available data, relies on the less stringent assumption that cases are missing at random and is highly recommended (Enders Reference Enders2010; Hancock and Mueller 2006).
Missing data, mean, standard deviation (SD), variance, skew and kurtosis values for all observed variables

Notes: 1. Data were rounded to the nearest whole number. 2. Variances for these variables have been rescaled as described previously.
Recommended fit statistics and criteria were used: Chi-square statistic, the comparative fit index (CFI), the Tucker–Lewis index (TLI), the root mean square error of approximation (RMSEA) with confidence interval, and the standardised root mean square residual (SRMR) (Boomsma Reference Boomsma2000; Brown Reference Brown2006; MacCallum and Austin Reference MacCallum and Austin2000). Adequate fit was shown by CFI>0.90, TLI>0.90, RMSEA<0.08 (with a confidence interval upper limit of <0.08) and SRMR<0.08. Good fit was shown by CFI>0.95, TLI>0.95, RMSEA<0.06 (with a confidence interval upper limit of <0.06) and SRMR<0.05.
In more complex models where there was disagreement between Chi-square and other fit indices, the other indices were given greater weight in evaluating model fit (Brown Reference Brown2006), because the Chi-square test can be overly sensitive with larger sample sizes, complex models or missing data (Brown Reference Brown2006; Schermelleh-Engel, Moosbrugger and Müller Reference Schermelleh-Engel, Moosbrugger and Müller2003). In addition to indices that described the overall fit of the model, the solution was evaluated using local fit and substantive theory (Bollen and Long Reference Bollen and Long1993). Specifically, standardised residuals, modification indices and parameter estimates were checked for out-of-range values and meaningfulness, as recommended (Brown Reference Brown2006).
Results
Key variables
Descriptive statistics for all observed variables are shown in Table 2. Variables were checked for ill-scaling (Kline Reference Kline2011) and, where required, variances were rescaled to between 1 and 10, as recommended by Mplus developers (Muthén and Muthén Reference Muthén and Muthén1998–2010). Variables whose scales had substantive meaning (e.g. money perception) were not rescaled, so that this meaning was preserved (Kline Reference Kline2011). All analyses were conducted on raw individual data.
Testing the measurement model using CFA
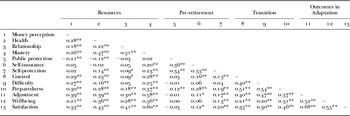
Establishing the validity of the measurement model prior to running the full structural equation model is recommended practice (Anderson and Gerbing Reference Anderson and Gerbing1988; Kline Reference Kline2011; Weston and Gore Reference Weston and Gore2006). Bivariate correlations among factor indicators are shown in Table 3. The high correlations among planning domains (Pre-retirement), transition indicators (Transition) and outcome indicators (Outcomes in Adaptation) suggest that these variables will likely form latent variables. Within resources, however, only mastery and physical health were highly correlated, suggesting that these resources may be distinct from relationship and money perception. Individual CFAs were conducted to confirm these expectations. Pre-retirement, Transition and Outcomes in Adaptation had only three indicators each and, therefore, these models were just identified. Consequently, fit indices were not evaluated for these models (Brown Reference Brown2006). Instead, plausibility of factors was inferred from standardised factor loadings (greater than 0.3), small standardised residuals (less than 2.58), large R 2 (above 0.3) and significant variance of the factors (Brown Reference Brown2006).
Bivariate correlations among factor indicators for Resources, Pre-retirement, Transition and Outcomes in Adaptation

Significance levels: * p<0.05, ** p<0.01.
Resources
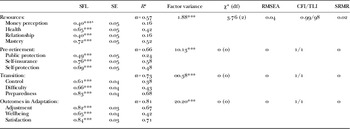
Shown in Table 4, fit statistics of the Resources factor indicated good fit: MLR χ2 (degrees of freedom=2)=3.76 (p>0.05), CFI=0.99, TLI=0.98, RMSEA=0.06 (although a wide confidence interval, 90% CI 0–0.10) and SRMR=0.015. However, this good fit may be a result of estimating a parsimonious model in a large sample (MacCallum, Browne and Sugawara Reference MacCallum, Browne and Sugawara1996). Indeed, factor loadings of Resources indicators were substantially different, with the loadings of money perception and relationship almost half the size of those of mastery and health. Similarly, although health and mastery displayed adequate R 2 values, money perception and relationship were not explained well by the latent Resources factor. Therefore, resources were included as individual covariates in the structural model, because a minimum of three factors per indicator is recommended for identification purposes (Brown Reference Brown2006).
Factor loadings, scale reliability and fit statistics of measurement models

Notes: SFL: standardised factor loadings. SE: standard error. df: degrees of freedom. RMSEA: root mean square error of approximation. CFI: comparative fit index. TLI: Tucker–Lewis index; SRMR: standardised root mean square residual. 1. This is interpreted as a logistic regression coefficient (Muthén and Muthén Reference Muthén and Muthén1998–2010).
Significance level: *** p<0.001.
Pre-retirement
Shown in Table 4, the factor variance was significant and all items displayed substantial factor loadings. In addition, the R 2 values for self-insurance and self-protection were high, indicating that the latent factor adequately accounted for variance in these indicators. Public protection R 2 was slightly lower than 0.3, suggesting that the latent variable may not adequately explain this indicator. However, as the three indicators are part of a single measure for retirement planning, all three substantively contributed to the meaning of the Pre-retirement factor. Therefore, a single latent factor for Pre-retirement, indicated by public protection, self-insurance and self-protection was used in the structural model.
Transition
Shown in Table 4, all indicators displayed high loadings and the factor variance was significant. In addition, R 2 values for all indicators were high, suggesting that the latent variable Transition adequately explains these indicators. Therefore, a single latent factor for Transition, indicated by control, difficulty and preparedness, was included in the structural model.
Outcomes in Adaptation
Shown in Table 4, all indicators displayed high loadings and the factor variance was significant. The R 2 value for wellbeing was slightly lower than those for retirement adjustment and life satisfaction. However, all R 2 values were above 0.3, suggesting that variance in the three outcome measures is adequately captured by the latent variable. Therefore, a single latent factor for Outcomes in Adaptation, indicated by retirement adjustment, wellbeing and life satisfaction, was included in the structural model.
Finally, a model that simultaneously included Pre-retirement, Transition and Outcomes in Adaptation was tested to ensure sufficient discriminant validity among these factors (Brown Reference Brown2006). The model showed adequate to good fit. MLR χ2 (24)=78.74 (p<0.05), CFI=0.96, TLI=0.93, RMSEA=0.06 (90% CI 0.05–0.08), SRMR=0.04. Covariances among factors ranged from 0.21 to 0.71 (between Transition and Outcomes in Adaptation), below the suggested cut-off of 0.80 (Brown Reference Brown2006). To check that Transition and Outcomes in Adaptation factors were sufficiently distinct, an additional CFA was run where the six indicators from these factors loaded on a single latent variable. This solution showed poor fit χ2(9)=148.02 (p<0.05), CFI=0.85, TLI=0.75, RMSEA=0.17 (90% CI 0.14–0.19), SRMR=0.07. Together, these results support an initial structural model with four manifest resource covariates and three latent variables of Pre-retirement, Transition and Outcomes in Adaptation.
Testing the initial structural model
To review, a structural equation model was proposed where resources influenced retirement phases and retirement phases influenced each other. Testing the measurement model suggested that indicators of Pre-retirement, Transition and Outcomes in Adaptation formed latent variables and that resources should be included as manifest variables. Indicators with the highest factor loadings were fixed to one for identification purposes (determined from individual factor models when factor variances were fixed to one and all indicators loaded freely). The model was over-identified with 48 degrees of freedom. The initial model showed adequate fit: MLR χ2 (48)=160.41 (p<0.05), RMSEA=0.07 (90% CI 0.06–0.08), CFI=0.94, TLI=0.90, SRMR=0.05.
Modifying the structural model
Two modifications were made to the model shown in Figure 2. First, the direct path from Pre-retirement to Outcomes in Adaptation was non-significant (standardised loading=−0.08, p=0.08). In the interest of model parsimony, this path was dropped (Brown Reference Brown2006). A scaled difference in Chi-squares test confirmed that deleting this path was appropriate, showing a non-significant change (change χ2(1)=3.16, p>0.001) (Brown Reference Brown2006; Muthén and Muthén Reference Muthén and Muthén1998–2010). This suggests that any effect of Pre-retirement on Outcomes in Adaptation is fully mediated by Transition. Second, previous research suggested that public protection has a negative (whereas other domains have a positive) relationship with income (Muratore and Earl Reference Muratore and Earl2010). Therefore, this path was included to avoid misspecification (Brown Reference Brown2006), supported by a large modification index (27.58) and large standardised expected parameter change (−0.23). A scaled difference in Chi-squares test (Brown Reference Brown2006) confirmed that including this path was appropriate, showing a significant change (change χ2 (1)=41.43, p<0.001). Thus, a lower income was associated with a higher level of public protection planning, suggesting that income has differential effects on planning domains. Further modification indices suggested that constructing paths between Transition indicators and Outcomes in Adaptation indicators would improve model fit, however, as these additions were not theoretically justifiable the model was not altered further (Brown Reference Brown2006). Instead, this is noted as an area of misfit and future research is recommended. The final structural model with the modifications described above is shown in Figure 3.
Elements in the final structural equation model.

Assessing the final structural model
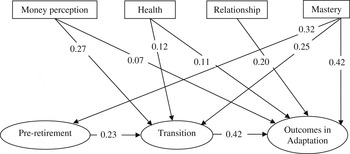
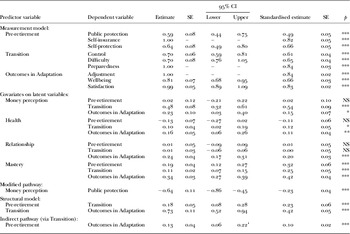
The final model, including the modifications described previously, showed adequate to good fit: χ2 (48)=134.25 (p<0.05), RMSEA=0.06 (90% CI 0.05–0.07), CFI=0.95, TLI=0.93, SRMR=0.04. Models with similar fit statistic values have been recently published (e.g. Boezeman and Ellemers Reference Boezeman and Ellemers2007; Carmeli et al. Reference Carmeli, Ben-Hador, Waldman and Rupp2009; Miner-Rubino and Cortina Reference Miner-Rubino and Cortina2007). Figure 4 shows a path diagram with standardised estimates and Table 5 shows detailed information about parameter estimates.
Standardised estimates for the final structural equation model.

Unstandardised estimates and confidence intervals (CI), and standardised estimates and significance, for the final structural model

Notes: SE: standard error. Estimated variances of the factors follow: Pre-retirement=1.32; Transition=0.78; Outcomes in Adaptation=2.34. 1. This CI was bootstrapped. Bootstrapped CIs are not available with the MLR estimator in Mplus. Therefore, the CI reported here was estimated using the ML estimator (Muthén and Muthén Reference Muthén and Muthén1998–2010). Simulation suggests that even under extreme non-normality (skew=3.25, kurtosis=20) estimates of CIs using bootstrapping and ML are acceptable (Enders Reference Enders2010).
Significance levels: * p<0.05, ** p<0.01, *** p<0.001. NS: not significant.
Discussed above, the indirect effect of Pre-retirement on Outcomes in Adaptation via Transition was also estimated (Muthén and Muthén Reference Muthén and Muthén1998–2010). Following recommendations, uncorrected bootstrapping was conducted to estimate the confidence interval for a significance test of the indirect effect (Fritz, Taylor and MacKinnon Reference Fritz, Taylor and MacKinnon2012; MacKinnon et al. Reference MacKinnon, Lockwood, Hoffman, West and Sheets2002). Shown in Table 5, the confidence interval did not contain zero, therefore, the indirect effect of Pre-retirement on Outcomes in Adaptation via Transition was concluded to be significantly different from zero.
Discussion
It is difficult to capture the retirement process due to complex connections among resources and phases (Feldman and Beehr Reference Feldman and Beehr2011; Wang and Shultz Reference Wang and Shultz2010). Researchers suggest that progressive models and analysis techniques can help us to unpack the retirement process (Burdenski Reference Burdenski2000; Zickar and Gibby Reference Zickar, Gibby, Adams and Beehr2003). Accordingly, a structural equation model was specified and tested in the present study. The model provides three key areas of insight into the retirement process: the existence of underlying constructs, the role of resources, and direct and indirect relationships among phases. Supporting hypothesis 2, this model fitted the data well with minimum modification. Together, these suggest several ways to improve retirement outcomes.
Existence of underlying constructs
Individual CFAs confirmed that indicators of Pre-retirement, Transition and Outcomes in Adaptation formed latent variables providing partial support for hypothesis 1. Building latent variables enables relationships to be estimated, substantially reducing measurement error (Kline Reference Kline2011). Therefore, researchers should continue to identify latent variables that capture the retirement process. A noteworthy question for future research is whether additional indicators can be added to these constructs to more completely represent the domains. For example, research suggests that characteristics of career and job may be meaningful to include (e.g. Wang and Shultz Reference Wang and Shultz2010). In addition, to elicit fruitful predictors for the Adaptation phase, researchers may draw on characteristics of work and activities in retirement that make these activities meaningful (e.g. McMunn et al. Reference McMunn, Nazroo, Wahrendorf, Breeze and Zaninotto2009; Wahrendorf and Siegrist Reference Wahrendorf and Siegrist2010).
Contrary to hypothesis 1, Resources indicators did not form a latent variable. As a consequence, measurement error of resources could not be accounted for and the testing of several alternative models was prevented (outlined under ‘Limitations’). Future researchers should consider the possibility that, with different measures and within different samples, common variance of resources may be uncovered (MacCallum and Austin Reference MacCallum and Austin2000). If resources are indeed distinct, gathering multiple indicators of each so that these can be included as latent variables will at least allow measurement error to be reduced.
Role of resources in the retirement process
Supporting hypothesis 3, resources significantly influenced both phases and outcomes. Finances and health showed significant relationships with Transition and Outcomes in Adaptation. That is, individuals, who perceived their financial situation as comfortable and who reported better physical health, also reported more positive exit conditions and retirement outcomes. This corroborates previous research that a desirable exit is more easily achieved when finances are sufficient and health is good (Feldman and Beehr Reference Feldman and Beehr2011; Shultz and Wang Reference Shultz and Wang2007). Similarly, good health and a higher income have consistently shown positive relationships with retirement outcomes (Pinquart and Schindler Reference Pinquart and Schindler2007; Reitzes and Mutran Reference Reitzes and Mutran2004; Wang and Shultz Reference Wang and Shultz2010). With respect to the retirement decision, poor health can force individuals out of the workforce sooner than desired, whereas inadequate funds may force individuals to delay their retirement (Beehr et al. Reference Beehr, Glazer, Nielson and Farmer2000; Flynn Reference Flynn2010; Loi and Shultz Reference Loi and Shultz2007). Once retired, good health and finances enable individuals to participate in a greater range of desirable activities and these may buffer against the challenges of retirement (Gall and Evans Reference Gall and Evans2000; van Solinge and Henkens Reference van Solinge and Henkens2008).
It is interesting to note that although finances and health are traditionally central variables in retirement research (Beehr et al. Reference Beehr, Glazer, Nielson and Farmer2000), they showed a substantially weaker influence on retirement outcomes than either relationship or mastery. Recent research has observed this trend in other studies (van Solinge and Henkens Reference van Solinge and Henkens2005), particularly when variables such as expectations, exit conditions and psychological variables such as control are included in the model (Calvo, Haverstick and Sass Reference Calvo, Haverstick and Sass2009; Kim and Moen Reference Kim and Moen2002). Indeed, recent research suggests that the negative effects of income decline may be mediated by other psychological variables (Segel-Karpas, Bamberger and Bacharach Reference Segel-Karpas, Bamberger and Bacharach2013). Thus, relative predictive strength of resources and potential mediating effects are worthwhile areas for future research. In addition, more sensitive measures may need to be used in future research. Money perception was a dichotomous measure and health was measured on a five-point scale. These scales may have insufficiently captured the variation in the population and, as a consequence, displayed weaker relationships with outcomes.
Being in a relationship and satisfied predicted more positive outcomes, adding to a large body of evidence on the importance of positive relationships to life outcomes (see Reis and Gable Reference Reis, Gable, Keyes and Haidt2003; Wang and Shultz Reference Wang and Shultz2010). The finding is particularly noteworthy, because previous research that only measured marital status did not find that it predicted retirement adjustment (Donaldson, Earl and Muratore Reference Donaldson, Earl and Muratore2010). The discrepancy in findings between the present study and Donaldson, Earl and Muratore (Reference Donaldson, Earl and Muratore2010) corroborates previous assertions that it is quality not quantity of social relationships that predict positive outcomes (Taylor and Doverspike Reference Taylor, Doverspike, Adams and Beehr2003).
Accounting for all other resources, mastery showed a significant effect on Pre-retirement, Transition and Outcomes in Adaptation. This supports previous findings that control plays a pivotal role in general wellbeing (Hobfoll Reference Hobfoll2002; Kostka and Jachimowicz Reference Kostka and Jachimowicz2010; Quine et al. Reference Quine, Wells, De Vaus and Kendig2007). A higher level of mastery was associated with greater reported effort invested in planning in Pre-retirement, supporting claims that a sense of control elicits long-term planning (Anderson et al. Reference Anderson, Li, Bechhofer, Mccrone and Stewart2000). A higher level of mastery was also associated with reporting a more positive transition. Research corroborates this by showing the converse, that when retirement is a result of circumstances outside of the individual's control, the transition is more likely to be perceived as involuntary (Szinovacz and Davey Reference Szinovacz and Davey2005a). Finally, the association of a higher mastery with more positive retirement outcomes replicates previous findings that a sense of control is material to a range of outcomes (Bye and Pushkar Reference Bye and Pushkar2009; Montpetit and Bergeman Reference Montpetit and Bergeman2007).
Direct and indirect effects among phases
In line with existing literature (Adams and Rau Reference Adams and Rau2011; Sterns and Subich Reference Sterns, Subich, Brown and Lent2004), earlier phases affected later phases. Partially supporting hypothesis 4, Transition acted on Outcomes in Adaptation, such that those who reported more favourable exit conditions also reported more favourable outcomes. This is in line with previous research about the advantage of trouble-free workforce exit (Calvo, Haverstick and Sass Reference Calvo, Haverstick and Sass2009; de Vaus et al. Reference de Vaus, Wells, Kendig and Quine2007; Donaldson, Earl and Muratore Reference Donaldson, Earl and Muratore2010). Further, because individuals in the present sample were retired for an average of five years, the result adds to our knowledge about the permanence of the relationship between favourable exit conditions and positive retirement outcomes.
Contrary to hypothesis 4, Pre-retirement showed no direct effect on Outcomes in Adaptation, however, it did directly predict Transition (in line with hypothesis 5). Those who reported a higher level of pre-retirement planning also reported more favourable exit conditions. A meta-analysis conducted by Topa et al. (Reference Topa, Moriano, Depolo, Alcover and Morales2009) showed a significant relationship between planning and making the retirement decision. The present study extends this finding by suggesting that greater planning effort is related to more positive exit conditions. This adds to current knowledge that planning helps individuals to feel prepared, more positive towards retirement and better able to make the transition (Kim, Kwon and Anderson Reference Kim, Kwon and Anderson2005; Mutran, Reitzes and Fernandez Reference Mutran, Reitzes and Fernandez1997; Wong and Earl Reference Wong and Earl2009).
Supporting hypothesis 5, Pre-retirement indirectly predicted Outcomes in Adaptation via Transition. A higher level of planning was associated with improved exit conditions which in turn produced a more positive retirement experience. This supports earlier research that showed planning could improve retirement outcomes even when exit conditions were poor (Elder and Rudolph Reference Elder and Rudolph1999). Planning may ease the retirement transition in a number of ways, including facilitating the development of realistic expectations, reducing role ambiguity and improving ability to structure time (Carter and Cook Reference Carter and Cook1995; Mutran, Reitzes and Fernandez Reference Mutran, Reitzes and Fernandez1997; Taylor and Doverspike Reference Taylor, Doverspike, Adams and Beehr2003). In addition, evidence suggests that planning can help individuals to feel more prepared for changes in identity, status, roles, time allocation, relationships and activity (Lo and Brown Reference Lo and Brown1999; Noone, Stephens and Alpass Reference Noone, Stephens and Alpass2009). In particular, financial planning, because it enhances post-retirement ability to meet living, medical, leisure and familial costs, may help individuals to feel better prepared for the transition (Han and Hong Reference Han and Hong2011).
Improving retirement outcomes (Outcomes in Adaptation)
The final model, shown in Figure 4, suggests several ways to improve retirement outcomes. First, improving mastery at any stage of retirement should ultimately improve outcomes. Second, improving exit conditions should produce superior outcomes. This may be achieved by promoting retirement planning, or by building key resources. Third, improving money perception, health, relationship or mastery can directly improve retirement outcomes. A better understanding of the interaction among resources will point to effective interventions, e.g. improving social capital may help to foster a sense of mastery (Nyqvist, Forsman and Cattan Reference Nyqvist, Forsman and Cattan2013). Note that these conclusions hinge on further model testing, as discussed below. However, these are in line with general life transition frameworks that posit adjustment is facilitated in cases where the characteristics of the individual, their situation, support and strategies are in favour of assets rather than liabilities (Hopkins, Roster and Wood Reference Hopkins, Roster and Wood2006; Schau, Gilly and Wolfinbarger Reference Schau, Gilly and Wolfinbarger2009; Schlossberg Reference Schlossberg1981).
Given the importance of exit conditions to longer-term adjustment, it is incumbent on organisations to provide desirable work opportunities and counter age stereotypes (Callanan and Greenhaus Reference Callanan and Greenhaus2008; Quine et al. Reference Quine, Wells, De Vaus and Kendig2007). For example, organisations can provide flexible working arrangements, opportunities to volunteer or mentor, or design new roles that improve quality of work, reduce physical demands and encourage social support at work (Oakman and Wells Reference Oakman, Wells and Kumashiro2010; Peeters and van Emmerik Reference Peeters and van Emmerik2008; Wöhrmann, Deller and Wang Reference Wöhrmann, Deller and Wang2013). In general, organisations and government need to do more to promote age-friendly work environments, relevant skills training and desirable work options (Johnson Reference Johnson2009; McKelvey Reference McKelvey2009).
Limitations and future directions
As with all research, there are limitations to the inferences that can be drawn from results. Participation was voluntary and selection effects may have influenced results (Kosloski, Ekerdt and Deviney Reference Kosloski, Ekerdt and Deviney2001). The majority of respondents had tertiary qualifications, held managerial or professional positions prior to retirement, and received substantial income in retirement. It should be noted that the Association of Superannuation Funds of Australia (ASFA) recommend an income of Aus $57,665 per year for a comfortable retirement lifestyle and this matches the midpoint of salaries in our sample (Aus $52,000–62,399). Accordingly, the model also needs to be tested in populations that hold fewer tertiary qualifications, non-profession positions prior to retirement, with modest retirement lifestyles (i.e. Aus $33,358 per year; ASFA 2014). In addition, data were collected within Australia, and may not generalise to other countries that are not as economically developed (Beehr and Bennett Reference Beehr, Bennett, Shultz and Adams2007; Szinovacz Reference Szinovacz, Adams and Beehr2003) or those that impose a mandatory retirement age (van Solinge Reference van Solinge2007). Future research may also consider whether models hold equally for males and females. For example, certain resources may be differentially valued by males and females (Kubicek et al. Reference Kubicek, Korunka, Raymo and Hoonakker2011).
Self-report measures were used in the present article. Although commonly used, some researchers may argue that retrospective measures are a poor substitute for pre- and post-test measures collected in ‘real time’. Wells et al. (Reference Wells, De Vaus, Kendig and Quine2009: 308) investigated the relationship between real and retrospective measures, concluding that ‘retrospective measures may provide a valuable measure of how well people view themselves as managing now’. It is acknowledged that although irrefutably useful (Chan Reference Chan, Lance and Vandenberg2009), these may be biased due to poor recall, social desirability and common method bias (Mojza et al. Reference Mojza, Lorenz, Sonnentag and Binnewies2010; Podsakoff et al. Reference Podsakoff, Mackenzie, Lee and Podsakoff2003).
Similarly the use of money perception rather than household income may be queried. However, Burr, Santo and Pushkar (Reference Burr, Santo and Pushkar2011) support our finding that the subjective perception of financial status is a significant predictor of affective wellbeing and therefore worthy of investigation. It may be more important to consider whether people perceive that finances are adequate for their needs rather than assuming that a dollar amount has the same value for all people. To remedy these, future researchers need to first draw on diverse populations, e.g. those who report negative outcomes, and collect data from different cultures (Chi Reference Chi2011; Humpel et al. Reference Humpel, O'Loughlin, Wells and Kendig2009). Second, future researchers need to draw on measures with multiple items and domains, objective measures, reports from others, and match measurement timing closely with when the event of interest occurs (Bolger, Davis and Rafaeli Reference Bolger, Davis and Rafaeli2003; Menard Reference Menard2008).
In addition, spurious or reciprocal effects may have affected results. For example, planning may improve exit conditions, however, individuals who are more likely to plan may be in a better position to control their transition (de Vaus and Wells Reference de Vaus and Wells2004). Voluntary retirement predicts positive outcomes, however, being in control of one's retirement may be a part of a general pattern of capability (Greller and Simpson Reference Greller and Simpson1999). Similarly, resources are argued to improve outcomes, however, these may simply reflect that the individual exists in a context that provides better opportunities (Lent Reference Lent2004). All variables were measured at one point in retirement, meaning that the direction of relationships is inferred and causality cannot be established (MacCallum and Austin Reference MacCallum and Austin2000). There are also consequences for interpreting the observed effect of resources on earlier phases. The model specifies relationships between present resource level and pre-retirement planning and exit conditions. Because resources were measured during retirement, this specification is based on the assumption that resource level in retirement serves as a proxy for resource level at the time when pre-retirement planning and exit conditions occurred. Given that resources help to build other resources and protect from resource loss (Hobfoll Reference Hobfoll2002), this tenet is not wholly unreasonable. However, it does mean that differences in the predictive strength of resources across phases should be interpreted with caution. These differences could be due to either the relative importance of resources across phases or simply due to the variation in resource level over time. Thus, the relatively small proportion of variance accounted for in Pre-retirement compared to other phases may simply reflect that present resource level has changed substantially since Pre-retirement.
Future research is needed with longitudinal measurement over the entire retirement process to interpret this effect accurately. Accordingly, future researchers need to draw on alternative models (discussed next) or separate the measurement of predictors and outcomes in time (Ployhart and Vandenberg Reference Ployhart and Vandenberg2010).
Alternative models
The model specified in the present study was supported by the data, however, it cannot be said that this is the most valid or only possible model (Hancock and Mueller 2006). To further support the present model, future research is needed to investigate whether this model fits better than a series of alternative models and needs to identify equivalent models (Hancock and Mueller 2006). For example, one alternative is to specify a basic role for resources, as per a resource perspective (Wang, Henkens and van Solinge Reference Wang, Henkens and van Solinge2011), where resources are influenced by retirement phases and in turn predict outcomes. For example, planning for retirement may facilitate effective mobilisation of resources to deal with the transition, thus improving retirement outcomes (Alfermann, Stambulova and Zemaityte Reference Alfermann, Stambulova and Zemaityte2004). A second alternative is to specify a reciprocal relationship between phases and resources, such that better resources improve planning and exit conditions, which in turn improve resources. For example, mastery can shape and be shaped by life experiences, such as stressors, planning and exit conditions (Avison and Cairney Reference Avison, Cairney, Zarit, Pearlin and Schaie2003; Moore et al. Reference Moore, Grunberg, Greenberg and Sikora2007; Prenda and Lachman Reference Prenda and Lachman2001). A reciprocal relationship may explain why individuals with greater resources are better able to realise new resources from investing current resources (Hobfoll Reference Hobfoll2001). Note that these represent only two examples of the many possible models that can be specified.
It was not possible to test these alternatives in the present study because resources did not form a single latent factor. Thus, alternative models would show worse fit than the hypothesised model simply because they were more complex (Brown Reference Brown2006). To describe definitively the relationship among resources, phases and later outcomes, future research needs to be longitudinal, measuring resource level at each phase along with phase circumstances, such as planning and exit conditions.
An additional line of inquiry not pursued in the present article is the relationship among demographics and resources, e.g. we might expect that older age is associated with poorer objective health but better subjective health (possibly due to the relative point of comparison; Burr, Santo and Pushkar Reference Burr, Santo and Pushkar2011). Once the interaction between resources and outcomes is better understood, then research can logically extend to examining what influences resources themselves.
Conclusion
The importance of resources has a long history in retirement and wider psychological research (Hobfoll Reference Hobfoll1989, Reference Hobfoll2001, Reference Hobfoll2002; Schlossberg Reference Schlossberg1981). Although resources are generally acknowledged to play a role in the retirement process, direct testing of their relationship within a resource perspective framework has only recently appeared (Kubicek et al. Reference Kubicek, Korunka, Raymo and Hoonakker2011; Wang, Henkens and van Solinge Reference Wang, Henkens and van Solinge2011). Therefore, the present article provides a meaningful contribution by directly investigating the role of resources in the contemporary retirement process. In line with a resource perspective, key retirement resources showed direct effects on retirement outcomes (Wang, Henkens and van Solinge Reference Wang, Henkens and van Solinge2011). In addition, the model suggested that resources could influence the phases of Pre-retirement and Transition, supporting an extended role for resources in line with wider research (Hobfoll Reference Hobfoll2002).
In addition, the present article provides an important step towards representing the retirement process by including the many relationships among circumstances in phases, resources and Outcomes in Adaptation in a single model. Combining conceptual frameworks and theory to guide the specification of the model can lead to a superior solution than applying either alone. Such models have great utility in improving our understanding of relationships by offering insight into design and timing of interventions, and understanding mechanisms of influence such as indirect effects.