1. Introduction
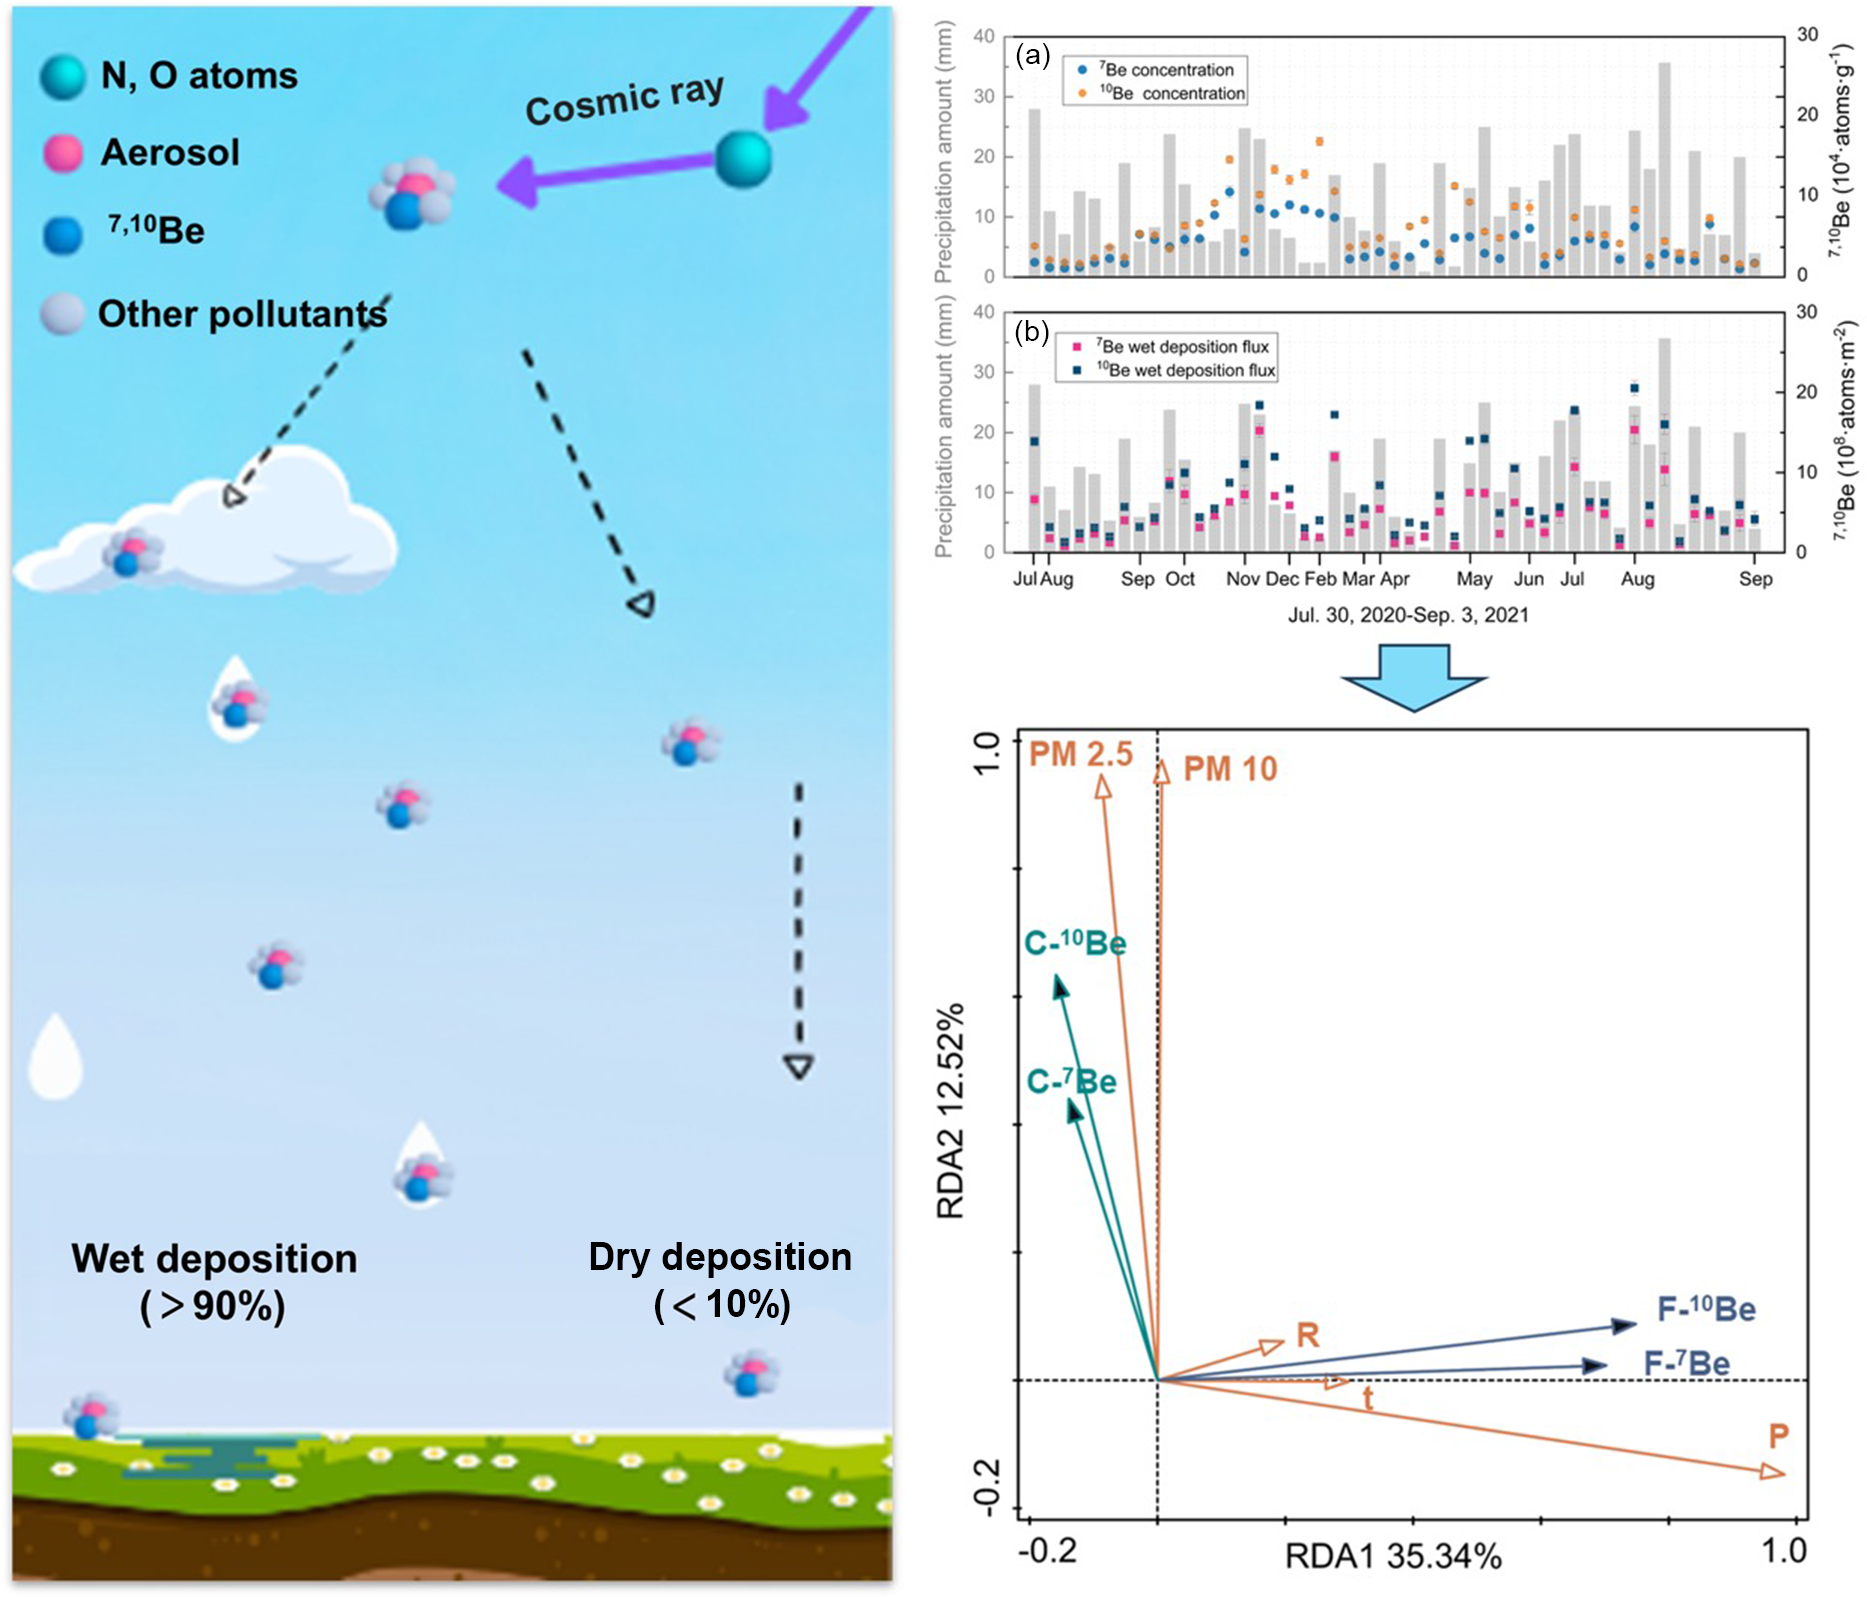
Beryllium-7 (7Be) and beryllium-10 (10Be) are naturally occurring radionuclide of cosmogenic origin, with half-lives of 53.29 days and 1.39 million years, respectively (Cressy Reference Cressy1974; Korschinek et al. Reference Korschinek, Bergmaier, Faestermann, Gerstmann, Knie, Rugel, Wallner, Dillmann, Dollinger, von Gostomski, Kossert, Maiti, Poutivtsev and Remmert2010). They are produced in the atmosphere through the collision reaction of high-energy cosmic rays with oxygen and nitrogen atoms, predominantly occurring in the lower stratosphere and the upper troposphere (Lal and Peters Reference Lal and Peters1967). Once formed, they rapidly adsorb onto submicron-scale atmospheric aerosols. Large-scale atmospheric transport events, such as dust storms, can further significantly influence the distribution and deposition of 10Be by carrying radionuclide-laden dust over long distances (Pham et al. Reference Pham, Chamizo, Mas Balbuena, Miquel, Martín, Osvath and Povinec2017, Reference Pham, Chamizo, Lopéz-Lora, Martín, Osvath and Povinec2020; Ternon Reference Ternon, Guieu, Löye-Pilot, Leblond, Bosc, Gasser, Miquel and Martín2010). These radionuclides are eventually removed from the atmosphere through both dry and wet deposition, with wet deposition accounting for over 90% of their removal (Brown et al. Reference Brown, Stensland, Klein and Middleton1989; Lal et al. Reference Lal, Malhotra and Peters1958) (see Figure 1). Consequently, precipitation contains both 7Be and 10Be, which carry valuable information about the Earth’s environment. By using 7Be or 10Be, either individually or in combination, researchers have successfully traced stratosphere-troposphere exchange, surface material migration, basin erosion processes, and paleo-precipitation changes (Kaste and Baskaran Reference Kaste and Baskaran2012; Kulan Reference Kulan2006; Lee et al. Reference Lee, Saleh, Banavali, Jonooby and Kuroda1985; Liu et al. Reference Liu, Fu, Bi, Zhang, Zhao, Xian and Zhou2022a; Zhou et al. Reference Zhou, Xian, Beck, Jull, An, Wu, Liu, Chen, Priller, Kutschera, Burr, Yu, Song, Cheng and Kong2016).
Graphic abstract of wet and dry deposition.

Detailed tracing of environmental change using 7Be and 10Be requires a thorough understanding of their deposition processes. For instance, in soil erosion studies, it is crucial to establish a reference site where 7Be reduction is due solely to radioactive decay, providing a baseline. The determination of such reference sites often relies on the 7Be deposition levels in precipitation within the study area. However, variations in terrain and meteorological conditions across different regions can lead to significant differences in 7Be and 10Be wet deposition. Even at similar latitudes, precipitation-related 7Be levels can differ by an order of magnitude, limiting the precision of these nuclides as tracers of environmental change (Ali et al. Reference Ali, Khan, Akhter, Rana, Rajput, Khattak, Malik and Hussain2011; González-Gómez et al. Reference González-Gómez, Azahra, López-Peñalver, Camacho-García, El Bardouni and Boukhal2006). This significant difference in 7Be concentration at geographically similar locations with varying precipitation suggests that deposition is influenced not only by global-scale factors, such as nuclide production, solar activity cycles, and aerosol residence time, but also by regional-scale precipitation patterns. Therefore, it is essential to analyze the deposition characteristics of 7Be and 10Be in precipitation across diverse geographical regions to establish a solid scientific foundation for their application as environmental tracers.
Globally, observations of 7Be in precipitation are predominantly concentrated in the middle and low latitudes of the Northern Hemisphere, primarily near oceans in regions characterized by high precipitation (Duenas et al. Reference Duenas, Gordo, Liger, Cabello, Canete, Perez and Torre-Luque2017; Kremenchutskii Reference Kremenchutskii2022; Mohan et al. Reference Mohan, D’Souza, Nayak, Kamath, Shetty, Kumara, Yashodhara, Mayya and Karunakara2018, Reference Mohan, D’Souza, Nayak, Kamath, Shetty, Kumara, Mayya and Karunakara2019; Yoon et al. Reference Yoon, Koh, Lee and Cho2016). Observations of 10Be in precipitation rely on accelerator mass spectrometry (AMS), but such studies remain scarce due to the technical constraints. In China, 7Be observations are similarly concentrated in the southeastern regions, where precipitation is abundant (Du et al. Reference Du, Baskaran and Du2019; Yi et al. Reference Yi, Zhou and Liu2007). Currently, the Xi’an Accelerator Mass Spectrometry Center is a leading domestic institution with extensive experience in 7Be and 10Be research (Liu et al. Reference Liu, Fu, Bi, Zhang, Zhao, Xian and Zhou2022a, Reference Liu, Fu, Wang, Bi, Zhang, Zhao, Xian, Cheng, Zhang, Zhou and Zhou2022b, Reference Liu, Fu, Zhang, Bi, Cui and Zhao2024; Zhang and Fu Reference Zhang and Fu2017). While the center has developed advanced techniques for analyzing 7Be and 10Be in aerosol samples, studies of these nuclides in precipitation are still in the method development stage, resulting in incomplete and intermittent observational data. Overall, there is a significant lack of data on 7Be and 10Be wet deposition in inland regions of China with low precipitation. This gap limits our understanding of annual deposition characteristics in these areas.
The purpose of this work is to gain a comprehensive understanding of the deposition levels, variation characteristics, and influencing factors of 7Be and 10Be in precipitation in Xi’an City. Utilizing AMS-measured data from the Xi’an Station collected between July 30, 2020, and September 3, 2021, this study examines the influence of precipitation on the temporal variation of total 7Be and 10Be concentrations and deposition fluxes during individual rain events.
2. Material and methods
2.1 Study site
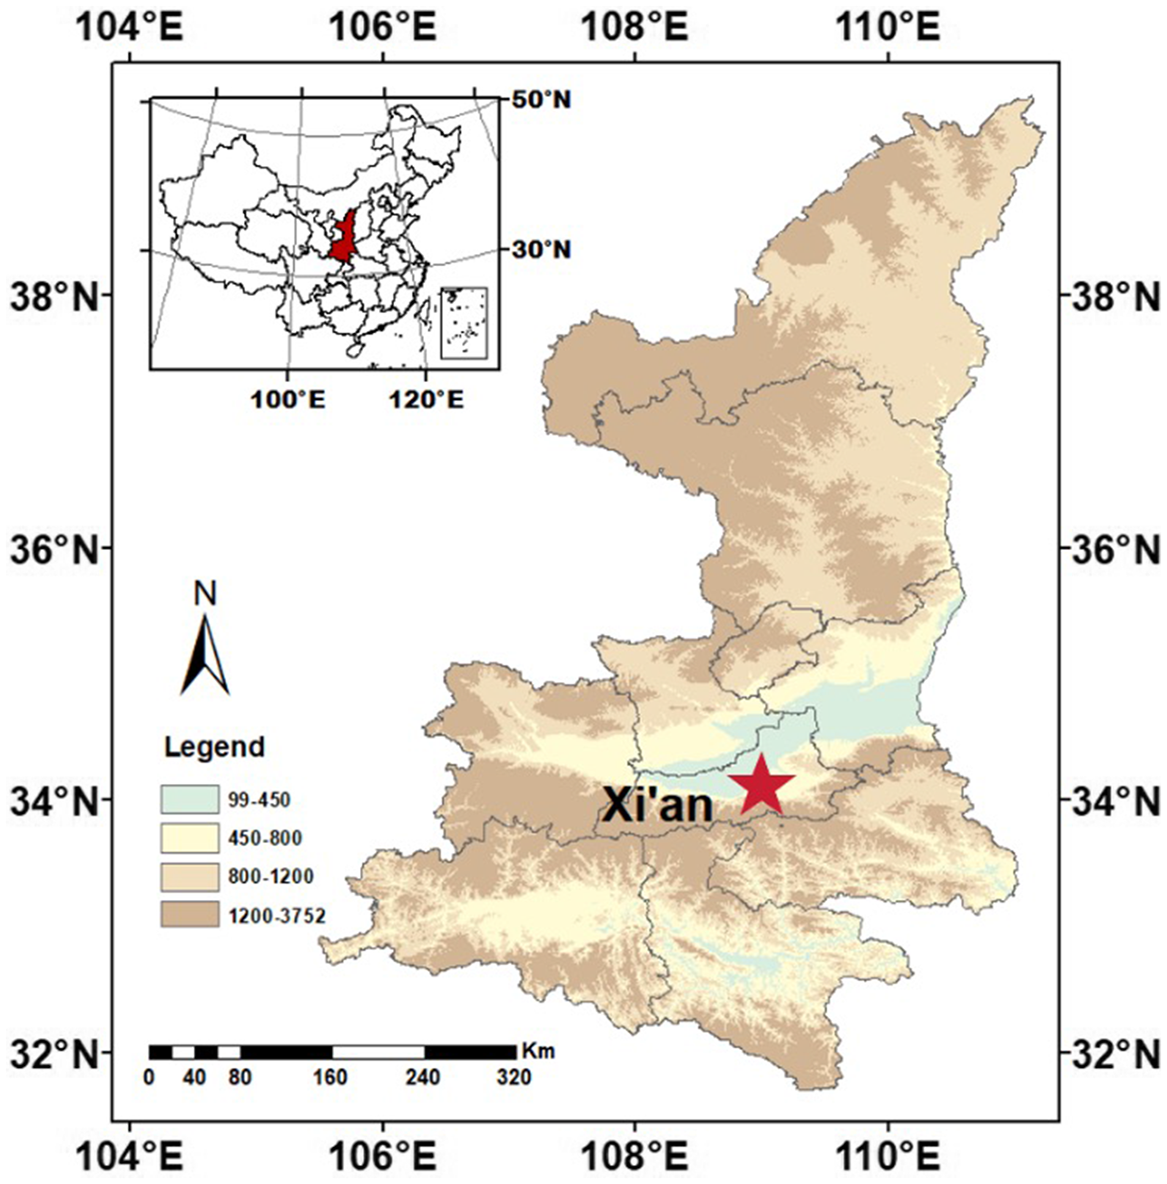
All water samples for this study were collected from the roof of the Xi’an Accelerator Mass Spectrometry Center (Xi’an, Shaanxi). Xi’an (34.22°N, 109.01°E) is an inland city in central China, bordered by the Loess Plateau to the north and the Qinling Mountains to the south (Figure 2). The region experiences a warm temperate, semi-humid, and semi-arid monsoon climate, characterized by hot, rainy summers and cold, dry winters. Annual precipitation ranges from 500 to 750 mm·yr–1. The prevailing wind direction is northeast, with an average annual wind speed of 1.8 m·s–1.
Sampling site location.

2.2 Rainwater collection and radiochemical treated
Fixed-interval sampling (e.g., weekly or monthly) can be useful in some cases, particularly for long-term trend analysis. However, since precipitation events are sporadic and vary in intensity, we employed event-based (individual rain events) sampling to more fully capture the impact of precipitation variability on 7Be and 10Be deposition (Caillet et al. Reference Caillet, Arpagaus, Monna and Dominik2001; Kremenchutskii Reference Kremenchutskii2021). It should be noted that we did not collect rainfall samples immediately following the dust storm event. Monthly deposition fluxes were calculated by summing the fluxes from individual rain events within each month.
After collection, chemical pretreatment was completed within three months. The potential decay of 7Be was considered in the data analysis, and decay corrections were applied based on the sampling date. This timeframe was determined by laboratory processing capacity and the need for batch processing, ensuring consistency across all samples. Previous studies have shown that with proper decay correction, this timeframe does not significantly affect the reliability of 7Be measurements.
BeO target samples were prepared through a series of processes, including acidification, siphon concentration, anion exchange resin treatment, cation exchange resin treatment, and pressing. Finally, the 7Be and 10Be samples (n = 49) were subjected to 3 MV AMS, at the Xi’an Accelerator Mass Spectrometry Center, Institute of Earth Environment, Chinese Academy of Sciences. as outlined by Zhang and Fu (Zhang and Fu Reference Zhang and Fu2017), as well as subsequent optimizations (Liu et al. Reference Liu, Fu, Bi, Zhang, Zhao, Xian and Zhou2022a).
The standard solutions and reagents used in the experimental process include (1) a 9Be standard solution (1000 mg·L−1, NCS Testing Technology, China); (2) high-purity reagents (GR grade) including HNO3, HCl, 30% H2O2, and NH3·H2O (Sinopharm Chemical Reagent Co., Ltd., China); (3) Fe standard solution (10,000 mg·L−1, NCS Testing Technology, China); (4) ultrapure water (18.2 MΩ·cm at 25 °C) produced by a Milli-Q system (Merck Millipore, USA); and (5) ion exchange resins Dowex 1W×8 (Cl−) and Dowex 50W×8 (H+) (Merck KGaA, Germany), used in ion exchange columns (1 cm × 20 cm, Bio-Rad, USA).
2.3 AMS measurement for 7Be and 10Be
The quality of the data relies on the chemical preparation process, measurement process, and data evaluation. This ensures recovery and consistency throughout the chemical treatment process. Standard and background samples was included in each measurement batch for calibration, and parallel samples were prepared for most measurements to verify the results. After measuring the number of 7Be and 10Be atoms in each sample, concentrations and associated errors were calculated based on the ratio between 7Be, 10Be, and 9Be.
The wet deposition flux (F, atoms·m−2) calculation formula is as follow (Mohan et al. Reference Mohan, D’Souza, Nayak, Kamath, Shetty, Kumara, Mayya and Karunakara2019).
 $$Flux = {{{_{\rm{\;}}^{7/10}B{e_c} \times P}} \over {S}}$$
Where “ 7/10Be c” (atoms·g–1) is the concentration of 7Be or 10Be in precipitation, “P” (g) is the total precipitation mass, and “S” (m2) is the collection area (1.68 m2).
The fluxes are aggregated by individual precipitation, month, season or year, with corresponding terms such as “single precipitation event deposition fluxes,” “monthly total deposition fluxes,” “seasonal total deposition fluxes,” and “annual total deposition fluxes.” The units for these are expressed as atoms·m–2, atoms·m–2·month–1, atoms·m–2·season–1, and atoms·m–2·y–1.
2.4 Data processing
In this study, rainfall is defined as the total precipitation collected during an individual rain event. The precipitation duration (t) refers to the total time over which precipitation occurs, and the precipitation intensity (R) is calculated as the ratio of precipitation (P) to duration (t).
The precipitation normalization coefficient (α) describes the influence of precipitation on the nuclide deposition flux. The value of α could be calculated using the following equation, as proposed by Baskaran (Baskaran Reference Baskaran1995):
 $$\alpha = {{\left( {{F_s} \cdot {R_t}} \right)} \over {\left( {{F_t} \cdot {R_s}} \right)}}$$
In the formula, “F s” and “F t” represent the seasonal and annual total deposition fluxes of 7Be and 10Be, respectively, and “R s” and “R t” represent the rainfall of a specific season and a whole year, respectively.
The deposition velocity (V d) represents the average deposition rate of 7Be and 10Be from the atmosphere to the underlying surface. It was calculated as follows (Young and Silker Reference Young and Silker1980; Mohan et al. Reference Mohan, D’Souza, Nayak, Kamath, Shetty, Kumara, Mayya and Karunakara2019):
 $${V_d} = {F \over {C \cdot t}}$$
Where “C” (atoms·g−1) is the concentration of 7Be or 10Be in rainwater. “t” (s), flux (atoms·m−2).
The scavenging coefficient (Λ sc) represents the efficiency of precipitation in removing 7Be and 10Be from the atmosphere and was calculated as follows (Sakashita et al. Reference Sakashita, Nakamura and Doi2002):
 $${\Lambda _{sc}} = {F \over {\left( {C \cdot t \cdot H} \right)}}$$
Where “t” (s) represents the duration of precipitation. “H” (m) denotes the vertical range of precipitation.
At the northern mid-latitudes, approximately 58% of precipitation originates from stratiform clouds at an altitude of 3170 m, while the remaining 42% stems from convective clouds at an elevation of 8680 m (Brost et al. Reference Brost, Feichter and Heimann1991; Rehfeld and Heimann Reference Rehfeld and Heimann1995; Sakashita et al. Reference Sakashita, Nakamura and Doi2002). Considering these findings, it can be posited that the H value of this study is approximately 5473 m.
Half-folding time (T 1/2) is defined as the time required for precipitation to reduce atmospheric concentrations of 7Be and 10Be by half. The requisite time was calculated as follows (Kremenchutskii and Konovalov Reference Kremenchutskii and Konovalov2022):
 $${T_{1/2}} = {{{\rm{ln}}\left( 2 \right)} \over {{\Lambda _{sc}}}}$$
3. Results
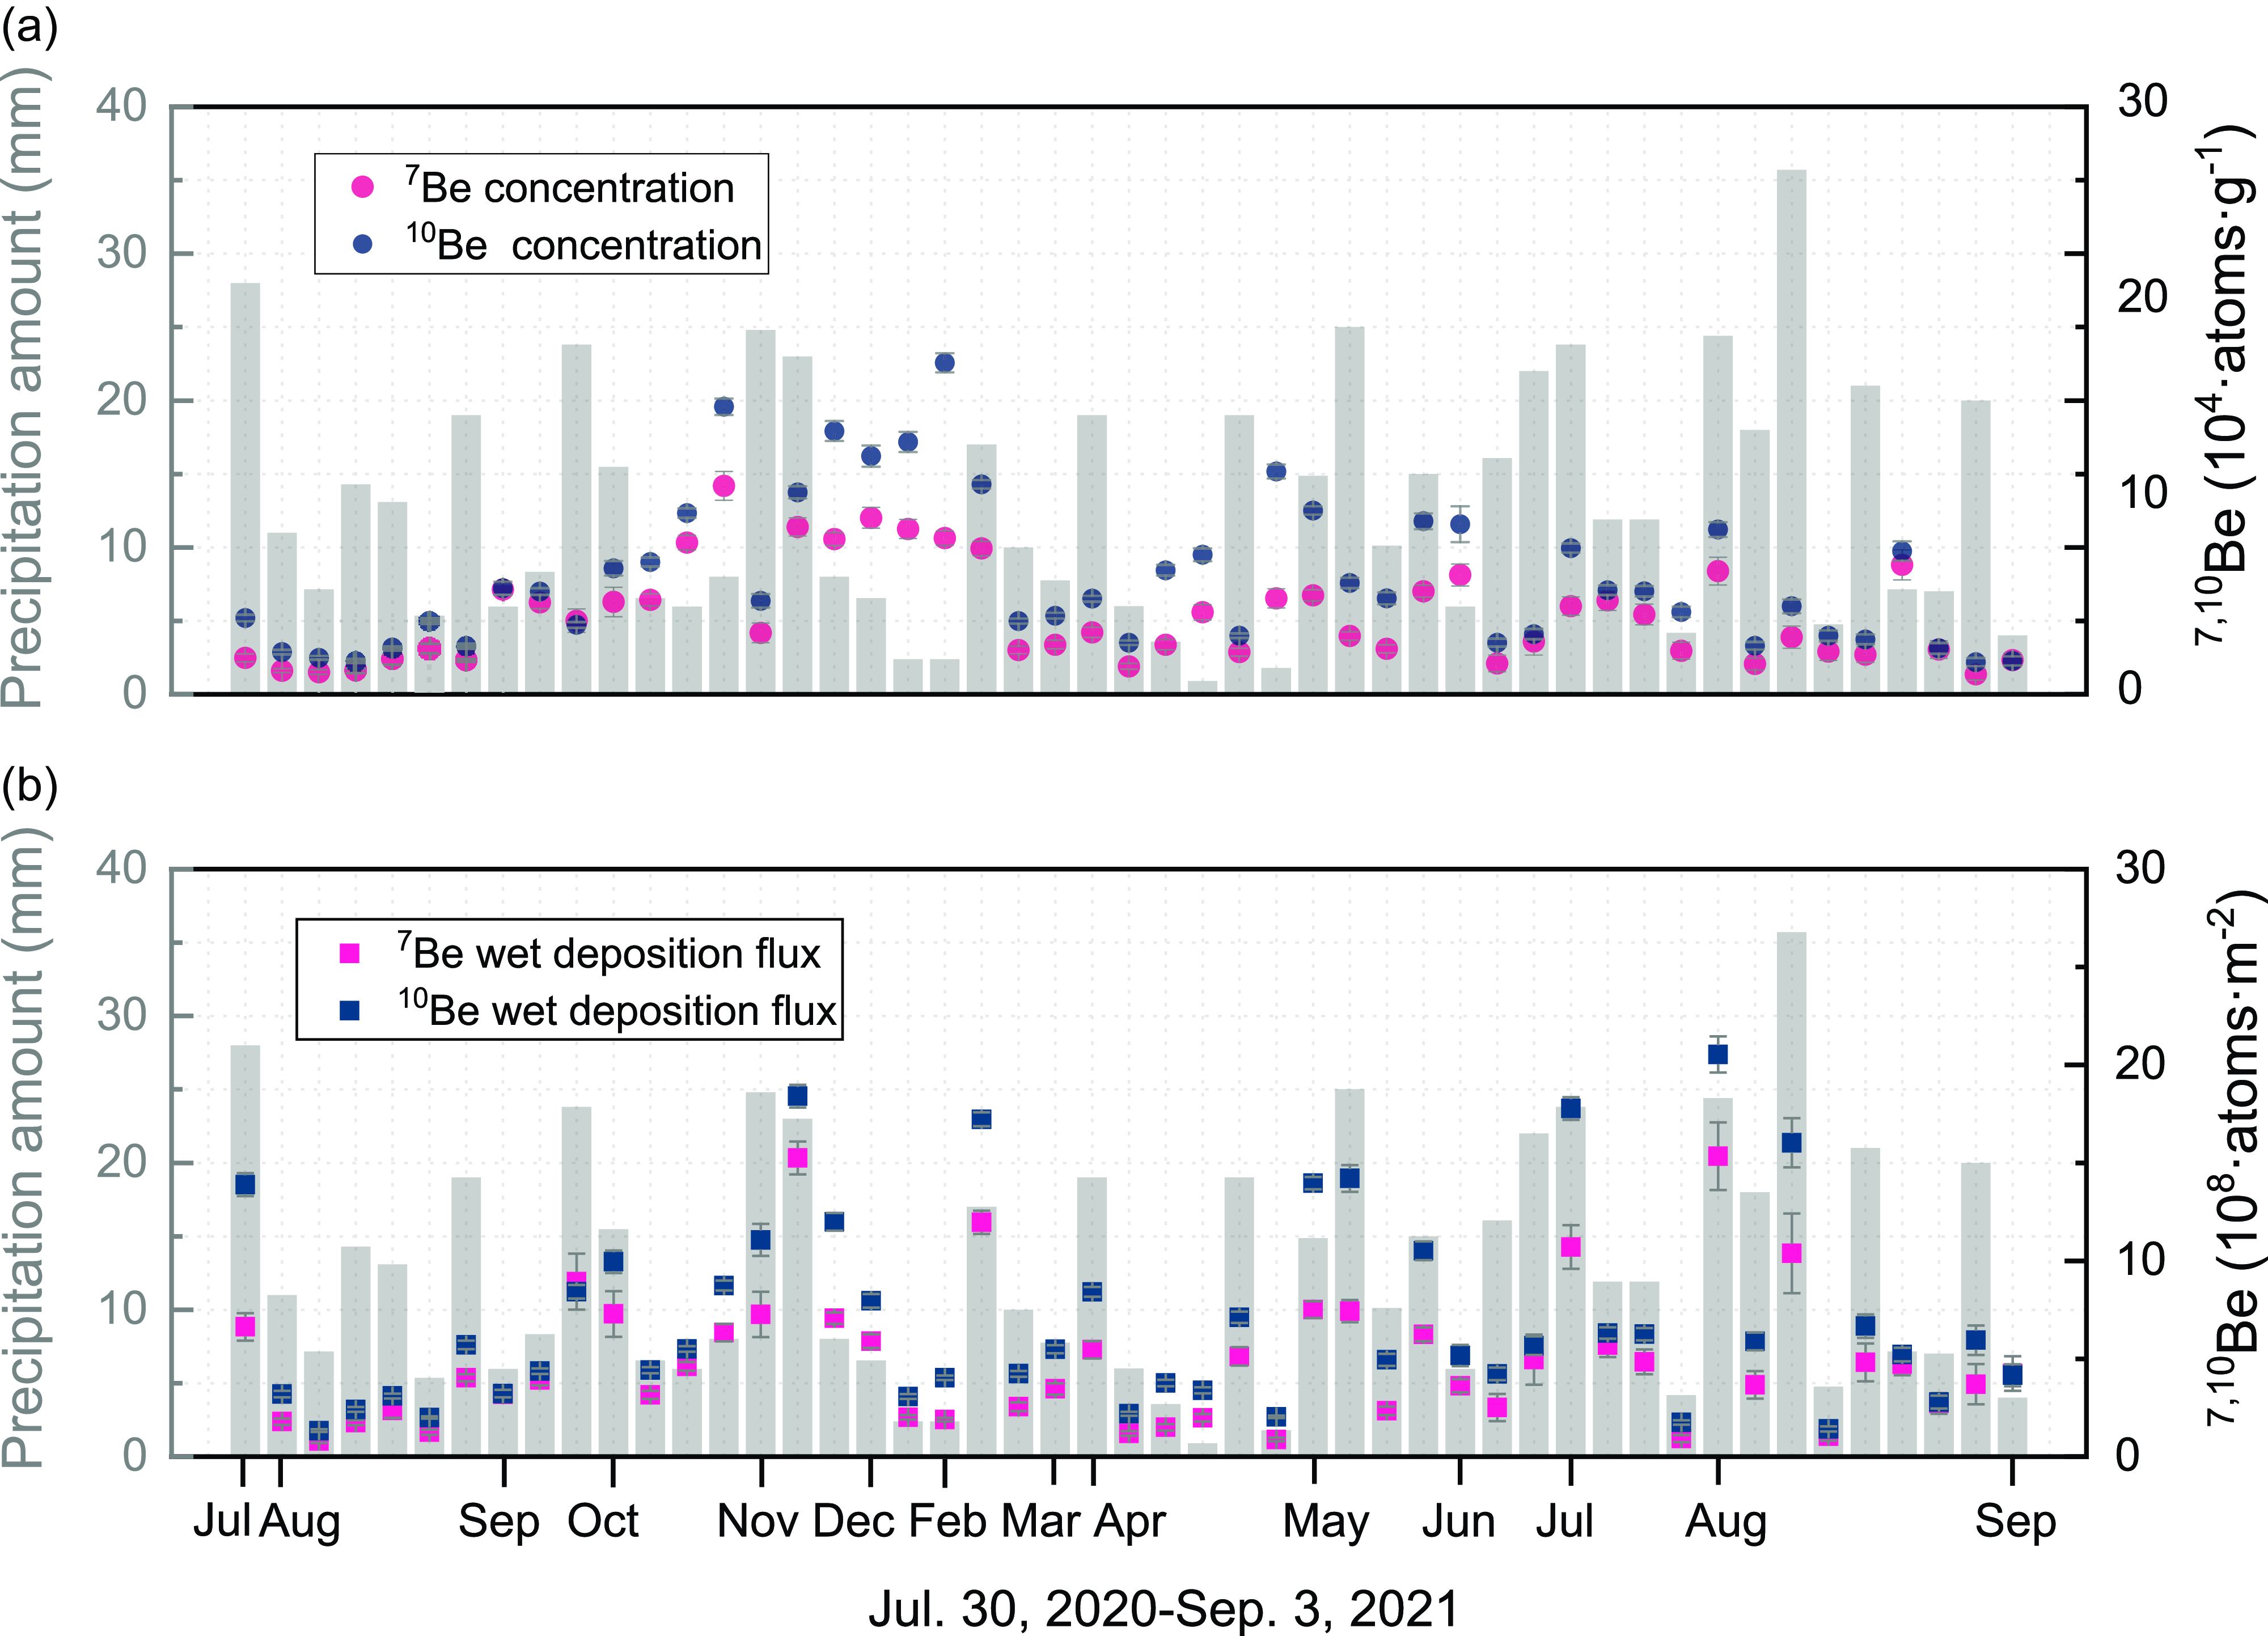
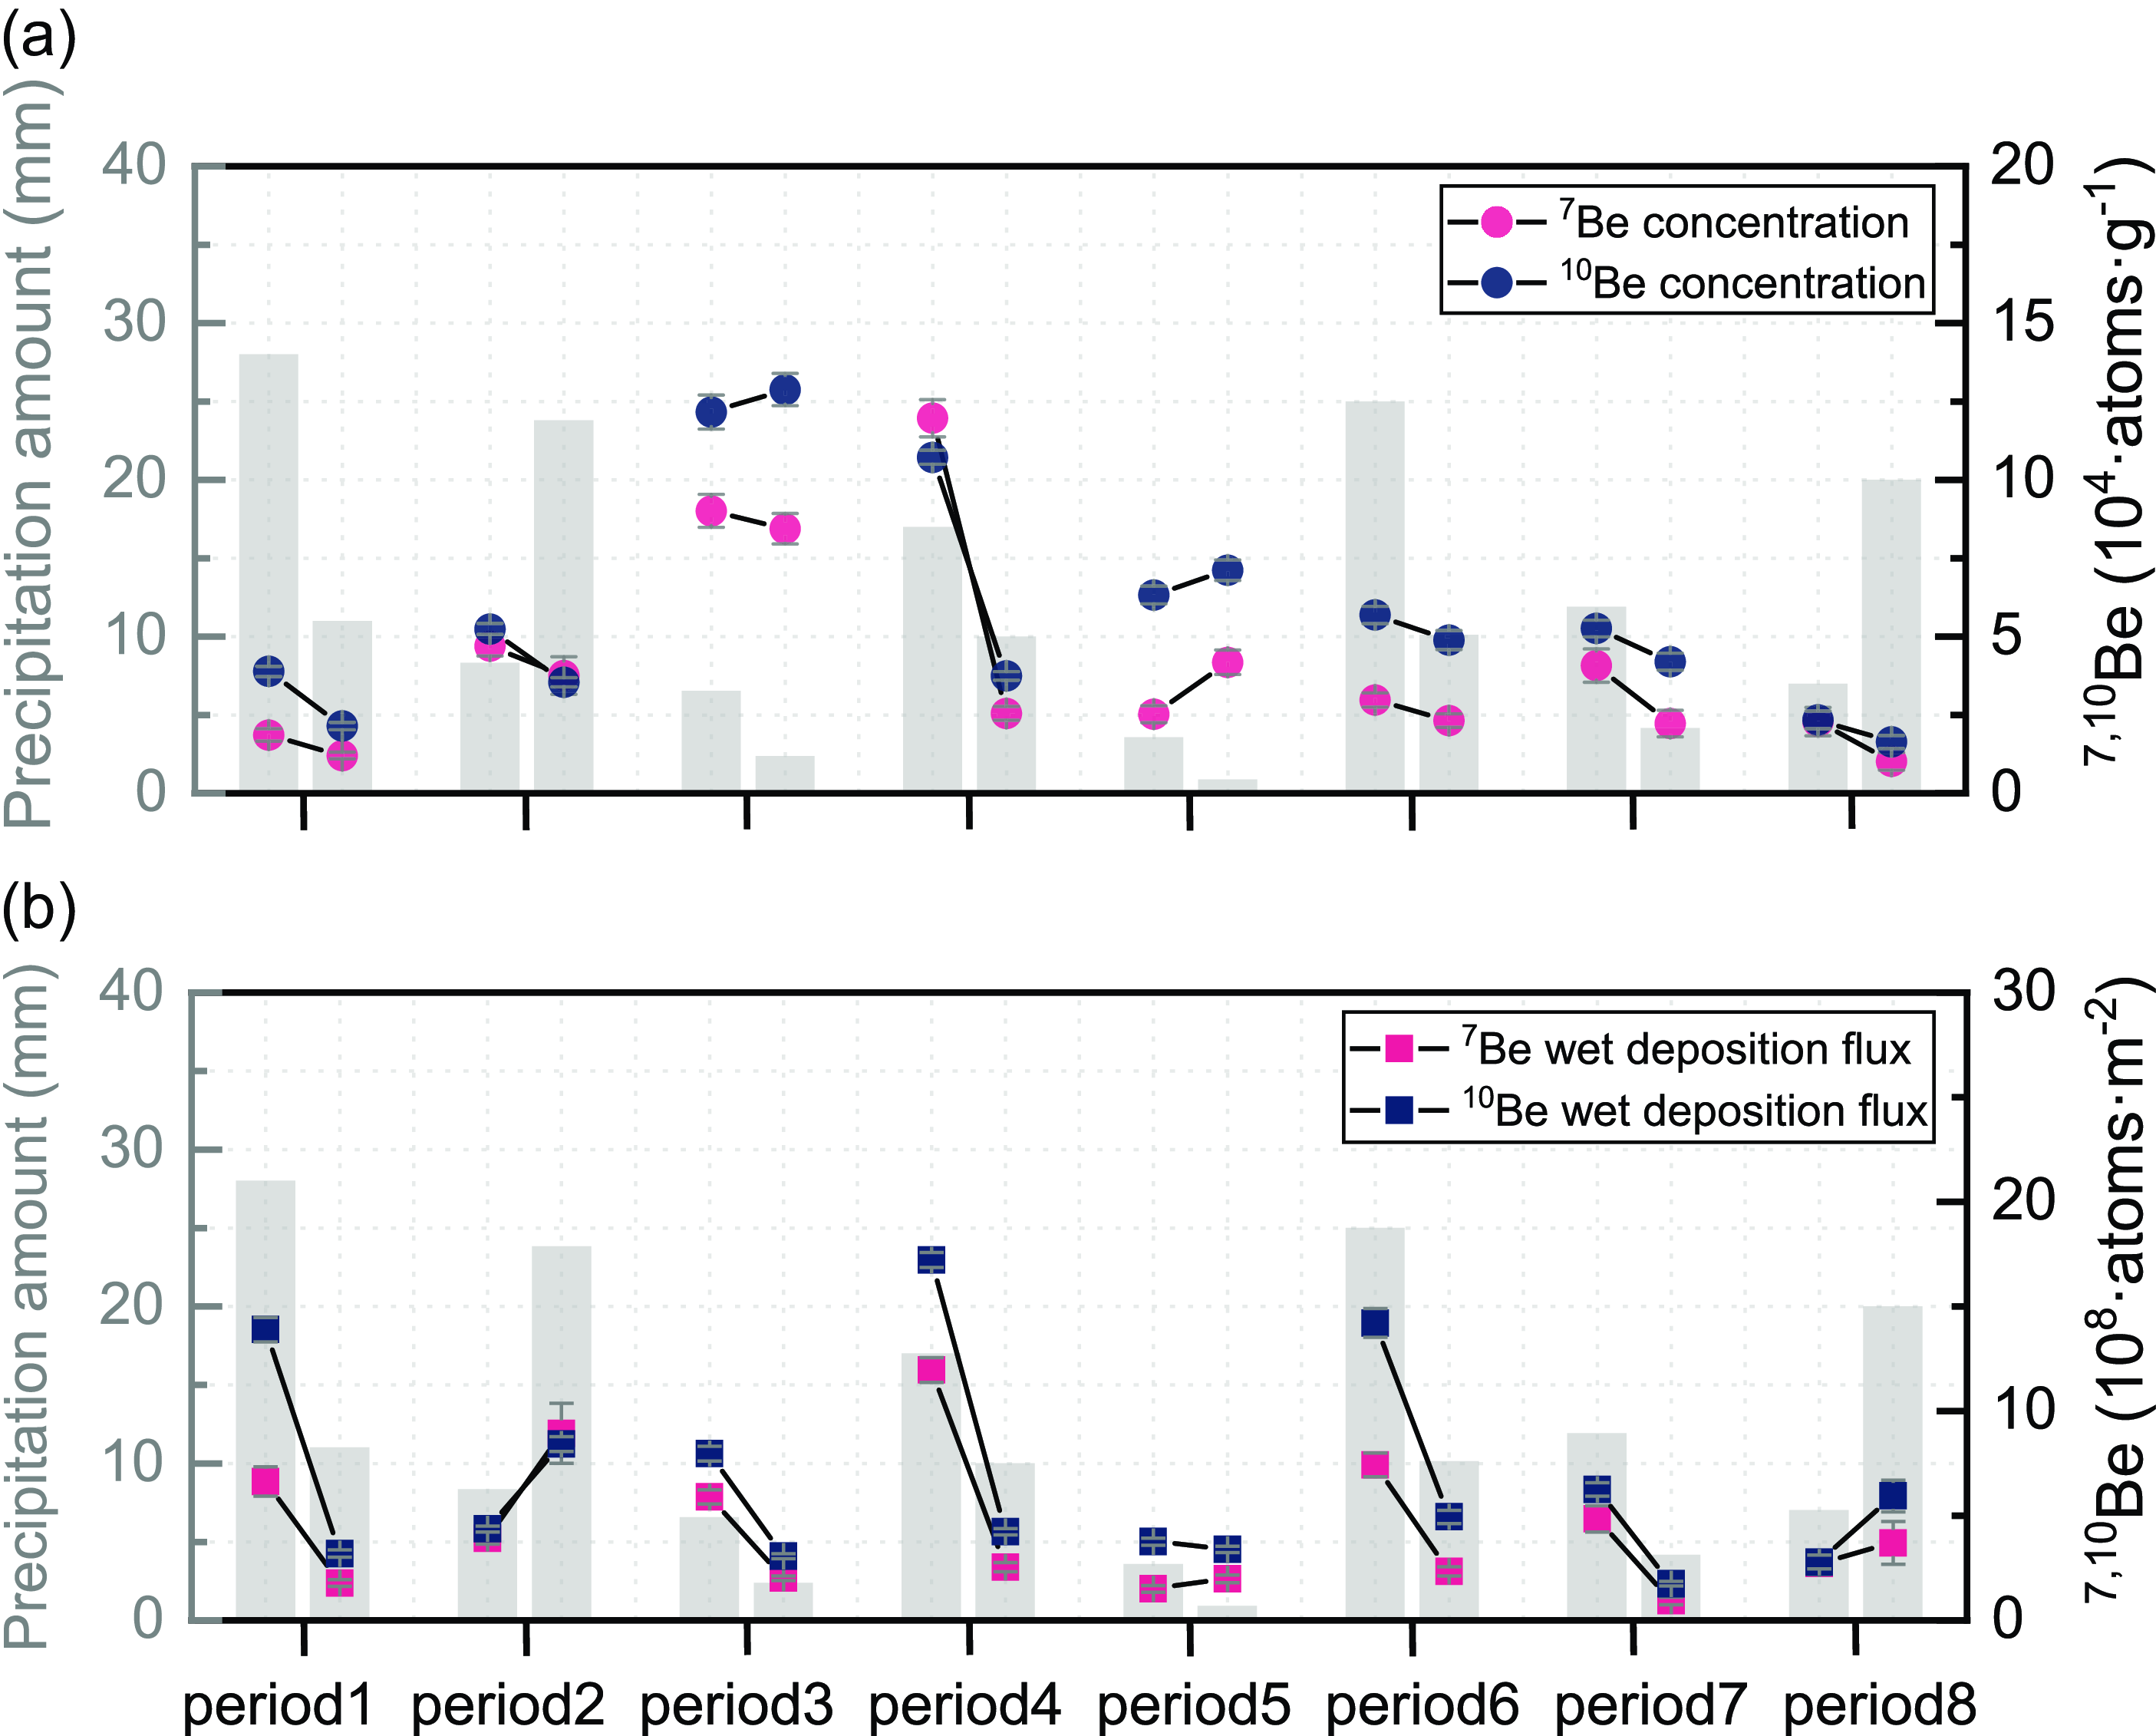
From July 30, 2020, to September 3, 2021, 49 rainwater samples were collected, corresponding to 49 individual rain events. This yielded a series of observational data, as shown in Figure 3. This study focuses on the characteristics of these individual rain events. Therefore, unless otherwise specified, the term “deposition flux” refers to the total deposition flux for a single rain event, while “concentration” indicates the average concentration during a single precipitation event.
Temporal variability of 7Be and 10Be concentrations (a), and their wet deposition fluxes (b). The gray bar graph represents the total precipitation amount collected under individual rain events.

It should be noted that in the analysis of the relationship between 7Be and 10Be wet deposition and precipitation amount, all collected observational data were utilized. However, for the analysis of monthly, seasonal, and annual wet deposition characteristics of 7Be and 10Be, the data covers the period from August 1, 2020, to August 31, 2021.
The mean concentrations of 7Be and 10Be in Xi’an were (4.4 ± 0.4) × 104 atoms·g−1 and (6.0 ± 0.3) × 104 atoms·g−1, respectively (Table 1). The mean monthly concentration of 7Be ranged from (2.0 ± 0.4) × 104 to (8.7 ± 0.5) × 104 atoms·g–1·month–1, with the lowest concentration observed in August and the highest concentration in December. The monthly mean concentration of 10Be in precipitation exhibits a range of (3.8 ± 0.3) × 104 to (14.0 ± 0.5) × 104 atoms·g–1·month–1, which is analogous to that of 7Be.
Statistical parameters for 7Be and 10Be time series in precipitation (C-7Be, F-7Be, C-10Be, F-10Be): arithmetic mean (AM), geometric mean (GM), median (ME), minimum and maximum values (Min, Max), standard deviation (SD), 10th percentile (PC 10), 90th percentile (PC 90), skewness (SK) and kurtosis (KU)

Table 1 Long description
A table comparing statistical parameters for 7Be and 10Be time series in precipitation. The table has four rows and ten columns. The columns are labeled AM, GM, ME, Min, Max, SD, PC 10, PC 90, SK, and KU. The rows are labeled C-7Be, F-7Be, C-10Be, and F-10Be. Row 1: C-7Be, AM: 4.4 ± 0.4, GM: 3.8 ± 0.4, ME: 3.1 ± 0.4, Min: 1.0 ± 0.3, Max: 10.6 ± 0.7, SD: 2.4, PC 10: 1.8, PC 90: 7.9, SK: 0.7, KU: -0.4. Row 2: F-7Be, AM: 4.8 ± 0.5, GM: 3.8 ± 0.4, ME: 0.9 ± 0.1, Min: 15.3 ± 1.7, Max: 4.0 ± 0.2, SD: 3.4, PC 10: 1.2, PC 90: 9.2, SK: 1.36, KU: 1.9. Row 3: C-10Be, AM: 6.0 ± 0.3, GM: 4.9 ± 0.2, ME: 1.6 ± 0.2, Min: 16.9 ± 0.5, Max: 4.9 ± 0.3, SD: 3.8, PC 10: 2.3, PC 90: 11.5, SK: 1.1, KU: 0.5. Row 4: F-10Be, AM: 7.1 ± 0.4, GM: 5.6 ± 0.3, ME: 1.3 ± 0.1, Min: 20.5 ± 1.3, Max: 5.5 ± 0.3, SD: 4.9, PC 10: 2.2, PC 90: 14.8, SK: 1.2, KU: 0.5.
The monthly total wet deposition flux of Xi’an 7Be exhibits a range of (7.9 ± 0.5) × 108 to (46.4 ± 7.8) × 108 atoms·m–2·month–1, with the lowest value observed in December and the highest in August. The variation characteristics of the 10Be wet deposition flux are analogous to those of 7Be, with a total monthly wet deposition flux variation range of (11.0 ± 0.5) × 108 to (64.5 ± 4.8) × 108 atoms·m–2·month–1.
As shown in Table 1, the arithmetic mean, geometric mean, and median of 7Be and 10Be concentrations or fluxes are inconsistent, indicating that the frequency distribution of nuclide concentrations or fluxes is not normal. The positive skewness value suggests that the frequency distribution is asymmetrical, tending towards the larger value. Conversely, a negative kurtosis value indicates that the distribution has a lighter tail relative to the normal distribution. The coefficient of variation (CV) for both 7Be and 10Be concentrations and fluxes in precipitation exceeded 60%, indicating a substantial degree of variability within the study series. In other words, the settling values of 7Be and 10Be in precipitation are not stable throughout the year, but rather exhibit significant fluctuations influenced by environmental factors.
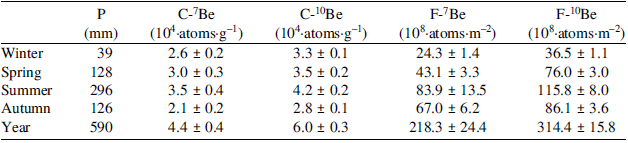
The seasonal mean concentration of 7Be in precipitation in Xi’an ranged from (3.0 ± 0.5) × 104 to (7.0 ± 0.4) × 104 atoms·g–1·season–1, with the lowest concentrations observed in the summer and a gradual peak recorded in winter (Table 2). Similar variations have been observed in other regions (Ioannidou and Papastefanou Reference Ioannidou and Papastefanou2006; Gourdin et al. Reference Gourdin, Evrard, Huon, Reyss, Ribolzi, Bariac, Sengtaheuanghoung and Ayrault2014). The concentration of 10Be in precipitation in Xi’an exhibited a comparable seasonal variation trend, with minimal levels during summer and pronounced levels in winter (Table 2). The seasonal mean concentration of 10Be varied from (5.0 ± 0.3) × 104 to (11.3 ± 0.4) × 104 atoms·g-1·season–1. Notably, the highest concentrations of both 7Be and 10Be were frequently observed during the winter and spring, primarily during periods of low precipitation.
Seasonal and annual characteristics of the 7Be and 10Be concentration (C) and their deposition flux (F) over the study period

Table 2 Long description
A table comparing seasonal and annual characteristics of Beryllium isotopes in precipitation. The table has 5 rows and 5 columns. The columns are labeled P (mm), C-7Be (10^4 atoms g^-1), C-10Be (10^4 atoms g^-1), F-7Be (10^8 atoms m^-2), and F-10Be (10^8 atoms m^-2). The rows are labeled Winter, Spring, Summer, Autumn, and Year. Row 1: Winter, 39, 2.6 0.2, 3.3 0.1, 24.3 1.4, 36.5 1.1. Row 2: Spring, 128, 3.0 0.3, 3.5 0.2, 43.1 3.3, 76.0 3.0. Row 3: Summer, 296, 3.5 0.4, 4.2 0.2, 83.9 13.5, 115.8 8.0. Row 4: Autumn, 126, 2.1 0.2, 2.8 0.1, 67.0 6.2, 86.1 3.6. Row 5: Year, 590, 4.4 0.4, 6.0 0.3, 218.3 24.4, 314.4 15.8. The table shows the concentration and deposition flux of Beryllium isotopes in precipitation across different seasons and annually.
The seasonal wet deposition flux of 7Be in Xi’an exhibited a range of (24.3 ± 1.4) × 108 to (83.9 ± 13.5) × 108 atoms·m–2·season–1, with the highest values observed in summer and the lowest in winter (Table 2). The total wet deposition flux in summer and autumn contributes approximately 72% of annual wet deposition flux, a figure that is consistent with the findings of other studies conducted in Shanghai, China; Japan; southeast Michigan, USA; Malaga, Spain; and Huelva, Spain (McNeary Reference McNeary2003; Yamamoto et al. Reference Yamamoto, Sakaguchi, Sasaki, Hirose, Igarashi and Kim2006; Du et al. Reference Du, Du, Baskaran, Bi, Huang and Jiang2015; Duenas et al. Reference Duenas, Gordo, Liger, Cabello, Canete, Perez and Torre-Luque2017). The wet deposition flux of 10Be in Xi’an is analogous to that of 7Be, exhibiting a peak during the summer and a nadir during the winter, with a range from (36.5 ± 1.1) × 108 to (115.8 ± 8.0) × 108 atoms·m–2·season–1 (Table 2). The 10Be deposition flux contribution during the summer and autumn seasons accounts for more than 57% of the yearly total. The annual wet deposition fluxes of Xi’an 7Be and 10Be are (218 ± 24) × 108 atoms·m−2 and (314 ± 16) × 108 atoms·m−2·y−1, respectively (Table 2).
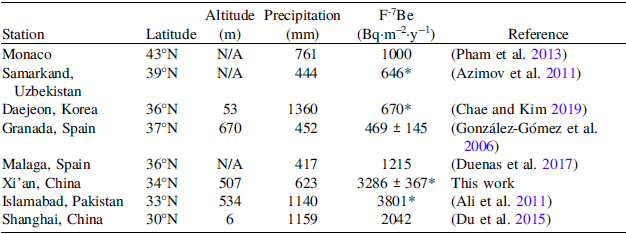
To facilitate comparison with research results from other regions, the flux unit of 7Be has been converted in this paper to Bq·m–2 (Table 3). The annual wet deposition flux of 7Be in Xi’an is approximately 3286 ± 367 Bq·m–2·y−1, whereas the annual dry and wet deposition flux of 7Be in Shanghai, China is 2070 Bq·m–2·y−1 (Du et al. Reference Du, Zhang and Wu2008). The annual wet deposition flux of 7Be in Xi’an is markedly higher than that observed in Shanghai. One potential explanation for this discrepancy is that 7Be is prone to adsorption by fine atmospheric particles. The city of Xi’an is located inland, and it is characterized by a higher concentration of atmospheric aerosols compared to coastal areas (González-Gómez et al. Reference González-Gómez, Azahra, López-Peñalver, Camacho-García, El Bardouni and Boukhal2006; Pham et al. Reference Pham, Povinec, Nies and Betti2013; Zhang et al. Reference Zhang, Wang, Baskaran, Zhong, Wang, Paatero and Du2021).
The annual average values of precipitation amount, 7Be and 10Be deposition flux at stations located in the Northern Hemisphere’s middle latitudes

Table 3 Long description
A table comparing precipitation and F-7Be deposition at various stations in the Northern Hemisphere. The table has 8 rows and 6 columns. The columns are labeled Station, Latitude, Altitude (m), Precipitation (mm), F-7Be (Bqm-2y-1), and Reference. The rows list different stations along with their respective data. Row 1: Monaco, 43°N, N/A, 761, 1000, Pham et al. 2013. Row 2: Samarkand, Uzbekistan, 39°N, N/A, 444, 646*, Azimov et al. 2011. Row 3: Daejeon, Korea, 36°N, 53, 1360, 670*, Chae and Kim 2019. Row 4: Granada, Spain, 37°N, 670, 452, 469 ± 145, González-Gómez et al. 2006. Row 5: Malaga, Spain, 36°N, N/A, 417, 1215, Duenas et al. 2017. Row 6: Xi'an, China, 34°N, 507, 623, 3286 ± 367*, This work. Row 7: Islamabad, Pakistan, 33°N, 534, 1140, 3801*, Ali et al. 2011. Row 8: Shanghai, China, 30°N, 6, 1159, 2042, Du et al. 2015.
Note: * only wet deposition.
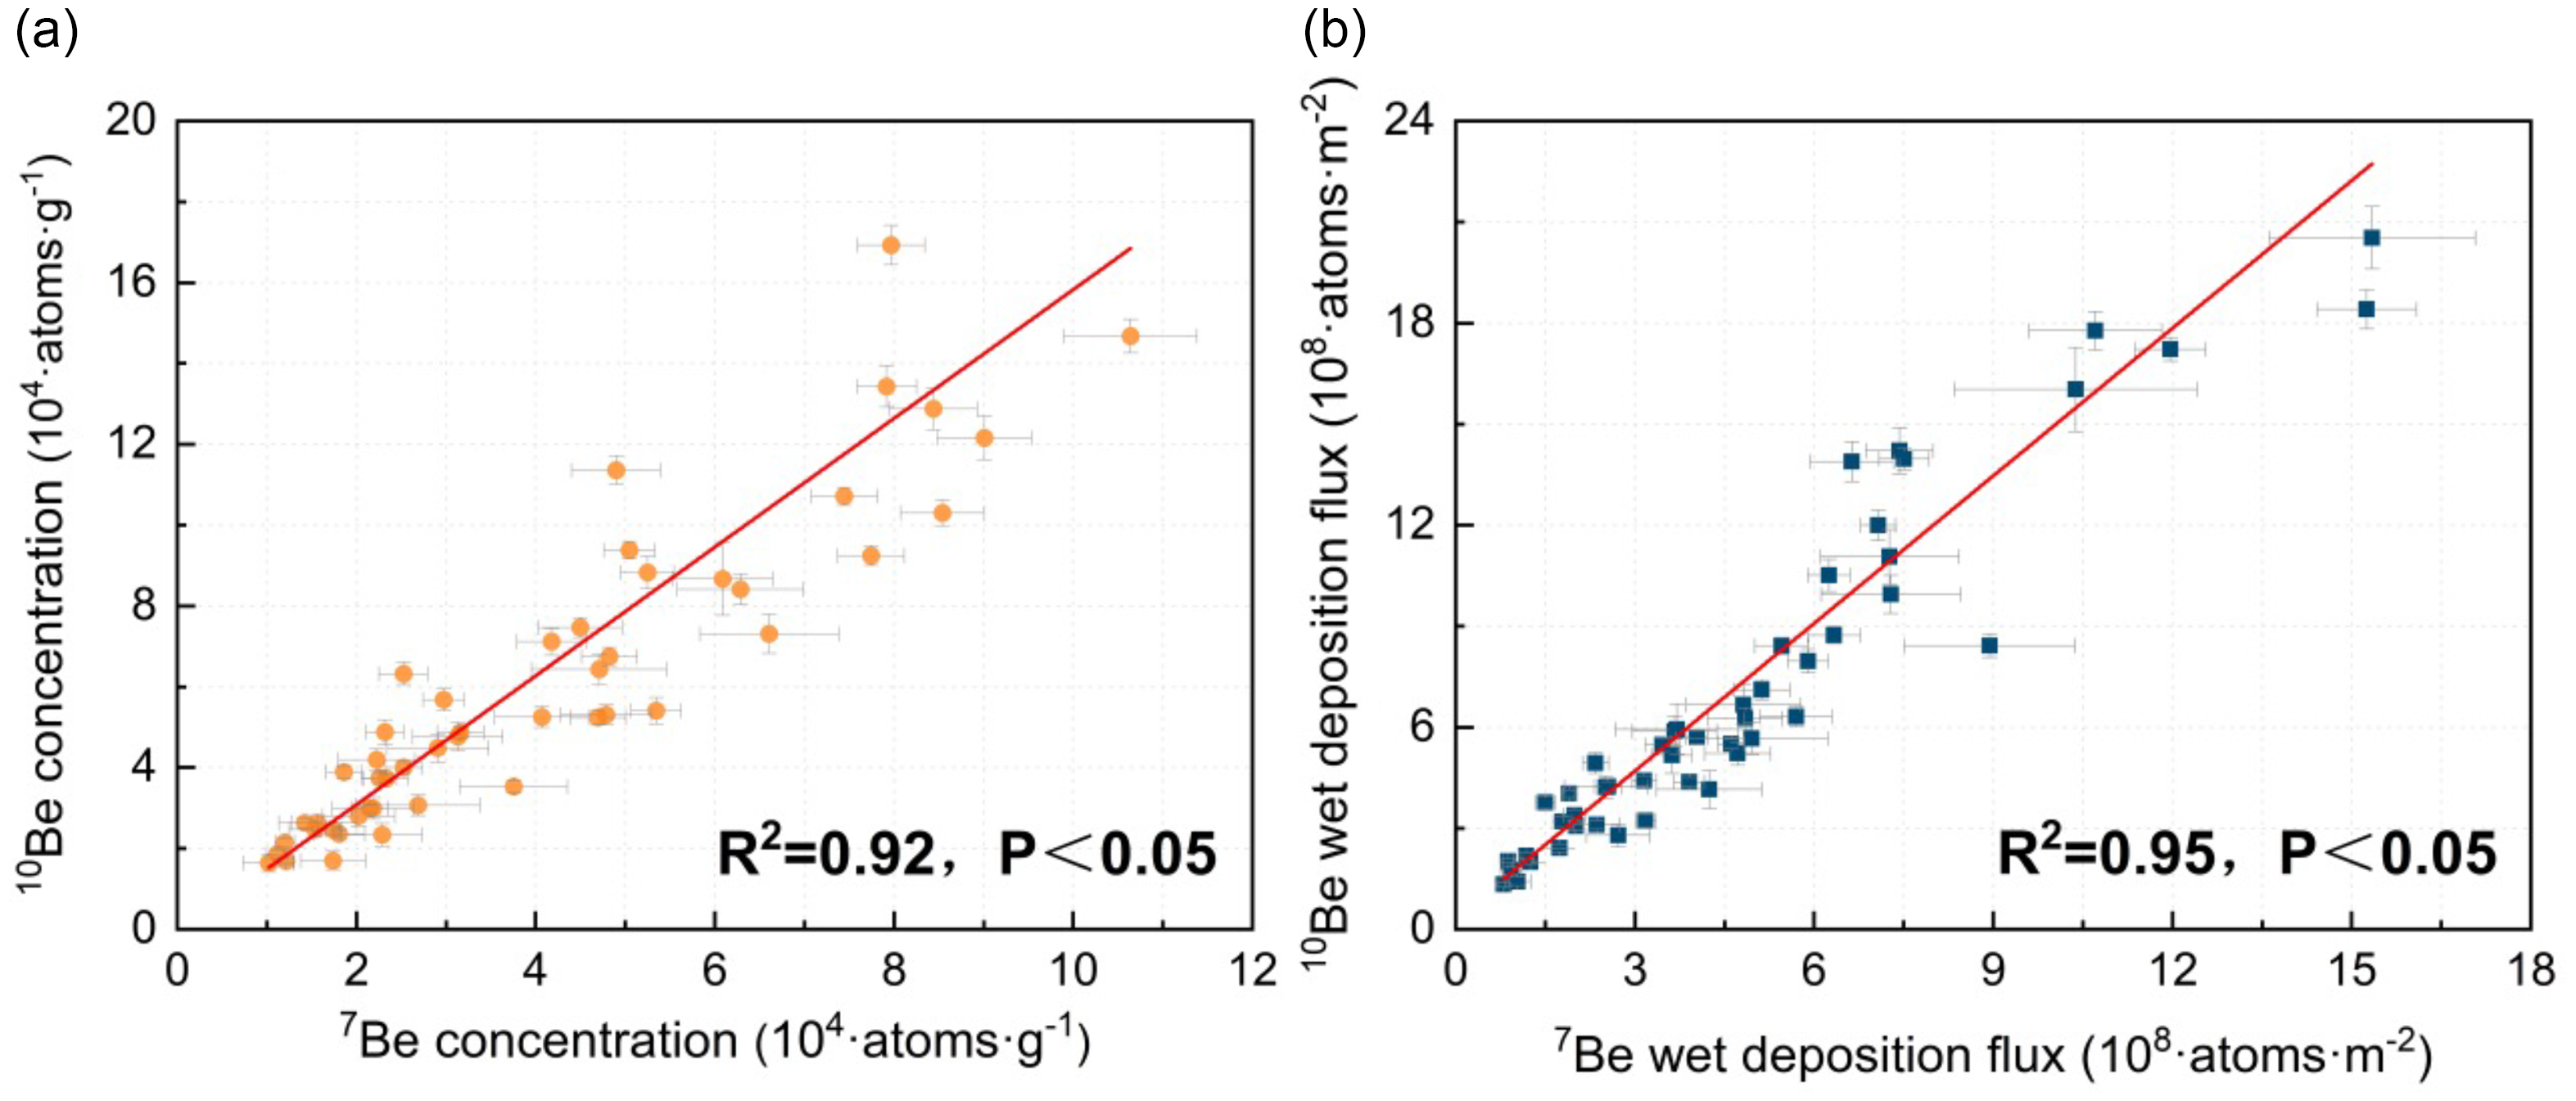
7Be and 10Be are both produced by cosmic ray and have similar atmospheric transport mechanisms. This study observes that their temporal variations exhibit similar patterns, suggesting a strong correlation. There was a significant positive correlation between the concentrations and deposition flux of 7Be and 10Be (R2 = 0.92, P < 0.05; R2 = 0.95, P < 0.05; Figure 4). This suggests that the wet deposition process of 7Be and 10Be may be analogous, and that the factors influencing their concentration and wet deposition flux may be similar. The following section will analyze this hypothesis.
The relationship between 7Be and 10Be in precipitation. The relationship between the concentration of 7Be and 10Be in precipitation (a). The relationship between 7Be and 10Be wet deposition fluxes (b).

4. Discussion
4.1 Concentration of 7Be and 10Be in precipitation
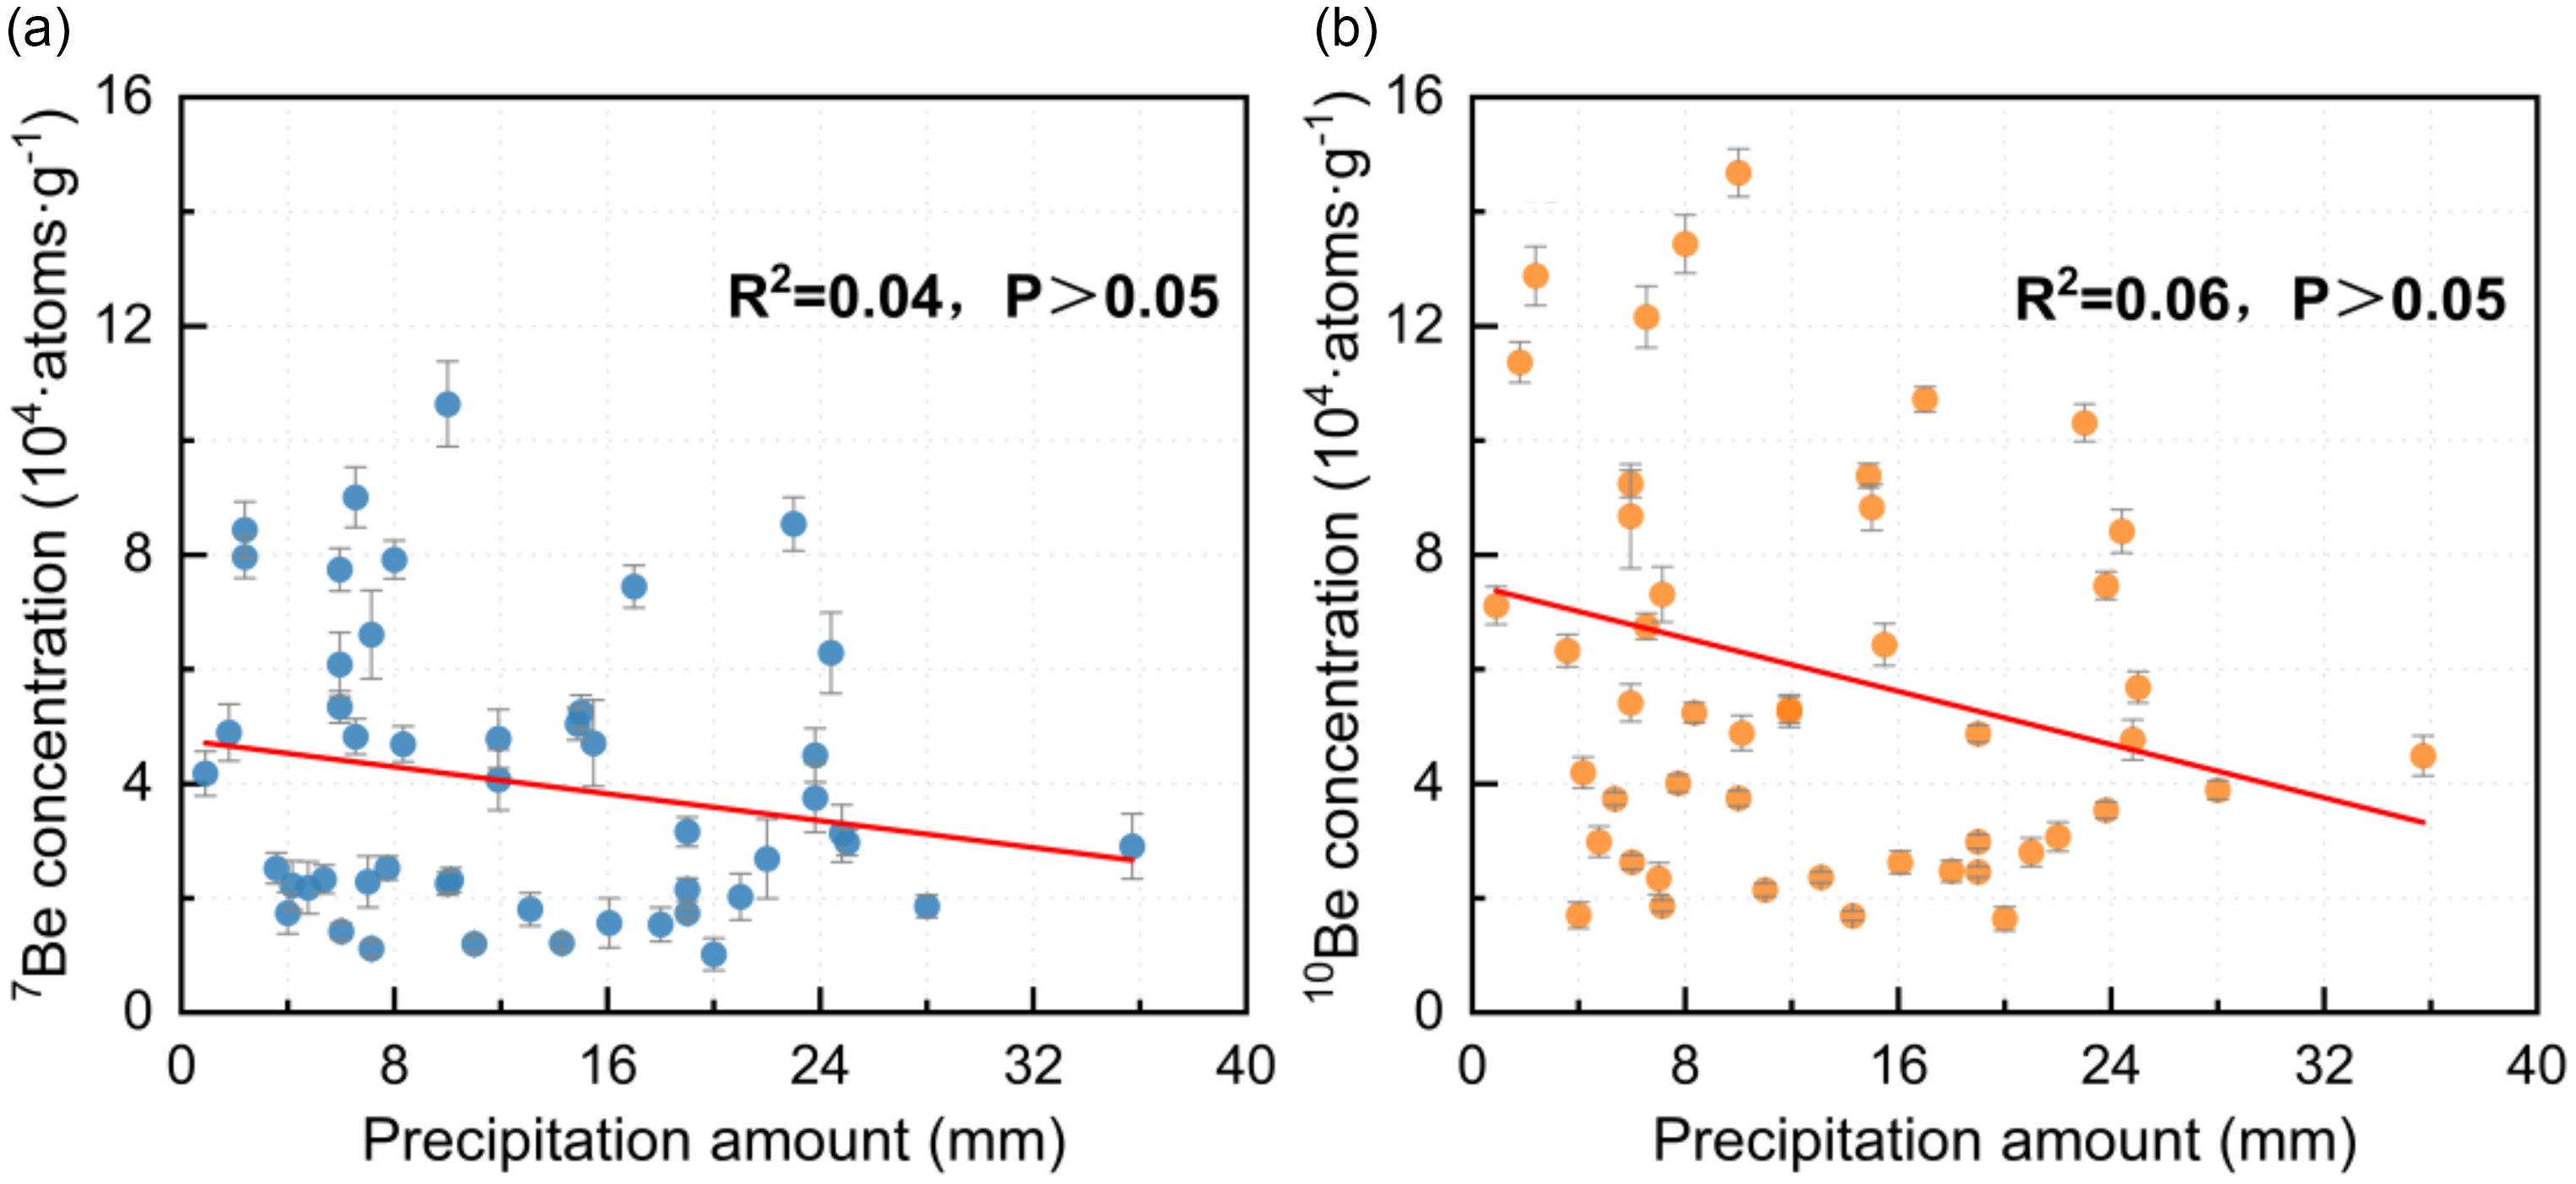
The concentration of 7Be or 10Be in precipitation reflects the level of nuclide enrichment. No significant correlation was found between precipitation amounts and the concentration of 7Be and 10Be (Figure 5), although a weak negative trend is apparent. This result may be explained by two factors: the dilution effect of precipitation and the influence of atmospheric dynamics. Similar findings have been reported in previous studies, where the relationship between precipitation amount and 7Be concentration was not significant (Brown et al. Reference Brown, Stensland, Klein and Middleton1989; Todd et al. Reference Todd, Wong, Olsen and Larsen1989).
Relationship between 7Be (a) and 10Be (b) concentration and precipitation amount, respectively.

The relationship between 7Be concentration and precipitation amount varies across regions, largely due to differences in precipitation patterns. In areas with high precipitation, a strong correlation between 7Be concentration and precipitation is observed, as precipitation efficiently removes 7Be from below the clouds (McNeary Reference McNeary2003). Conversely, in regions with low precipitation, a weaker correlation is evident. This is attributed to the slow replenishment of 7Be from the air mass above the clouds, resulting in insufficient time for 7Be to accumulate below the clouds before being continuously diluted by precipitation.
Specifically, the removal of 7Be and 10Be from the atmosphere by wet deposition follows two key mechanisms: rainout and washout (Du et al. Reference Du, Baskaran and Du2019). If precipitation is both intense and prolonged, the concentrations of these nuclides generally decrease in the later stages due to insufficient atmospheric replenishment (Baskaran et al. Reference Baskaran, Coleman and Santschi1993; Olsen et al. Reference Olsen, Larsen, Lowry, Cutshall, Todd, Wong and Casey1985; Todd et al. Reference Todd, Wong, Olsen and Larsen1989). This process indicates that the dynamic variations in nuclide concentrations during precipitation are largely governed by the precipitation pattern.
4.2 Wet deposition flux
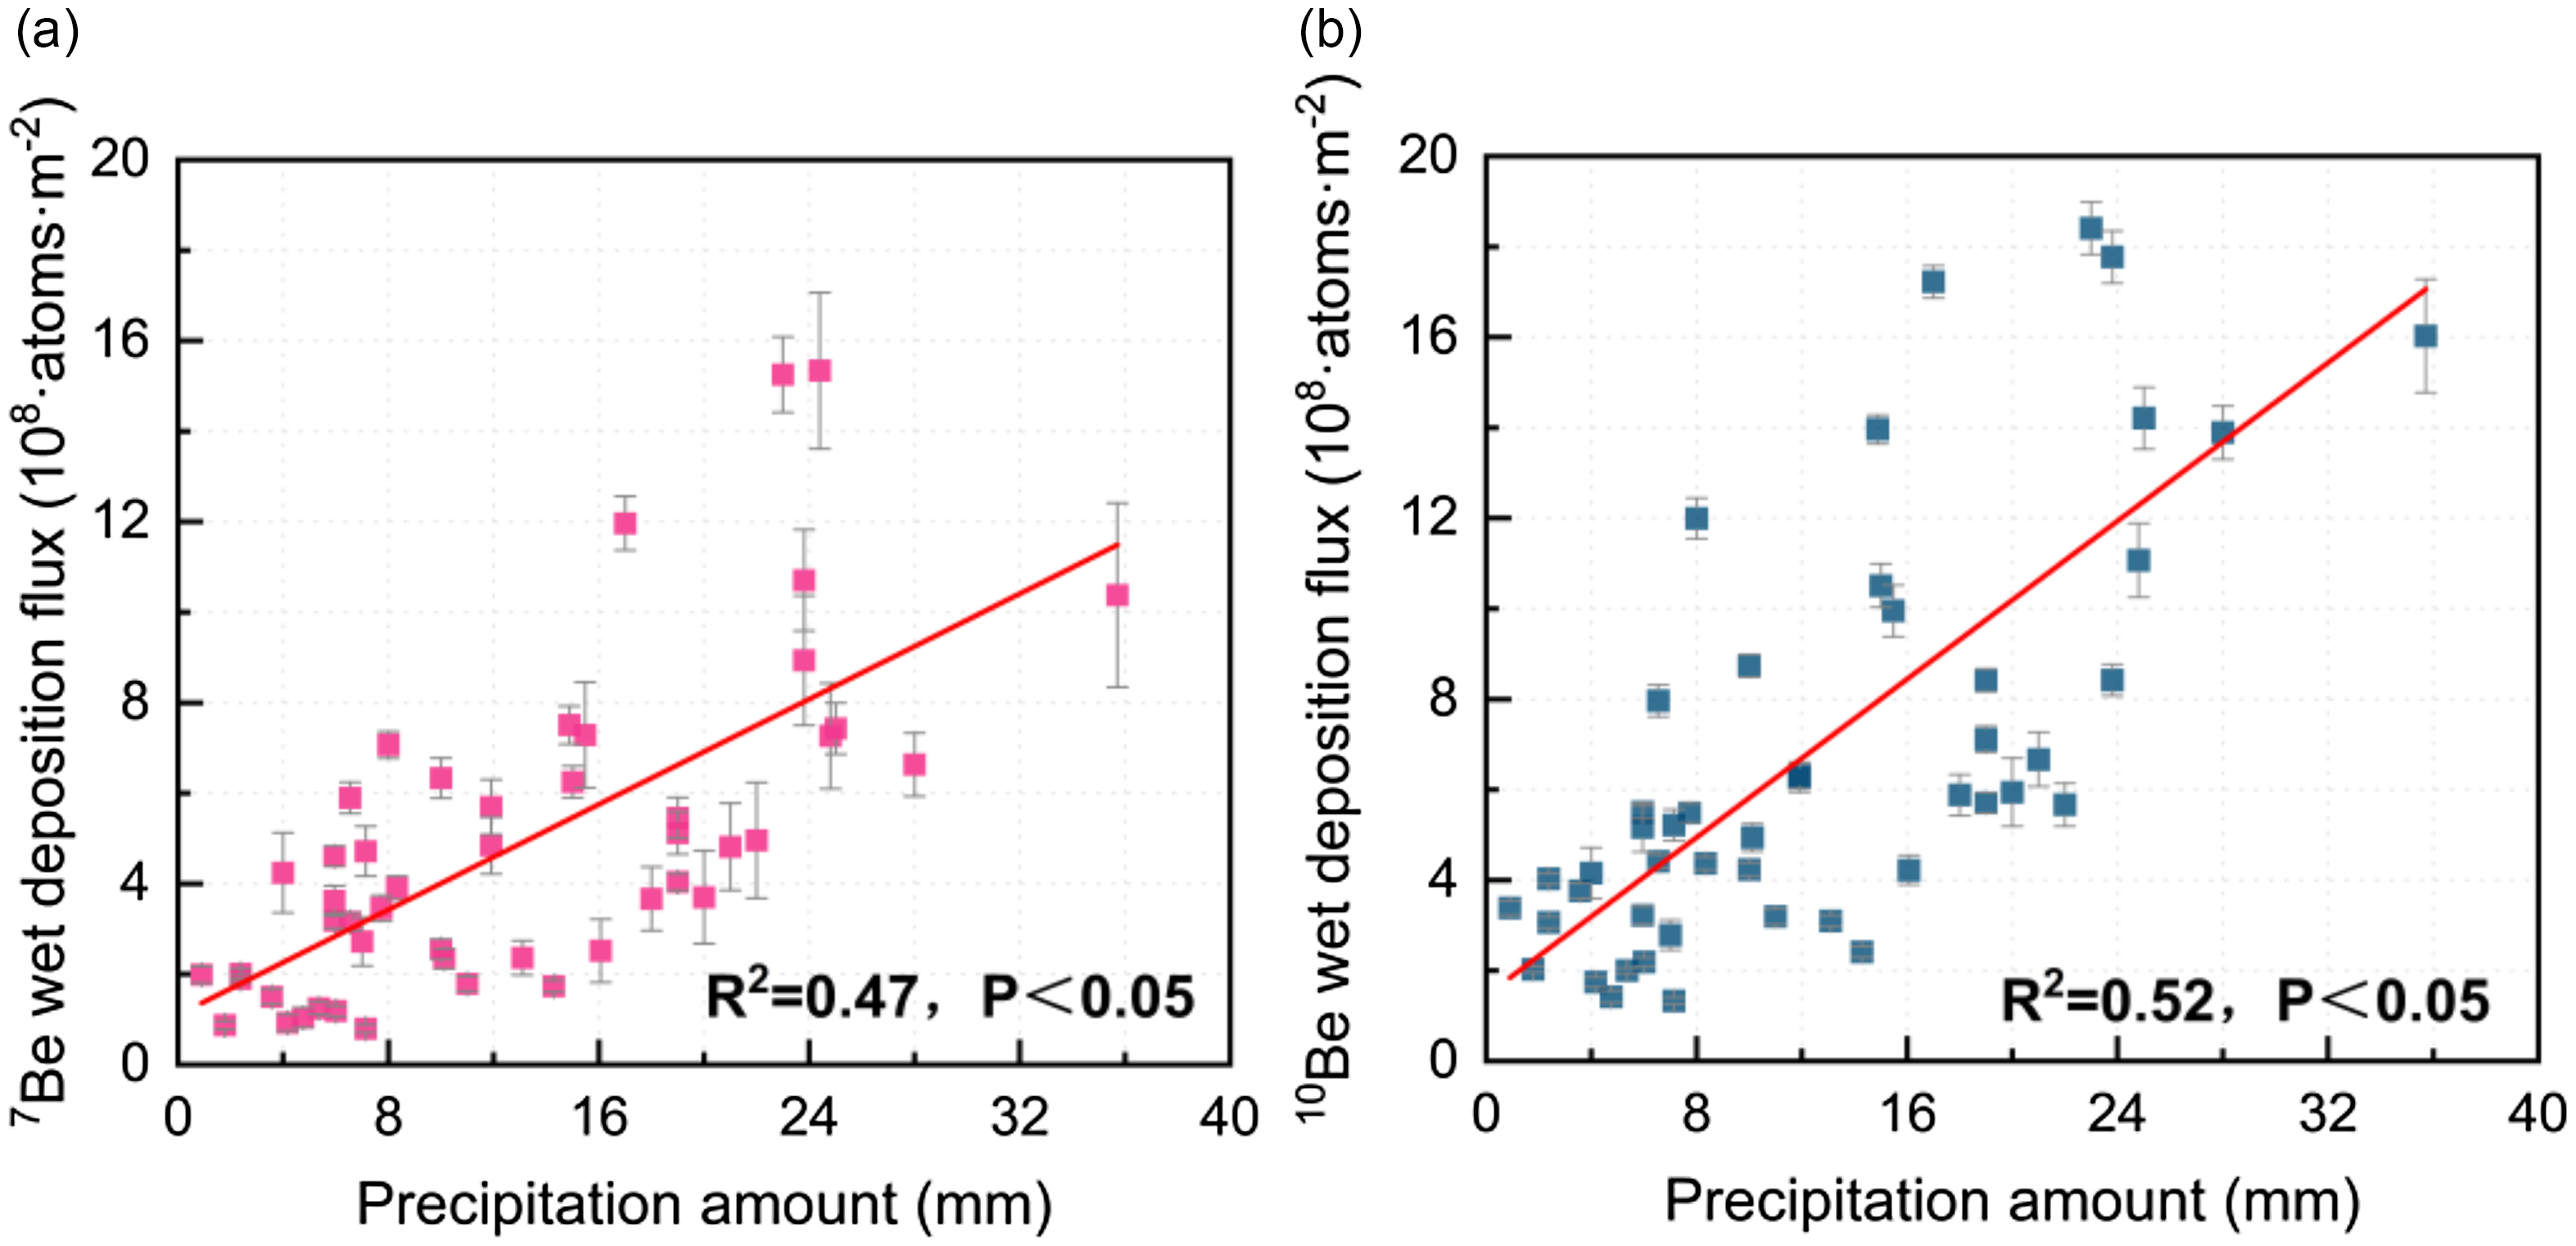
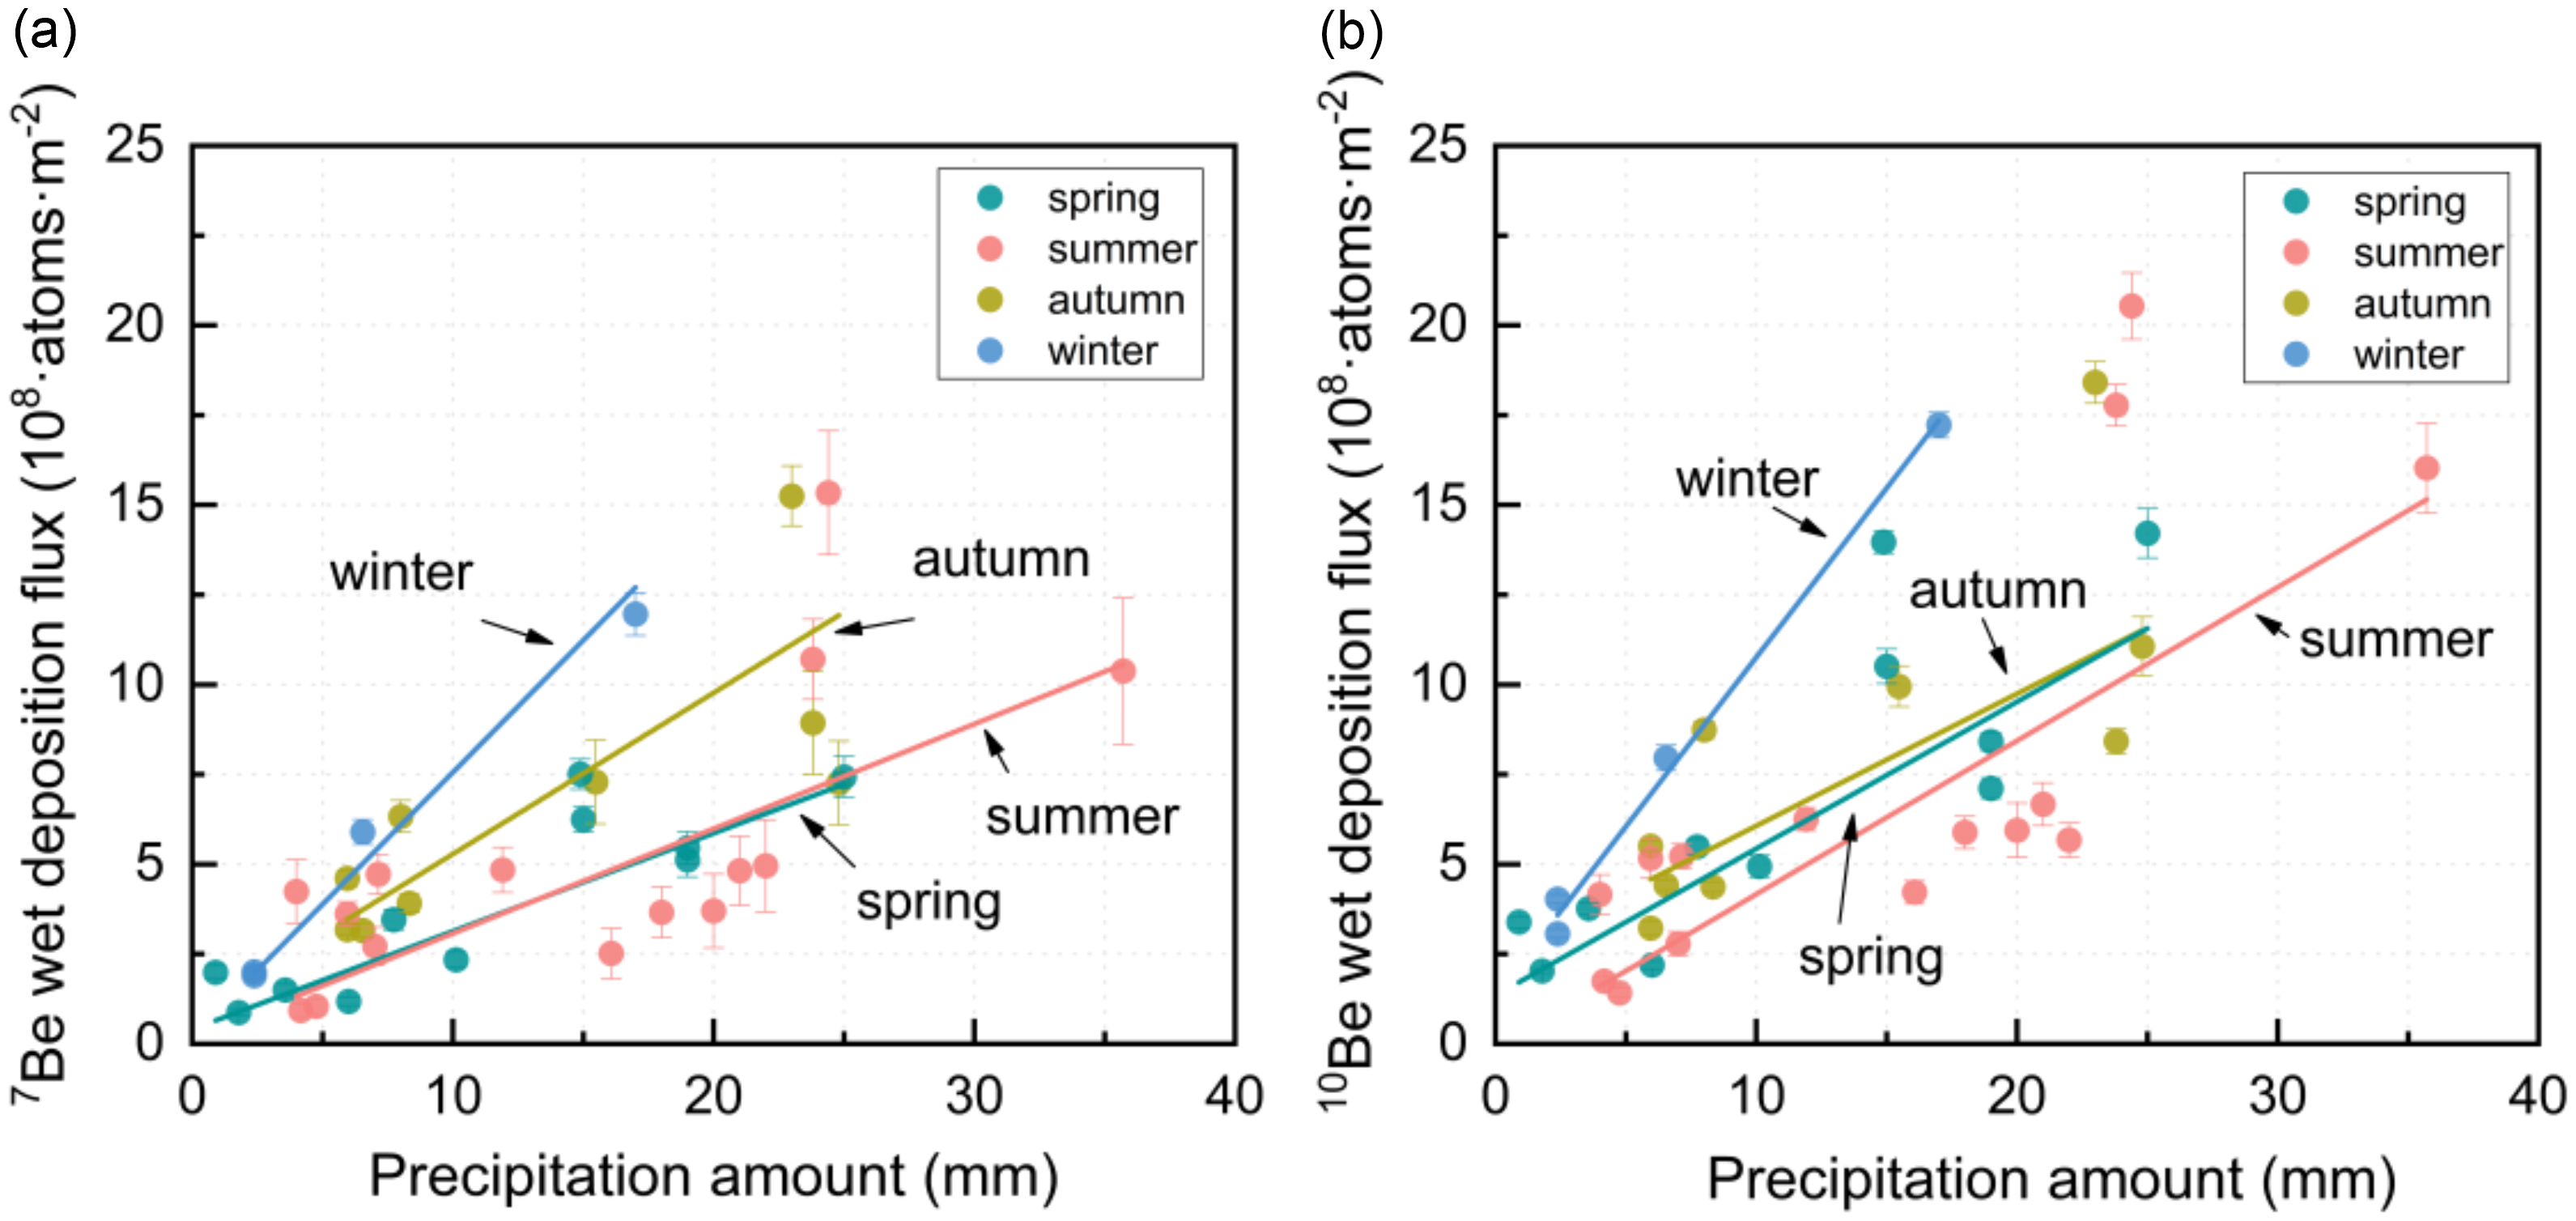
The wet deposition flux reflects the amount of 7Be and 10Be deposited per unit area via precipitation. Consistent with findings from other regions (Azimov et al. Reference Azimov, Safarov, Kungurov and Muminov2011; Ishikawa et al. Reference Ishikawa, Murakami, Sekine and Yoshihara1995), this work observed a positive correlation between precipitation amount and the wet deposition fluxes of 7Be and 10Be, with R2 of 0.47 and 0.52, respectively (Figure 6). In other words, high precipitation events bring about high 7Be and 10Be wet deposition fluxes.
Relation between the wet deposition fluxes of 7Be (a) and 10Be (b) and precipitation amount, respectively.

Compared to concentration, flux can better reflect the change of precipitation amount. Therefore, the flux is often used in the 7Be tracing of soil erosion process and the 10Be reconstruction of ancient precipitation.
Furthermore, we analyzed the seasonal correlation between the 7Be and 10Be wet deposition fluxes and precipitation amount. The correlation coefficients for 7Be wet deposition flux and precipitation amount were 0.98 in winter, 0.68 in spring, 0.51 in summer, and 0.57 in autumn. For 10Be wet deposition flux, the correlation coefficients were 0.97 in winter, 0.63 in spring, 0.63 in summer, and 0.39 in autumn (Figure 7).
Seasonal relationship between 7Be (a) and 10Be (b) wet deposition fluxes and precipitation amount, respectively.

In summer and autumn, the correlation between the 7Be or 10Be wet deposition flux and precipitation amount is relatively low. This may be due to the complete removal of 7Be and 10Be in the atmosphere during specific heavy rain events. This results in the loss of 7Be and 10Be in the atmosphere, thereby reducing the positive correlation between their wet deposition fluxes and precipitation amount.
To verify the above analysis regarding the reduction in 7Be and 10Be wet deposition flux during summer and autumn, this study utilizes the precipitation normalization coefficient (α) to analyze the relationship between precipitation amount and nuclide deposition flux across different seasons (Formula 2). An α value greater than 1.0 suggests that the deposition flux exceeds the expected value of rainfall, while an α value less than 1.0 indicates the depletion of radionuclide flux (Baskaran Reference Baskaran1995).
In the spring, summer, autumn, and winter, the 7Be α values were 1.02, 0.70, 0.83, and 1.90, respectively, while those of 10Be were 1.23, 0.90, 0.98, and 1.96, respectively. The α values of both nuclides were below 1 in the summer and autumn, above 1 in winter and spring, with the highest values observed in winter. This seasonal variation in α can be attributed to the increase precipitation in summer and autumn in Xi’an. High precipitation amounts and frequency leads to a relative depletion of nuclides in the atmosphere. The higher α values in spring and winter are likely due to the stratosphere-troposphere air exchange and increased dry fallout during these periods, resulting in a surplus of nuclides. These seasonal α patterns are observed in other studies, though the specific characteristics vary depending on regional climatic conditions (Du et al. Reference Du, Baskaran and Du2019; Duenas et al. Reference Duenas, Gordo, Liger, Cabello, Canete, Perez and Torre-Luque2017; McNeary Reference McNeary2003).
4.3 Effects of continuous rain events
In this study, a continuous rain event was defined as a precipitation event lasting one day or more. As mentioned in Section 4.1 above, changes in nuclide concentration have a dilutive effect, which also applies under continuous rainfall conditions observed in this study.
As shown in Figure 8a, more than 60% of the 7Be and 10Be concentrations were observed during the first day of most continuous rain events. However, in Period 5, the concentration on the second day exceeded that of the first, deviating from the typical pattern of concentration change. This anomaly likely stems from the relatively low precipitation volume and the presence of sufficient nuclides in the atmosphere for elution, which resulted in a gradual increase in concentration with the precipitation event. The wet deposition fluxes of 7Be and 10Be are primarily influenced by precipitation amount, a trend also evident in continuous rain events (Figure 8b).
Changes of 7Be, 10Be concentration (a) and wet deposition flux (b) with precipitation amount in continuous rain events.

4.4 The effect of deposition velocity
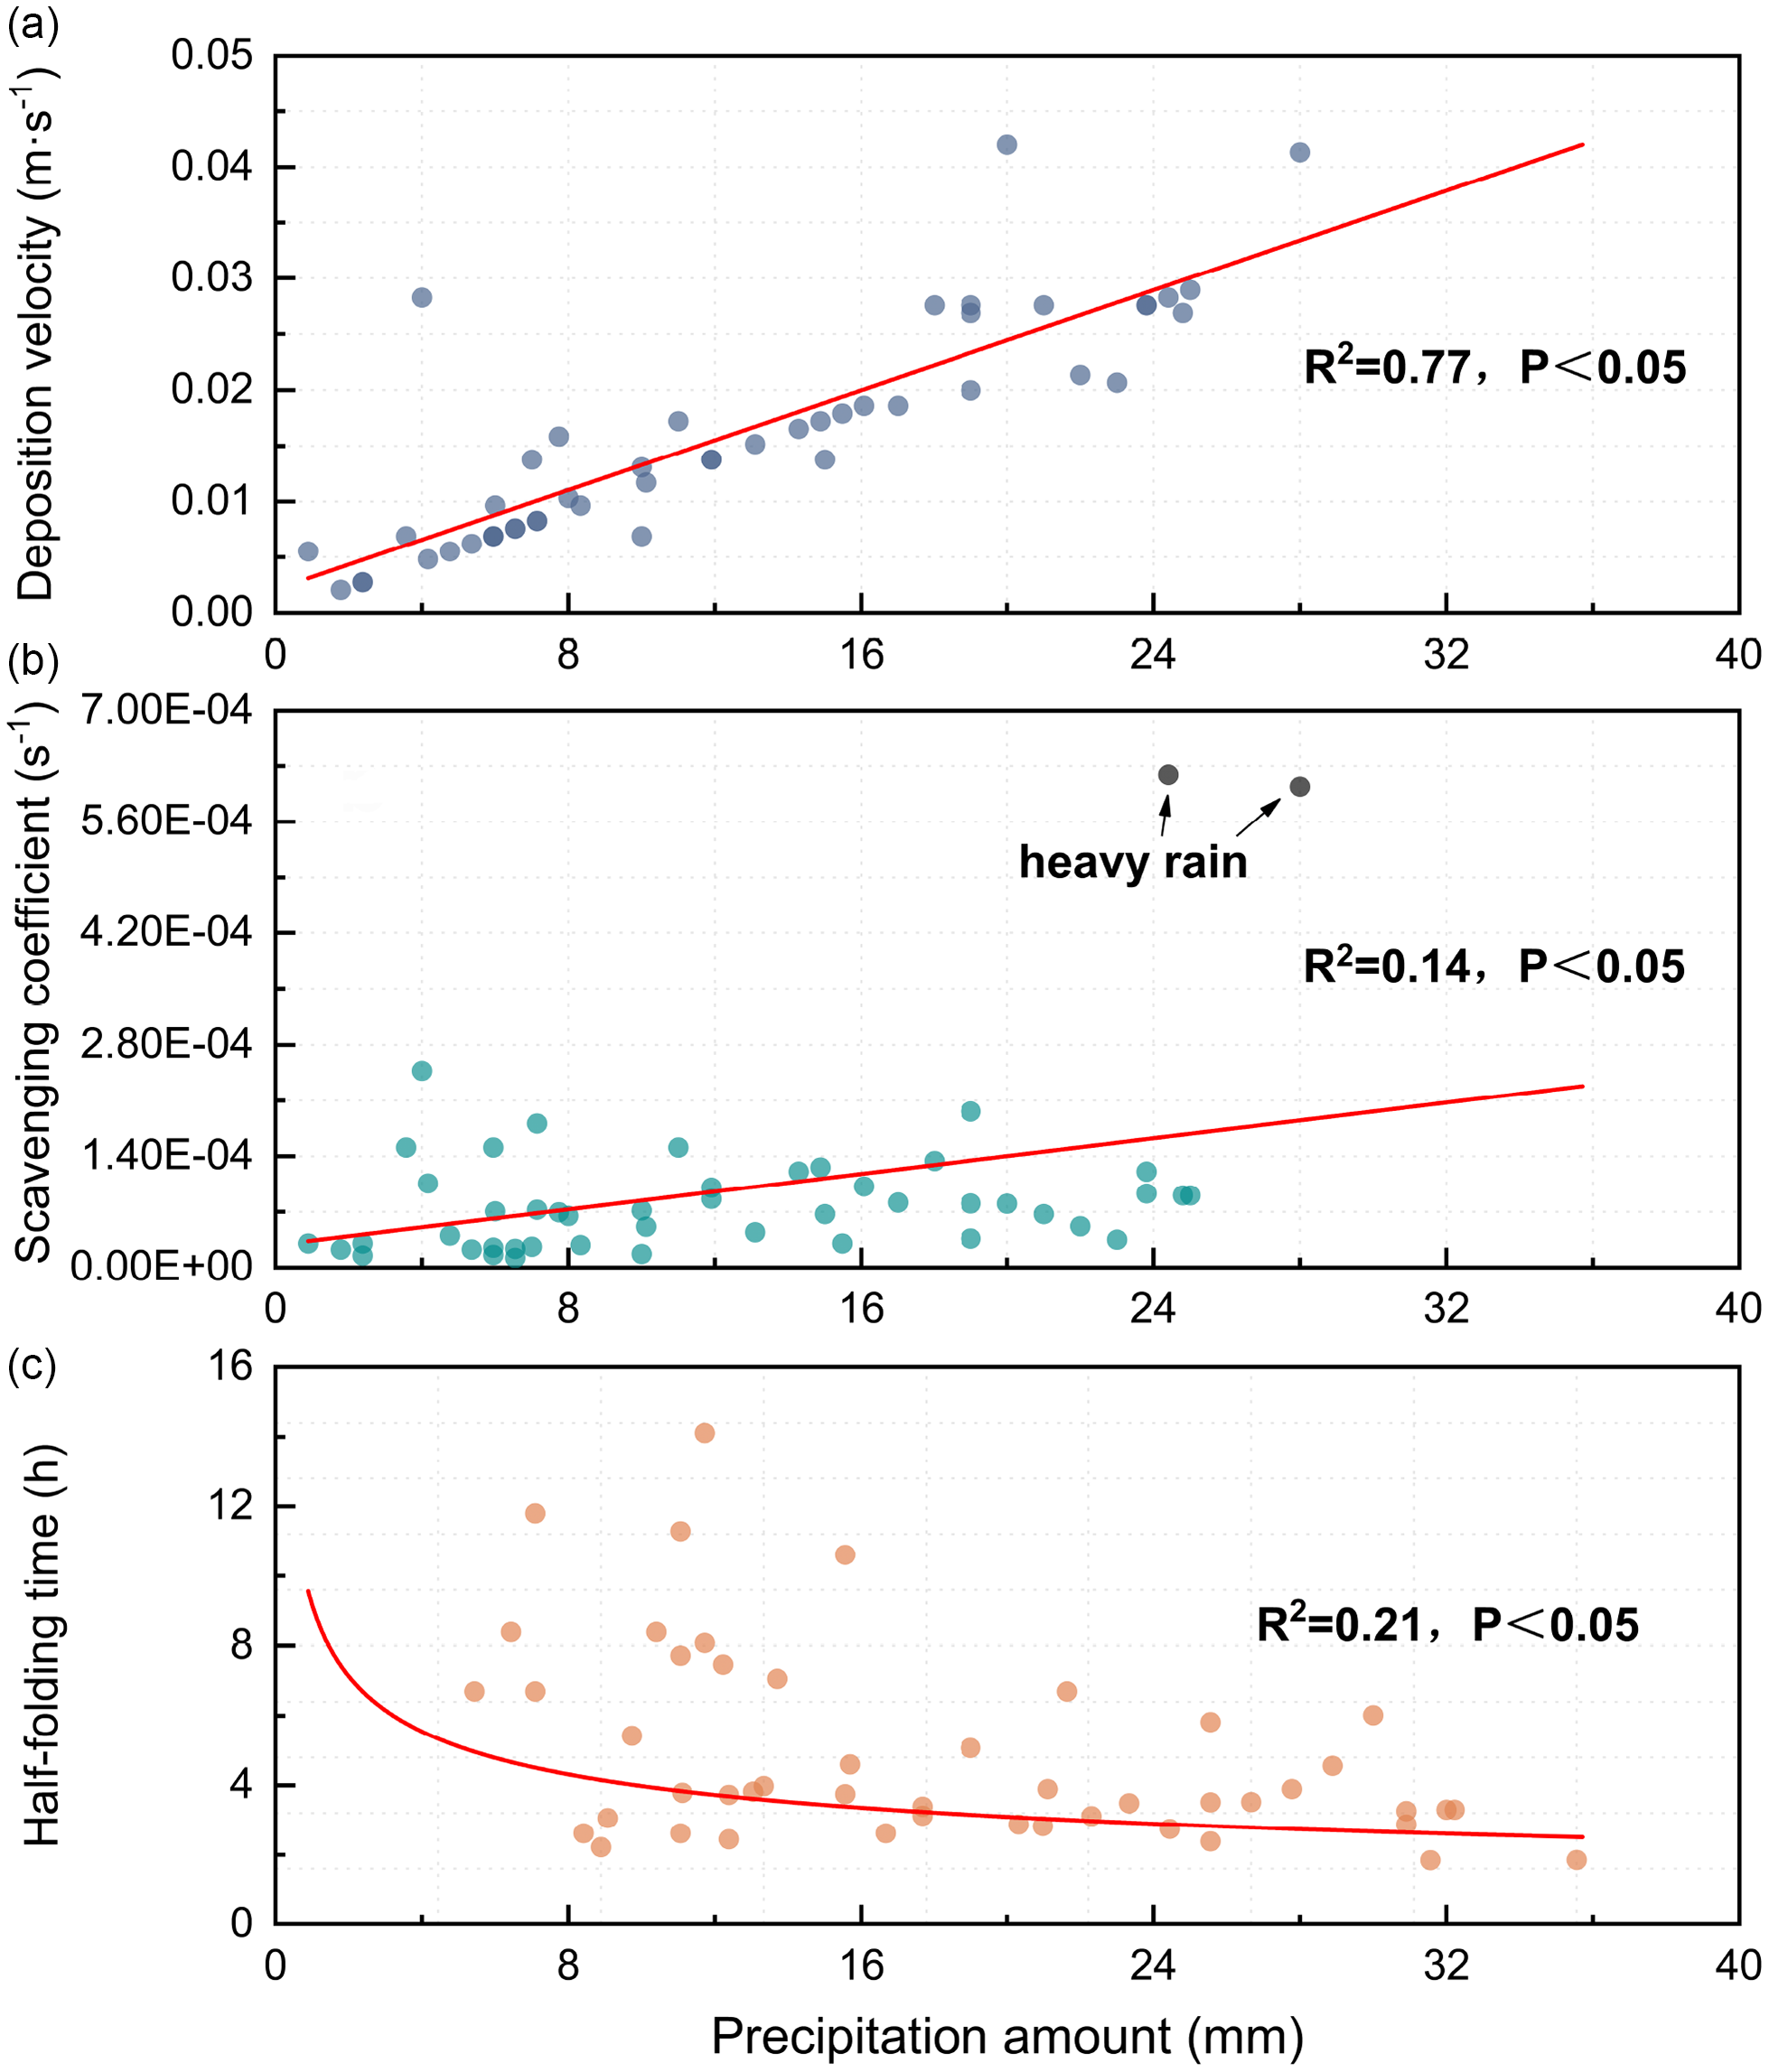
Deposition velocity relates the deposition flux of nuclides in rainwater to its concentration. In rain events, the monthly average wet deposition velocity is approximately 14.1 × 10⁻³ m·s−1, with a range of 5.2 × 10⁻³ to 22.0 × 10⁻³ m·s−1. The deposition velocity is comparable to that observed in other regions, including Shenzhen, China (22.5°N), with a mean monthly deposition velocity of 8.3 × 10⁻³ m·s−1 (Liu et al. Reference Liu, Wu, Li, Su and Ding2020), and Daejeon, South Korea (36.4°N), with a mean monthly deposition velocity of 6.3 × 10⁻³ m·s−1 (Chae and Kim Reference Chae and Kim2019). Malaga, Spain (36.7°N) exhibited a velocity of 9.1 × 10⁻³ m·s−1 (Duenas et al. Reference Duenas, Gordo, Liger, Cabello, Canete, Perez and Torre-Luque2017), while Finland (68.7°N) demonstrated a velocity of 11 × 10−3 m·s−1 (Leppanen Reference Leppanen2019).
A strong positive correlation was observed between precipitation and the deposition velocity of 7Be and 10Be, with a correlation coefficient of 0.77 and a p-value less than 0.05 (Figure 9a). The mean deposition velocity of 7Be and 10Be for groups with precipitation of 0.9–10 mm, > 20 mm, and > 37 mm is 0.8 × 10⁻³ m·s−1, 2.0 × 10⁻³ m·s−1, and 2.9 × 10⁻³ m·s−1, respectively.
The relationship between precipitation amounts and deposition velocity (a), scavenging coefficient (b) and half-folding time (c) of 7Be and 10Be, respectively.

4.5 The impact of the scavenging coefficient and half-folding time.
Scavenging coefficient measures the change in the concentration of 7Be and 10Be in the atmosphere over time, particularly within a specific area. This concept applies only to the average concentration in an instantaneous space. The scavenging coefficient is influenced by several factors, including precipitation intensity and precipitation type.
The 7Be scavenging coefficient ranges from 1.2 to 61.9 × 10⁻⁵ s−1, with an average value of 9.9 × 10⁻⁵ s−1 in Xi’an. The scavenging coefficient of 10Be is identical to that of 7Be. To estimate the scavenging coefficient, Kremenchutskii employed a methodology using the daily average 7Be concentration time series and precipitation duration data both preceding and occurring concurrently with the precipitation event. This approach yielded an estimate ranging from of 0.8 × 10⁻⁵ to 166.7 × 10⁻⁵ s−1 (Kremenchutskii Reference Kremenchutskii2021). Consequently, the estimates derived in this study fall within the range of values obtained by an alternative method in previous studies.
Most individual rain events in Xi’an are classified as moderate or light rain, with a duration exceeding 10 hours and a scavenging coefficient below 4.0 × 10⁻⁶ s−1. However, two heavy rain events, lasting approximately two hours and with precipitation intensity exceeding 20 mm, led to a notable increase in scavenging efficiency (Figure 9b).
Half-folding time is defined as the time required for precipitation to halve the concentration of nuclides in the atmosphere. In this study, the half-folding time for each rain event ranged from 0.3 to 15.6 hours, with an average of 4.3 hours. An exponential decrease in half-folding time was observed with increasing precipitation amount. The scavenging rate of heavy precipitation on atmospheric 7Be and 10Be concentration is at least 2.5 times that of weak precipitation.
4.6 Analysis of main influencing factors
The factors influencing the wet deposition of 7Be and 10Be include precipitation amount, type of precipitation event, deposition velocity, scavenging coefficient, and half-folding time, among others. The latter three factors are calculated from precipitation amount, duration, intensity, and wet precipitation data of 7Be and 10Be.
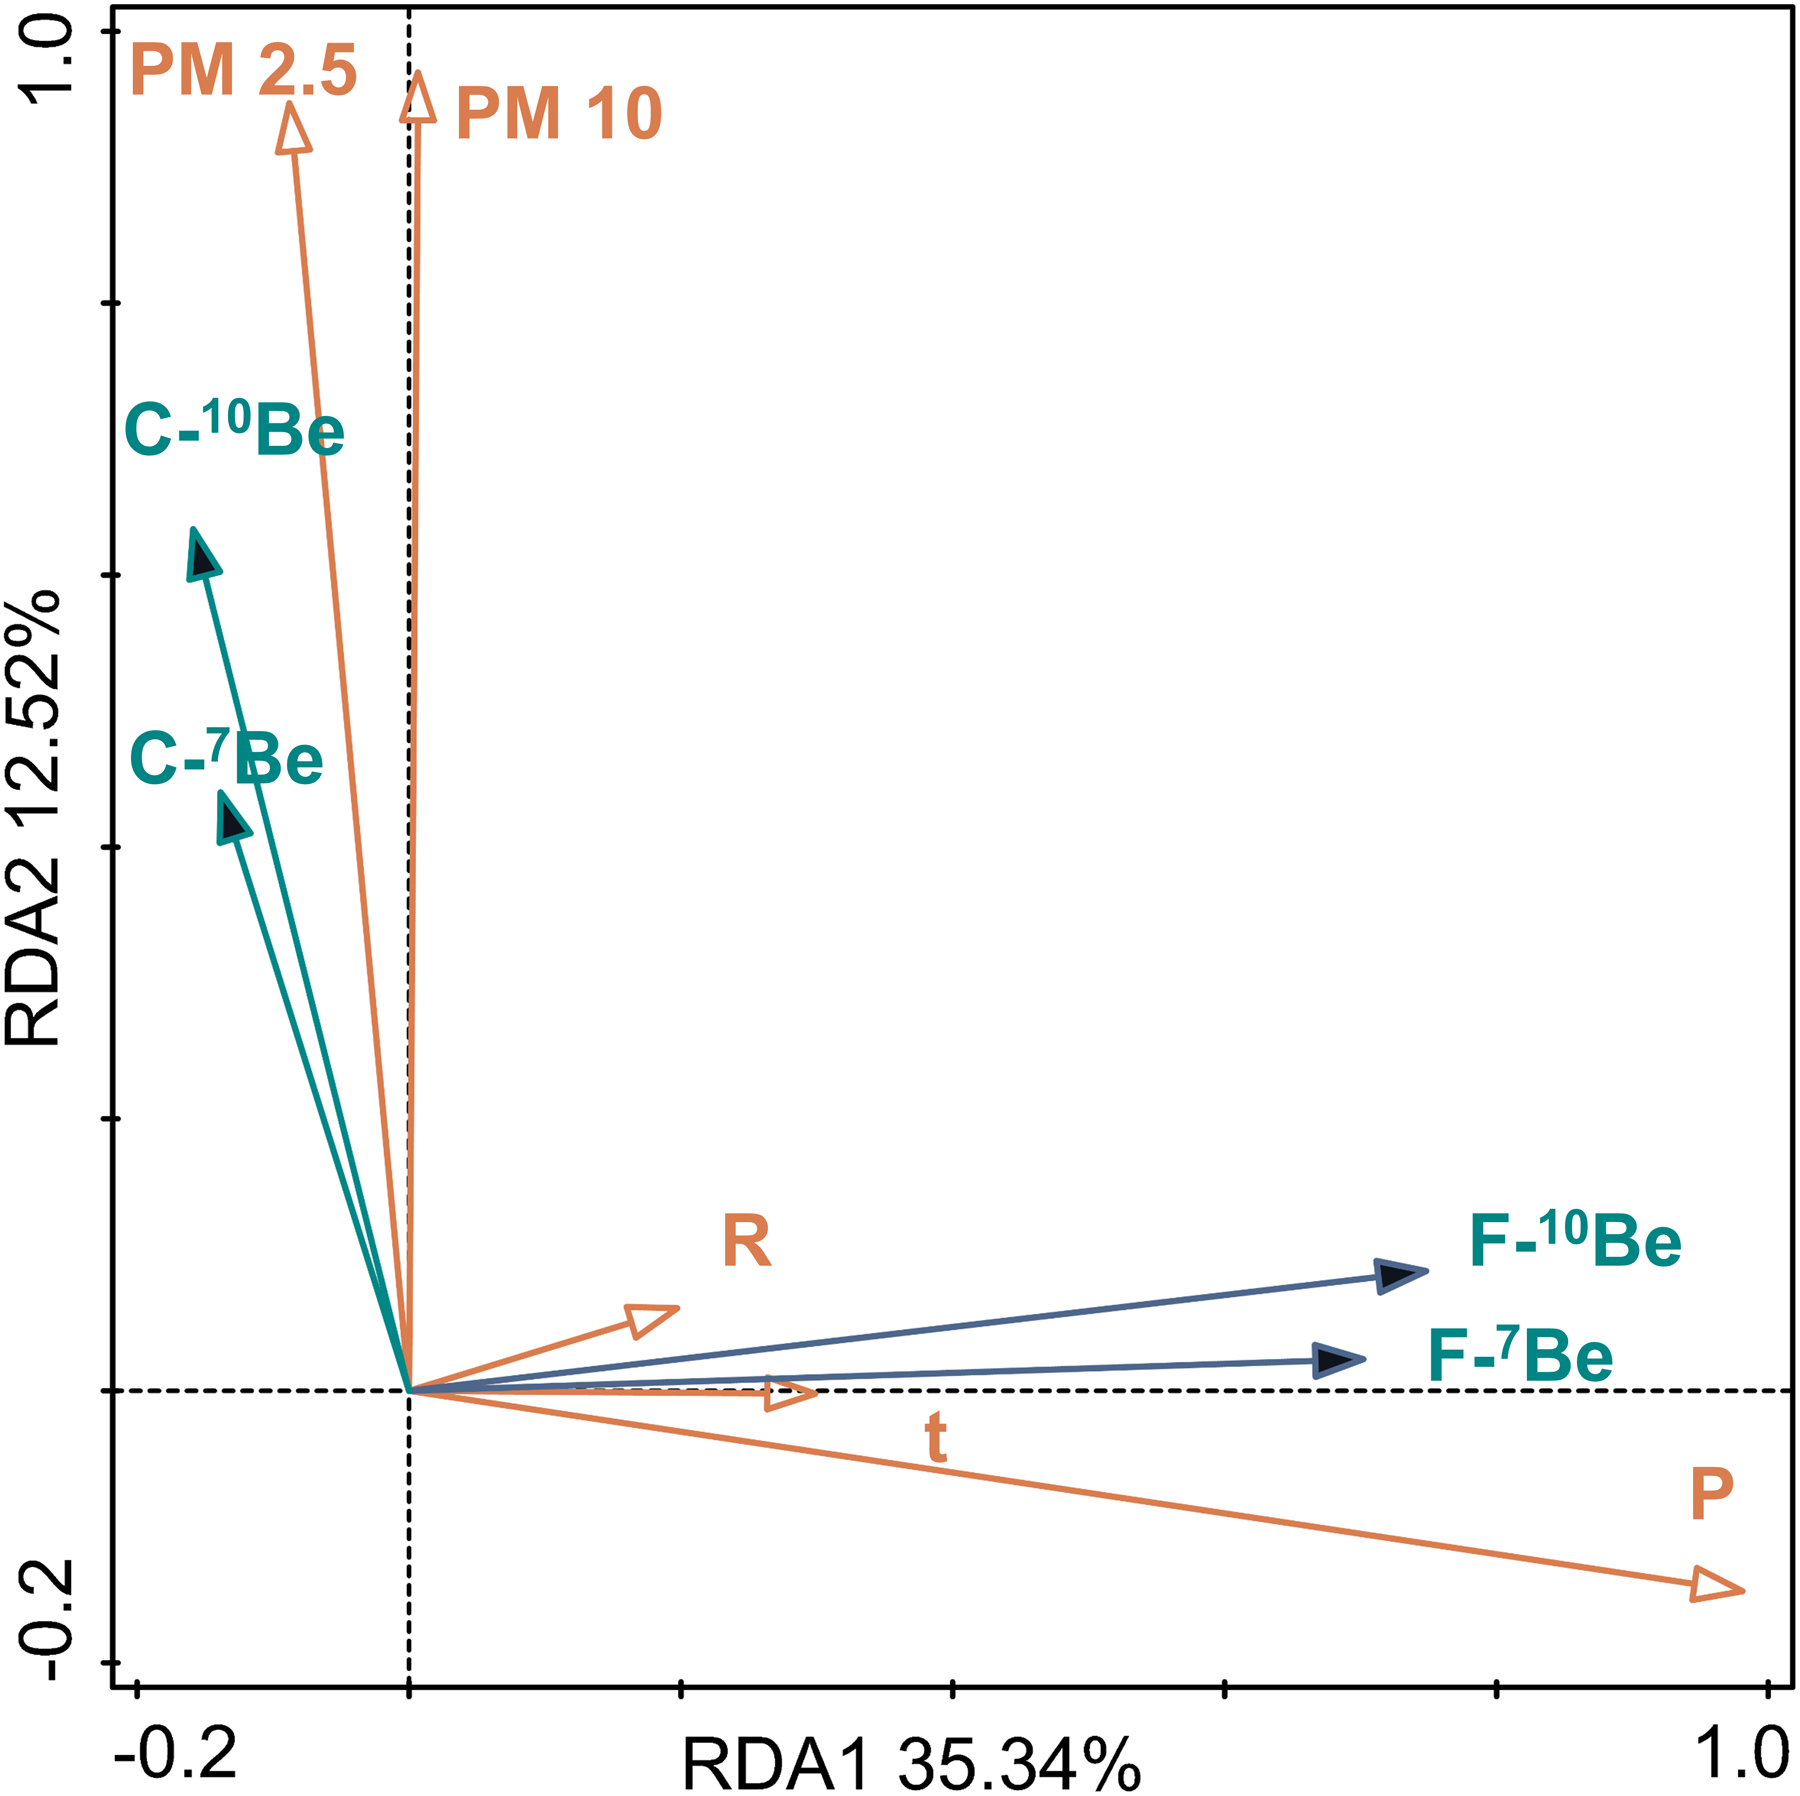
To analyze the environmental factors influencing the wet deposition of 7Be and 10Be, a series of key parameters were selected, including precipitation amount, intensity, duration, PM10, and PM2.5. Precipitation amount refers to the total rainfall collected during each event, while duration represents the length of an individual rainfall event. Precipitation intensity is the ratio of precipitation amount to duration. PM10 and PM2.5, representing coarse and fine particulate matter, respectively, act as carriers for 7Be and 10Be, influencing their transport and deposition.
Redundancy analysis (RDA) was used to identify the primary factors influencing the concentration and deposition flux of 7Be and 10Be in precipitation (Figure 10). The initial principal component is constituted by precipitation amount (P), duration (t), and intensity (R), which predominantly influence the wet deposition fluxes of 7Be and 10Be. Among these, precipitation amount is the most significant factor, with an increase in precipitation leading to a corresponding rise in deposition flux. The second principal component is composed of PM10 and PM2.5, which is primarily associated with the concentration of 7Be and 10Be in precipitation. This suggests that 7Be and 10Be are predominantly adsorbed onto fine particles for deposition. The correlation between the concentration of 7Be and 10Be in precipitation amount, intensity, and duration is weak, likely due the combined effects of precipitation dilution and atmospheric movement.
Main factors influencing the wet deposition behavior of 7Be and 10Be. The green arrows represent the concentration of 7Be or 10Be, the blue arrows depict the wet deposition flux of 7Be or 10Be, and the orange arrows indicate the primary influencing factors: PM2.5, PM10, precipitation amounts (P), precipitation duration (t), or precipitation intensity (R). PM2.5 and PM10 data from China National Environmental Monitoring Centre (https://air.cnemc.cn:18007/).

5. Conclusion
This study provides a detailed analysis of high-resolution and high-precision annual 7Be and 10Be wet deposition data in a low-precipitation area of central China. The total annual wet deposition fluxes of 7Be and 10Be in Xi’an for 2020/21 were (218 ± 24) × 108 atoms·m–2·y−1 and (314 ± 16) × 108 atoms·m–2·y−1, respectively. A strong positive correlation was observed between the concentrations of 7Be and 10Be in precipitation (R2 = 0.92; p < 0.05), as well as between their wet deposition fluxes (R2 = 0.95; p < 0.05), indicating that similar factors influence the wet deposition processes of 7Be and 10Be. No significant correlation was found between nuclide concentrations and precipitation amounts, suggesting that other precipitation parameters and atmospheric dynamics may play a role. However, a moderate positive correlation was observed between precipitation amounts and the precipitation fluxes of 7Be and 10Be (R2 = 0.47, 0.52; p < 0.05), with precipitation amount being the primary factor influencing nuclide deposition fluxes. High precipitation amount events usually resulted in elevated 7Be and 10Be wet deposition fluxes. During the observation period, the average monthly wet deposition velocity of 7Be and 10Be was approximately 14.1 × 10⁻³ m·s−1, and the average scavenging coefficient was 9.9 × 10⁻⁵ s−1. Heavy rain events increased the nuclide scavenging coefficient by approximately a factor of four. Additionally, the half-folding time of 7Be and 10Be showed an exponential decrease with increasing precipitation, and the rate of atmospheric scavenging of 7Be and 10Be due to heavy precipitation was at least 2.5 times that of weak precipitation.
Data availability statement
The 7Be and 10Be data from Xi’an presented in the manuscript are available at http://paleodata.ieecas.cn/FrmDataInfo_EN.aspx?id=8f8fbc1c-b541-4ed4-9aa3-057a0613e6bf (https://doi.org/10.12262/IEECAS.EAPSD2025001).
Acknowledgments
This work is granted by the Strategic Priority Research Program of Chinese Academy of Sciences (B) (Grant No. XDB40000000), the Youth Innovation Promotion Association CAS (Grant No. Y2021108), the National Natural Science Foundation of China (Grant No. 11975240, 12405336), the Natural Science Basic Research Program of Shaanxi (Grant No. 2024JC-YBQN-0298), the State Key Laboratory of Environmental Geochemistry (Grant No. SKLEG2024204), the Innovation Capability Support Program of Shaanxi Program (Grant No. 2025RS-CXTD-036).
Author contributions
Xinyi Du: Data curation and analysis, writing-original draft. Yunchong Fu: Conceptualization, sample measurement, writing-review and editing. Xuke Liu: sample measurement, writing-review and editing. Li Zhang and Yanting Bi: Sample pretreatment, writing-review and editing. Peng Cheng, Zhenchuan Niu, and Zhao Jin: writing-review and editing.
Competing interests
The authors declare no competing interests.