


Introduction
The permanent north polar cap of Mars consists of layers of H2O ice together with some dust and CO2 (as dry ice or clathrate) (Reference CliffordClifford and others, 2000). The cap has an extent comparable to the Greenland ice sheet. Mars Orbiter Laser Altimeter (MOLA) topographic data from the Mars Global Surveyor (MGS) provide a high-resolution map of the cap (Reference ThorsteinssonZuber and others, 1998), showing that the cap rises as a dome to around 2950 m above the surrounding terrain. A notable feature of the cap is a system of scarps and troughs organized in a spiraling pattern around a smooth region at the pole (Fig. 1). The surface appears white along the horizontal or north-facing slopes, while it appears dark along the 10–15° steep southwest-facing scarps. It has been proposed that there is net accumulation along the white slopes and net ablation along the dark scarps (Reference Howard, Cutts and BlasiusHoward and others, 1982; Reference FisherFisher, 1993). Sublimation due to solar insolation on the south-facing slopes is thought to account for the ablation, and causes the scarps to migrate towards the pole. This alternating pattern of accumulation and ablation is known as “accublation” (Reference FisherFisher, 1993). The cause for the spiraling pattern of troughs is not well understood. Proposed mechanisms include ice flow combined with accublation (Reference FisherFisher, 1993), or ablation combined with katabatic winds and wind erosion (Reference HowardHoward, 2000). In this paper, the first of these proposed mechanisms is examined, the accublation and ice-flow mechanism.
(a) Viking mosaic image of the north polar cap (U.S. Geological Survey/NASA Planetary Photo Journal, http://photojournal.jpl.nasa.gov/), showing the north polar region of Mars and covering approximately the area of (b). (b) MOLA shaded relief map of the north polar region of Mars from the pole to 75° N (image credit: MOLA science team, http://ltpwww.gsfc.nasa.gov/mola.html). The longitude is in ° E. The black line in the 160° E direction indicates 270 km along MOLA pass No. 404 from the pole. Figures 2–5 show the modeled flow along this line. The black line in the 100° E direction indicates a second line of 490 km along MOLA pass No. 380 from the pole. Afew results are shown from this line (Fig. 4).

The accublation and ice-flow mechanism is based on two assumptions: the white areas accumulate water ice and the dark scarps ablate, and there is ice motion from one type of zone to the other (Reference FisherFisher, 1993, Reference Fisher2000). Fisher used a simple axisymmetrical model of an ice cap with ice flowing radially outward from the dome. If the dome were displaced from the pole, scarps formed at the margin would migrate inward in a spiraling pattern as a consequence of this model. The assumed radial flow pattern is consistent with the flow pattern in terrestrial ice caps. In terrestrial ice caps, longitudinal stresses (compressive and extensional stresses in the direction of the flow) are generally small, and, to a first approximation, ice flow is governed by shear stress (e.g. Reference Paige, Bachman and KeeganPaterson, 1994). Consequently, ice flows in the direction of the steepest surface slope. On the north polar cap of Mars, MOLA topographic data show that scarps and troughs imply large surface elevation gradients on the cap, and the surface can be pole-facing over 450 km in the radial direction from the pole. Longitudinal stresses associated with the scarps and troughs are significant, but it has remained unknown whether the longitudinal stresses are significant enough to allow ice flow to pass the troughs (the question was discussed at the International Workshop on the Martian Polar Caps, held in Copenhagen, 1999).
The proposed accublation and ice-flow mechanism of forming the spiraling troughs has been developed further, in order to make testable predictions (Reference FisherFisher, 2000). A phenomenological model with simplified ice flow was used to predict the internal layering. The model used standard approximations for terrestrial ice caps, assuming that ice flow is driven by shear stress only. It was shown that the systems of scarps and troughs would give rise to waviness and discontinuities in the internal layering, and age discontinuities in the layers exposed on the dark scarps (Reference FisherFisher, 2000).
The purpose of this work is to examine the fundamental assumptions of the accublation and ice-flow mechanism of forming the spiraling troughs: Are longitudinal stresses capable of dragging ice past deep troughs? Is the internal layering beneath the troughs and exposed at the scarps adequately captured by simplified dynamics? A finite-element ice-flow model is used to perform a quantitative analysis. It is assumed that the cap consists of flowing water ice. The model calculates the flow along a flowline, and it is unique because all stresses are included, including longitudinal stresses. The results are discussed in relation to formation mechanisms of scarps and troughs.
The Model
The model assumes an axisymmetrical cap and calculates the temperature-dependent ice flow along a line running from the ice-cap center to the margin. The assumption of axial symmetry is justified by the general topographic pattern, with larger surface topography gradients along longitudes than along latitudes (Fig. 1). Full description of the complex three-dimensional topography and the spiraling pattern would require a three-dimensional model, and is not possible with existing models and computing capacity.
In this study, a 270 km long part of MOLA pass No. 404 extending in the 160° E direction from the pole to the margin of the cap is considered (Fig. 1). The topography along this line shows the characteristic features of the cap: distinctive systems of scarps and troughs, a smooth central region, and scarps and troughs being more pronounced as the margin is approached. The pass is assumed to represent a flowline. In addition, a 490 km long part of MOLA pass No. 380 extending in the 100° E direction from the pole to the margin was considered for comparison (Fig. 1), and the results are used in the discussion below. These two lines were chosen because the topography along the lines appears not to be influenced by the major re-entrants, Chasma Boreale and the smaller re-entrant in the 230° E direction (Fig. 1).
The ice-flow model
The model was originally developed and applied to terrestrial ice sheets (Reference Howard, Cutts and BlasiusHvidberg, 1996; Reference HvidbergHvidberg and others, 1997). It is based on the continuum mechanics, and assumes that ice is incompressible, heat-conducting, and deforming with a power-type flow law with strong temperature dependence (Glen’s generalized flow law (Reference GlenGlen, 1955; Reference Paige, Bachman and KeeganPaterson, 1994)):

where ἑij are strain rates, sij are deviatoric stresses, τ is the second invariant of the stress deviator tensor, A(T) is the flow-law rate factor, which depends on ice temperature T through an Arrhenius equation, and n is the power. The model uses an axisymmetric coordinate system and includes all components (i.e. shear stress, compression or extension, and divergence transverse to the flowline) in the standard axisymmetric stress equilibrium equations (here expressed in terms of the deviatoric stresses),
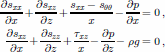
and the continuity equation

where x is the horizontal, radial coordinate, 9 is the angular coordinate in the axisymmetric coordinate system, z is the vertical coordinate, u and w are the horizontal and vertical velocities, respectively, p is the density of the cap and g is gravity. The surface is assumed stress-free, and the cap is assumed frozen at the bottom (no sliding). The temperature is calculated from the heat-flow equation, in this study simplified to steady state and decoupled from the ice-flow equations. The heat-flow equation is written in axisymmetric coordinates of the form:

where k is thermal conductivity of the cap, c is heat capacity of the cap, and ui and wi are assumed simple horizontal and vertical velocity fields used to calculate the thermal advection. They are calculated from the equation of continuity by assuming a uniform accumulation of 0.5 mm a–1 and simple velocity profiles (vertical velocities are around 0.5 mm a– 1at the surface and decreasing linearly to zero at the bottom). The basal heat flux and the surface temperatures constitute the boundary conditions.
The system of Equations (1–4) is solved numerically with an optimized finite-element technique based on Galerkin’s principle. The velocity, pressure and temperature fields constitute the unknowns of the problem. The model uses 9-node, quadratic elements, and the profile is represented by a grid of 221 horizontal × 15 vertical nodes (133 horizontal nodes in the second profile). More details of the model are available in Reference Howard, Cutts and BlasiusHvidberg (1996).
The model is used here to calculate the velocity and tem
perature fields in the ice corresponding to an assumed surface and basal topography. This is an instantaneous picture of the flow pattern, and no assumptions of mass balance are involved. It is a necessary approach, as high-resolution topography data are available while no direct mass-balance data exist.
Model parameters
The thickness of the cap is not well constrained. Gravity data from the MGS indicate that the cap is in isostatic equilibrium with the underlying base (Reference Shubert, Solomon, Turcotte, Drake, Sleep, Kieffer, Jakosky, Snyder and MatthewsSmith and others, 1999). The maximum isostatic deflection of the base has been estimated to be 500–1200 m (Reference ThorsteinssonZuber and others, 1998; later analysis estimated the deflection to be 400–1200 m (Reference Ivanov and MuhlemanJohnson and others, 2000) ). We assume a uniform isostatic depression of 22% along the profile, implying a deflection of 850 m at the pole (found as the average of the values by Reference ThorsteinssonZuber and others (1998)). Figure 2 shows the geometry of the considered profile, with the observed scarps and troughs and estimated ice thickness. The outermost trough has a depth of around one-third of the estimated ice thickness.
Calculated flow and temperature fields along the flowline (pass No. 404). The boundaries of the profile consist MOLA topography and the estimated base along the flowline. The flow is assumed to be axisymmetric.

The cap is assumed to deform as water ice according to the flow law (Equation (1)). We use a power of n = 3 and flow-rate factor parameters recommended by Reference Paige, Bachman and KeeganPaterson (1994), as commonly done for terrestrial ice glaciers. We also made calculations using the Goldsby and Kohlstedt flow law with n = 1.8 (Reference Goldsby and KohlstedtGoldsby and Kohlstedt, 1997) (see discussion below).
Significant uncertainties are associated with the parameters determining the ice temperature (see, e.g., Reference Johnson, Solomon, Head, Phillips, D. E. and ZuberLarsen and Dahl-Jensen, 2000). The mean annual surface temperature is assumed to be 155 K at the pole (Reference Johnson, Solomon, Head, Phillips, D. E. and ZuberLarsen and Dahl-Jensen, 2000). The surface temperatures along the flowline are calculated by using a lapse rate of –2.5°C km–1 (Reference ZuberZurek and others, 1992) and a latitudinal dependence of 1.75 K (° lat)–1. The longitudinal dependence was chosen in order to have a 20 K difference in the mean surface temperature between the pole and the margin (as in the estimated summer temperatures for the north polar cap of 200–220 K (Reference MellonPaige and others, 1994)). The value is slightly higher than the 1.5 K (° lat.)–1 used by Reference GreveGreve (2000). With vertical velocities of <1mma–1, the vertical advection is small. As a consequence, the temperature increases almost linearly down through the ice, and the basal temperature is determined by the thermal properties of the cap and the basal heat flux. We have chosen thermal parameters in order to have a basal temperature of 200 K at the pole, in accordance with previous studies of the thermal regime of the cap (Reference GreveGreve, 2000; Reference Johnson, Solomon, Head, Phillips, D. E. and ZuberLarsen and Dahl-Jensen, 2000) (other combinations of parameters could be chosen to give a similar thermal regime). The basal heat flux is assumed to be 35 mW m–2 (Schubert and others, 1992). For pure water ice, the heat capacity cice and the thermal conductivity kice are temperature-dependent (e.g. Reference GreveGreve, 2000):

and

We have chosen a heat capacity of 0.9cice and a thermal conductivity of 0.75 kice, yielding an average thermal conductivity of around 2.5 W m–1 K–1.
Other model parameters are the cap density, which is assumed to be the density of ice (ρ = ρice = 917 kg m–3), and the gravity which is set to g = 3.72 ms–2, about one-third of the gravity on Earth.
Results
The resulting fields of ice flow and ice temperatures along the flowline are shown in Figure 2. The temperatures increase almost linearly from the cold surface to basal temperatures around 200 K at the center. The basal ice beneath troughs is slightly colder than in the neighboring areas because the ice is thinner at the troughs.
The horizontal ice velocities are generally outward from the center (Fig. 2b and 3b), except in two zones (Fig. 2b and marked in Fig. 4). Away from the scarps/troughs, flow velocities are on the order of 0.1–1 mm a–1, in accordance with the results by Reference GreveGreve (2000). At the scarps the flow is accelerated, with velocities on the order of cma–1. Beneath a scarp, the horizontal velocities are enhanced over the whole ice thickness. The vertical velocities are downward at the scarps and upward in the troughs.
Calculated flow along the flowline (pass No. 404): (a) MOLA topography; (b) horizontal surface velocity; (c) vertical surface velocity; and (d) mass balance required for maintaining a steady-state topography over time (see text).

The topography gradients associated with the scarps and troughs obviously influence the stress fields greatly and imply significant longitudinal stresses. The resulting flow pattern shows that longitudinal stresses are large enough to drag the lowest part of the ice past the three smaller troughs (Fig. 2 and 4). Even at the third trough (around 125 km from the pole), where the surface slope is north-facing and the trough is up to 10 km wide, horizontal velocities are positive near the bottom of the cap. This suggests that longitudinal stresses work over several ice thicknesses. At the two outermost, larger troughs, the horizontal velocity is negative and ice flow is poleward on the north-facing side (Fig. 4). Around 180 km from the pole, the surface slope is negative over almost 50 km, and the horizontal flow velocities are small but negative.
Direction of the horizontal flow for MOLA pass Nos. 404 (a) and 380 (b). Gray zones have outward horizontal flow, while black zones have poleward horizontal flow. The poleward flow is slower than 0.5 mm a–1.

Figure 3 shows the surface velocities and topography. At the scarps, horizontal velocity is seen to peak when the surface slope is at a maximum, as expected. The vertical velocity clearly demonstrates that ice flow tends to smooth the surface, with extreme velocities at the top of the scarps and in the bottoms of the troughs, places where the surface topography deviates most from an average descending surface. The mass balance required in order to maintain a steady-state topography over time (Fig. 3d) balances the emergence velocity. Emergence velocity is defined as ws – us∂S/∂x, where ws and us are the vertical and horizontal surface velocities, respectively, and S is the surface topography (Reference Paige, Bachman and KeeganPaterson, 1994). The emergence velocity measures the upward or downward flow of ice relative to the glacier surface at a point fixed in space. A steady state would require accumulation along the horizontal areas and at the top of scarps, and ablation in the troughs, thus supporting the accublation theory (Reference FisherFisher, 1993).
By assuming steady state, an ensemble of particle paths is calculated from the velocity field (Fig. 5). It is not known whether the cap is in steady state now, or over the time required for ice to move along the particle paths. However, the particle paths serve to illustrate the present flow pattern and how it is influenced by the scarps. The resulting particle paths show that ice moves downward in the horizontal areas, and upward beneath a trough. For a steady-state cap, the resulting particle paths confirm Fisher’s ideas (Reference FisherFisher, 1993, Reference Fisher2000) that ice deposited along the horizontal surfaces is transported with the flow down into the cap and emerges later at the surface in a trough. Our result is based on continuum mechanics without any assumptions of mass balance, in contrast to Fisher (2000), who assumed a distribution of mass balance. The particle paths (Fig. 5) further confirm that scarps produce waves in the internal layering, and age discontinuities at the surface (Reference FisherFisher, 2000). The particle paths also show that the model by Reference FisherFisher (2000) breaks down at locations where ice is stagnant or moves poleward. As mentioned above, flow is poleward at two places, and one place is beneath the north-facing side of the trough closest to the margin. As a result, trajectories from both sides of the trough emerge close to each other at the bottom of the trough, and the outermost part of the cap is dynamically separate from the rest of the cap (Fig. 5). We have also modeled the flow along part of the MOLA pass No. 380 in the 100° E direction (Fig. 1). Ice is stagnant or slowly flowing poleward at the north-facing side of several troughs along this line (Fig. 4). The line is thus divided into several dynamically separate units. These results are important and have consequences for understanding the formation mechanism of the spiraling troughs.
Particle paths derived from the modeled velocity field along pass No. 404 by assuming steady state. (a) An enlargement of a part of the flowline, and (b) the full line. Dashed lines in (b) indicate the bounds of (a). Blue lines have outward horizontal movement, while red lines have inward horizontal movement. The two bold trajectories originate >50 km from each other but emerge at the surface <5 km apart. The travel times along the lines are 150 and 60×106 years, respectively.

Discussion
The flow law
The model assumes that ice deforms according to Glen’s flow law (Reference GlenGlen, 1955). Glen’s flow law is an empirical relation established for the stress regime found in terrestrial glaciers, where ice deforms primarily by dislocation glide in basal planes. At lower stresses, Reference Goldsby and KohlstedtGoldsby and Kohlstedt (1997) showed that ice deforms by grain-boundary sliding, and the flow rate depends on the grain-size. They established a flow law in the low-stress regime from laboratory experiments performed at around 200 K. The flow law is a power law with n = 1.8, and the flow-law rate factor has a power-law dependence on the grain-size. We have run the model assuming the Goldsby and Kohlstedt flow law with a grain-size of 1mm and all other parameters unchanged. From the pole to around 175 km from the pole, horizontal velocities are around twice as high as with Glen’s flow law, but still on the order of 0.1–1mma–1. Outward of around 175 km from the pole, the velocities are similar between the two flow laws. With the chosen grain-size of 1 mm, the ice is slightly softer with the Goldsby and Kohlstedt flow law, but the general picture is similar to the results with Glen’s flow law. Other grain-sizes would affect the magnitude of the velocities through the strong influence on flow-law rate factor, but the effect of scarps and troughs on flow would be similar.
Other factors not accounted for may also influence the flow law, including a high dust content in the cap or possible layers of CO2 ice. The influence of dust on the rheology is not well constrained. A dust content of around 0.1 % weight, as found in the silty basal layer in the Greenland ice sheet (Reference Smith, Sjogren, Tyler, Balmino, Lemoine and KonoplivThorsteinsson, 1990), has a softening effect (Reference Dahl-Jensen and GundestrupDahl-Jensen and Gundestrup, 1987). In the Martian polar caps, the dust content may be higher (e.g. Reference CliffordClifford and others, 2000). A dust content of 10% may harden the ice by 20% (Reference DurhamDurham, 1998), and higher contents of dust may have a cementing effect on the ice–dust mixture.
Thermal properties and ice temperatures
Ice temperatures in the north polar cap are thought to increase by several tens of °C from surface to base, and it is therefore necessary to consider the temperature dependence of the flow.
The thermal parameters are chosen in order to have a basal temperature at the pole of around 200 K, in accordance with previous estimates (Reference GreveGreve, 2000; Reference Johnson, Solomon, Head, Phillips, D. E. and ZuberLarsen and Dahl-Jensen, 2000). All the models, however, are limited by the lack of data. The basal heat flow, the composition of the cap, the conductivity of the different constituents, and the ice thickness are crucial for the temperature field, yet they are poorlyconstrained at present. We choose a heat capacity lower than that of pure ice, because the cap is thought to contain dust, and the dust may have a heat capacity as rock of around 800J kg–1K–1. Assuming a dust content of around 20%, the heat capacity of the ice–rock mixture is 0.9cice as we use. The basis for choosing a thermal conductivity lower than that of pure ice is that the cap may contain dust and layers of CO2 ice. Pure water ice has a conductivity of 2– 3 W m–1K–1, while CO2 ice has a conductivity of around 0.5Wm–1K–1 (Reference Larsen and Dahl-JensenMellon, 1996), and ice–dust mixtures may have a lower conductivity than pure ice (see discussion by Reference CliffordClifford (1987)).
A simple velocity pattern was applied in order to calculate the advection. The velocities of this simple pattern are on the order of mm a–1 or less, resulting in relatively insignificant advection. Thus, the temperature increases almost linearly from surface to base, similar to previous calculations (Reference GreveGreve, 2000; Reference Johnson, Solomon, Head, Phillips, D. E. and ZuberLarsen and Dahl-Jensen, 2000). Our results show that the vertical velocities are upward and enhanced by an order of magnitude at the troughs, resulting in an upward advection of warm basal ice. If taken into account, this effect may counter act the cooling effect from the ice being thinner at the troughs. Warmer ice beneath the troughs would further enhance the flow velocities.
Implications for the formation mechanism of spiraling troughs
The model assumes axisymmetric flow and is not capable of simulating the spiraling of the troughs. If the cap flows, the flow will follow the descending surface averaged over some distance (related to the reach of longitudinal stresses). Generally, the surface slope is larger across the troughs than along the troughs. A straight line radiating from the center appears to be a reasonable approximation to a flowline, althoughthe spiraling structure is neglected.
Our results show that ice moves outward at the three minor troughs closest to the pole. At the two major, outermost troughs, ice moves poleward and divides the flowline into dynamically separate parts. Our results show further that poleward flow occurs at several places along the second flowline (pass No. 380) (Fig. 4). The assumption that ice moves between alternating zones of accumulation and ablation (Reference FisherFisher, 2000) breaks down at the zones with poleward movement. As seen on the map (Fig. 1), all troughs along the two flowlines are part of the spiraling pattern. If ice flow has contributed to forming the spiraling troughs, its effect should be the same at all troughs. Our calculated flow pattern does not show the same effect at all troughs (Fig. 4), suggesting that ice flow is not actively forming the spiraling troughs at present. If ice flow has contributed to formation of spiraling troughs, other processes must have deepened and eroded the troughs since then (e.g. increased sublimation in the trough due to higher dust concentrations (Reference Hvidberg, Dahl-Jensen and WaddingtonIvanov and Muhleman, 2000) or wind erosion). Alternatively, the spiraling troughs could be forming by a currently active process, for example, erosion by katabatic winds as proposed by Reference HowardHoward (2000), with ice flow having a secondary role as a formation mechanism.
The calculated velocity pattern illustrates how ice flow is smoothing the surface. If no other mechanism occurs, ice flow may close the troughs within a roughly estimated time of 105–106 years (found as a scarp height of around 1km divided by an upward velocity of 1cma–1 and accounting for decreasing velocities as the surface slope decreases), which is a relatively short time on geologic time-scales. This relatively short time-scale for smoothing troughs by flow suggests that the troughs are formed by a process operating at present. Ablation is needed to prevent the troughs from being closed by flow. Assuming that scarps and troughs are being actively formed and maintained by processes occurring at present, these mass-balance processes must involve sublimation rates at the scarps/troughs that exceed the current estimated ice-flow velocities of a few cm a–1. Even if ice-flow velocities are small compared to accumulation and ablation processes (e.g. sublimation rates), they may contribute to controlling the depth of troughs and the distance between them.
Conclusions
We have used a finite-element ice-flow model to calculate the flow pattern along a MOLA pass from the north pole to the cap margin. The polar cap was assumed to be axi-symmetric and to deform as water ice according to Glen’s flow law. The surface topography was determined by MOLA topographic data. Our resulting flow pattern shows that velocities are on the order of 0.1–1mm a–1, but are enhanced at scarps/troughs to cm a–1. Ice flow tends to smooth the surface, and it is estimated that flow alone would smooth away the pronounced scarps and troughs within 105–106 years. Sublimation rates must be at least in the order of cma–1 in order to keep the troughs open.
The calculated flow pattern associated with the scarps and troughs confirms part of the accublation and ice-flow model proposed by Reference FisherFisher (1993, Reference Fisher2000). Ice deposited along horizontal areas moves down through the ice and emerges later at the surface in a scarp/trough. Beneath a trough, ice is dragged upward, and waves are formed in the trajectories. Longitudinal stresses associated with the scarps and troughs are able to drag the lower part of the ice past minor troughs. Our results show, however, that ice does not move past major troughs. At the pole-facing sides of major troughs, ice is stagnant or flows slowly towards the pole, implying that these troughs divide the cap into dynamically separate units. Therefore, Fisher’s assumption of ice movement being outward from the pole and passing the troughs and scarps (Reference FisherFisher, 1993, Reference Fisher2000) breaks down at major troughs. Thisresult suggests that ice flow is not actively contributing to formation of the spiraling scarps/troughs at present. Alternatively, a mechanism other than ice flow could be responsible for the spiraling structure. Therelatively shorttime-scale for closing polar troughs by flow suggests that the spiraling troughs are formed by a currently active process (e.g. sublimation combined with erosion by katabatic winds (Reference HowardHoward, 2000)).
Acknowledgements
This work was supported by the Danish Natural Science Research Council. K. E. Fishbaugh is gratefully acknowledged for providing a valuable review.



