NOMENCLATURE
- Ma
Mach number
-
 $\eta$
The cooling efficiency
-
$T_{g-in}$
the gas temperature inside the ball head before liquid nitrogen is introduced
-
$T_{g-out}$
the gas temperature inside the ball head after liquid nitrogen is introduced
-
$T_{s}$
the surface temperature of the ball head
- CCD
Charge-coupled Device
1.0 INTRODUCTION
With the rapid development of aerospace and aviation technology, the heat load on aircraft components exposed to high heat flows has increased rapidly. Especially for high-speed aircraft, when the flight Mach number is 6.5 and the flight altitude is 28km, the maximum heat load to the aircraft is 2.7mW/m2(Reference Bouchez and France1), while when the Mach number is 10 and the altitude is 35km, the maximum total temperature can reach 3900K(Reference Jackson, Eklund and Fink2). The aerodynamic heating due to the incoming flow means that the head much bears a high temperature, while the imaging window on the side of the aircraft also suffers from serious aerodynamic heating, which will affect the accuracy of the detection device. There is no doubt that effective means for thermal protection are thus necessary. In general, when high-speed aircraft fly at high altitude, the head is usually made of high-temperature-resistant materials to resist the flow erosion. A few relevant active cooling measures are also available for the head of aircraft. Many mechanistic experiments have been carried out to study phase-change transpiration cooling schemes for heads made from dense materials, and such research has been extended to the military and civil fields, including the combustion chambers of scramjets, the leading edges of hypersonic vehicles(Reference Choit, Scottit, Song and Ries3–Reference Reimer, Kuhn, Esser, Sippel and Van Foreest5), first-stage gas turbine blades(Reference Wang, Messner and Stetter6–Reference Treviño and Medina8) and rocket nozzles(Reference Greuel, Herbertz, Haidn, Ortelt and Hald9–Reference Landis and Bowman11). The early research dates back to the 1950s. Weinbaum and Wheeler(Reference Weinbaum and Wheeler12) analysed the heat transfer process inside a cooling rod based on transpiration for the first time, and derived a formula for the temperature distribution along its length as well as in the radial direction for a cold hollow cylinder. In 1955, Chauvin et al.(Reference Chauvin and Carter13) studied the transpiration cooling performance of the cone in a free jet at Mach number of 2.05 and Reynolds number of 8,000,000 when using nitrogen, helium and distilled water as coolants; In 1957, Rashis(Reference Rashis14) studied the transpiration cooling effect of double wedges with nitrogen and helium as coolant. They found that helium was four to five times efficient than nitrogen, being roughly the same ratio as between their heat capacities. In recent years, researchers have proposed that liquid coolants offer greater advantages over gas coolants; For example, as a coolant, water has great potential to resist high heat flux because of its high latent heat of evaporation (2257kJ/kg at 1atm), small volume per unit mass and convenient transportation. To verify these advantages, Van foreest et al.(15) conducted a series of almost real experiments on hypersonic vehicles in the DLR arc heating wind tunnel at Mach number of 5.45, temperature of 3028K and enthalpy of 4.3MJ/kg. Their head cone models were made of 91% alumina and 9% silica, both of which can withstand temperatures of up to 2000 K. However, when cooling water was introduced into the model, the surface temperature of the model was lower than 500K, which is obviously a supercooling phenomenon. An interesting phenomenon was observed in those tests: a huge ice whisker formed on the model. In 1995, Keener et al.(Reference Leontiev16) studied the effect of transpiration cooling on the growth of the boundary layer, the heat transfer and the nozzle performance, and tested a two-dimensional Mach 2.0 nozzle made of sintered stainless steel. In 2011, Ding Liang et al.(Reference Ding, Wei, Zhang and Wang17) of the University of Science and Technology of China designed a new type of metal-matrix composite sintered porous plate that can withstand this harsh aerodynamic thermal environment with the help of transpiration cooling of the materials; In 2004, Jianhua Wang et al.(Reference Wang, Messner and Casey18) of the University of Science and Technology of China carried out experimental research on the performance of film cooling and transpiration cooling. Two circular tubes were used as the experimental models: One made of sintered porous materials with average porosity of 21% was used for an experimental model of transpiration cooling, while the other made of solid materials with four rows of discrete jet holes was used to simulate the film cooling effect of gas turbine blades. In the same year, they(Reference Wang, Messner and Stetter19) also compared the differences between different cooling methods and media. The results showed that, at given blowing ratio, the effect of liquid cooling was much greater than that of gas cooling, especially in stagnant areas. However, the above-described basic research was carried out at a much lower temperature and Reynolds number. In 2011, Junxue Shi and Kuan Wei of the University of Science and Technology of China carried out basic research on the transpiration cooling characteristics with a liquid phase change using an improved mathematical model and numerical simulations(Reference Shi and Wang20,Reference Wei, Wang and Mao21) . That research showed that the phase change indeed occurred in porous media and that the temperature of the solid media may rise rapidly. The pressure produced by steam reflux will lead to a counter-current of liquid coolant, causing ablation of the solid matrix. In 2014, Jianhua Wang(Reference Wang, Zhao, Wang, Ma and Lin22) conducted a study on the mechanism of phase change transpiration cooling in the arc wind tunnel of the 11th Institute of Aerospace Science and Technology, using nickel-based alloy porous media as a model and water as the cooling working medium. That work also confirmed the good cooling effect of phase-change transpiration cooling and found the ice phenomenon on the model surface. Despite such comprehensive and systematic research on transpiration cooling, it was not widely applied in the aerospace field initially, because of various difficult problems with its engineering application, including oxidation in air, residues generated by friction and blockage because of ablation in the porous channel.
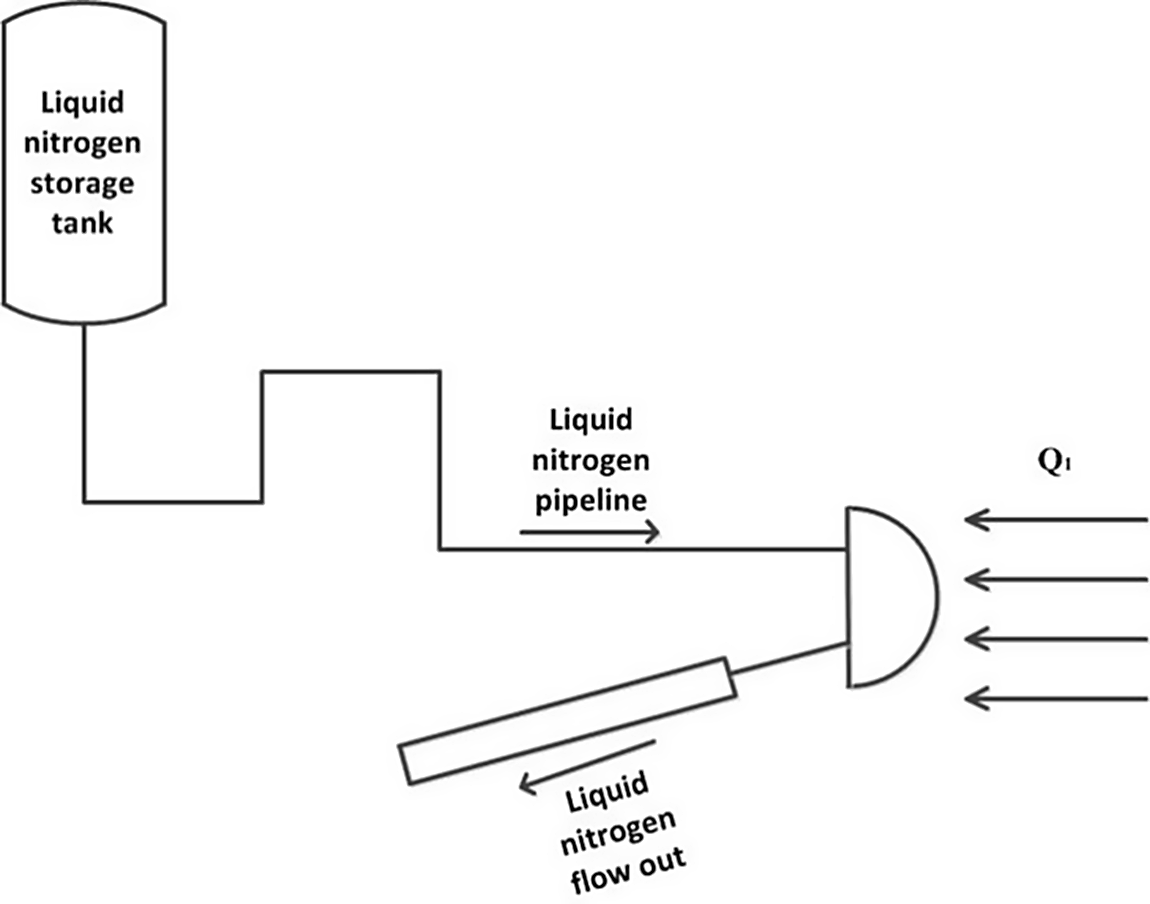
In the actual flight process, the head of an aircraft in high-speed flight faces a huge heat flow. To alleviate the resulting thermal erosion, the method proposed herein takes its inspiration from phase-change transpiration cooling, proposing that a liquid-nitrogen tank be carried on the aircraft. The flowing liquid nitrogen is heated and vaporised into nitrogen cooling gas in internal heat exchange channels on the aircraft head and the aircraft. When using this scheme, the volume of the tank can be reduced because 1L of liquid nitrogen vaporises to produce 770 L of nitrogen gas. Generally speaking, when an aircraft flies at high speed, the heat flow is greatest on the head, and the liquid-nitrogen phase transition is thus most likely to happen there. This scheme is based on phase-change transpiration cooling (i.e. the thermal protection of an aircraft by absorbing large amounts of heat via a phase change). Liquid nitrogen flows through the head of the aircraft and the heat exchange channel on the aircraft to absorb heat and become gas, which can also be collected as secondary cooling gas. A schematic diagram is shown in Fig. 1.
Schematic diagram of the new cooling scheme of aircraft.

In this paper, a heat transfer model for the ball head is established. The design of the model is different from in previous research. To withstand the external high-temperature heat flow and internal low-temperature liquid nitrogen, high-temperature alloy steel is selected as the material. Liquid nitrogen is selected as the coolant, being vaporised at the moment of heating when passing through the ball head to generate high-pressure nitrogen. In the design of the heat exchange model, the wall thickness should be greater than 5mm to withstand the extremely high pressure. The inner part of the ball head heat exchanger is designed with a ring-shaped rib structure. This can not only reduce the heat exchange area between the inner wall of the ball head and liquid nitrogen, but also reduce the pressure oscillation of the liquid nitrogen after flowing through the ball head. The heated liquid nitrogen thus flows stably and has a better cooling effect. Because the components are in a high-pressure environment, the whole design is made using diffusion welding technology, which ensures its integrity and the compressive capacity of the joints. The cooling effect, vaporisation effect and infrared effect of the liquid nitrogen flowing through the ball head are studied under different experimental conditions. The temperature and pressure of the vaporised nitrogen are measured to verify whether the imaging window can be effectively cooled using a nozzle.
2.0 EXPERIMENT
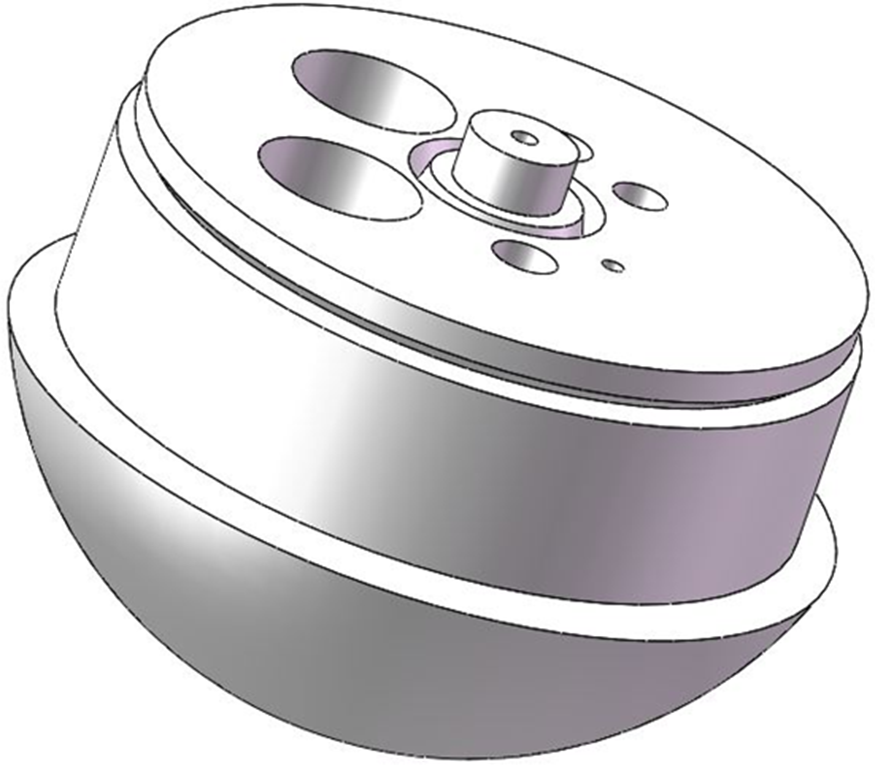
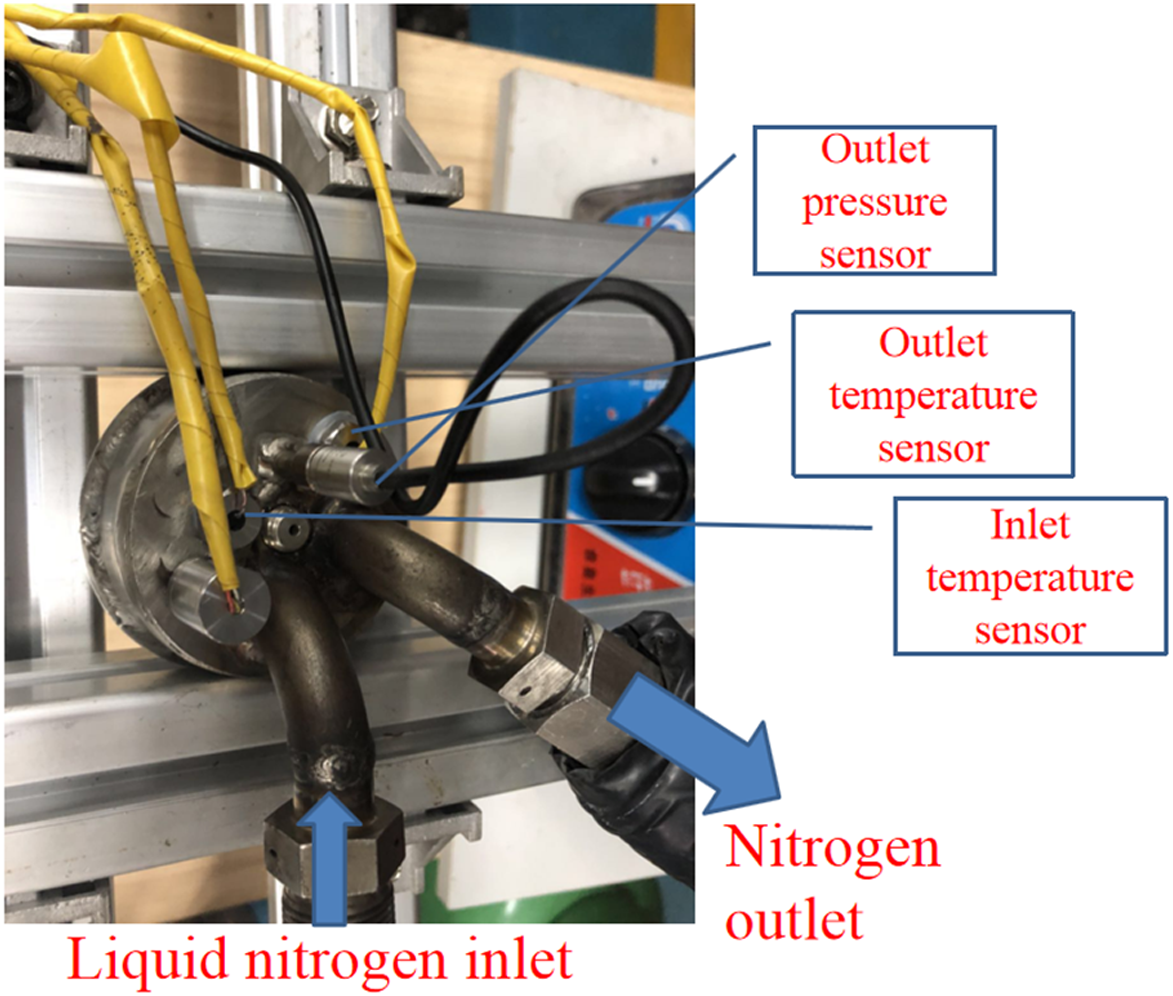
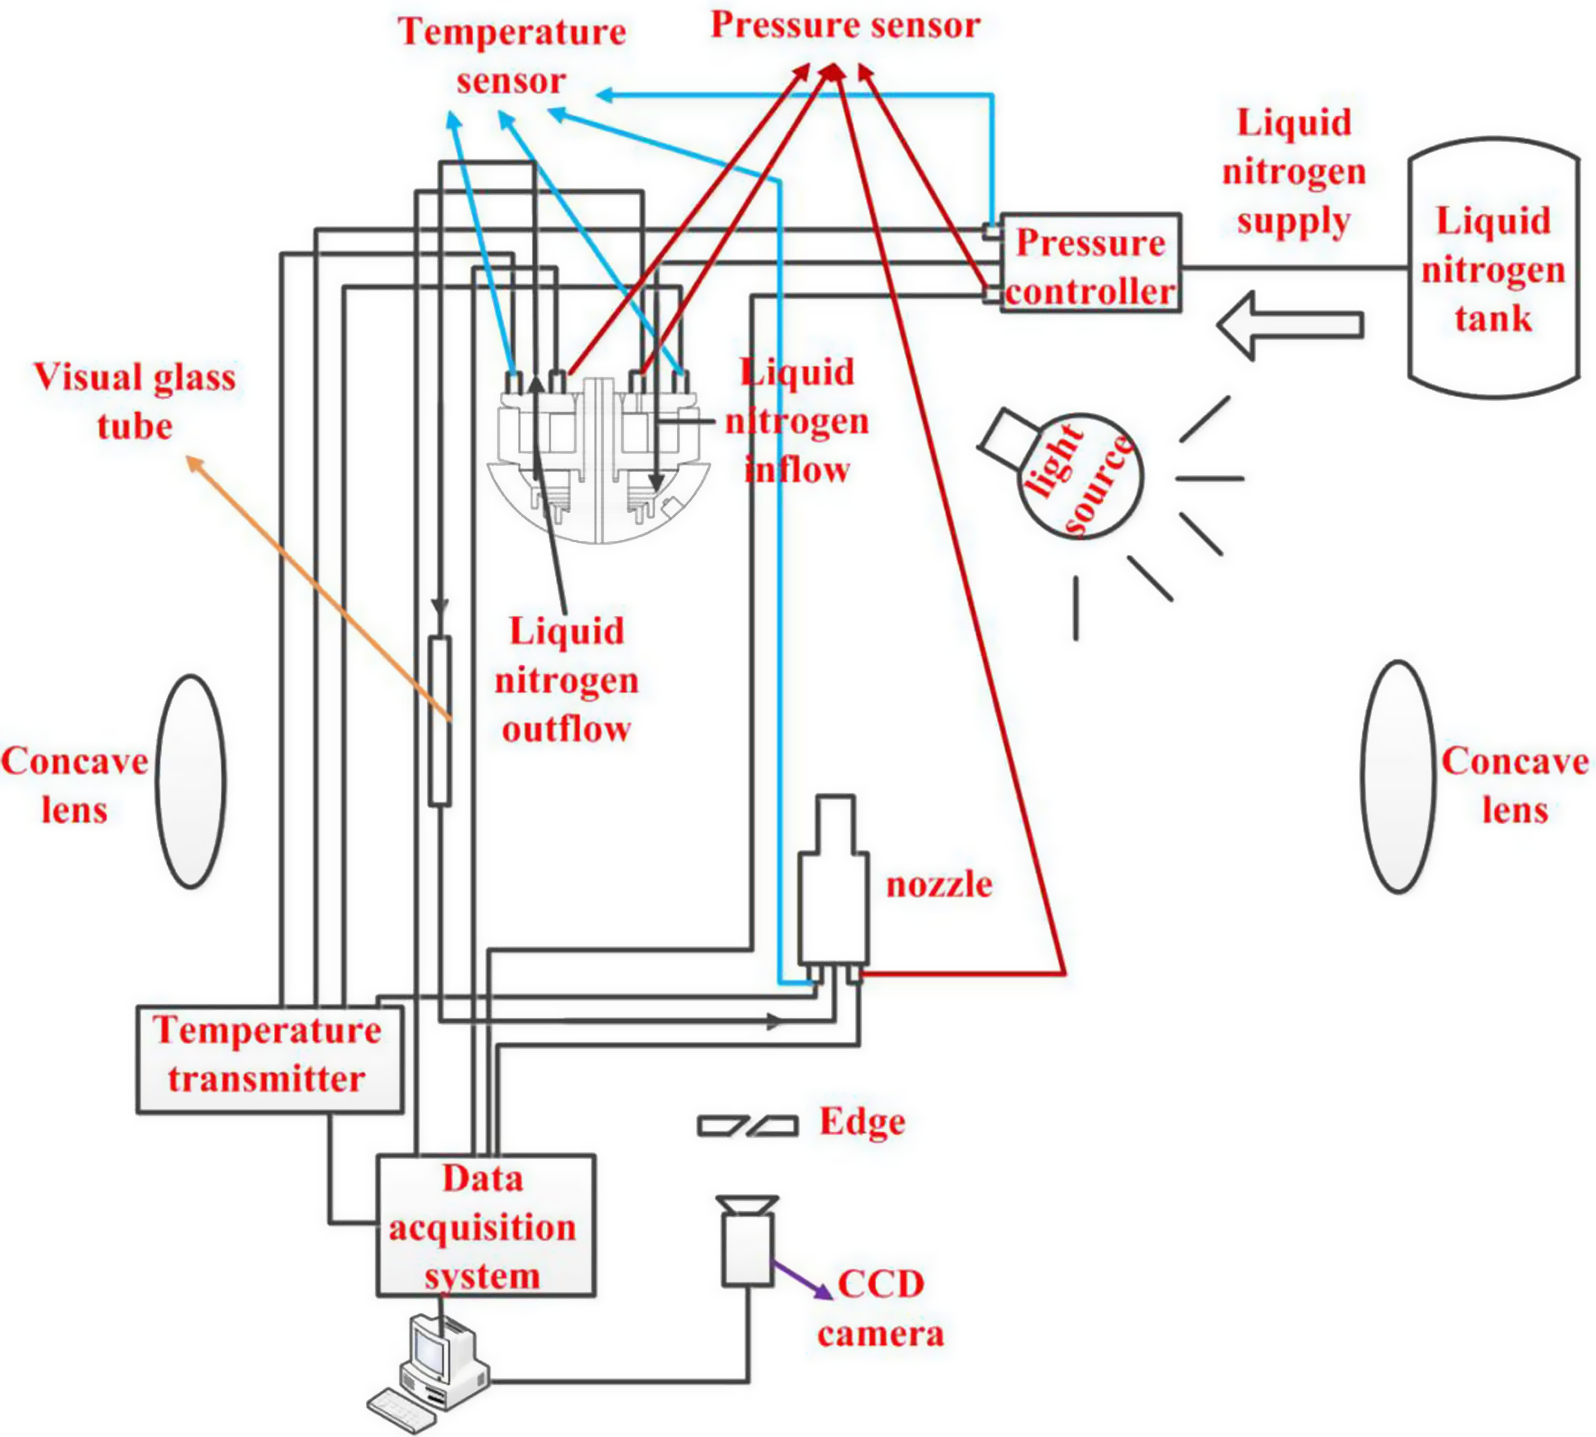
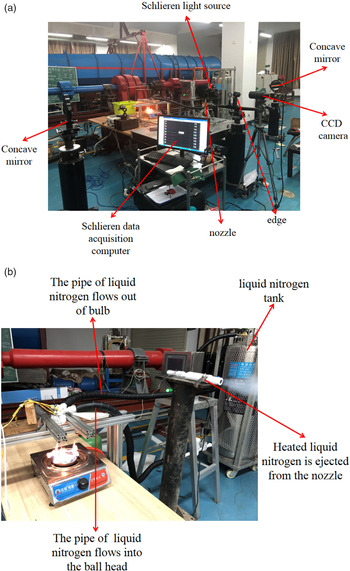
The heat exchange channel for the ball head of an aircraft is designed as shown in Fig. 2, being divided into three parts: the bottom groove, the middle layer plate and the top cover plate. The bottom groove is designed with a multi-layer channel, which increases the heat exchange area and reduces the pressure oscillation. The head heat exchange model is shown in Fig. 3. The head heat exchange phase-change cooling system is shown in Fig. 4, and the physical equipment of the test bench is shown in Fig. 5. It includes the ball head heat exchange model, liquid-nitrogen tank, pressure controller, four pressure sensors, four temperature sensors, schlieren test system, visualised glass tube, infrared camera and axisymmetric nozzle. A gas hood is used to heat the ball head at four heating powers: 88.8kW/m2, 2177.54kW/m2, 2266.31kW/m2 and 2355.1kW/m2. A Dewar is used to store the liquid nitrogen, and a pressure controller is used to control the pressure at which the liquid nitrogen flows out. An axisymmetric nozzle is used to simulate the two-dimensional nozzle used for jet cooling on imaging aircraft. A pressure sensor and a temperature sensor are installed at the nozzle inlet to measure the total temperature and pressure of the fluid at the nozzle and thereby verify whether the liquid nitrogen heated by the heated ball head can effectively cool the imaging window. Temperature and pressure sensors are both installed at the inlet and outlet of the ball head heat exchange model to monitor the temperature and pressure changes at the inlet and outlet of the ball head during the experiment. A temperature and pressure sensor are installed at the pressure controller to monitor the temperature and pressure of the liquid nitrogen flowing out of the Dewar. Images of the nozzle exit are taken using the schlieren technique to evaluate its operating state. The vaporisation effect of the liquid nitrogen passing through the exit image of the nozzle was evaluated by using a charge-coupled device (CCD) to image the visualised glass tube, in combination with the temperature of the ball head outlet. The effective operation of the cooling system was qualitatively analysed based on infrared images of the ball head.
Heat transfer model of the aircraft head.

Physical drawing of the ball head heat exchange model.

Schematic diagram of the experimental system.

Physical figure of the experimental system. (a) Schlieren system (b) Experimental process.

A schematic diagram of the experimental setup used to study the new cooling system proposed herein is shown in Fig. 4, while Fig. 5 shows a physical diagram of the experimental system.
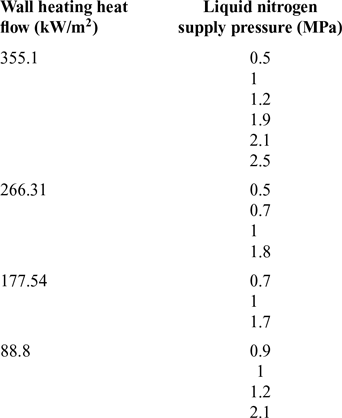
The experimental process was as follows: firstly, the gas hood was opened to heat the ball head until heat balance was reached. Then, the liquid nitrogen tank was opened and the supply pressure of the liquid nitrogen was controlled through the pressure controller. The liquid nitrogen vaporised to nitrogen gas when flowing through the heated head, thus absorbing heat, before being ejected via the axisymmetric nozzle. Relevant data and images were obtained by the test equipment. The experimental conditions are presented in Table 1.
Experimental conditions

3.0 RESULTS AND DISCUSSION
3.1 Research on cooling efficiency of ball head
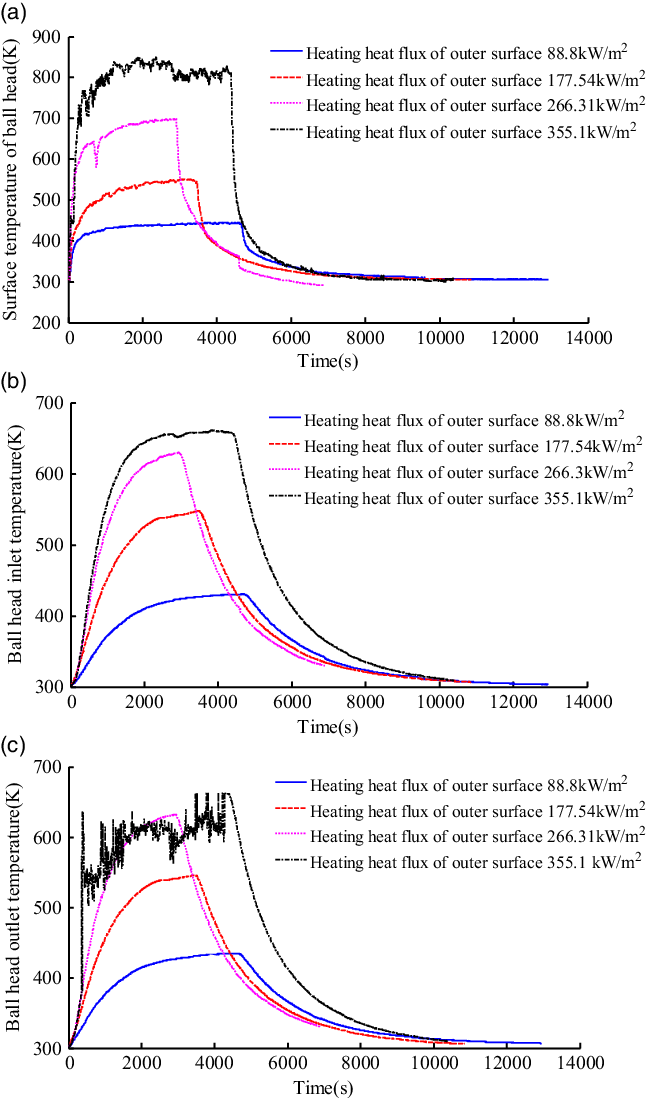
Under the condition of no liquid nitrogen, the maximum heating heat flux from the gas hood was 88.8kW/m2. When the ball head reached heat balance, the temperature of the outer wall of the ball head was 445.09545K, the temperature of the inlet of the ball head was 430.616K and the temperature of the outlet of the ball head was 434.755K. When the maximum heating heat flux of the gas hood was 177.54kW/m2 and the ball head reached heat balance, the temperature of the outer wall of the ball head was 551.785K, the temperature at the inlet of the ball head was 547.849K, and the temperature at the outlet of the ball head was 546.027K. When the maximum heating heat flux of the gas hood was 266.31kW/m2, the temperature of the outer wall of the ball head was 709.286K, the temperature at the inlet of the ball head was 649.92K, and the temperature at the outlet of the ball head was 654.118K, when the ball head reached heat balance. When the maximum heating heat flux of the gas hood was 266.31kW/m2, the temperature of the outer wall of the ball head was 849.557K, the temperature at the inlet of the ball head was 660.925K, and the temperature at the outlet of the ball head was 663.089K. When the ball head reached heat balance, the gas hood was closed. Thereafter, the higher the ball head temperature, the faster the temperature drop. This indicates that the heat storage capacity of the ball head heat transfer model was very high, and the greater the temperature difference between the ball head and ambient, the faster the heat dissipation. These results are shown in Fig. 6.
Temperature distribution at the inlet and outlet of the ball head when only heating the ball head. (a) Temperature distribution at the outer surface of the ball head when only heating the ball head (b) Temperature distribution at the inlet of the ball head when only heating the ball head (c) Temperature distribution at the outlet of the ball head when only heating the ball head .

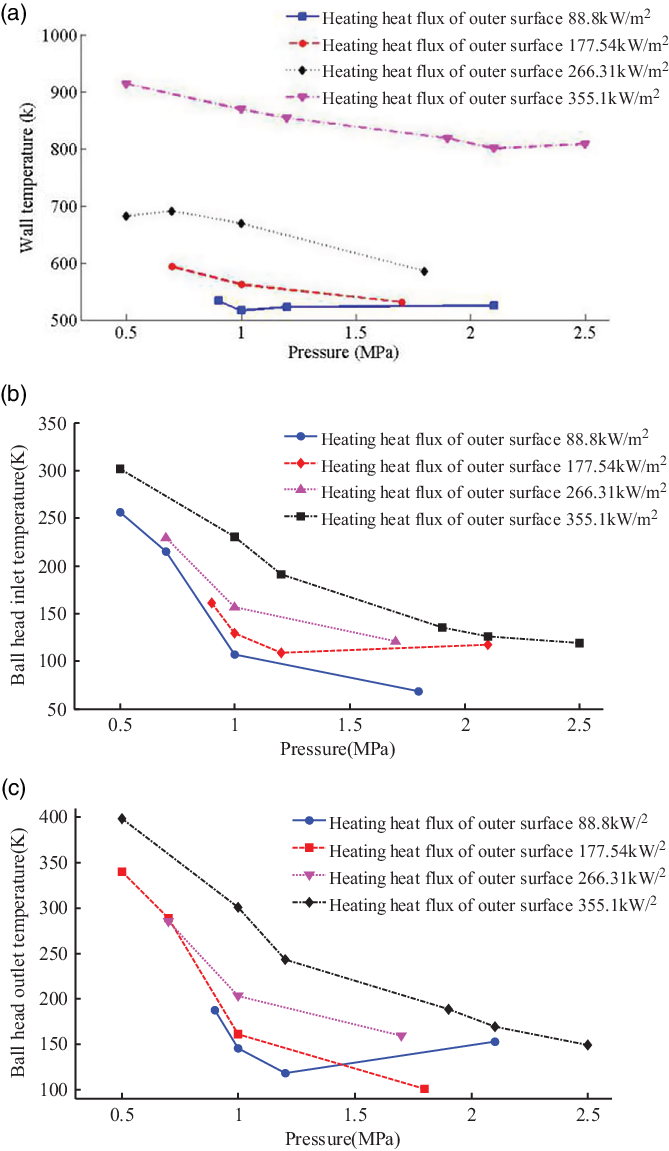
However, as the supply pressure of liquid nitrogen was increased, the inner wall temperature of the model dropped faster than the outer wall temperature, as shown in Fig. 7. Because of the thickness of the inner and outer walls, the thermal response of the outer wall was much slower than that of the inner wall, and the temperature drop of the inner wall was fastest when liquid nitrogen flowed through the ball head. At the same time, the temperature of the outer surface will decrease because of heat conduction. As the liquid-nitrogen supply pressure is increased, the liquid-nitrogen flow rate and Reynolds number of the fluid Re in the heat exchanger increase, so the thickness of the boundary layer decreases, the heat exchange process of the heat exchanger is enhanced and the overall temperature of the ball head decreases. When liquid nitrogen is injected into the heating channel, a gas film forms on the surface of the inner channel of the ball head, which is isolated from the high temperature. When this gas film evaporates, liquid nitrogen is supplied to form a gas film again, which is separated from the high-temperature wall, so the temperature and thermal response of the wall is slow. When the pressure of the liquid nitrogen is increased, its velocity also increases. However, more heat is taken away from the inlet and outlet of the ball head. However, due to the presence of the gas film in the pipe, the heat exchange at the outer wall is more sluggish, and the temperature drop phenomenon lags behind.
Temperature distribution of the inlet and outlet of the liquid-nitrogen-cooled ball head in heat balance. (a) wall temperature change under different experimental conditions (b) inlet temperature change under different experimental conditions (c) outlet temperature change under different experimental conditions.

The cooling efficiency of the cooling system is defined as
 $$\eta = \frac{{{T_{g - out}} - {T_{g - in}}}}{{{T_s} - {T_{g - in}}}}$$
where
 $\eta $
is the cooling efficiency,
 ${T_{g - in}}$
is the gas temperature inside the ball head before liquid nitrogen is introduced,
 ${T_{g - out}}$
is the gas temperature inside the ball head after liquid nitrogen is introduced, and
 ${T_s}$
is the surface temperature of the ball head.
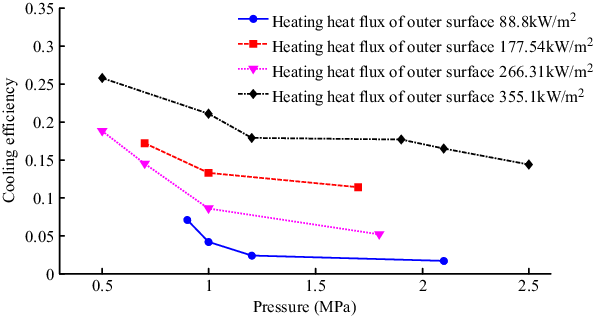
Figure 8 shows the distribution curve of the cooling efficiency for different liquid-nitrogen supply pressures and external wall heating of the ball head. The results show that, the higher the external heat flow, the greater the cooling efficiency for given liquid-nitrogen supply pressure. Meanwhile, for given external heat flow, the cooling efficiency will decrease with increasing pressure. In this experiment, the pressure and flow rate are positively correlated. Therefore, the cooling efficiency also decreases with increase of the flow rate, which is not consistent with the general law that cooling efficiency increases with increasing coolant flow rate because of the difference of the definition of cooling efficiency. The cooling efficiency at decreased coolant pressure is greater for high compared with low heat load. Meanwhile, at the maximum liquid-nitrogen supply pressure, the higher the heat flux density, the greater the cooling efficiency in general.
Temperature and cooling efficiency curves under different experimental conditions.

3.2 Study on vaporisation effect of liquid nitrogen
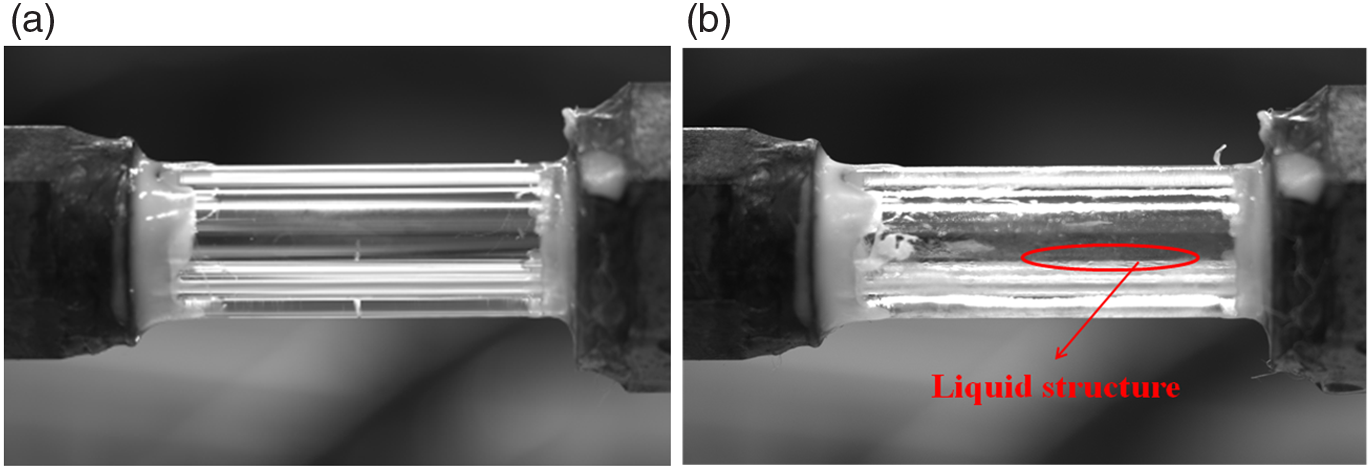
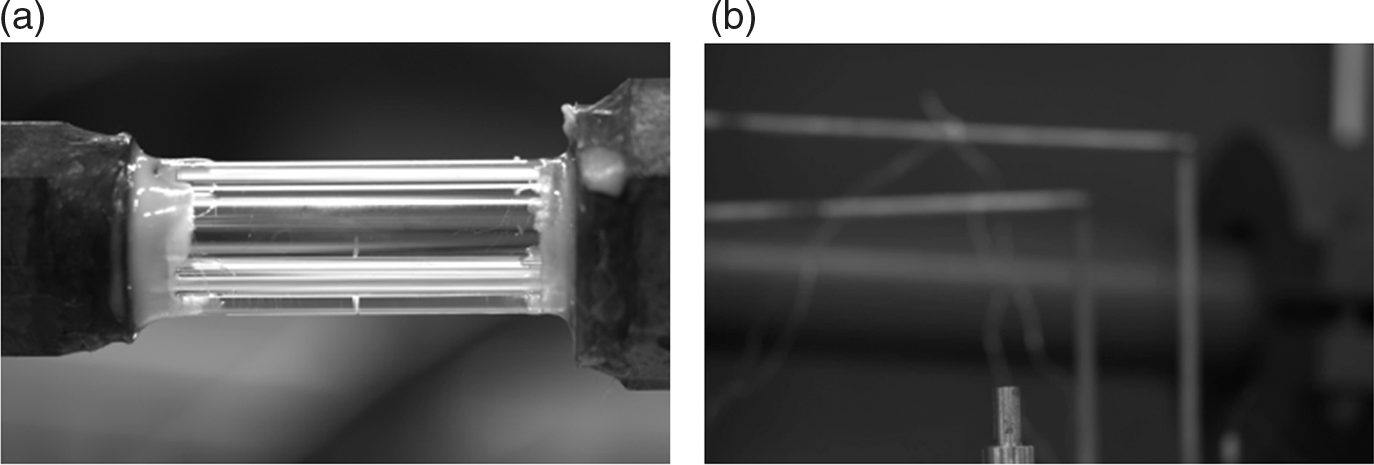
The efficiency of the vaporisation of the liquid nitrogen can be evaluated based on the images of the glass tube connected in front of the nozzle and the structure of the fluid flow field ejected from the nozzle. The liquid can be directly photographed by CCD, while the gas can only be seen by using flow display technology. In the experiment, the heated liquid nitrogen flows through the glass tube. If the liquid nitrogen is not completely vaporised, there will be a very dark area in the schlieren image at the outlet of the nozzle. There will be a liquid layer structure in the image of the glass tube, as shown in Fig. 9.
Visualisation image of glass tube. (a) glass tube without experiment (b) glass tube with experiment.

Figure 9(a) shows an image of the glass tube when the experiment is not running, while Fig. 9(b) shows an image of the glass tube during the experiment. It can be found that, after the experiment, there are many small transparent liquid drops in the glass tube. The gas cannot be imaged by the CCD directly, but these transparent liquid drops in the glass tube are un-vaporised liquid nitrogen.
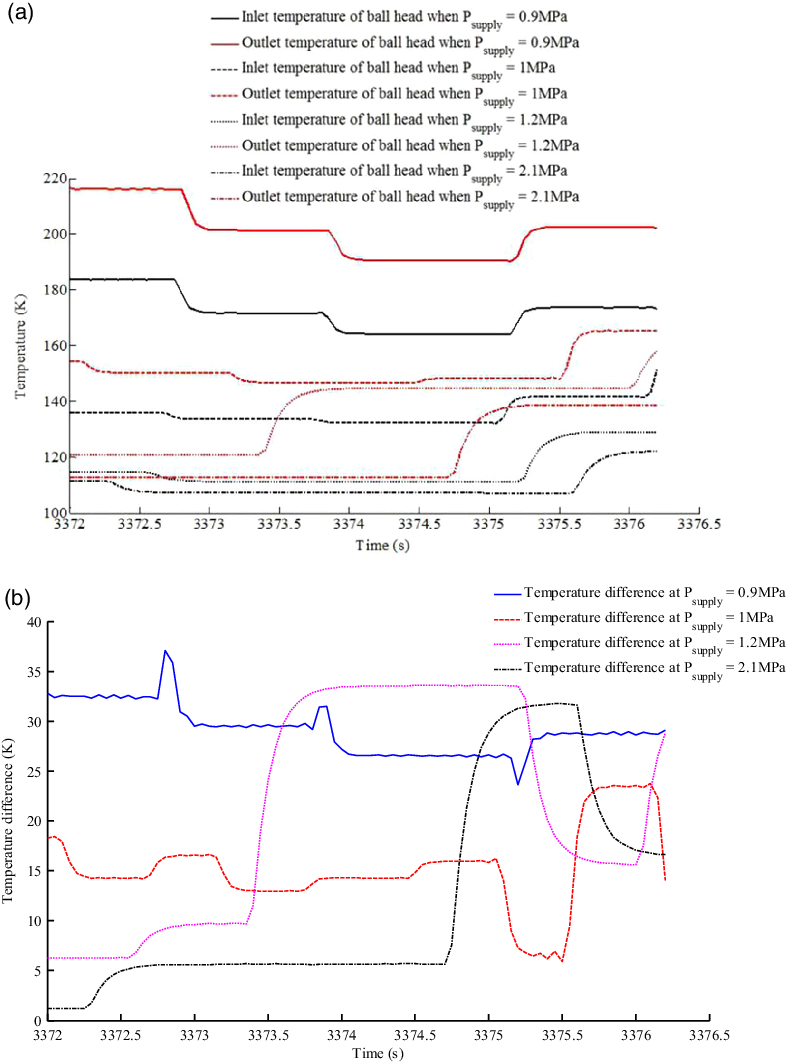
Figure 10 shows the curve of the variation of the outlet pressure with different liquid nitrogen tanks, the inlet and outlet temperature of the ball head and the temperature difference when the heat flow at the heated surface of the aircraft head is 88.8kW/m2. In the experiment, the liquid-nitrogen pressure was adjusted manually using the valve on the tank, which can only ensure that the liquid-nitrogen supply pressure is roughly consistent between experimental conditions. Because the time from heating to heat balance is not consistent in each experiment, it is unified into a single time series.
Experimental results when the heat flux density of the heated wall of the aircraft is 88.8kW/m2. (a) the temperature change of the inlet and outlet of the ball head (b) the temperature difference between the inlet and outlet of the ball head.

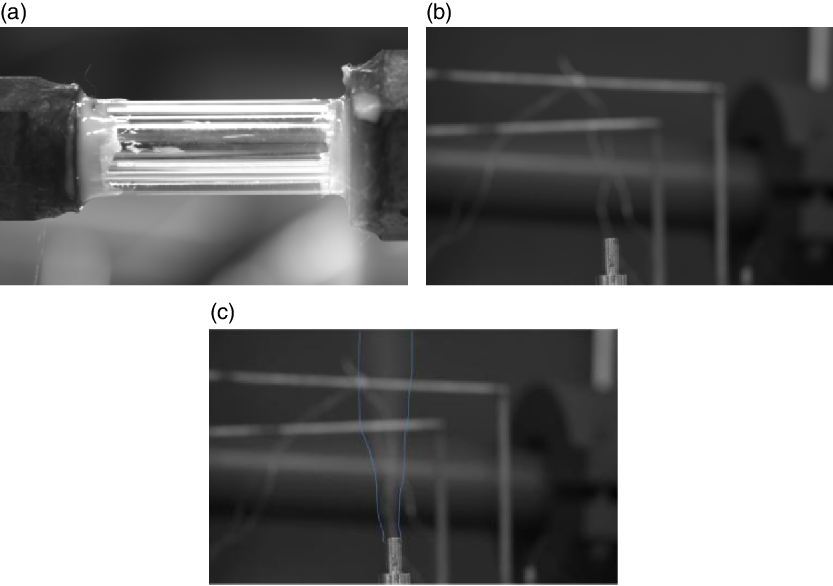
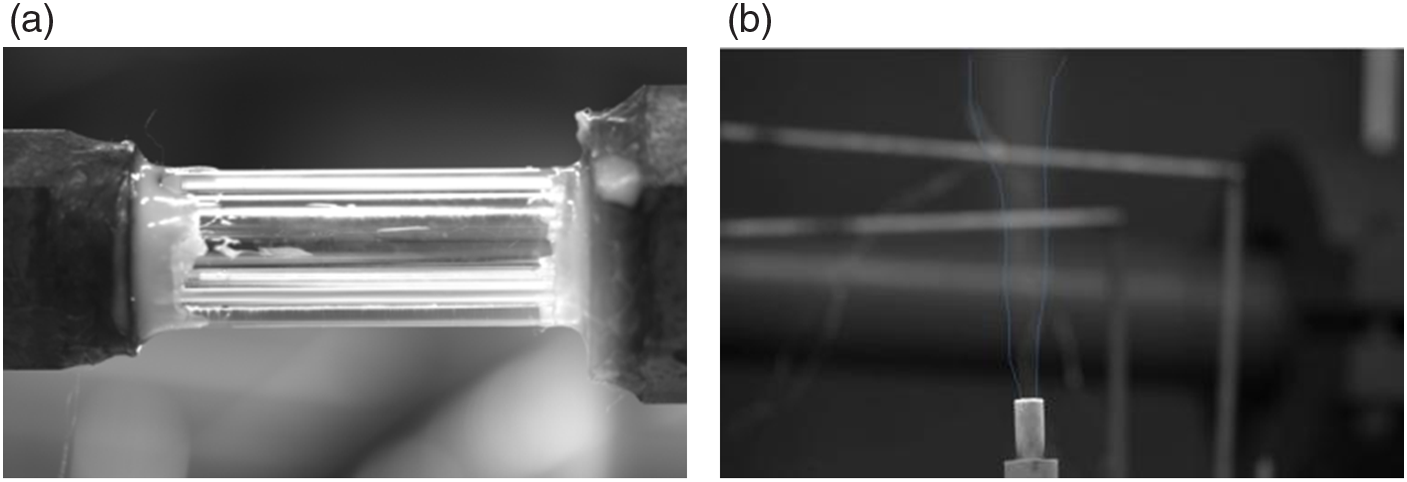
Flow visualisation images at four liquid-nitrogen injection pressures are shown in Figs 11–14, including the visualisation of the glass tube and pictures of the nozzle exit at different time periods. The images of the glass tube and nozzle outlet reveal whether residual liquid remains during the experiment. If liquid is present, it can be directly observed by CCD. In combination with the ball outlet temperature, this can be used to analyse whether the liquid nitrogen has vaporised at this time. According to Figs 10(a), 11 and 12, when the liquid-nitrogen supply pressure is 0.9MPa and 1MPa, the lowest temperature of the ball head outlet measured by the temperature sensor is –167°C. No white fog is observed in the nozzle, nor interface phenomena in the glass tube.
Visualisation results at liquid-nitrogen supply pressure of 0.9MPa. (a) visualization of glass tube experiment (b) CCD image of nozzle outlet.

Visualisation results at liquid-nitrogen supply pressure of 1MPa. (a) visualization glass tube experiment diagram (b) CCD image of nozzle outlet.

Visualisation results at liquid-nitrogen supply pressure of 1.2Mpa. (a) visualization of glass tube experiment (b) CCD image of nozzle outlet when the experiment is not conducted (c) CCD image of nozzle outlet when the experiment is conducted.

According to Figs 10(a) and 13(a), when the liquid nitrogen supply pressure was 1.2MPa, the lowest temperature of the ball head outlet measured by the temperature sensor was –167°C. There is no liquid in the glass tube, while there is white fog at the nozzle outlet. Compared with Fig. 13(b), there is a clear white fog profile in Fig. 13(c). Although the liquid nitrogen has completely vaporised, the temperature of the vaporised nitrogen is relatively low, and the cold flow of nitrogen ejected from the nozzle condenses moisture from the air. If the cooling system is to be used to cool the window on an imaging aircraft, two aspects must be considered: On the one hand, it is necessary to control the liquid-nitrogen supply pressure, because too high a value will result in condensation of water vapor around the ejected cold nitrogen flow, and the presence of liquid will seriously affect the imaging through the window; On the other hand, the temperature around the window during actual flight is very high, and the low-temperature nitrogen may be heated to hundreds of degrees Celsius in a moment, so there will be no water condensation in the actual flight.
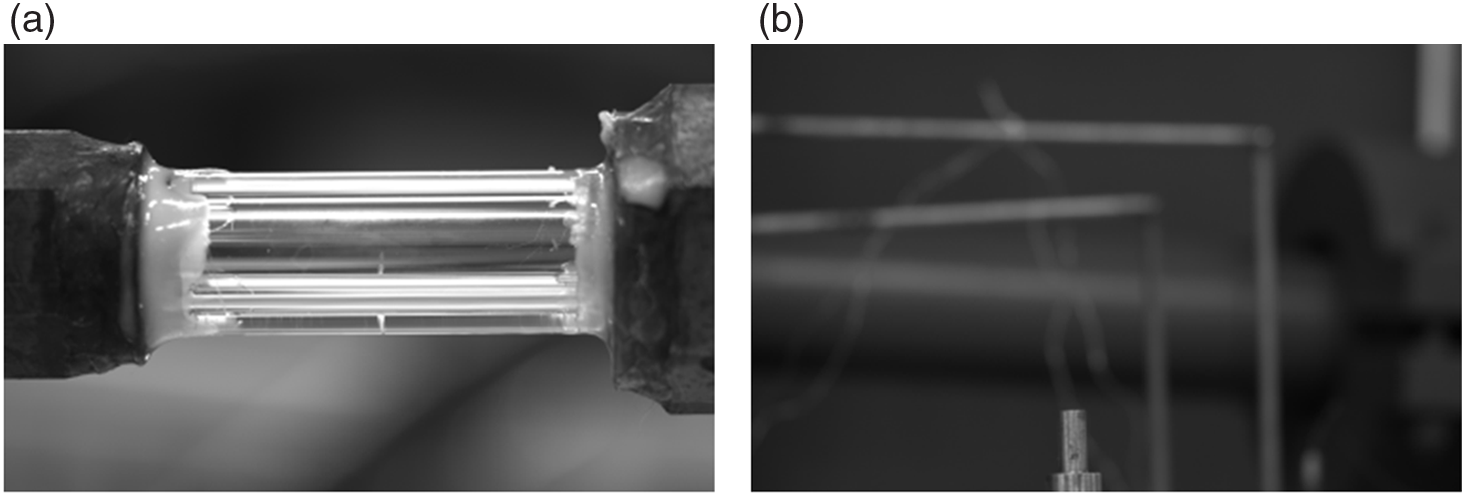
Combined with Figs 10(a) and 14, when the liquid nitrogen supply pressure is 2.1MPa, the temperature measured by the ball head outlet temperature sensor is –190°C, which is close to liquid-nitrogen temperature. At this time, there is no liquid layer interface in the glass tube, demonstrating that the liquid nitrogen is completely vaporised under this experimental condition, This is shown in Fig. 14(b), where compared with Fig. 14(c), there is a large amount of frost on the outside of the nozzle, which also proves that the fluid temperature in the experimental system is very low at this time. This low temperature condenses surrounding water vapor.
Visualisation results at liquid-nitrogen supply pressure of 2.1 MPa. (a) visualization of glass tube experiment (b) CCD image of nozzle outlet during the experiment.

From Fig. 10(b), it can be seen that, with the increase of the liquid-nitrogen supply pressure, the temperature difference between the inlet and outlet of the ball head decreases slowly (this law is not satisfied in the last half of the curve, because the time in each experimental state is not consistent, and there will be errors in integrating the temperature data at the time point when liquid nitrogen starts to flow). This also proves that, at given heating heat flux, the higher the liquid-nitrogen supply pressure, the worse the heat exchange efficiency and the lower the vaporisation efficiency. Under other experimental conditions, the phenomena are basically the same as in the mentioned figures and so are not described in detail.
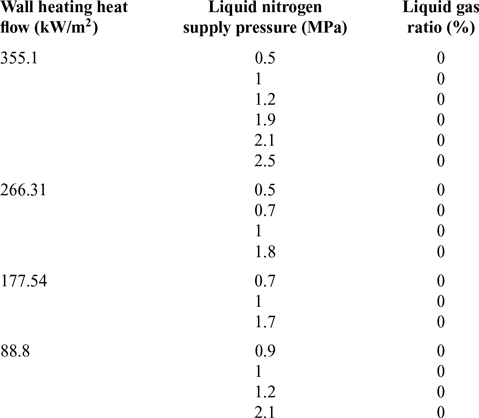
The vaporisation efficiency in each experimental condition is summarised in Table 2, where the proportion of gas and liquid in the glass tube is regarded as the vaporisation efficiency.
It can be seen that, when the heating heat flux on the outer surface is 88.8kW/m2 and the liquid-nitrogen supply pressure is less than 2.1MPa, the liquid nitrogen can be completely vaporised when flowing through the heated head. However, if the liquid-nitrogen supply pressure increases further, when reaching a certain value, it will not be completely vaporised, although that lies beyond the scope of the current experiments.
3.3 Research on infrared effect in the process of ball head cooling
The infrared characteristics of the heat exchange cooling system designed in this paper must be studied to determine the practicability of the scheme.
Evaporation capacity under various experimental conditions

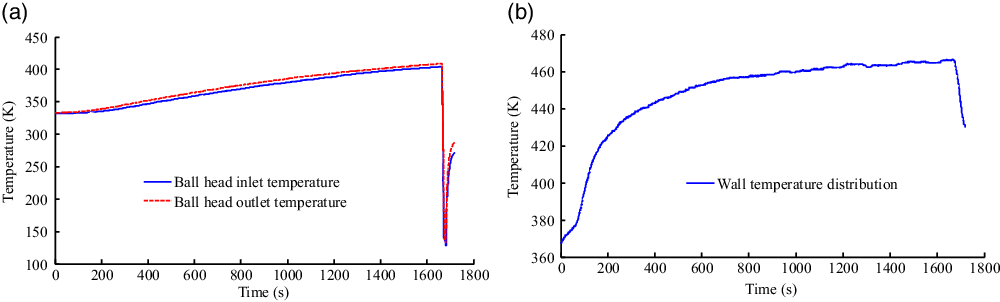
Figure 15 shows the temperature distribution curve at the inlet and outlet of the ball head and the wall temperature distribution curve during the infrared effect experiment. After the liquid nitrogen tank is opened, the minimum temperature of the ball head inlet and outlet is 99K and 103K, respectively.
Temperature distribution curve at very small heating heat flow. (a) inlet and outlet temperature distribution of ball head (b) wall temperature distribution.

At the moment when liquid nitrogen was introduced, the wall temperature began to decrease with a sharp gradient. However, when the liquid nitrogen supply system was closed off, the temperature inside the ball head began to rise rapidly, while the temperature outside the ball head did not change greatly because of the wall thickness. When the internal temperature rises, heat is transmitted to the outer wall of the ball head, which takes some time. There is thus a delay in the thermal response.
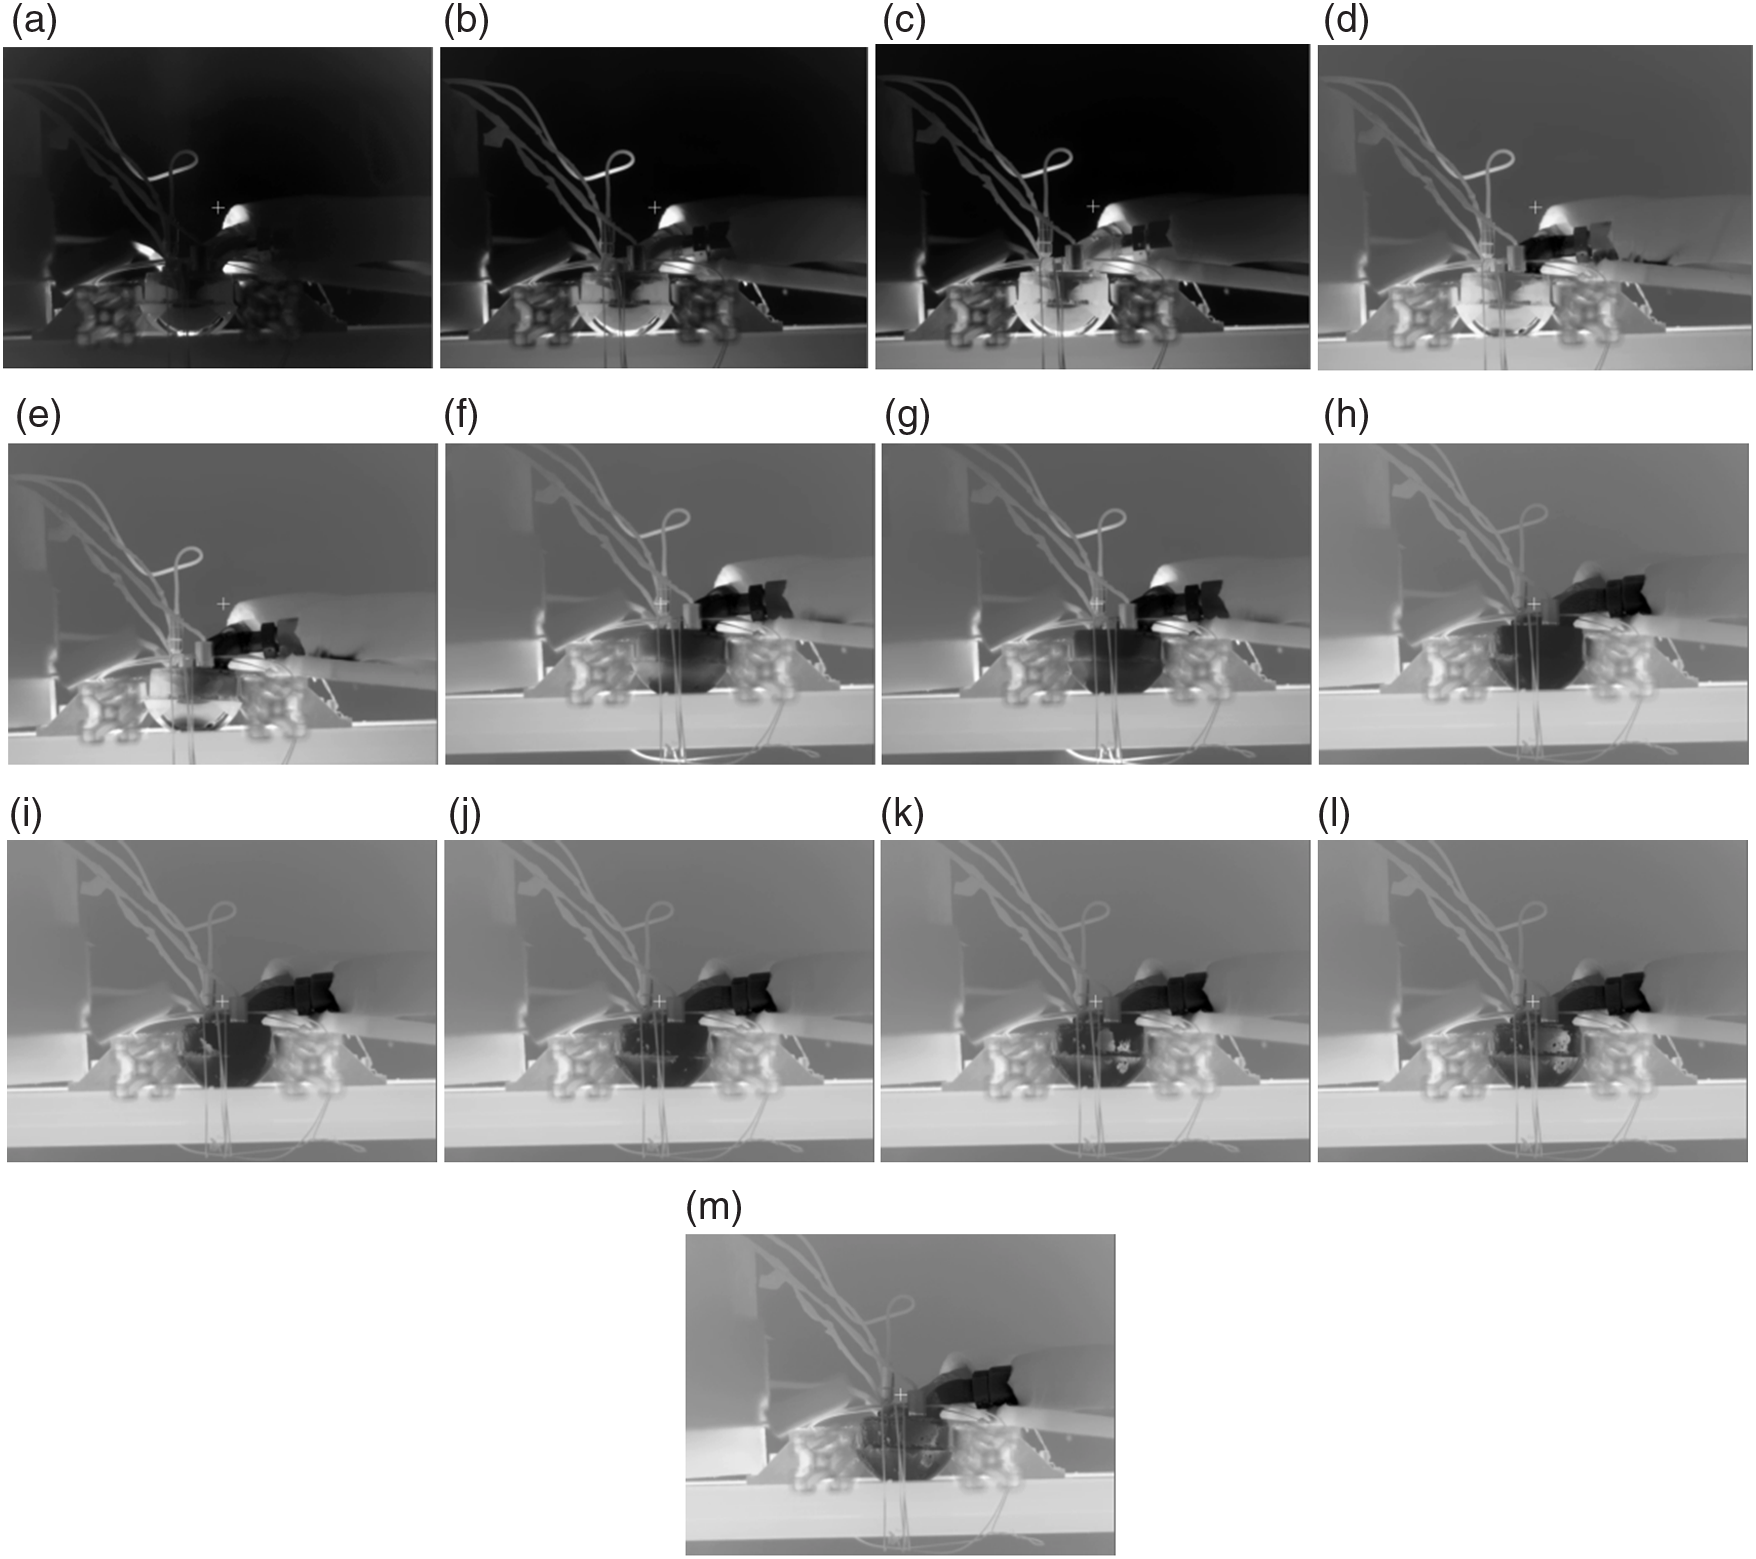
Figure 16(a)–(c) shows infrared images during the heating process before liquid nitrogen is injected into the ball head. The infrared images show low-temperature parts in black and high-temperature parts in white. In Fig. 16(a), the surface of the ball head is dark, because the temperature is not very high. As the heating time progresses, the temperature of the ball head part will slowly increase, the surface of the ball head will slowly become bright, and the surrounding area will slowly become dark. Figure 16(c) shows an infrared image in the heat balance state, and the ball head is brightest at this time.
Infrared characteristics versus time during the experiment on the ball cooling system. (a) 73s (b) 354s (c) 1615s (d) 1691s (e) 1695s (f) 1698s (g) 1700s (h) 1874s (i) 1905s (j) 1929s (k) 1999s (l) 2046s (m) 2123s.

Figure 16(d)–(h) shows infrared images when liquid nitrogen was flowing into the ball head after opening the tank. Figure 16(c) shows an infrared image when the liquid nitrogen was not turned on, while Fig. 16(d) shows an infrared image taken when the liquid nitrogen had just being turned on, corresponding to the part where the curve in Fig. 15(a) drops abruptly. It can be seen that the low-temperature liquid nitrogen flowing from the pipe slowly turns it black, as shown in Fig. 16(d). The whole wall turns black as one approaches the stagnation point, as shown in Fig. 16(e)–(h). This is due to the injection of low-temperature liquid nitrogen, which leads to rapid cooling of the injected area and a large temperature difference with the outer wall of the ball head. It thus also presents a large colour difference. The pipe in which the liquid nitrogen flows turns black, because the stagnation point part of the ball head is directly heated by the flame, where the temperature is highest. After the liquid nitrogen is injected, the heat exchange is the most intense and the temperature difference is the largest, so it must turn black first. The temperature of the ball head gradually decreases from the stagnation point to both sides. According to the infrared images, the black area develops over time to reach the part of the ball head with large cross-sectional radius, as shown in Fig. 16(e)–(h) .
Figure 16(i)–(m) shows the changes in the infrared images after the liquid nitrogen tank is closed. The black colour starts to fade away from the middle position, as shown in Fig. 16(i)–(l), corresponding to the part of the curve (a) in Fig. 15 that suddenly drops and then slightly rises. Finally, the black part of the pipe starts to fade away, and the temperature of the whole ball head returns to the normal colour, as shown in Fig. 16(m).
After the liquid nitrogen is stopped, the high temperature on the outer wall of the ball head transfers to the inner part to make it reach the heat balance. This causes a temperature rise in the low-temperature zone, and finally the black recedes and the whole model shows the same colour.
It can be seen from the above process that it is not that the temperature is low and that the infrared camera cannot recognise the object but that, the smaller the temperature difference with the environment, the less obvious the infrared effect.
In the experimental process, the infrared effect is weak in the cooling process of the heated ball head, but in the actual flight process, the external heat flow is strong and the thermal response will be very fast, so the infrared effect during the flight process needs to be verified experimentally.
The experimental results described above reveal that, in fact, during the heating process of the ball head, with the increase of the temperature of the ball head, the colour of the ball head becomes bright. At the same time, the colour around the ball head becomes bright, which is consistent with the colour of the heated ball head. To weaken the infrared effect, one must ensure that the injected liquid nitrogen can cause the temperature of the ball head to drop to the background temperature, which is also the design target for the liquid nitrogen working condition.
3.4 Study on the properties of liquid nitrogen after vaporisation
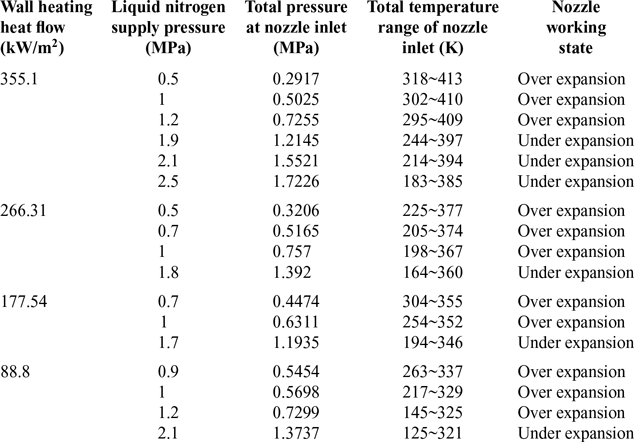
In each experimental state, the cooling system designed in this paper can ensure that the liquid nitrogen flows through the heated head and completely vaporises into nitrogen gas. The physical properties of the vaporised nitrogen were tested to determine whether it can be collected as a secondary gas source to cool other equipment. Various parameters of the fluid at the nozzle in different experimental states are presented in Table 3.
Working state of nozzle in each experimental state

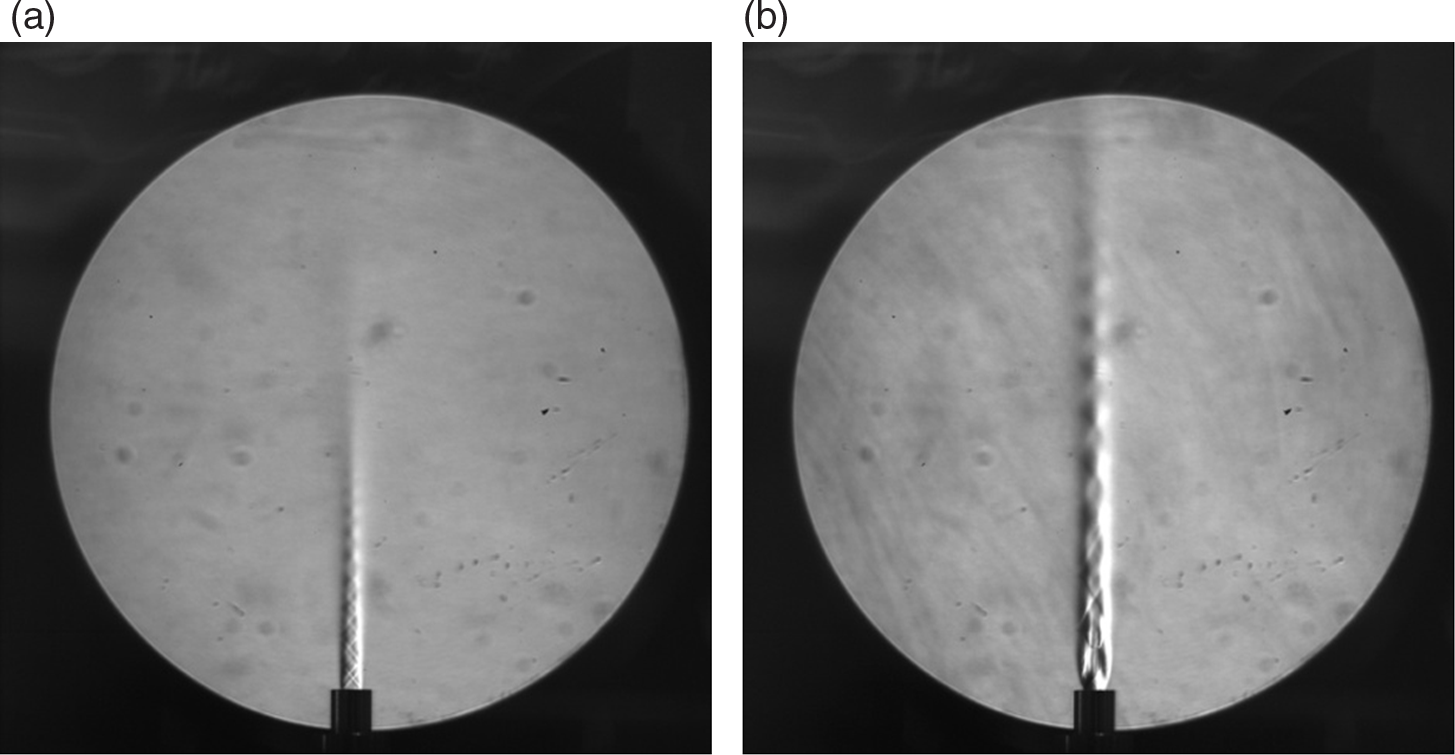
Schlieren images observed in the experiment are shown in Fig. 17.
Schlieren images from the experiment. (a) nozzle outlet flow field in the over expansion condition experiment (Wall heating heat flow 355.1 kW/m2, LN pressure 1MPa) (b) nozzle outlet flow field in the under expansion condition experiment (Wall heating heat flow 355.1 kW/m2, LN pressure 1.9MPa).

In the above experimental process, the supply time of liquid nitrogen is longer than 20s. It can be seen that, if the supply time and pressure of liquid nitrogen are appropriate, the total temperature at the nozzle inlet can reach 320K, and thus it can be used as a coolant for the heated parts. However, if the pressure is too high and the total temperature at the nozzle inlet too low, the nitrogen ejected from the nozzle will condense surrounding water vapor. In the experiment, if the supply time of liquid nitrogen is too long or the pressure is too large, the total temperature at the nozzle will be sharply reduced after reaching the maximum temperature. If the time is too long, the temperature will even fall to the liquid-nitrogen temperature because of the insufficient heating efficiency in the experiment. When an actual aircraft is flying, it is heated by the transient high heat flow. After the cooling jet cools the heated ball, the aircraft is heated to a high temperature by the surrounding heat flow. According to Table 3, the nozzle can operate at the design condition under each experimental condition. It should be ensured that the jet at the nozzle outlet is supersonic as far as possible, because the cooling effect of a supersonic jet is better than that of a subsonic jet. In this experiment, it is found that the pressure drop of the liquid nitrogen through the heat exchange system from the liquid nitrogen tank is very large, which is due to the substantial local pressure loss in the test device. This indicates that the condition of the jet on the aircraft side window should be considered in the actual design, and the initial liquid-nitrogen supply pressure should be high enough to achieve a good cooling effect.
4.0 CONCLUSION
Aerodynamic thermal protection is an important problem for high-speed aircraft. The head of the aircraft is subject to high temperatures and high-speed flows, bearing the maximum heat flow and thus requiring a reliable cooling system. Generally, such thermal protection of the head relies on ablation-resistant materials to resist the high heat flow, and a few suitable cooling methods for the head are available. Although a lot of mechanistic experiments have been carried out on transpiration cooling schemes using dense materials, their application on the head of high-speed aircraft remains difficult at present. A new head cooling system is proposed herein, and a test-bed was built to carry out relevant experiments to study the performance of the cooling system. The results show that:
1. The cooling efficiency under different heat flux densities on the outer wall was analyzed experimentally. The shorter the time required for the coolant supply pressure to rise to the rated pressure, the better the cooling efficiency. For given external heat flow, the cooling efficiency decreased with increasing pressure. This is not consistent with the general rule that the cooling efficiency will increase with increasing coolant flow, because of the different definitions of cooling efficiency. For the experimental cooling system, the cooling efficiency at high heat flow was greater with decreasing coolant pressure than at low heat load. The higher the heat flow density, the greater the cooling efficiency when the maximum pressure of the liquid nitrogen supply was the same. Moreover, the higher the pressure, the better the cooling efficiency. Moreover, liquid nitrogen is an ultra-low-temperature liquid, whereas the heated ball head is an example of a high-temperature system. The liquid nitrogen will form a gas film on the wall surface after passing through the ball head, which will affect the heat transfer, and the temperature of the remote parts will decrease, while there will also be a thermal delay effect.
2. Under the tested experimental conditions, liquid nitrogen can be completely vaporised when flowing through the heated head. When the heating heat flux density on the outer surface was 88.8kW/m2 and the liquid-nitrogen supply pressure was less than 2.1 MPa, the liquid nitrogen could be completely vaporised when flowing through the heated head. However, if the liquid-nitrogen supply pressure was increased to a certain value, it will not be completely vaporised, which requires further experimental study. In addition, it is found that the pressure of the liquid nitrogen from the liquid nitrogen tank is higher than that from the nozzle during the test. This is because of the large elbows in the cooling system, and the pressure of the liquid-nitrogen supply should be considered in the future.
3. The infrared characteristics of the ball head during the experiment were studied. During the heating process of the ball head, the surface of the ball head starts to become dark, because the temperature is not high. As the heating time progresses, the temperature of part of the ball head increases slowly, the surface of the ball head slowly becomes bright, and the surrounding area slowly becomes dark. When the temperature reaches heat balance, the ball head is brightest. After opening the liquid nitrogen tank, the low-temperature liquid nitrogen flowing from the pipe makes it turn black slowly, then the whole wall surface turns black. After the liquid nitrogen tank is closed, the whole black area starts to retreat from the left side and the middle position, and finally the black area of the pipe starts to retreat and the whole ball head returns to the normal colour. The experimental results show that there is a weak infrared effect in the cooling system. If the infrared effect is to be eliminated, the cooling system should be cooled to a temperature close to the background temperature by the liquid nitrogen.
4. The pressure and temperature of the heated liquid nitrogen were studied under different experimental conditions. It was found that the liquid nitrogen can vaporise completely under the current experimental conditions, and the total temperature of the vaporised nitrogen is about 300K; it can thus be collected as a secondary gas source for cooling other components. The aircraft could carry a small liquid nitrogen tank to cool the ball head and other equipment. Because vaporisation of liquid nitrogen results in a volume increase of 720-fold, only a small amount of liquid nitrogen is needed to cool the aircraft head, avoiding the need to carry a large gas tank.
ACKNOWLEDGEMENTS
This work is supported by the National Natural Science Foundation of China (contract nos. 11172326, 11302256).