





Introduction
Global warming has intensified rapidly in recent decades, with human-induced temperatures reaching 1.31°C above pre-industrial levels in 2023. Reference Forster, Smith and Tristram1,Reference Dunstone, Smith and Atkinson2 Over the same period, progress in reducing under-five mortality has slowed in low-and middle-income countries (LMICs), where 47.3 deaths per 1000 live births persist, reflecting enduring inequalities in nutrition and access to health care. 3–Reference Subramanian5 An expanding body of evidence links rising temperatures and extreme heat to mortality-relevant early-life outcomes, including preterm birth, neonatal complications, infections, and undernutrition. Reference Liu, Xu, Gong, Zheng and Chen6 Recent studies further indicate that prenatal exposure to heat stress may elevate the risk of death in infancy and early childhood through lasting effects on physiological development and health resilience. Reference Wang, An, Chen, Webster, Gong and Lin7,Reference Manfredini8 However, empirical evidence directly connecting gestational heat stress to child mortality remains geographically uneven, with limited coverage of South Asia, sub-Saharan Africa, and the Middle East and North Africa – regions experiencing rapid warming alongside fragile health systems and widespread poverty. Reference Lakhani, Ambreen and Padhani9
The mechanisms linking temperature and child mortality are diverse, spanning biological, environmental, and structural pathways. The following section explores these causal pathways, synthesizing evidence on how heat stress disrupts maternal health, compromises fetal development, and exacerbates climate-sensitive diseases. By explaining these interactions, we aim to inform policies that integrate climate resilience into maternal and child health frameworks – a necessity for safeguarding progress toward the Sustainable Development Goals amid rising climatic risks.
Heat exposure during pregnancy: pathways to child mortality
High ambient temperature places pregnant women at greater risk of dehydration because pregnancy naturally increases circulating blood volume and metabolic heat production. Reference Alvarez-Elias, Brenner and Luyckx10,Reference Venugopal, Latha and Shanmugam11 When maternal fluids are not adequately replaced, blood volume falls, reducing uteroplacental perfusion – the blood flow through which oxygen and nutrients reach the placenta and fetus. Reference Jani, Clark and Couper12,Reference Zheng, Ma and Wang13 Poor perfusion, in turn, deprives the developing baby of oxygen (hypoxia) and energy, slowing growth and raising the likelihood of stillbirth, preterm birth, and neonatal death. Reference Bonell, Hirst, Vicedo-Cabrera, Haines, Prentice and Maxwell14 In low-resource settings, episodes of untreated dehydration also raise stress hormones such as cortisol and increase oxidative stress – a build-up of highly reactive molecules that damage cells – weakening placental tissue and amplifying these risks. Reference Venugopal, Latha and Shanmugam11,Reference Zheng, Ma and Wang13
Temperature extremes accelerate this sequence by provoking sustained vasoconstriction (narrowing of blood vessels) in the uterus and placenta, again cutting off oxygen and nutrients. Reference Ramirez, Maldonado, Mach, Potter, Balise and Santos15,Reference Turner, Mitchell and Kumar16 Ultrasound and Doppler studies report lower umbilical-vein blood flow and altered angiogenesis (formation of new placental vessels) after heatwaves, confirming structural compromise. Reference Contreras-Correa, Messman, Sanchez-Rodriguez, Burnett and Lemley17 Epidemiological analyses repeatedly link these functional changes with higher neonatal, infant, and under-five mortality during very hot seasons. Reference Ramirez, Maldonado, Mach, Potter, Balise and Santos15 Placental hypoperfusion, therefore, remains the central biological bridge between maternal heat stress and early-life deaths.
Heat additionally triggers production of reactive oxygen species. When antioxidant defences are overwhelmed, mitochondrial function falters and cell death pathways are activated. Reference Zheng, Ma and Wang13,Reference Khan, Dou and Wang18 In the placenta this damages nutrient transporters, disrupts angiogenesis, and suppresses hormone synthesis. For example, injury to trophoblasts – specialized cells that form the placental interface – reduces secretion of placental lactogen and insulin-like growth factor-2, both crucial for fetal growth. Reference Walker, Ragos, Wong, Adam, Cheung and Raha19 The early embryo is especially vulnerable: oxidative DNA damage and heat-induced epigenetic changes during the first trimester can have lifelong consequences for growth and survival. Reference Feng, Li and Zhang20
Inflammation amplifies these insults. Heat-related oxidative stress weakens the placental barrier, allowing bacterial fragments such as lipopolysaccharide from the mother’s gut to cross into the bloodstream and placenta. Reference Zheng, Ma and Wang13,Reference Guo, Liu, He, Yao and Zheng21 The resulting cytokine surge further erodes placental architecture and impairs nutrient delivery. Reference Silva, Hooper and Manica22 Simultaneously, the activity of amino-acid transport systems – particularly System A and System L, which ferry key building blocks for fetal tissue – declines, promoting intrauterine growth restriction. Reference Shimada, Powell and Jansson23–Reference Kadife, Harper, de Alwis, Chien, Hannan and Brownfoot25
Heat also perturbs the hypothalamic–pituitary–adrenal axis, the hormonal cascade that governs the stress response. Chronic activation elevates cortisol levels, which are linked to stillbirth, impaired cardiac adaptation in the fetus, and later neurodevelopmental delays. Reference Peterson, Espel, Davis, Sandman and Glynn26–Reference Stoye, Blesa and Sullivan28 Normally, placental enzymes convert much of the mother’s cortisol into its inactive form, cortisone, to shield the fetus. Heat appears to lower this protective conversion, permitting higher cortisol exposure. Reference Joseph, Walejko, Zhang, Edison and Keller-Wood29,Reference Mathiesen, Bay-Richter, Wegener, Liebenberg and Knudsen30
Timing during gestation alters vulnerability. During weeks ∼2–8, when organs first form (organogenesis), heat exposure raises the incidence of neural-tube and congenital heart defects, probably through oxidative DNA damage and transient gene-expression changes. Reference Bruckner, Trinh N.T. and Lelong31–Reference Haghighi, Wright and Ayer33 In late pregnancy, declining placental reserve means even modest thermal stress can precipitate stillbirth or markedly lower birth weight. Reference Bonell, Hirst, Vicedo-Cabrera, Haines, Prentice and Maxwell14,Reference Hu and Zhang34–Reference Fuentevilla, Rios, Limesand and Diaz37 Heat-triggered inflammation of uterine membranes also activates biochemical pathways that initiate labor early, leading to preterm birth before 37 weeks and its associated respiratory and neurological complications. Reference Moylan, Nguyen-Ngo, Lim and Lappas38–Reference Obst, Herz and Alejandre Alcazar42
Both LBW and preterm birth dramatically inflate neonatal mortality – especially where neonatal care is limited. Reference Ssentongo, Ba and Fronterre43–Reference Debere, Haile Mariam, Ali, Mekasha and Chan46 Very low-birth-weight infants ($ < $ 1500 g) face up to a 3.6-fold rise in death risk. Reference Ssentongo, Ba and Fronterre43 Heat-related anemia and micronutrient deficiencies add to these threats, although antenatal iron-folate supplementation offers partial protection. Reference Ssentongo, Ba and Fronterre43
Environmental co-exposures intensify danger. Fine-particulate air pollution (PM) already causes endothelial inflammation; under high temperatures these particles become more biologically reactive, compounding oxidative injury and escalating risks of LBW and premature delivery. Reference Wang, Zhou, Tian and Hu47–Reference Hill, Rood, Ribble and Haberzettl49 Urban heat islands – created by dense buildings, dark surfaces, and scarce green space – trap warmth overnight and lengthen exposure periods, particularly in low-income neighborhoods with limited cooling options. Reference Tuholske, Caylor and Funk50–Reference Ren, Shi, Li, Kong and Zhou52
Socio-economic context further modulates harm. Pregnant agricultural and outdoor workers often labor in temperatures exceeding 29°C with few breaks, inadequate hydration, and little occupational protection. Reference Ioannou, Foster and Morris53–Reference de Sario, de’Donato and Bonafede55 Women’s relatively lower access to rest facilities and decision-making power heightens their exposure. Reference Lee, Haile, Seymour and Azzarri56 Evidence suggests every hour of rest, shade, and rehydration can markedly lower core body temperature and reduce adverse outcomes, underscoring the value of targeted workplace interventions. Reference Ioannou, Mantzios and Tsoutsoubi57,Reference Gibb, Beckman, Vergara, Heinzerling and Harrison58
A growing body of research links childhood mortality to climatic extremes, but key gaps persist. While prior studies often focus on post-natal or whole-pregnancy exposures, they rarely examine how distinct stages of fetal development influence heat sensitivity. Reference Liu, Xu, Gong, Zheng and Chen6 Additionally, evidence on temperature variability is limited, with few investigations distinguishing prolonged heat from acute fluctuations that may strain maternal thermoregulation. Reference Molina and Saldarriaga59 Finally, except for select single-country or sub-national analyses, Reference Krakauer60 few studies explore –dose-response relationships for extreme deviations from local climatic norms, particularly in high-risk regions like South Asia, Africa, and MENA. Reference Gaffan, Kpozehouen, Degbey, Ahanhanzo and Paraïso61,Reference Navarro-Jimenez, Saturno-Hernández, Jaramillo-Mejía and Clemente-Suárez62 Our study addresses these gaps by integrating high-resolution climate data with harmonized DHS birth histories across 31 countries. We (i) estimate trimester-specific effects of mean and variable temperature exposures, (ii) test non-linear thresholds beyond local norms, and (iii) apply multilevel logistic models to account for spatial clustering, improving on conventional approaches. Reference Muindi, Iddi, Gitau and Mberu63,Reference Liang and Zeger64 This enables the first region-wide, stage-specific assessment of prenatal heat impacts on child survival, informing climate-resilient maternal-and-child-health strategies.
Methods
We conducted a retrospective cohort study of singleton live births, assembled from cross-sectional DHS birth histories (IPUMS-DHS) linked to gridded climate re-analysis, across 31 LMICs spanning sub-Saharan Africa (25), South Asia (3), and the Middle East and North Africa (3). Figure 1 summarizes regional temperature distributions, with sub-Saharan Africa concentrated around higher average maximum temperatures (about 37°C) and a narrower spread.
Birth histories, covariates, and primary sampling unit (PSU) centroids were obtained from IPUMS-DHS, which harmonizes variables across survey rounds. Reference Boyle, King and Sobek65 Daily maximum temperature (TMAX; Celsius) was drawn from the IPUMS-integrated CHIRTS dataset (0.05∘ × 0.05∘) Reference Boyle, King and Sobek65,66 and linked to DHS cluster locations. The source data included 1,709,110 singleton live births (1990–2018) to mothers aged 15–49 years; after excluding missing geocoordinates, implausible gestational calendars, or missing covariates, the analytic sample comprised approximately 700,000 births from 43,256 PSU clusters. Integrated IPUMS-DHS weights were applied to preserve national representativeness and cross-country comparability.
To assess whether sample attrition introduced systematic differences between included and excluded births, we compared the two groups across socio-demographic and climatic characteristics (Table S1 in the Supplementary Information document). Household wealth and urban–rural residence were virtually identical, and child’s sex differed by less than one percentage point. The dominant compositional difference was regional – the analytic sample is predominantly sub-Saharan African (80.0%) while excluded births are disproportionately South Asian (50.4%) – reflecting survey-level geocoordinate availability rather than any characteristic of the individual birth or its outcome. Mean maximum temperatures were only marginally higher in the included sample (∼0.5°C across trimesters, well within the ∼5°C standard deviation), and temperature variability was broadly similar, with standardized deviation scores near zero in both groups. Because the models control for region and extensive socio-economic covariates, these compositional differences are absorbed in estimation and are unlikely to bias the reported associations.
Outcomes were Neonatal Mortality Rate (NMR), Infant Mortality Rate (IMR), and Under-5 Mortality Rate (U5mort). Exposures were constructed by averaging daily TMAX over three prenatal windows: 6–8 months pre-delivery (trimester 1), 3–5 months (trimester 2), and 0–2 months (trimester 3); trimester-specific reconstruction provides a quasi-cohort perspective centered on prenatal heat. Trimesters are labeled according to standard gestational nomenclature, with the first trimester denoting the earliest period of gestation and the third the period immediately preceding delivery. Because exposures were reconstructed retrospectively from each child’s date of birth, these map, in months before delivery, to 6–8 months (first trimester), 3–5 months (second trimester), and 0–2 months (third trimester). We modeled (i) trimester mean TMAX, (ii) standardized trimester deviations from each cluster’s 72-month historical mean, and (iii) indicators for positive deviations exceeding 0.5, 1, 1.5, or 2 standard deviations.
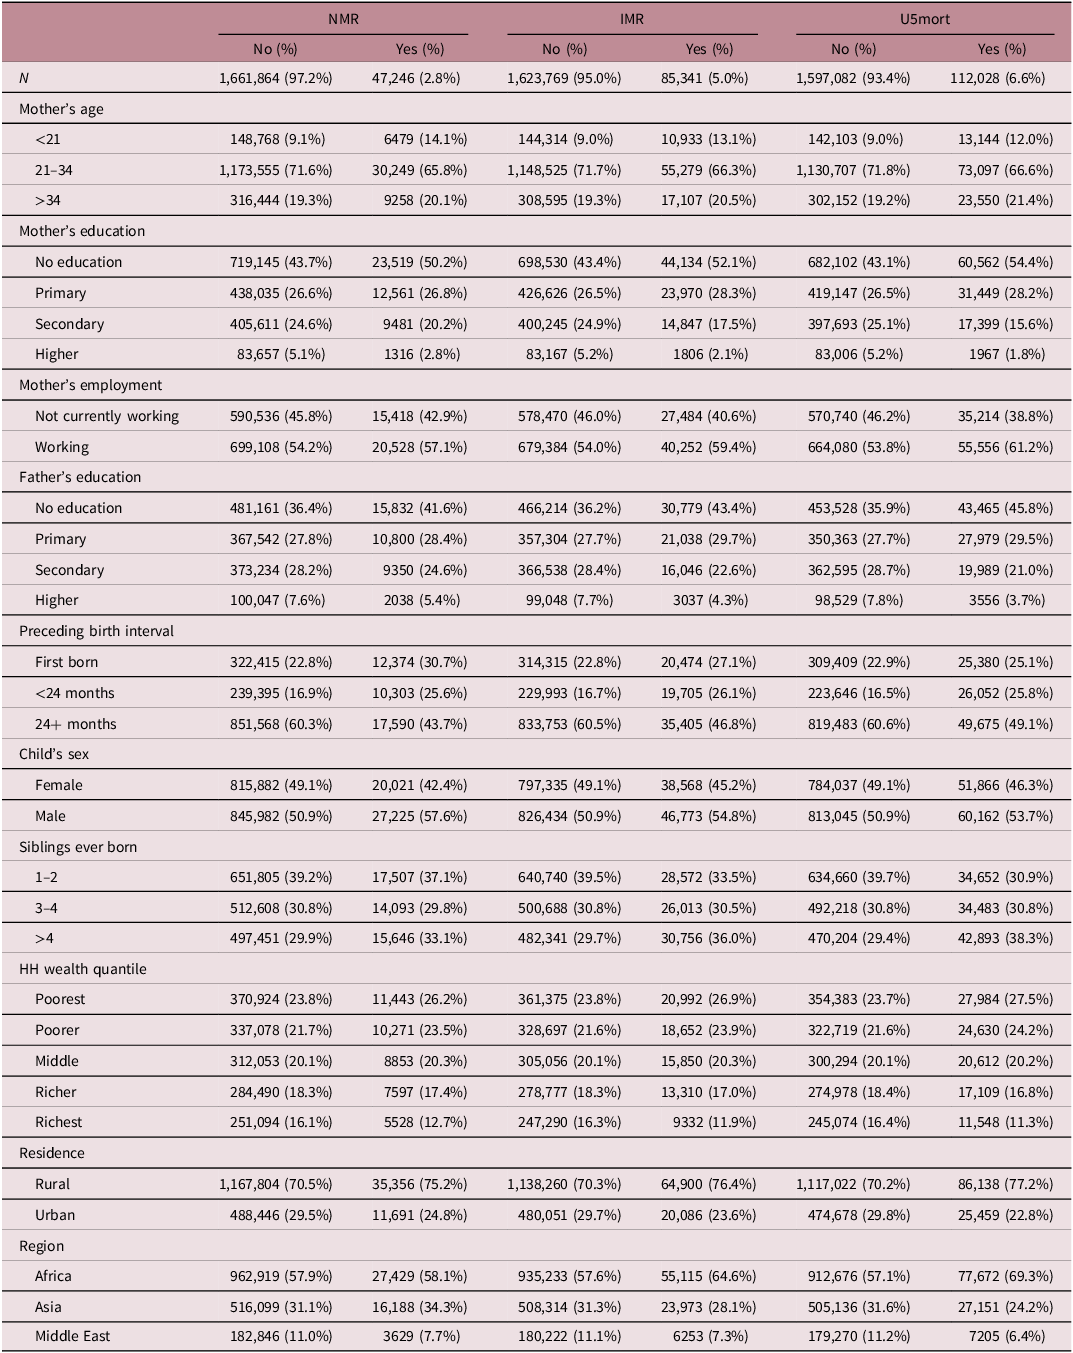
Covariates included child sex, maternal age, education, employment status, parity, preceding birth interval, household wealth quintile, residence, and father’s education. Reference Molina and Saldarriaga59,Reference Amir-ud-Din, Zafar, Muzammil, Shabbir, Malik and Usman67 Temperature metrics entered models continuously. Maternal age was grouped (<21, 21–34, >34 years) and education categorized as none, primary, secondary, or higher; other categorical covariates were dummy-coded with the lowest socio-economic category, rural residence, and female sex as reference groups (Table 1).
Bivariate association between covariates and mortality outcomes

Table 1. Long description
A table comparing mortality outcomes across different covariates. The table has 12 columns and 20 rows, including headers and row labels. The columns are labeled NMR No (%), NMR Yes (%), IMR No (%), IMR Yes (%), U5mort No (%), and U5mort Yes (%). The rows are labeled with various covariates such as Mother’s age, Mother’s education, Mother’s employment, Father’s education, Preceding birth interval, Child’s sex, Siblings ever born, HH wealth quantile, Residence, and Region. Each row provides percentages for the different outcomes under each column. For example, under Mother’s age, the table shows percentages for age groups < 21, 21-34, and > 34. Similarly, under Mother’s education, it shows percentages for no education, primary, secondary, and higher education levels. The table provides a detailed breakdown of how different covariates are associated with mortality outcomes.
Note: Pearson chi-square test indicates p < 0.001 for all comparisons across mortality categories (NMR, IMR, and under-five mortality).
DHS coordinate displacement (up to 2 km urban; 10 km rural) may misclassify temperature, though gridded resolution and trimester averaging mitigate error. Reference Boyle, King and Sobek65 Residual confounding by unmeasured environmental stressors (e.g., humidity, fine particulate matter) remains possible, but extensive socio-economic adjustment reduce this risk Reference Boyle, King and Sobek65 ; any remaining bias is more likely to attenuate than inflate the heat–mortality association. The adjusted model included approximately 700,000 births after exclusions; variable-specific sample sizes are reported in Table 1. With 43,256 PSUs, statistical power is high for detecting modest effect sizes.
Statistical methods
We first estimated the linear association between mean daily maximum temperature in each trimester and neonatal mortality, infant mortality, and under-5 mortality. Let h ism denote a binary indicator taking the value 1 if child i in stratum s born in month m died before the age of five years and 0 otherwise. Following Molina and colleagues, Reference Molina and Saldarriaga59 the core specification is
 $\eqalign{h_{ism}& =\beta _{0}+\beta _{1}{{\rm TMAX}}_{ism}^{{\rm TRIM}\;\!1}+\beta _{2}{{\rm TMAX}}_{ism}^{{\rm TRIM}\;\!2}\cr& \quad+\beta _{3}{{\rm TMAX}}_{ism}^{{\rm TRIM}\;\!3}+\gamma {\bf X}^{\prime}_{ism}+\varepsilon _{ism}}$
where TMAX
ism
TRIMk
is the average daily maximum temperature during trimester k (with k = 1 for months 6–8 before birth, k = 2 for months 3–5, and k = 3 for months 0–2). The vector
 ${\bf X}^{\prime}_{ism}$
contains covariates described earlier, and ϵ
ism
is an idiosyncratic error term.
To capture thermal variability rather than mean heat, we calculated a standardized deviation score for each birth month:
 $SD_{sm}=\left[{1 \over 9}{\sum }_{\mu =m-8}^{m}\left({\rm climate}_{s\mu }-\overline{{\rm climate}_{s}}\right)\right]/\sigma _{s}$
where climate
sμ
is the stratum-level mean temperature in month μ,
 $\overline{{\rm climate}_{s}}$
is the 72-month climatological mean (60 months before, the survey month itself, and 11 months after), and σ
s
is the corresponding long-run standard deviation. Incorporating this metric for each trimester yields
 $\eqalign{h_{ism}& =\beta _{0}+\beta _{1}{{\rm SD}}_{ism}^{{\rm TRIM}1}+\beta _{2}{{\rm SD}}_{ism}^{{\rm TRIM}2}+\beta _{3}{{\rm SD}}_{ism}^{{\rm TRIM}3}\cr& \quad+\gamma {\bf X}{^\prime}_{ism}+\varepsilon _{ism}}$
Because extreme departures from local climate normals may exert non-linear effects on survival, we next created four binary indicators flagging positive deviations exceeding 0.5, 1, 1.5, and 2 historical standard deviations in each trimester. Let the subscript g index these thresholds; the resulting specification is
 $\eqalign{h_{ism}& =\beta _{0}+\beta _{1,g}{{\rm SD}}_{ism}^{{\rm TRIM}1}+\beta _{2,g}{{\rm SD}}_{ism}^{{\rm TRIM}2}+\beta _{3,g}{{\rm SD}}_{ism}^{{\rm TRIM}3}\cr& \quad+\gamma {\bf X}^{\prime}_{ism}+\varepsilon _{ism}}$
where g = 1 when the deviation surpasses a given threshold and g = 0 otherwise; the below-threshold observations serve as the reference group. Comparing coefficients across g values allows us to trace the dose–response curve for increasingly severe heat exposures.
All four equations were estimated with multilevel logistic regression, specifying random intercepts at the primary-sampling-unit level to absorb intra-cluster correlation. Reference Amir-ud-Din, Kumar, Naeem and Khan68
A complete-case approach was adopted, and no imputation for missing data was performed, because the predominant exclusion mechanism was the survey-level absence of geocoordinates rather than outcome-related factors, for which imputation offers no remedy.
Results
Figure 1 presents the density distribution of average maximum temperatures and their variability across Africa, Asia, and the Middle East. The left panel reveals that Africa exhibits the highest density of average maximum temperatures around 31°C, underscoring the prevalence of elevated thermal conditions in this region. In contrast, the right panel demonstrates the variability in these temperatures, with Africa displaying the highest density near zero standard deviation, indicating a remarkable consistency in its thermal profile. These findings highlight distinct climatic characteristics, with Africa not only experiencing higher maximum temperatures but also demonstrating less variability compared to Asia and the Middle East.
Average maximum temperature across three regions in the study sample.

All covariates display highly significant bivariate links with neonatal, infant and under-five mortality (p < 0.001) (Table 1). Deaths are concentrated among the most disadvantaged: mothers with no education account for roughly half of all fatalities but only two-fifths of survivors, while the richest households and highly educated parents are strikingly under-represented. Early childbearing (<21 y), short or absent preceding birth intervals and large sibships each raise risk, together explaining nearly half of under-five deaths versus about one-third of survivors. Male infants, rural households and sub-Saharan African clusters consistently show excess mortality, reinforcing the combined importance of biological vulnerability and structural deprivation.
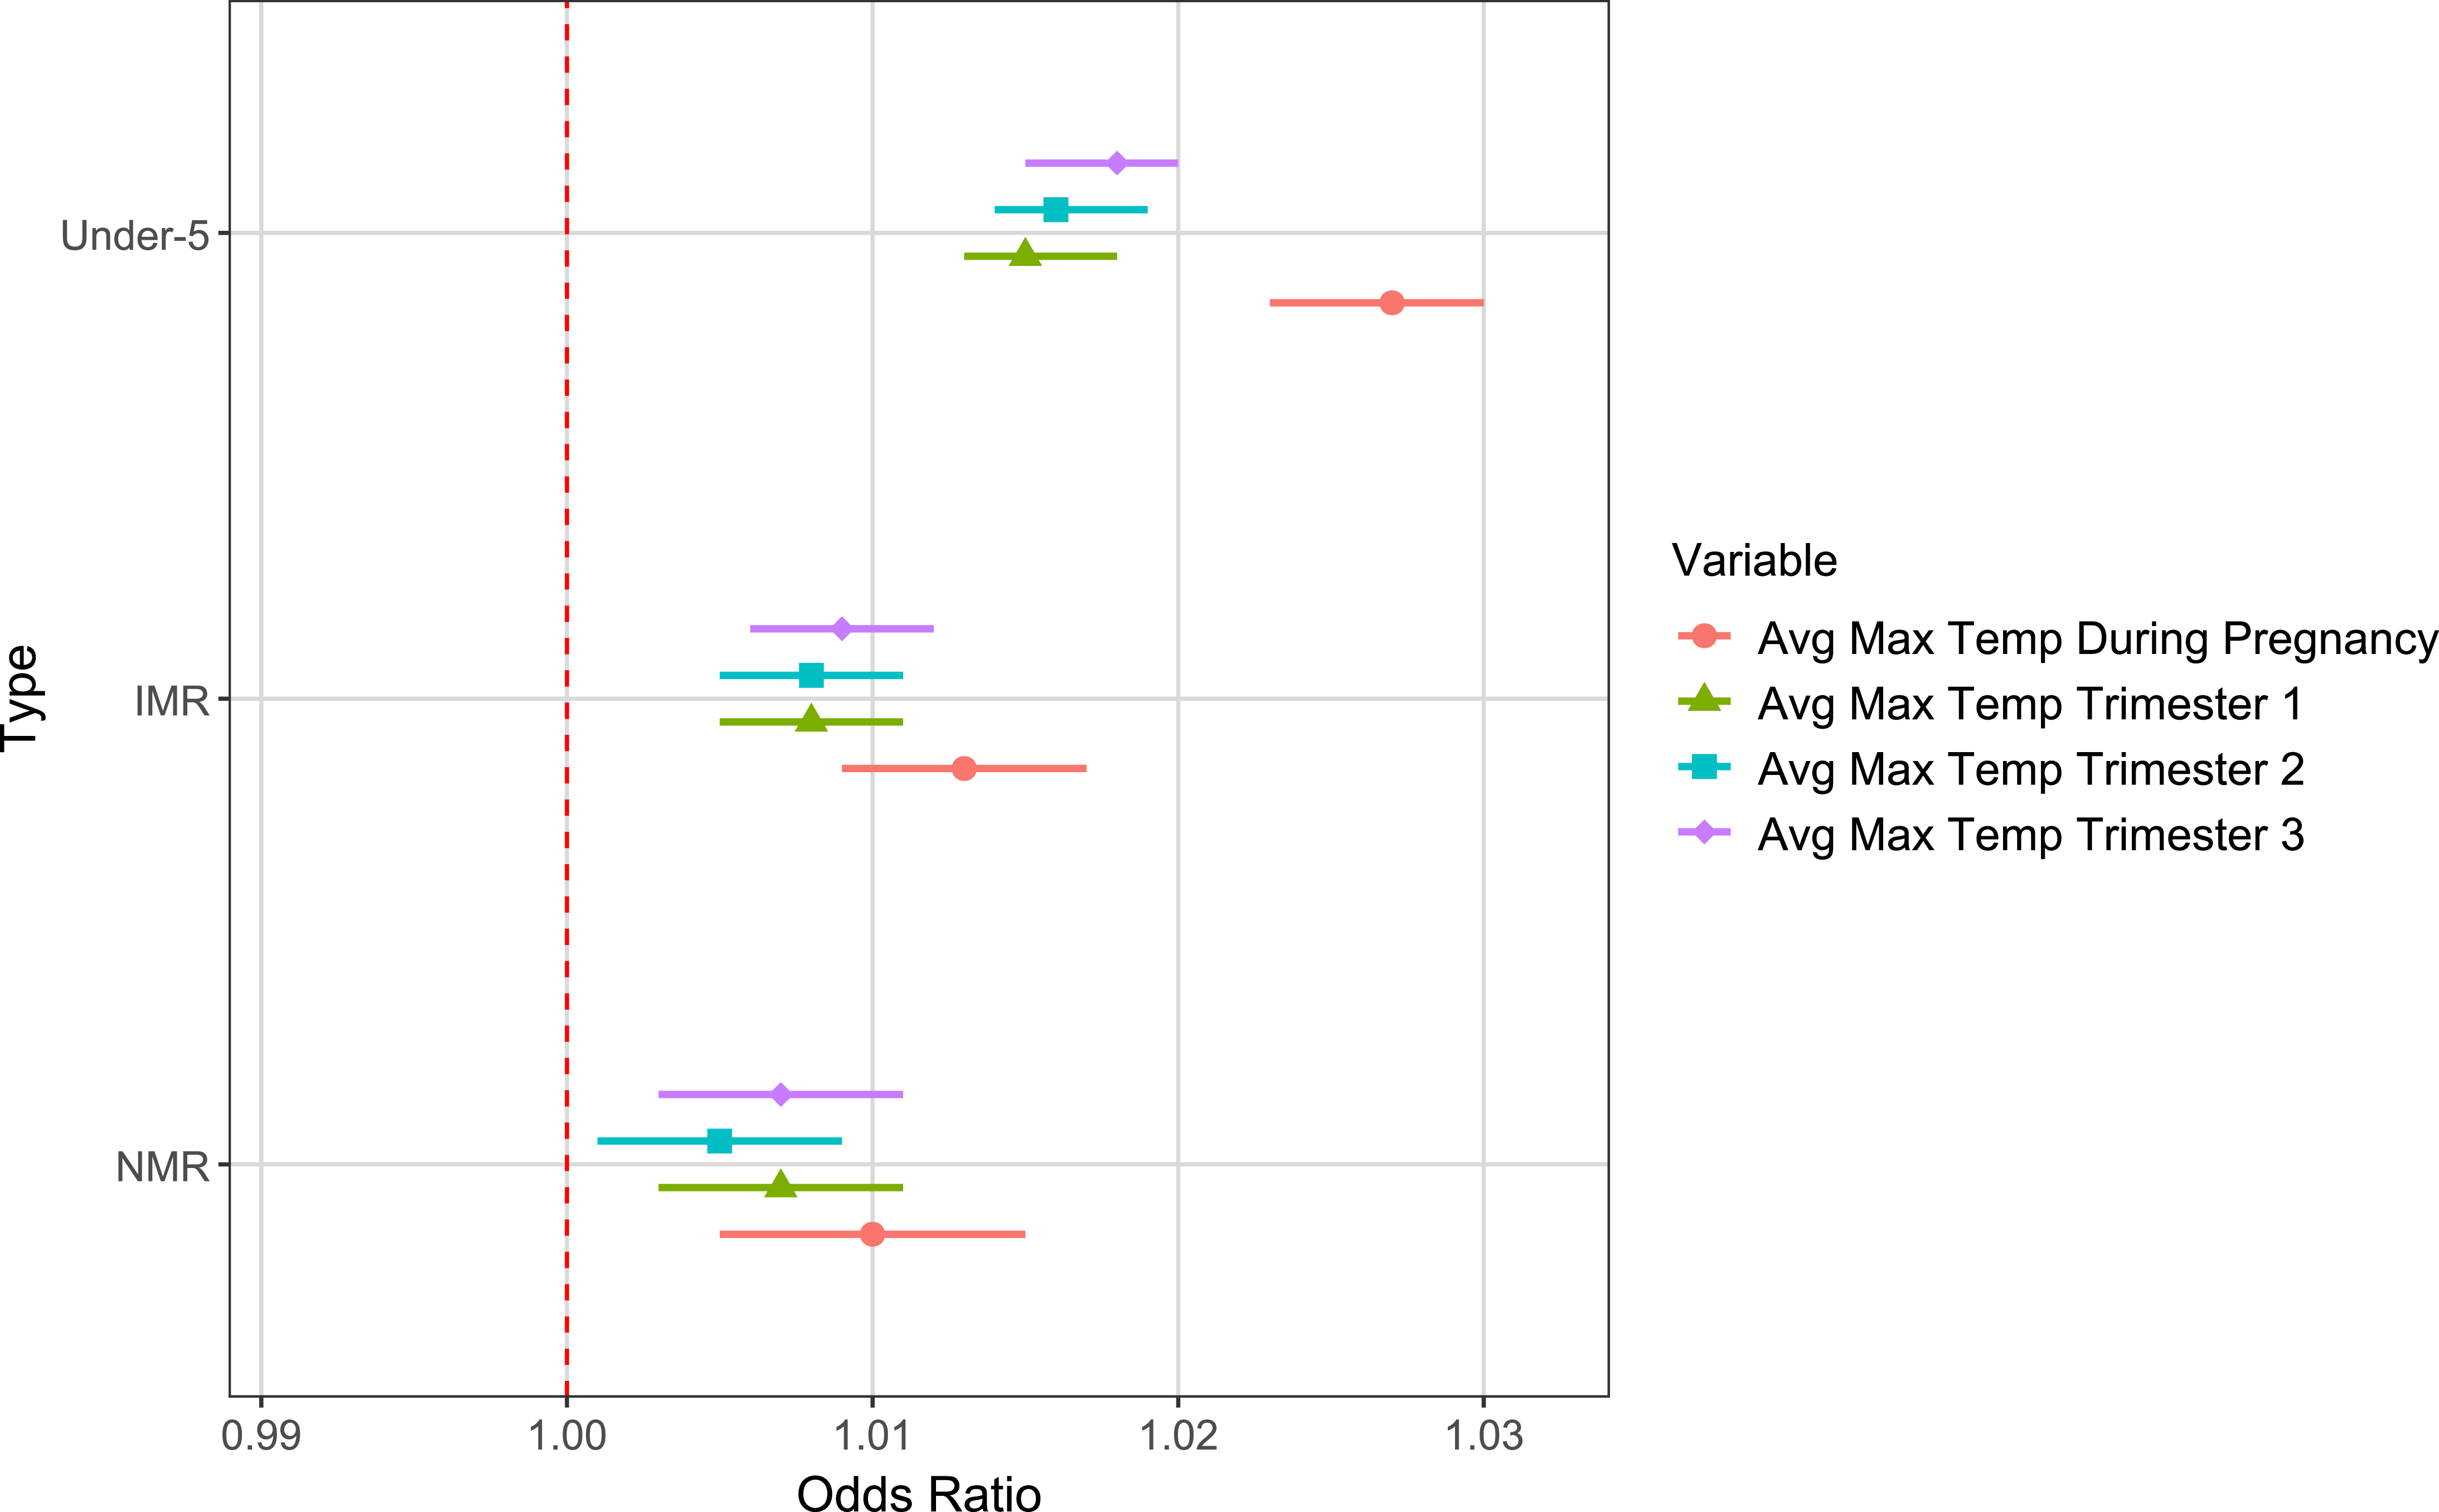
The results of the multilevel logistic regression analyses indicate that higher average maximum temperatures during pregnancy are significantly associated with increased risks of neonatal, infant and under-5 mortality (Figure 2). For neonatal mortality, a one-unit increase in temperature during the first and third trimesters was associated with a 0.7% increase in the odds of death (OR = 1.007; 95% CI: 1.003–1.011; p < 0.001), while exposure during the second trimester corresponded to a 0.5% higher risk (OR = 1.005; 95% CI: 1.001–1.009; p < 0.05); overall, exposure throughout pregnancy was linked to a 1.0% increase in risk (OR = 1.01; 95% CI: 1.005–1.015; p < 0.001). Similarly, for infant mortality, each trimester’s exposure yielded significant associations (ORs ranging from 1.008 to 1.009; all p < 0.001) with an overall effect of a 1.3% increase in the odds of death (OR = 1.013; 95% CI: 1.009–1.017; p < 0.001). Notably, the strongest associations were observed for under-5 mortality, where exposures in the first, second and third trimesters were linked to 1.5%, 1.6% and 1.8% higher odds of death respectively (all p < 0.001), and cumulative exposure during pregnancy resulted in a 2.7% increase in risk (OR = 1.027; 95% CI: 1.023–1.03; p < 0.001).
Association of average maximum temperature during pregnancy and by trimester with neonatal, infant, and under-5 mortality. Odds ratios (95% CI) from multilevel logistic regression with primary-sampling-unit random intercepts, adjusted for maternal age, parental education, maternal employment, preceding birth interval, child sex, parity, household wealth, residence, and region.

Using quintiles of average maximum temperature (with the lowest quintile as the reference), the analyses for neonatal and infant mortality reveal heterogeneous associations across trimesters (Figure 3). For neonatal mortality, in the first trimester only the highest quintile was significantly associated with an increased risk (OR = 1.092; 95% CI: 1.032–1.157; p < 0.01), while in the second trimester the upper quintile showed a significant increase (OR = 1.100; 95% CI: 1.043–1.161; p < 0.001). In the third trimester, the lower quintile was linked to a reduced risk (OR = 0.942; 95% CI: 0.893–0.993; p < 0.05) whereas both the upper (OR = 1.072; 95% CI: 1.016–1.131; p < 0.05) and highest (OR = 1.076; 95% CI: 1.018–1.138; p < 0.01) quintiles were significantly associated with higher odds. When considering exposure averaged across all trimesters, the middle (OR = 1.065; 95% CI: 1.008–1.124; p < 0.05), upper (OR = 1.162; 95% CI: 1.100–1.228; p < 0.001) and highest (OR = 1.145; 95% CI: 1.083–1.211; p < 0.001) quintiles demonstrated significant increases in neonatal mortality risk. In contrast, for infant mortality the associations were more consistent: in the first trimester the middle (OR = 1.067; 95% CI: 1.024–1.113; p < 0.01), upper (OR = 1.079; 95% CI: 1.034–1.125; p < 0.001) and highest (OR = 1.116; 95% CI: 1.068–1.165; p < 0.001) quintiles were all significantly linked with increased risk, with similarly robust patterns emerging in the second, third and combined trimester analyses (e.g. for all trimesters the upper quintile: OR = 1.199; 95% CI: 1.150–1.251; p < 0.001).
Regarding under-5 mortality, higher quintiles of temperature exposure were consistently associated with increased risks across trimesters. In the first trimester, relative to the reference, the lower (OR = 1.059; 95% CI: 1.020–1.099; p < 0.01), middle (OR = 1.137; 95% CI: 1.095–1.181; p < 0.001), upper (OR = 1.175; 95% CI: 1.131–1.221; p < 0.001) and highest (OR = 1.230; 95% CI: 1.183–1.279; p < 0.001) quintiles were all linked to significantly higher odds of mortality. A similar gradient was observed in the second and third trimesters – with the highest quintile yielding ORs of 1.257 (95% CI: 1.210–1.306; p < 0.001) and 1.258 (95% CI: 1.212–1.307; p < 0.001), respectively. When exposure was averaged across all trimesters, the risk of under-5 mortality increased progressively with higher quintiles, culminating in a 38.3% increase in the highest quintile (OR = 1.383; 95% CI: 1.330–1.437; p < 0.001), thus indicating a clear dose–response relationship.
Association of higher prenatal temperature quintiles, relative to the lowest quintile, with neonatal, infant, and under-5 mortality. Reference: lowest temperature quintile; model and covariate adjustments as in Figure 2.

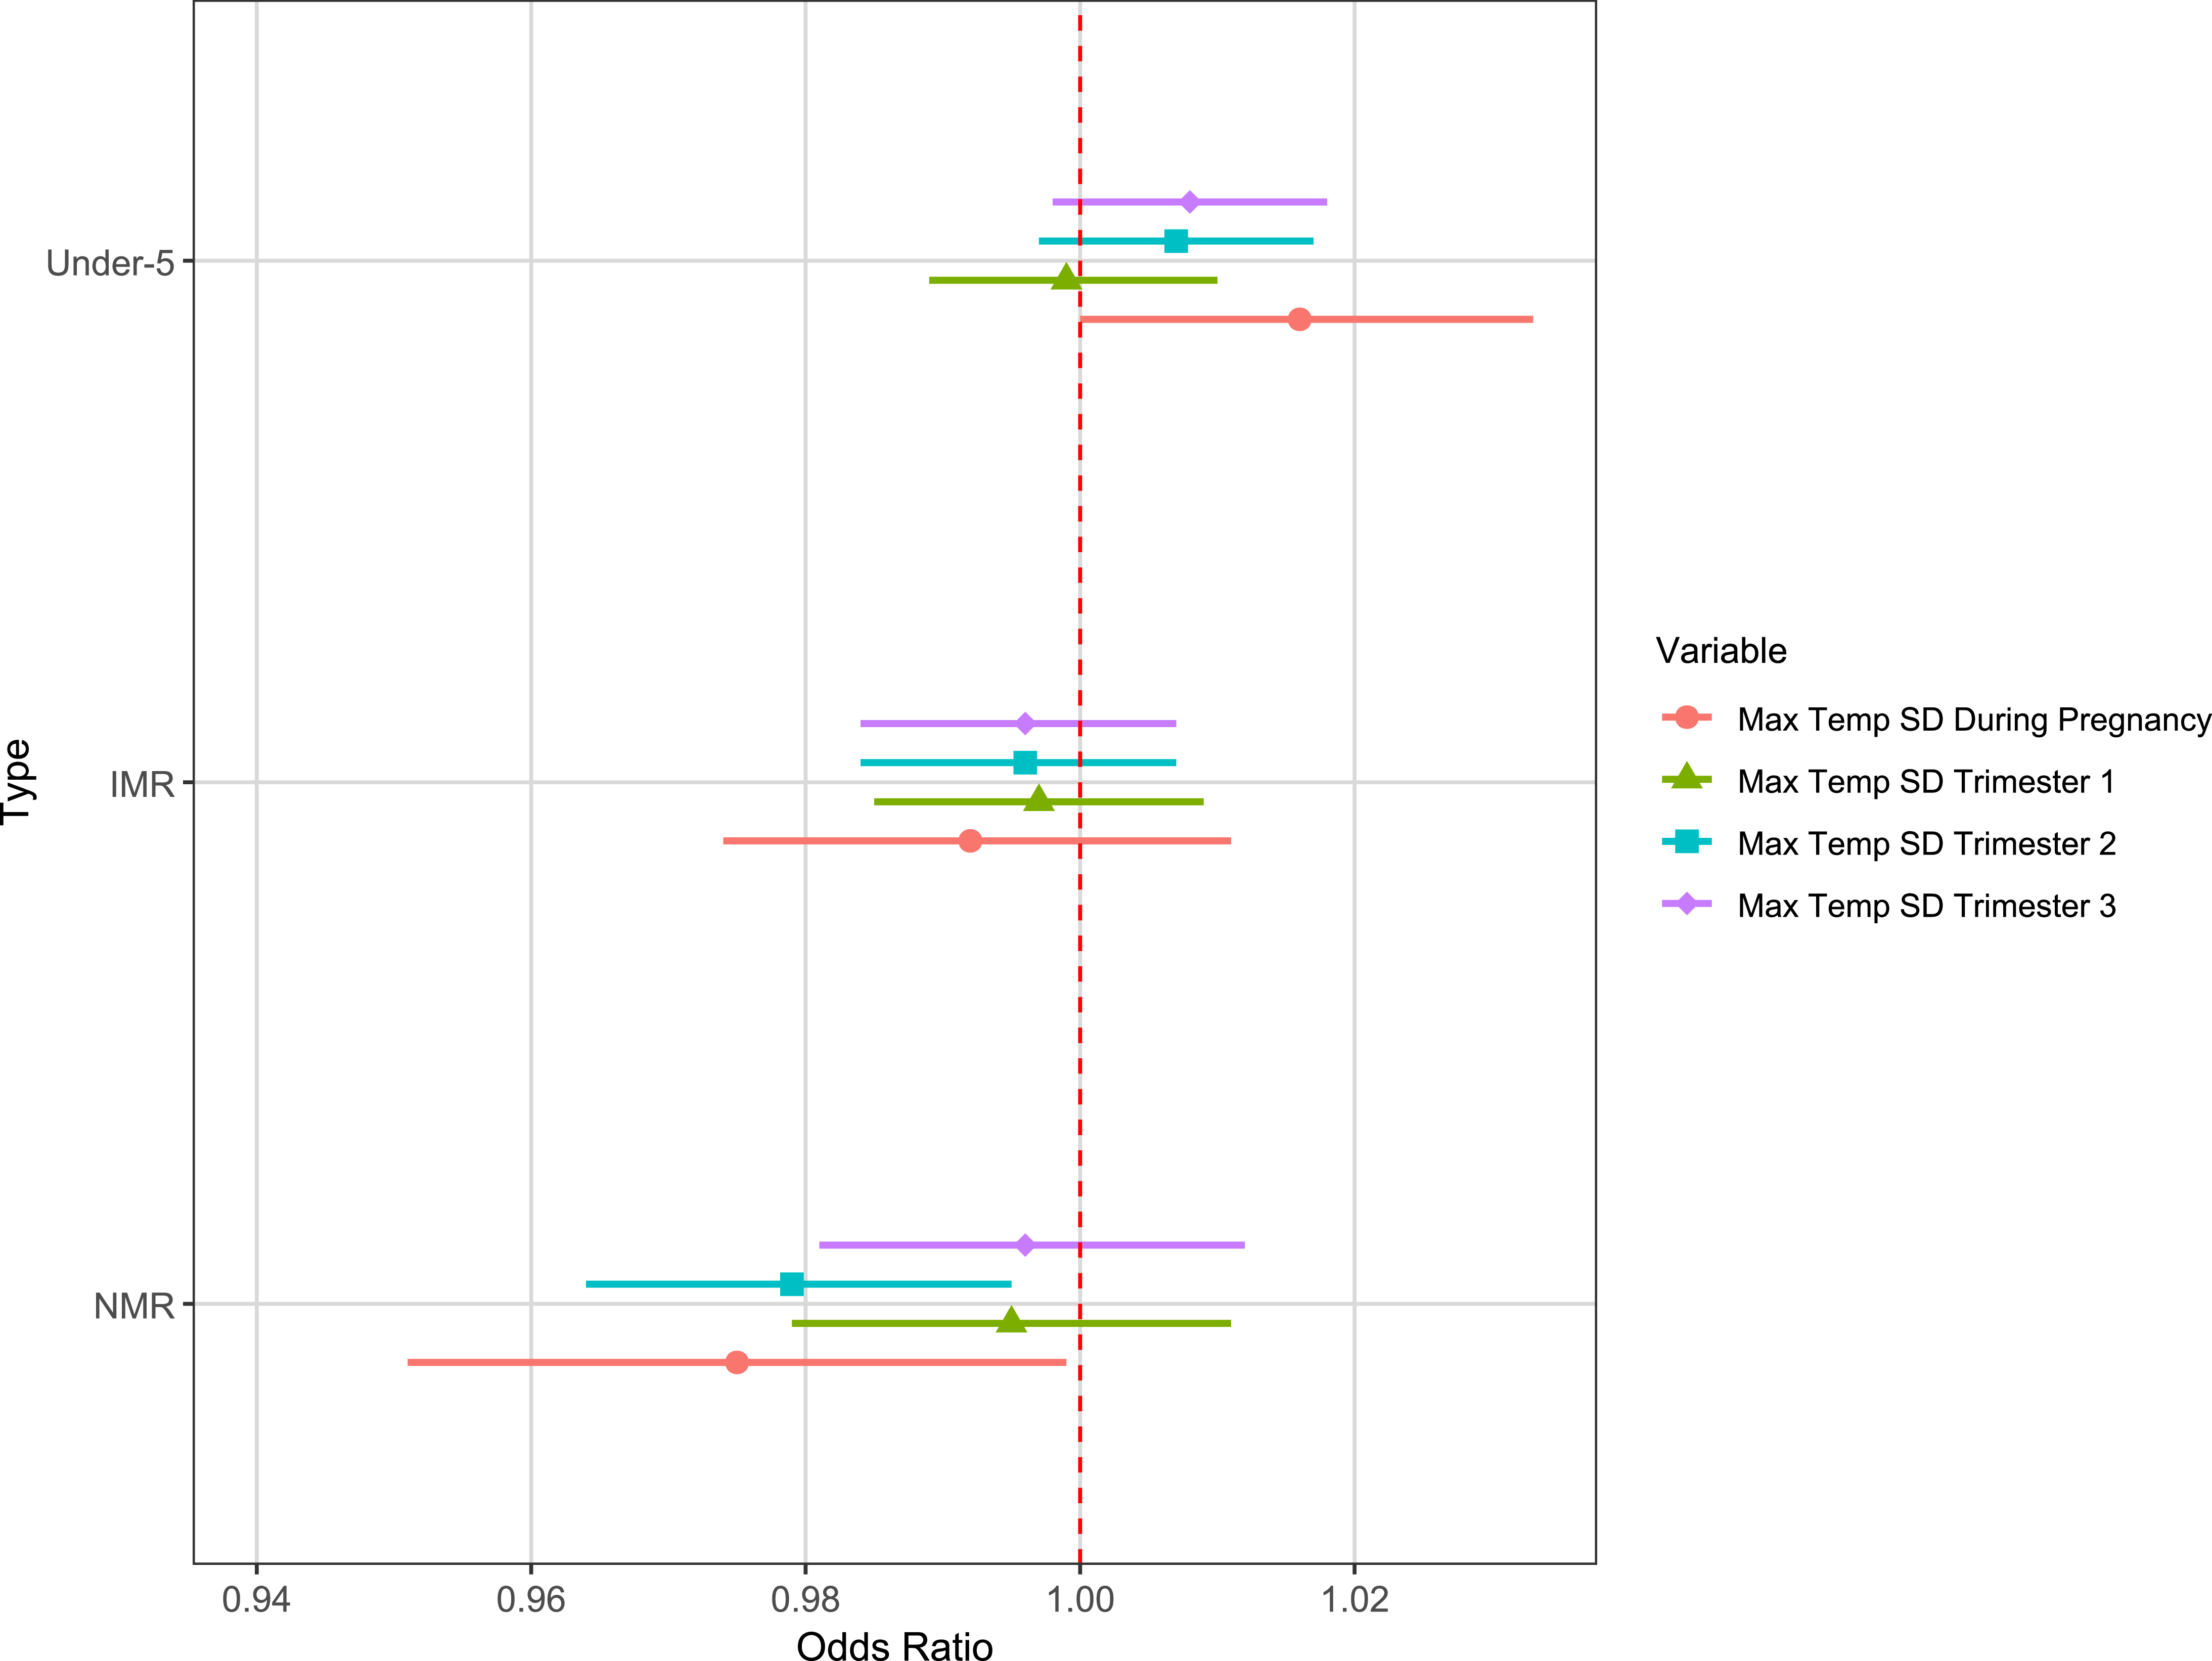
For neonatal mortality, a one-unit increase in the standard deviation of maximum temperature during the second trimester was associated with a significant reduction in risk (OR = 0.979; 95% CI: 0.964–0.995; p < 0.01) (Figure 4). In addition, overall exposure to temperature fluctuations during pregnancy was linked with lower neonatal mortality (OR = 0.975; 95% CI: 0.951–0.999; p < 0.05), while the associations for the first and third trimesters were not statistically significant.
For infant mortality, none of the trimester-specific or overall estimates reached statistical significance, as all corresponding confidence intervals encompassed unity. In contrast, although the trimester-specific associations for under-5 mortality were non-significant, the overall measure of temperature variability during pregnancy was marginally associated with increased risk (OR = 1.016; 95% CI: 1.000–1.033; p < 0.1). These findings, while modest in magnitude, suggest that the effects of temperature fluctuations on early-life mortality outcomes may vary by developmental period.
Association of prenatal temperature variability (standardized deviation) with neonatal, infant, and under-5 mortality. Model and covariate adjustments as in Figure 2.

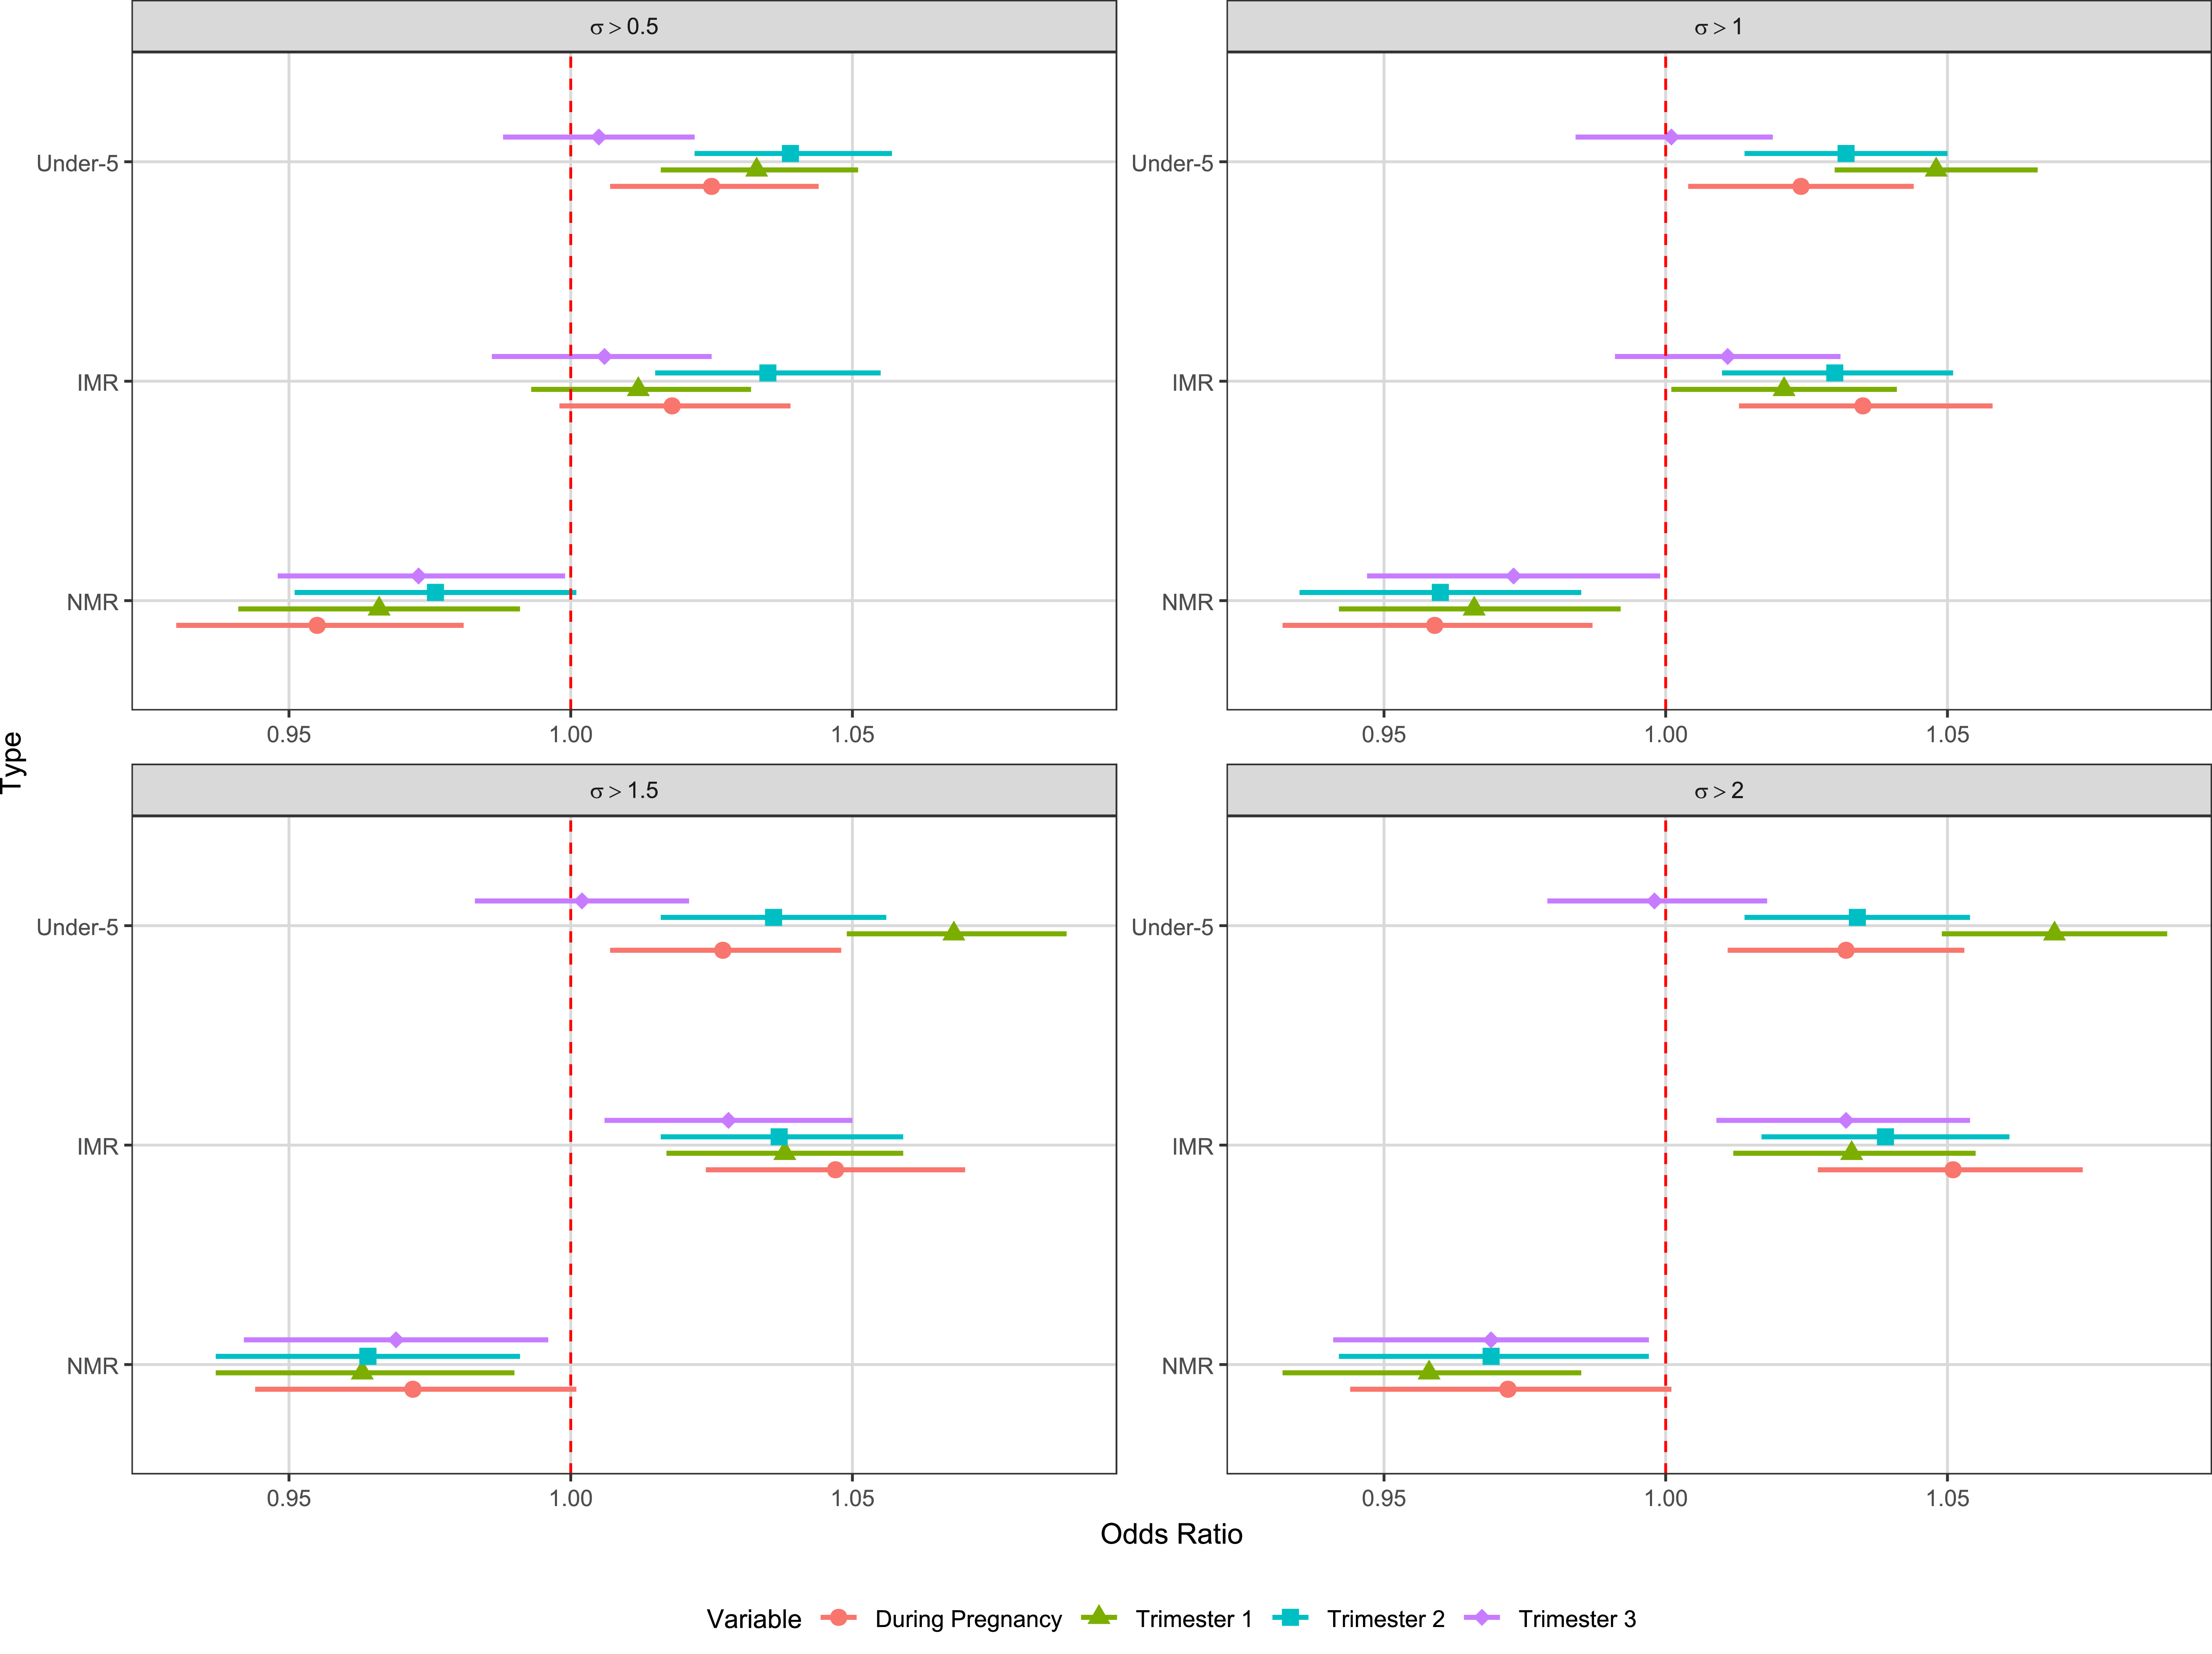
Exposure to temperature fluctuations above the historical mean during pregnancy was generally associated with increased risks of infant and under-5 mortality (Figure 5). For example, for infant mortality, exposure during the second trimester to fluctuations exceeding 0.5σ yielded an estimate of (OR = 1.035; 95% CI: 1.015–1.055; p < 0.001), while for fluctuations exceeding 2σ over all trimesters the risk was elevated (OR = 1.051; 95% CI: 1.027–1.074; p < 0.001). Under-5 mortality results followed a similar pattern, with statistically significant increased odds observed across various thresholds – such as in the first trimester for deviations above 0.5σ (OR = 1.033; 95% CI: 1.016–1.051; p < 0.001) and above 1.5σ (OR = 1.068; 95% CI: 1.049–1.088; p < 0.001) – underscoring a robust positive association between extreme temperature deviations and these mortality outcomes.
In contrast, the findings for neonatal mortality (NMR) are counterintuitive, as increased exposure to high temperature fluctuations was generally linked to lower odds of neonatal death. For instance, during the first trimester, exposure to fluctuations exceeding 0.5σ was associated with a reduced risk (OR = 0.966; 95% CI: 0.941–0.991; p < 0.01), and similarly, in the second trimester, deviations above 1σ yielded an OR = 0.960; 95% CI: 0.935–0.985; (p < 0.01). However, many of these associations are at the borderline of statistical significance (e.g., p < 0.05 or p < 0.1), suggesting that these counterintuitive protective effects should be interpreted with caution.
Association of positive prenatal temperature deviations (σ > 0.5, 1, 1.5, 2) with neonatal, infant, and under-5 mortality. Reference: below-threshold births; model and covariate adjustments as in Figure 2.

Sensitivity analyses
Because retrospective birth histories rely on maternal recall, the accuracy of reported survival outcomes may diminish for births further removed from the survey date, with the earliest neonatal deaths being the most susceptible to omission or mis-dating. To gauge whether such recall error materially influenced our results, we re-estimated the temperature–mortality associations after restricting the sample to births occurring within the five years preceding each survey, the window over which recall is most reliable. We focused this check on neonatal and infant mortality, the outcomes for which recall concerns are most acute and for which the restricted window preserves complete follow-up. The restricted-cohort estimates were materially indistinguishable from those in the full sample: the cumulative whole-pregnancy odds ratios remained 1.010 for neonatal and 1.013 for infant mortality, with the trimester-specific patterns likewise preserved (Figure S1 in the Supplementary Information document). This concordance indicates that recall-related misclassification is unlikely to be driving our findings and lends reassurance to the robustness of the main analysis.
Discussion
Our multilevel logistic regression analyses indicate that higher average maximum temperatures during pregnancy are associated with significantly increased risks of neonatal, infant, and under-5 mortality, and that these associations vary by trimester, by position in the temperature distribution, and by whether exposure is expressed as mean heat or as month-to-month variability.
A one-Celsius rise in trimester-specific average maximum temperature raises the odds of neonatal, infant, and under-five mortality by 1.0%, 1.3%, and 2.7%, respectively – below the ≈ 4% per-degree excess neonatal risk reported in recent global syntheses Reference Dimitrova, Dimitrova, Mengel, Gasparrini, Lotze-Campen and Gabrysch69 yet directionally consistent. These effects operate through well-documented pathways: heat-driven dehydration curtails uteroplacental perfusion, while oxidative stress and inflammatory cytokines impair placental nutrient transport, precipitating growth restriction and pre-term birth. Reference Zheng, Ma and Wang13,Reference Bonell, Hirst, Vicedo-Cabrera, Haines, Prentice and Maxwell14 After delivery, sustained ambient heat compounds fluid loss and suppresses immune defenses, increasing infection risks for infants and young children. Even modest warming thus amplifies child-mortality burdens, underscoring the urgency of embedding heat-alert counseling in antenatal care and investing in cooling infrastructure as temperatures continue to rise.
Our trimester-resolved models show that neonatal mortality rises most steeply when excess heat strikes in the first and, especially, the third trimester, whereas infant and under-five deaths increase steadily across all three windows. The early-pregnancy sensitivity likely reflects disruption of placental angiogenesis and trophoblast invasion, processes that establish the vascular bed for nutrient and oxygen exchange; heat-induced dehydration and oxidative stress during this phase can throttle uteroplacental perfusion, compromising fetal growth from the outset. Reference Alvarez-Elias, Brenner and Luyckx10,Reference Zheng, Ma and Wang13 Conversely, the late-gestation spike coincides with the period when placental blood flow is near maximal and maternal thermoregulatory reserve is lowest: even modest dehydration can precipitate hypoxic injury, pre-term labor, and low birth weight, all potent drivers of neonatal death. Reference Bonell, Hirst, Vicedo-Cabrera, Haines, Prentice and Maxwell14,Reference Ramirez, Maldonado, Mach, Potter, Balise and Santos15 Infants and older children exhibit a more uniform vulnerability because gestational insults compound with post-natal heat exposure, dehydration, and infection, producing a cumulative risk that is less tied to any single trimester yet rises inexorably with each degree of warming. Reference Contreras-Correa, Messman, Sanchez-Rodriguez, Burnett and Lemley17
The quintile analysis underscores that heat-related mortality risk is neither monotonic nor uniform across gestation, especially for neonates. We found risk confined to the uppermost quintile in the first trimester (e.g., above 30°C), resurfacing at both the upper and highest quintiles in the third trimester, whereas the lowest quintile in late gestation (e.g., below 20°C) appeared protective. Similar U-or J-shaped patterns are evident in the literature: a Swedish time-series showed that neonatal deaths rose by 25% when mean temperature climbed from 14.5°C to 20°C, but the slope became markedly steeper only beyond 24°C Reference Bruckner, Trinh N.T. and Lelong31 ; conversely, a Bangladeshi cohort reported lower neonatal mortality above 40°C, plausibly reflecting selective early pregnancy loss or behavioral avoidance in extremely hot periods. Reference Venugopal, Latha and Shanmugam11 Modest warmth may transiently improve peripheral perfusion, yet once dehydration and oxidative stress overwhelm placental defenses, uteroplacental hypoperfusion and inflammatory damage dominate. Reference Alvarez-Elias, Brenner and Luyckx10,Reference Zheng, Ma and Wang13 The apparent protection in the lowest third-trimester quintile therefore likely captures a narrow thermal “comfort band,” whereas the abrupt risk escalation in the upper quintiles points to a physiological threshold beyond which compensatory mechanisms fail.
By contrast, infant and under-5 mortality display a clear, graded dose–response across all quintiles, implying that post-natal exposure compounds any gestational insults. Infants born pre-term or growth-restricted – outcomes strongly linked to late-pregnancy heat, dehydration, and placental oxidative stress Reference Bonell, Hirst, Vicedo-Cabrera, Haines, Prentice and Maxwell14,Reference Ramirez, Maldonado, Mach, Potter, Balise and Santos15 – enter life with diminished thermoregulatory and immunological reserves. Subsequent exposure to sustained heat amplifies dehydration, suppresses innate immunity, and increases diarrheal and respiratory infections, thereby yielding the monotonic risk gradient we observe. Reference Turner, Mitchell and Kumar16,Reference Contreras-Correa, Messman, Sanchez-Rodriguez, Burnett and Lemley17 For under-5 children, the cumulative burden of repeated heat episodes, compounded by air-pollution co-exposures and poor cooling infrastructure in low-resource settings, likely explains the steeper slope of our quintile curves. Reference Wang, Zhou, Tian and Hu47,Reference Tuholske, Caylor and Funk50
Our analysis defines temperature variability as the standardized month-to-month deviation of the strata-specific mean temperature from its long-run (seventy-two-month) climatology, computed separately for each trimester. Using this metric, we find that greater variability during the second trimester lowers neonatal mortality, whereas variability averaged across gestation has no discernible effect on infants and is only marginally harmful for children under five. By contrast, Pehlivan et al., Reference Pehlivan, Kang and Lee70 who examined day-to-day fluctuations in South Korea, reported uniformly higher all-cause mortality – especially during spring and summer – when inter-day variability increased. The disparity in findings suggests that the scale of fluctuation matters: moderate month-to-month oscillations may up-regulate placental heat-shock proteins and enhance uteroplacental blood flow, thereby strengthening fetal resilience, while sharper day-to-day swings can overwhelm the immature thermoregulatory and immune systems of newborn and young children, heightening dehydration and infection risks. Reference Zheng, Ma and Wang13,Reference Contreras-Correa, Messman, Sanchez-Rodriguez, Burnett and Lemley17
Extreme positive temperature anomalies during the first trimester of our cohort were paradoxically linked to a modest fall in neonatal deaths, yet the same deviations raised the risk of infant and under-five mortality across all trimesters. One explanation is selective survival: intense early-pregnancy heat may precipitate miscarriage among the most vulnerable conceptions, leaving a more resilient set of live births that exhibit lower neonatal mortality. Heat can also trigger placental expression of protective heat-shock proteins and angiogenic factors, which might transiently bolster fetoplacental perfusion. Reference Zheng, Ma and Wang13 Such short-lived physiological benefits, however, do not extend beyond the neonatal window; infants and young children remain exposed to cumulative dehydration, immunosuppression, and infection hazards once the extreme temperatures recur post-natally. This age-differentiated response echoes mechanistic studies showing that the immature thermoregulation and immune systems of older infants cannot match the transient placental adaptations seen during pregnancy. Reference Contreras-Correa, Messman, Sanchez-Rodriguez, Burnett and Lemley17
Hospital-based evidence from Benin, Malawi, Tanzania, and Uganda adds a complementary perspective. Using a time-stratified case-crossover design, Hanson et al. Reference Hanson, de Bont and Annerstedt71 reported that a rise in weekly mean temperature from the seventy-fifth to the ninety-ninth percentile increased early perinatal deaths by about one-third, with the steepest slope for intrapartum stillbirths. These findings imply that very acute heat burdens shortly before delivery can overwhelm even well-functioning placentas, especially when intrapartum care is limited. Together with our trimester-specific results, this pattern suggests that heat acts through at least two pathways: an early-pregnancy selection and adaptation pathway that can sometimes appear protective, and a late-pregnancy and perinatal pathway characterized by acute hypoxia and oxidative stress that sharply elevates mortality. Focusing solely on mean temperature therefore risks understating the danger posed by rare but intense heat episodes and underscores the need for integrated antenatal and intrapartum heat-alert protocols in tropical health systems.
The infant and child dose–response gradient across quintiles likely reflects heat-induced dehydration and oxidative stress during pregnancy that restricts growth and precipitates pre-term birth, creating newborns with limited thermoregulatory capacity and suppressed immunity who are highly vulnerable to post-natal heat and infection. Reference Zheng, Ma and Wang13,Reference Bonell, Hirst, Vicedo-Cabrera, Haines, Prentice and Maxwell14 This pathway aligns with the global synthesis by Lakhoo et al., Reference Lakhoo, Brink and Radebe72 which links each one-degree Celsius rise to higher odds of pre-term birth and stillbirth, both precursors of elevated infant mortality. Neonates appear protected until late gestation because moderate earlier warmth can trigger placental heat-shock responses, but once third-trimester temperatures exceed that compensatory threshold, placental insufficiency, hypoxia, and oxidative injury drive the sudden spike in deaths. Reference Ramirez, Maldonado, Mach, Potter, Balise and Santos15
Our per-degree estimates – about 1% higher neonatal mortality, 1.3% higher infant mortality, and 2.7% higher under-five mortality for each additional degree of average maximum temperature – sit at the lower end of the 4%–13% neonatal or perinatal excess risk per degree reported in recent global syntheses. Reference Dimitrova, Dimitrova, Mengel, Gasparrini, Lotze-Campen and Gabrysch69,Reference Lakhoo, Brink and Radebe72 Part of this gap reflects our trimester-resolved exposure metric: we average temperature over calendar months within each gestational window, whereas most studies rely on daily heat indices or heat-wave indicators that capture short, intense spikes and therefore yield steeper slopes. Moreover, our finding that moderate early-pregnancy warmth and modest month-to-month variability can be protective for neonates diverges from reviews that pool all exposure windows; this suggests that selection effects (loss of the frailest pregnancies) and placental conditioning may offset heat harms until late gestation, when placental perfusion becomes limiting. By explicitly modeling both mean temperature and its variance across trimesters, we therefore reveal a more nuanced risk profile that helps reconcile the apparently larger pooled effect sizes with the smaller but biologically consistent gradients observed in our data.
The study’s multilevel design, applied to more than 1.7 million births, joins fine-grained IPUMS-DHS strata with 0.1° gridded climate surfaces, allowing mean temperature, its month-to-month variability, and positive anomalies to be modeled separately – an analytical approach distinct from many prior studies. As an observational study, this design supports associational rather than causal inference: the relationships reported here can generate hypotheses about prenatal heat and child mortality but cannot, on their own, confirm a causal effect, which would require experimental or quasi-experimental designs. The associations themselves are also subject to several limitations. Exposure may be misclassified: household coordinates approximate but do not equal the locations where mothers actually labor or seek care, and our measure relies on daytime air temperature alone, omitting humidity, night-time warmth, and particulate pollution. This matters because the heat strain a body actually experiences depends on heat and humidity together – high humidity blocks cooling through sweat, and warm nights deny any overnight recovery – so air temperature is only a rough stand-in for true thermal stress. Such imprecision most likely pulls our estimates toward zero, implying that the real risks may be larger than those reported here. Survival bias is possible because only live births enter the cohort, and retrospective birth histories may mis-date early neonatal deaths. Even so, the findings argue for embedding heat-alert messaging within routine antenatal services, expanding affordable cooling infrastructure in maternity wards and post-natal clinics, and upgrading national climate-health surveillance so that both temperature means and their variability trigger warnings.
Conclusion
In conclusion, our trimester-resolved analysis across 31 low-and middle-income countries shows that every additional Celsius degree of average maximum temperature during pregnancy elevates the odds of neonatal, infant and under-5 mortality by 1.0%, 1.3% and 2.7%, respectively, with the first and especially the third trimester emerging as critical windows of vulnerability. This excess risk is magnified when temperatures enter the upper quintiles, yet can be partly offset by moderate, month-to-month variability that appears to pre-condition the placenta. Conversely, acute positive anomalies (>0.5σ) paradoxically lower neonatal deaths – likely through selective early pregnancy loss – while still raising post-natal mortality. Together, these findings reinforce biological evidence linking heat to placental insufficiency, dehydration, oxidative stress and suppressed immunity, underscore the limitations of relying solely on mean temperature metrics, and strengthen the case for embedding heat-alert counseling and affordable cooling infrastructure within routine maternal and child health services as global temperatures inexorably rise.
Supplementary material
The supplementary material for this article can be found at https://doi.org/10.1017/S2040174426100701.
Data availability statement
This study uses publicly available IPUMS-DHS data. The constructed analytical dataset and replication code will be made publicly available upon acceptance of the manuscript.
Acknowledgments
We gratefully acknowledge the IPUMS-DHS team for providing harmonized DHS data for use in this research.
Author contribution
All authors contributed equally to the conceptualization, data analysis, interpretation, and writing of the manuscript.
Financial support
The authors received no specific funding for this work.
Competing interests
None.
Ethical standard
IPUMS-DHS provides anonymized DHS data collected under strict ethical protocols approved by the ICF IRB and national committees. No additional ethical approval was required.
Declaration of AI use
During the preparation of this revised manuscript, the authors used two cloud-based AI tools – Claude and DeepSeek – for improving language clarity, grammar, and readability, as well as for summarizing and synthesizing information during the literature review process. All AI-generated suggestions were reviewed, fact-checked against original sources, and edited by the authors, who assume full responsibility for the final content of the manuscript, including the accuracy of all citations and interpretations.




 Open access

