Introduction
Size is a conspicuous feature easily measured in both modern and fossil organisms. It is also the most recognizable attribute of living systems. Evolutionary trends in body size change have been documented for some time, and numerous hypotheses attempting to explain such changes have been suggested. However, these ‘rules’ are generalizations and do not necessarily apply to all cases (Harries and Knor, Reference Harries and Knorr2009; Huang et al., Reference Huang, Harper, Zhan and Rong2010; Borths and Ausich, Reference Borths and Ausich2011). Among these rules are “Cope’s Rule,” “Island Rule,” “Bergmann’s Rule,” and “Lilliput effect” (Urbanek, Reference Urbanek1993; Harries and Knor, Reference Harries and Knorr2009; Borths and Ausich, Reference Borths and Ausich2011).
The Lilliput effect phenomenon, also called the “anti–Cope’s Rule,” characterizes the biotic response following a mass extinction event (Harries and Knor, Reference Harries and Knorr2009). Four patterns are then considered (Borths and Ausich, Reference Borths and Ausich2011). The first concerns the immediate mass extinction of large taxa. In this case, relatively smaller species become dominant during the survival and at least the early recovery interval postextinction; fauna is not actually ‘dwarfed’ or ‘miniaturized.’ Twitchett (Reference Twitchett2006) referred to this kind of species sorting as the ‘extinction of large taxa’ mode. The second pattern is characterized by a decrease in body size during biotic crises and subsequent recovery (Urbanek, Reference Urbanek1993). This pattern reflects the selection of smaller-size specimens within the range of individual variability, during and through the mass extinction, repopulation, and recovery intervals (Urbanek, Reference Urbanek1993; Twitchett, Reference Twitchett2007; Harries and Knorr, Reference Harries and Knorr2009; Wade and Twitchett, Reference Wade and Twitchett2009; Borths and Ausich, Reference Borths and Ausich2011). Harries and Knorr (Reference Harries and Knorr2009) considered this pattern as ‘dwarfing’ while Twitchett (Reference Twitchett2006) called it a ‘within-lineage size decrease.’
The third pattern, the so-called miniaturization in contrast to dwarfing, refers not only to size reduction but also to accompanying significant morphologic modification that results in taxa that dramatically depart from their ancestors. The origination of taxa with relatively smaller-sized species represents an evolutionary response to mass extinction events (Harries and Knorr, Reference Harries and Knorr2009; Wade and Twitchett, Reference Wade and Twitchett2009; Borths and Ausich, Reference Borths and Ausich2011). The fourth pattern of decrease in average body size after an extinction comes from large taxa with postextinction Lazarus gaps (Twitchett, Reference Twitchett2006; Borths and Ausich, Reference Borths and Ausich2011). The time interval of Lilliputian body size apparently lasts a few 100,000 years (Urbanek, Reference Urbanek1993; Morten and Twitchett, Reference Morten and Twitchett2009) and is followed by a size increase during the recovery stage (Harries and Knorr, Reference Harries and Knorr2009). Some authors have pointed out, however, that such changes could have resulted from the state of preservation and from size sorting during transportation (Brayard et al., Reference Brayard, Nützel, Stephen, Bylund, Jenks and Bucher2010; see also Fraiser et al., Reference Fraiser, Twitchett, Frederickson, Metcalfe and Bottjer2011).
There are few described examples of the Lilliput effect in echinoderms. For example, this phenomenon was recognized in Ordovician–Silurian crinoids (Borths and Ausich, Reference Borths and Ausich2011) and in early Danian echinoids (Jeffery, Reference Jeffery2001), although the latter author did not use the term Lilliput effect. It is also noteworthy that nearly all known echinoderms in the aftermath of the end-Permian extinction were small-sized animals (Twitchett and Oji, Reference Twitchett and Oji2005).
The present findings indicate that Turonian stalkless crinoids underwent dwarfing probably as a result of anoxic environmental events (OAE2) initiated around the Cenomanian/Turonian boundary and continuing up to the middle Turonian. After the environment returned to regular conditions, they grew back to their pre-event size.
Geological setting and materials and methods
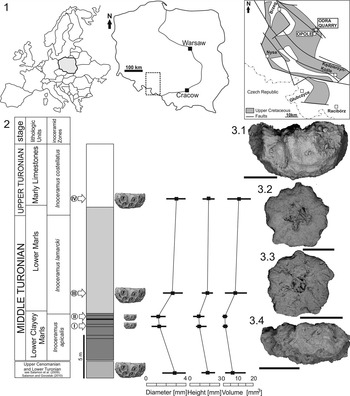
The Odra quarry is located in the northern part of the city of Opole, southwest Poland (Fig. 1.1). The Cretaceous sediments are represented by the so-called Opole Cretaceous, mainly marly limestones, mudstones, and marls. These sediments cover the Devonian, Carboniferous, Permian, and Triassic basement. The sedimentary complex builds a monocline structure cut by a few WSW-ESE faults (Kotański and Radwański, Reference Kotański and Radwański1977).
(1) The investigated section on the background of Europe and Poland, taken from Kędzierski and Uchman (Reference Kędzierski and Uchman2001), slightly modified. (2) Simplified stratigraphic section of Turonian in southern Poland and the graph showing the trends in body size, the section taken from Kędzierski and Uchamn (Reference Kędzierski and Uchman2001), slightly modified; arrows = places of sampling. (3.1) Lateral view of centrodorsal of Glenotremites paradoxus, the Odra Quarry, Turonian. Marly Limestones, GIUS 8-5670/145, scale bar is 1 mm. (3.2) Upper view of centrodorsal of Glenotremites paradoxus, the Odra Quarry, Turonian, Lower Marls, GIUS 8-5670/59, scale bar is 1 mm. (3.3) Upper view of centrodorsal of Glenotremites paradoxus, the Odra Quarry, Turonian, Lower Clayey Marls, GIUS 8-5670/5, scale bar is 1 mm. (3.4) Lateral view of centrodorsal of Glenotremites paradoxus, the Odra Quarry, Turonian, Lower Clayey Marls, GIUS 8-5670/2, scale bar is 1 mm.

The Cretaceous age was confirmed on the basis of inoceramids by Walaszczyk (Reference Walaszczyk1988, Reference Walaszczyk1992) as middle to late Turonian: Inoceramus apicalis Zone–I. costellatus Zone (Fig. 1.1).
The Turonian sediments are up to 25 m thick. Previously, the whole stratigraphic section was divided into three parts (Alexandrowicz and Radwan, Reference Alexandrowicz and Radwan1973): (1) the Lower Clayey Marls (sometimes called argillaceous marls; see Niedźwiedzki and Kalina, Reference Niedźwiedzki and Kalina2003), (2) the Lower Marls, and (3) the Marly Limestones units. In the lowermost and middle parts, marls, mudstones, and claystones dominate. In the gray Lower Clayey Marls, ~2–5 mm-thick black laminae devoid of any bioturbation occur (Kędzierski and Uchman, Reference Kędzierski and Uchman2001). Our investigation documented the presence of six other similar laminae in the Lower Clayey Marls unit, the thickest one being 9 mm. The upper part of the profile is dominated by marly limestones. Kędzierski and Uchman (Reference Kędzierski and Uchman2001) discovered a calcium carbonate content increase toward the upper part of the profile, underlined by the light shade of the sediments. These latter are fossiliferous: inoceramids, echinoids, sponges, and vertebrate teeth (mainly sharks). Trace fossils are also a characteristic feature of the investigated section. Thin sections documented abundant foraminifera. Fossil wood remains and ammonites are rare but can reach noticeable size, and crinoids (stalkless and stalked) are also rare.
For the purpose of this study, four bulk samples of ca. 35 kg were collected respectively from the Lower Clayey Marls (two samples), the Lower Marls, and the Marly Limestones (Fig. 1.2). The samples were processed in the laboratory of the Department of Paleontology and Stratigraphy at the University of Silesia, Katowice (Poland). The washing residues were sieved through 1.0, 0.5, and 0.1 mm mesh sizes and finally dried at 20°C. Invertebrate remains were picked out under a binocular microscope (SM 800T); meanwhile, the stalkless crinoids were selected for taxonomic assignment and measurement. Only adequately complete specimens were measured (maximum height and diameter of centrodorsals). The volume of centrodorsals was estimated according to the procedure of Borths and Ausich (Reference Borths and Ausich2011). For comparison purposes, biometric data were obtained from a large collection of centrodorsals of early Turonian Glenotremites paradoxus Goldfuss from southern Poland (Glanów locality; Salamon, Reference Salamon2007; Salamon et al., Reference Salamon, Gorzelak, Borszcz, Gajerski and Kaźmierczak2009, Reference Salamon, Lach and Gorzelak2010).
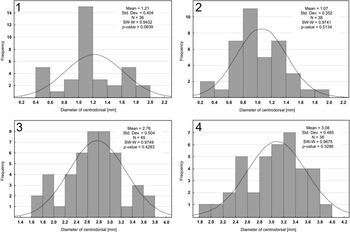
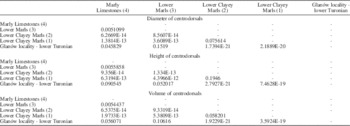
To determinate statistically significant differences in diameter, height, and volume of crinoid centrodorsals from the Lower Clayey Marls, Lower Marls, Marly Limestones, and Glanów locality, the Mann-Whitney U test was adopted. To test whether a given sample had been taken from a population with normal distribution, Shapiro-Wilk tests were applied (Fig. 2). These tests were performed using the PAST 3.0 software (Paleontological Statistics, ver. 3.0; Hammer et al., Reference Hammer, Ryan and Harper2001) (Table 1).
Histograms showing frequency distribution of centrodorsal diameter of Glenotremites paradoxus with basic statistics indicated. (1) Specimens form sample no. 1 (Lower Clayey Marls). (2) Specimens form sample no. 2 (Lower Clayey Marls). (3) Specimens form sample no. 3 (Lower Marls). (4) Specimens form sample no. 4 (Marly Limestones). SW-W=Shapiro-Wilk test statistic, N=number of centrodorsals.

P-values obtained from Mann-Whiney U test. Numbers in parentheses refer to the number of sample indicated on the geological section (compare Fig. 1).

In addition, the volume of crinoid centrodorsals from these formations was estimated. Because of their cup shape, we assumed that the closest corresponding shape is a half oblate spheroid. By using their height and diameter, the approximate volume of a centrodorsal was estimated by the following formula:
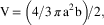 $${\rm V}\,{\rm {\equals}}\,\left( {{\rm 4/3 \,\pi\, a}^{{\rm 2}} {\rm b}} \right)\!/2,$$
wherein a corresponds to half the measured diameter (radius), and b is the height. These data were also adopted for the previously mentioned statistical tests.
Results
One hundred fifty-seven stalkless crinoids (Glenotremites paradoxus) from the Odra quarry are represented by centrodorsals with diameter and height ranging, respectively, from 0.4 to 3.9 mm and from 0.2 to 2.5 mm. All samples have similar morphology of centrodorsals. In particular, the number and arrangement of cirral scars are comparable. The centrodorsals are discoidal with a distinct radial dorsal star. The interradial furrows run between the rays of the radial dorsal star. The dorsal side is cirrus-free and flattened. The cirrus sockets possess relatively large radial canals. Seventy-four specimens from the lower part of the section (Lower Clayey Marls) are smaller (from 0.4 to 2.0 mm in diameter and from 0.2 to 1.5 mm high). Individuals from the upper part of the profile (45 and 38 centrodrosals from the Lower Marls and Marly Limestones, respectively) are larger (from 1.7 to 3.9 mm in diameter and from 1.1 to 2.5 mm high) and are similar to those retrieved from the lower Turonian samples from the Glanów locality (from 1.7 to 3.9 mm in diameter and from 1.1 to 2.6 mm high; Table 2).
Measurements of centrodorsals from the five investigated samples. Numbers in parentheses refer to the number of sample indicated on geological section (compare Fig. 1); min=minimum, med=median, max=maximum.

Heights, diameters, and volumes of centrodorsals (Supplemental Data 1) from the Lower Clayey Marls to the Lower Marls, Marly Limestones of the Odra Quarry, and from the Glanów locality are significantly different from one another. By contrast, the diameters and volumes of crinoid centrodorsals from the Lower Marls and Marly Limestones have no statistically significant difference (Mann-Whitney U test; Table 1). Results of the Shapiro-Wilk tests (Fig. 2) indicate that we cannot reject the null hypothesis of a normal distribution. In other words, the samples have been taken from normally distributed populations.
Discussion
During the mid-Cretaceous interval, greenhouse effects likely induced global oceanic anoxic events (OAEs) (Schlanger and Jenkyns, Reference Schlanger and Jenkyns1976; Clarke and Jenkyns, Reference Clarke and Jenkyns1999; Frakes, Reference Frakes1999; Takahashi, Reference Takahashi2005). According to Schlanger and Jenkyns (1976), the second factor that initiated the OAE would be the marine transgression that had been triggering primary production. Close to the Cenomanian–Turonian boundary, during the mass extinction caused by the OAE2 event, about 26% of marine organisms at the genus level and 33%–53% at the species level disappeared (Sepkoski, Reference Sepkoski1996). The late Cenomanian extinction is commonly assigned to oxygen depletion in the marine environments. Therefore, the OAE2 had a major impact on the contemporary taxonomic diversity of the marine fauna (Schlanger and Jenkyns, Reference Schlanger and Jenkyns1976 and references therein; Kaiho and Hasegawa, Reference Kaiho and Hasegawa1994; Takahashi, Reference Takahashi2005). According to Kaiho and Hasegawa (Reference Kaiho and Hasegawa1994), Erbacher et al. (Reference Erbacher, Thurow and Littke1996), and Leckie et al. (Reference Leckie, Bralower and Cashman2002), the OAE2 occurred around the Cenomanian-Turonian boundary; however, because it was a long-term event, the anoxic and hypoxic effects continued into the lower-middle Turonian sediments (e.g., Schlanger and Jenkyns, Reference Schlanger and Jenkyns1976). It has been argued that during the OAE 2, anoxia had no worldwide effect on relatively shallow marine habitats. Instead, starvation was suggested because sea-level rise introduced relatively oligotrophic environments (Gale et al., Reference Gale, Smith, Monks, Young, Howard, Wray and Huggett2000).
According to the classification of Sageman et al. (Reference Sageman, Kauffman, Harries and Elder1997), the Cenomanian–Turonian Boundary Event (CTBE) can be defined as a diversity reduction bioevent characterized by sudden variations of biomass diversity in response to unexpected environmental stress induced by climate change, oceanographic, sedimentological, tectonic, or ecological factors. In the Odra quarry, in the lower part of the investigated profile (Lower Clayey Marls), Chondrites and Trichichnus ichnofabric occurrence was documented. Their presence indicates stressed oxygen-depleted environments (Bromley and Ekdale, Reference Bromley and Ekdale1984; Kędzierski and Uchman, Reference Kędzierski and Uchman2001). Kędzierski and Uchman considered that low-oxygen events in the Opole area were temporary. These are recorded as dark laminated marls in the lower part of the profile; thickness of dark lamina does not exceed 8 mm. They also fingerprinted burrowing structures impregnated by pyrite. According to Kędzierski and Uchman (Reference Kędzierski and Uchman2001), the occurrence of Chondrites ichnofabrics in the studied profile is connected with the OAE2. In the upper part (the Lower Marls unit and the Marly Limestone unit as well), Kędzierski and Uchman (Reference Kędzierski and Uchman2001) recognized Thalassinoides ichnofabrics, indicating an oxygenated/oxygen-rich environment (as opposed to Chondrites ichnofabrics). Their observation is consistent with our current field observations. In oxygen-depleted environments underlain by Chondrites ichnofabrics (lower part of the profile), small-sized crinoids occur. The higher part of the profile with Thalassinoides contains three times larger specimens. Noteworthy, in the same part, no black lamina occurs. Moreover, Salamon et al. (Reference Salamon, Gorzelak, Borszcz, Gajerski and Kaźmierczak2009) and Salamon and Gorzelak (Reference Salamon and Gorzelak2010) described stalkless Glenotremites paradoxus (over 100 specimens) from several locations of Turonian age in Poland (the Miechów-Wolbrom area; the Vistula River valley). In all these sites within well-oxygenated sediments, the size of centrodorsals is relatively large; i.e., the diameter ranges from 2 to 8 mm (for example, the mean diameter of centrodorsals from the Vistula River valley is 3.99 mm; Salamon and Gorzelak, Reference Salamon and Gorzelak2010, p. 10). Likewise, Rasmussen (Reference Rasmussen1961) specified that the diameter of centrodorsals of this species in Europe commonly exceeds a few millimeters and may reach ~13.5 mm.
Peryt and Wyrwicka (Reference Peryt and Wyrwicka1991) demonstrated that, during the OAE2, southern Poland had been home for new foraminiferal species resistant to anoxic environment (see also Jarvis et al., Reference Jarvis, Carson, Cooper, Hart, Leary, Tocher, Horne and Rosenfeld1988). Walaszczyk et al. (Reference Walaszczyk, Wood, Lees, Peryt, Voigt and Wiese2010) also documented that, during OAE2 and OAE3, inoceramids from central Poland displayed modified shell morphology.
Consequences
On a long-term basis, oxygen depletion of the environment leads living organisms to adopt different mechanisms of survival. In the case of crinoids, the volume of the calyx is directly correlated with the volume of viscera. The calyx size can also be correlated with the volume of gonads and secondarily reflect fecundity. Crinoids displaying relatively smaller size probably accelerated the onset of sexual maturity, thus reaching reproductive age earlier at a smaller body size in case of declining ecological conditions (adaptation to a less-stable environment). In addition, small body size means a reduced demand for calories, and the organism requires smaller amounts of food to reach sexual maturity and reproduce (Borths and Ausich, Reference Borths and Ausich2011). Such an element is now confirmed. Moreover, we suggest that major causes driving the presently documented crinoidal size reduction are probably changes in oxygenation level related to anoxic/hypoxic episodes, although a number of other potential causes (including taphonomic winnowing, change in reproductive strategy, or reduced food sources) cannot be excluded. Nevertheless, it is noteworthy that current flow or winnowing effects commonly generate uni- or polymodal and highly asymmetric distribution of size frequencies that are not observed in our data (Fig. 2).
Hotinski et al. (Reference Hotinski, Bice, Kump, Najjar and Arthur2001) suggested that low oxygen levels in marine environments were probably the result of global warming and its subsequent sluggishness in oceanic circulation, which induces a biological imbalance by decreasing the amount of dissolved oxygen within oceanic waters. A glut of data demonstrated the positive correlation between oxygen concentration and body size—for example, the size of infauna (Rhoads and Morse, Reference Rhoads and Morse1971; Savrda et al., Reference Savrda, Bottjer and Gorsline1984). Likewise, Levin et al. (Reference Levin, Ekau, Gooday, Jorissen, Middelburg, Naqvi, Neira, Rabalais and Zhang2009) showed that large benthic taxa are generally more sensitive than small taxa to hypoxia. It is not surprising that the body size is commonly reduced under such conditions (Quiroga et al., Reference Quiroga, Quinones, Palma, Sellanes, Gallardo, Gerdes and Rowe2005). Berner (Reference Berner2005) also suggested that the Lilliput effect most likely resulted from anoxia.
Crinoids collected in the Turonian of Poland are probably documenting this Lilliput effect (dwarfing). This is interpreted as an adaptation to unfavorable environmental conditions (likely oxygen depletion) to accelerate the sexual maturity of these echinoderms. In addition, small-sized crinoids would require less food thus reducing the metabolic costs of body development and functioning during the crisis. The return to favorable environmental conditions triggered the return of the crinoid body to pre-event size—i.e. about three times greater than during the biotic crisis.
Acknowledgments
We thank D. Peryt (Polish Academy of Sciences, Warsaw) and A. Takahashi (Research Institute for Science and Engineering, Waseda University) for granting access to literature and stimulating discussion. Special thanks are also due to two anonymous reviewers for their constructive comments. The project has been financed from the funds of the Leading National Research Centre (KNOW) received by the Centre for Polar Studies for the period 2014–2018. This work was also financially supported by the Department of Palaeontology and Stratigraphy at Faculty of Earth Sciences, University of Silesia, Katowice.
Accessibility of supplemental data
Supplemental data deposited in Dryad data package: http://datadryad.org/resource/doi:10.5061/dryad.s06br