

The Association of Religion Data Archives (ARDA) was founded to democratize access to data on religion without compromising the integrity of the information being archived.Footnote 1 Archiving over 500 data collections, the ARDA now hosts over 6,000 visitors each day and disseminates nearly 3,000 data files each month. The ARDA has become a hub of activity for those interested in the study of religion. Now including a growing international collection and an ever expanding selection of online reference, research, and teaching tools, the ARDA is a rich resource for researchers, teachers, and students interested in religion. Supported by the Lilly Endowment, the John Templeton Foundation, the Pennsylvania State University, and the Baylor Institute for Studies of Religion,Footnote 2 all of the resources are free of charge. Yet, the ongoing goal of the ARDA remains the same: to democratize access to data.
This research article briefly reviews the resources currently available at the ARDA. Although the ARDA is best known for its rich archive of American surveys on religion, we also highlight the growing international collection and the many online tools that may be of interest to those who are not experts in quantitative research methods. We highlight three areas. First, we sample the ever expanding data archive and the extensive online documentation. Second, we review the growing number of online research tools that have turned the ARDA into a virtual research center. Interactive maps, church membership reports, data analysis tools, and national and regional profiles allow users to review the data online and the question bank feature allows for quick construction of new surveys. The final area is our online reference and teaching tools. From denominational history, heritage, and trends of over 400 United States religious groups (Denominations) to an immediate review of statistics on a topic of interest (QuickStats) or rank order lists by geographic units (QuickLists), these tools unleash reference data for an online review. When combined with the ever expanding Learning Center, where over 1,000 instructional modules are downloaded each month, the ARDA provides services for students as well as researchers. We begin with the informational foundation of the ARDA: the data archive.
ABOUT THE ARCHIVE
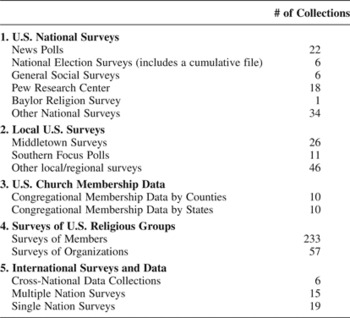
The data archive includes over 500 surveys, including the well-known American National Election Studies, the General Social Surveys, and a selection of surveys completed by the Pew Research Center. Although the ARDA has traditionally been rich in surveys on American religion, in 2005, the ARDA began archiving international datasets and now has six cross-national datasets and five multination surveys. Table 1 provides a summary of these data files.
Summary of the ARDA's Archive

The ARDA is especially rich in surveys of American religion. The survey samples vary widely, ranging from national samples to small samples of church leaders, specific denominations, and local areas. The topics of the datasets also vary. Although all datasets include religion measures, some focus on politics, others on civic engagement, and still others address health, gender roles, worship life, religious giving and a host of other topics. The American National Election Studies (including the 1948–2004 cumulative file), the General Social Survey, and the Pew Research Center surveys are perhaps best known to political scientists, but there are many others that will be of interest, such as the “State of the First Amendment Surveys.” Many of the local, regional, and denominational surveys are also filled with questions focused on political actions and attitudes.
For those interested in United States' ecological units, the ARDA holds 20 collections on church membership, 10 at the county level and 10 at the state level. One half of this collection (1952, 1971, 1980, 1990, and 2000) is composed of the church and church membership data initially collected by the National Council of Churches, the Glenmary Research Center, and more recently by the Association of Statisticians of American Religious Bodies. As we will review later, these data are also used for generating online maps and reports. The 1980, 1990, and 2000 data collections, in particular, can be reviewed online in detail for counties, states, metropolitan areas, and the United States as a whole. The remaining church membership files were taken from 19th and early 20th century United States Census collections.Footnote 3
Surveys on congregations and other religious organizations provide yet another source of rich data. The National Congregations Study, the United States Congregational Life Survey, and the American Congregational Giving Study are three of the collections surveying congregations from multiple denominations. The National Congregations Study and American Congregational Giving Study each provide measures on the groups and activities within congregations and the United States Congregational Life Project surveys congregations as well as their members, allowing for multi-level analysis. Both the National Congregations Study and the United States Congregational Life Survey used hyper-network sampling techniques to draw nationally representative samples of United States congregations.
Finally, the international collection is rapidly growing and the cross-national files have proven especially popular. These files include adherent information from the World Christian Database, scales from Freedom House, the Heritage Foundation and others, and a host of measures from the United Nations Human Development Reports (HDR) and the Central Intelligence Agency (CIA) World Factbook. Many of the religion and church-state measures, however, are taken from the ARDA's coding of the 2003 US State Department's International Religious Freedom Reports, including many measures of religious freedom and government regulation (see Grim and Finke Reference Grim and Finke2006).Footnote 4 Additional data on religious regulation and favoritism in the smaller countries not covered by the State Department Reports were provided by researchers at the World Christian Database. Using information from the official yearbooks and handbooks of many religious groups around the globe, the ARDA is currently assembling international data on specific religious groups. When the cross-national data files are combined with multi-nation and within country surveys, such as the Project Canada Panel Study and the Taiwan Social Change Surveys, the ARDA is rapidly increasing access to international information on religion.
Before any of the files are placed in the archive, however, they undergo extensive processing and verification. When submitting data to the ARDA, principal investigators are asked to submit a copy of the complete survey instrument, frequencies for each variable in the file, and a detailed list of information about collection procedures. At least two ARDA staff members review the final copy of each file before uploading it, verifying the accuracy of the data, the survey instrument (or variable descriptions), and the information describing the data collection procedures. For every data file disseminated, the ARDA provides detailed online descriptions of each study's research design and sampling procedures, citations (often links) to publications on the data set, and other information on how the data were collected or weighted. As a result of these procedures and our public accountability, the ARDA has become a trusted and authoritative data source.
ONLINE RESEARCH TOOLS
For hundreds of data collections on religion, the ARDA allows researchers to download both the data and appropriate documentation free of charge. But the ARDA also provides online services that allow researchers to preview archived data, as well as design and construct new questionnaires. Researchers who do not want to download entire datasets will find the online analysis tools useful for quickly obtaining univariate statistics, pie charts, cross-tabs, reports, and maps. Each of these features contributes to a virtual research center for people interested in the study of religion.
Online Analysis Tools
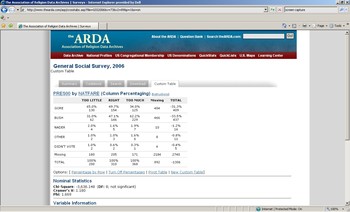
When website users find a question of interest, they have several online analysis options. For questions with seven categories or less, the ARDA provides frequencies, and a bar chart, cumulative bar chart, and pie chart. People can also view cross-tabs between their question of interest and some basic demographic variables (e.g., race, gender, income), or they can create their own custom table by selecting column and row variables. For example, the General Social Survey 2006 asks whether government spending on welfare is too little or too much. As shown in Figure 1, 65% of the respondents who said it was too little voted for Gore, while only 31% voted for Bush.
(Color online) Online Analysis on the ARDA.com.

Using the Question Bank for Survey Construction
The ARDA can also be used to design new research. Because the archive stores both the data and the complete wording of past survey questions, the ARDA offers a wealth of questions for survey building.Footnote 5 When used in conjunction with the Search engine or the online codebooks, survey questions can quickly be identified and stored. The saved questions can be viewed at any time by clicking the “View Question Bank” button and they can all be saved to a text file for future surveys and additional editing accessible whenever they visit the ARDA. Initially designed for researchers, this Question Bank has been used extensively for student projects and class surveys.
Congregational Membership Reports
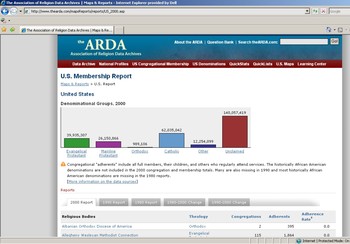
Along with making church membership data available for download, the ARDA also generates online reports on religious congregations and their membership for every county, metro area, state, and the United States as a whole. Using the 2000 Religious Congregations and Membership Survey (RCMS) collected by the Association of Statisticians of American Religious Bodies (ASARB), as well as earlier Church and Church Membership Surveys, the reports offer a detailed religious profile of the area selected.Footnote 6 Included in the profiles are the number of adherents and congregations in each of 149 different religious bodies included in the 2000 collection. In addition, the same data are reported for 1980 and 1990, an adherence rate is computed for each group, and the rate of change over time is also calculated. A bar chart groups the religious bodies into six different religious traditions — Evangelical Protestant, Mainline Protestant, Orthodox, Catholic, Other, and Unclaimed (see Fig. 2).
(Color online) ARDA's Church Membership Report.

Like most ARDA tools, this report is interactive and offers links to more information. For example, the religious groups are initially listed alphabetically, but with a single click, the groups can be reordered based on size, rate of growth, or religious tradition. Or, if more information is needed on a single religious group, users can click on the group's name to obtain information on its history and heritage. Once again, information is provided on the data sources and the procedures used for grouping the religious bodies into the six religious traditions.
Membership and Demographic Geographic Information Systems (GIS) Mapping
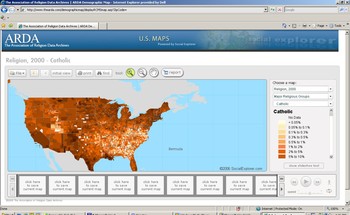
The ARDA has recently partnered with Social Explorer to present demographic and religious data using GIS mapping. This mapping tool allows for interactive mapping of demographic data by U.S. Census tracts and religious adherence data by counties. Users can choose to map all counties of the United States (the default) or can enter a zip code to zoom-in on a specific area. Figure 3, for example, maps Catholic adherents in the United States, showing that there are many fewer Catholics residing in the Southeast, as compared to the Northeast, and other parts of the country. All of the GIS maps allow for zooming, moving, and searching across locations. As with the reports, the religious mapping relies on RCMS data for 2000, 1990, and 1980, and the data are presented for individual religious bodies, major religious traditions, and all adherents.
(Color online) GIS Maps on the ARDA.com.

Once an area and topic of interest are located, the mapping tools offer two options for generating customized reports. With the RCMS data, users can select the counties they want to include in a report and will receive a spreadsheet that includes adherents and congregational totals for each county (up to 10), totals for all selected counties, and totals for the state and nation if requested. Rather than selecting specific counties, users can also produce a report by drawing a circle around an area of interest on the map. The demographic maps use the same report tools, but present information at the census tract level, rather than the county level.
The ARDA also offers the option of using static maps for presenting RCMS and demographic data. Despite being less interactive and flexible, they offer a couple advantages when mapping specific states or the nation as a whole. First, a wider range of variables are available, including measures on voting, crime, and other social measures. Plus, a second map can be displayed on the same screen. For example, users can generate a national map for the proportion of Evangelical in each state, and a national map for the proportion of abortions per 1,000 women (age 15 to 44 years old) in each state. A correlation of −0.358 between the states is provided and an asterisk indicates that the relationship is significant at the p < 0.05 level. Like the national and state mapping options, the ARDA is currently exploring options for mapping cross-national data. Even without the mapping, however, we developed multiple methods for reviewing cross-national data online.
Profiling and Comparing Nations
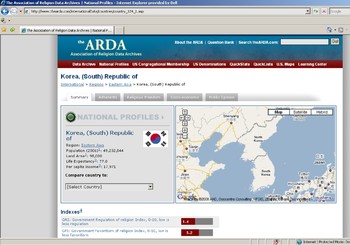
The ARDA's National Profiles offer multiple measures of religious adherents, religious freedom, demographics, and other socio-economic indicators for almost every nation and region in the world. Drawing on the ARDA's large cross-national data file mentioned earlier, the National Profiles bring disparate sources of data together in a single location. Data and descriptions from the World Factbook and the United Nations provide a political, economic, and social profile of each nation (see Fig. 4). The World Christian Database offers an overview of religious affiliation in the nation and Google maps allow for an interactive exploration of the geographical context.
(Color online) National Profiles on the ARDA.com.

Relying on the International Religious Freedom Reports, the ARDA also provides detailed information on the relationship between church and staff. Using a detailed coding of the Reports, the ARDA staff has constructed indexes on “Government Regulation,” “Government Favoritism,” and the “Social Regulation” of religion” (Grim and Finke Reference Grim and Finke2006). Others measures that were coded from the reports include constitutional guarantees of religious freedom and the extent to which a nation protects these freedoms.
The Profiles also provide public opinion measures for people within nations. A new “Public Opinion” section aggregates survey data from the World Values Surveys to offer nearly 50 religion-related measures. All available years of the data are provided for each country in the survey. For example, using the Public Opinion tab, a user can find that belief in Heaven increased in Mexico from 70% to 88.1% for the population between 1990 and 2000.
Further, we have added the ability to directly compare nations and regions on any of the available measures. Up to eight nations can be compared with a single profile. Despite being designed for research, each of the tools mentioned above are also used for teaching. Below we review additional teaching tools, which may also interest researchers.
ONLINE REFERENCE AND TEACHING TOOLS
The ARDA has recently developed a series of features that can be used for classroom instruction or as online tools for anyone interested in religion.
Deciphering the American Religious Mosaic
For students and scholars new to the American religious mosaic, sorting out the history and heritage of American religious movements is seemingly impossible. Even for those trained in the area, the religious mosaic is overwhelming. The ARDA's online “Denominations” feature offers information and tools that help to sort out the parentage and trends for over 400 denominations.
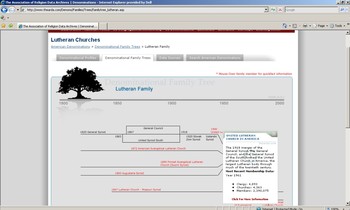
Within the Denominations feature, the “Family Trees” and “Denominational Profiles” help to sort out the relationships between the various groups (see Fig. 5). Using visual graphics, these tools illustrate the groups merging, splitting, or changing names along the way, and short historical descriptions explain how each group was founded. Relying on data from the Yearbook of American and Canadian Churches and Religious Congregations and Membership Survey, line graphs chart membership trends overtime and maps show how the group is distributed across the country. When available, the feature also provides links to surveys in the ARDA that have collected data on the group.
(Color online) A Denominational Family Tree.

Needless to say, assembling this resource has required a long list of resources and consultants. We began with the detailed work of J. Gordon Melton, Frank S. Mead, Samuel S. Hill, and others to trace the heritage of each group (See Mead and Hill Reference Mead and Hill2001; Melton Reference Melton2003). Our goal was to verify the heritage of denominations using two written sources. If the two sources were unavailable, or they were in conflict, we reviewed denominational websites and contacted their offices directly. Archivists, such as Joel Thoreson (Archivist for Reference Services at the Evangelical Lutheran Church in America) and Anne LeVeque (Research Specialist in Religion at the Congressional Research Service), have helped to untangle some of the more complex family relationships. We are also deeply indebted to J. Gordon Melton and the National Council of Churches for the assistance they offered. This cooperation resulted in more accurate and detailed longitudinal information. Finally, the open, public nature of these denominational profiles ensures that they are regularly inspected, which has further refined their accuracy.
QuickStats and QuickLists
QuickStats and QuickLists are designed to provide instant answers to some of the most frequently asked questions about religion. What percentage of Americans believes in god or how often do they pray or attend church? Which nations have the most Christians, Muslims, or Buddhists? These features help users obtain this information without having to search through data files.
There are over 50 different religious, political, and moral public opinion topics that can be accessed through the QuickStats feature by either browsing or searching for key words. After selecting an area of interest, users can pick from several related survey questions archived at the ARDA. For example, under the topic homosexuality, users can select public opinion questions about homosexual adoption, homosexuals in the military, same-sex marriage, job discrimination against homosexuals, and so forth.
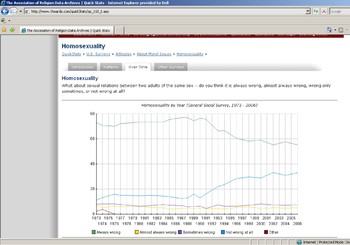
After selecting a question, users are presented with several online analysis tools that they can use to dissect the question. There is an interactive pie chart with a break-down of the proportion and frequency in each question category, and cross-tabs between their question of interest and basic demographic characteristics (e.g., race, age, and gender) of respondents. If a question has been asked in multiple years, the ARDA provides a line-chart that illustrates how responses vary over time. Using the General Social Survey, the chart in Figure 6 shows that 77% of Americans thought that homosexuality was always wrong in 1987 compared to 55% in 2006.
(Color online) QuickStats on the ARDA.com.

Finally, if another survey has asked a similar question to the one being analyzed, the ARDA presents the alternative question, corresponding univariate statistics, and a link to the dataset from which the similar question has come. By providing alternative questions, researchers can quickly assess how changes in the question wording, and when the survey was conducted, influence responses. All of the QuickStats questions include a description of the survey from which the question is taken and a link to that dataset in the ARDA's archive.
QuickLists is also designed to provide immediate answers and as the name suggests, it offers lists: a list of the counties with the most Catholics or the highest percentage of Catholics or a list of nations ranked on political rights or religious regulation. Like QuickStats, the data for QuickLists are taken directly from the ARDA's data files, allowing users to access more information on the data source or to download the data for additional analysis.
Learning Center
From its many educational features, the ARDA has created a Learning Center, which includes our popular learning modules. Written to help instructors actively engage their students in religion research, the learning modules consist of a series of questions and directives that help students to explore research questions using analysis tools and data from the ARDA. The module's pedagogical objectives vary from general overviews (e.g., The Religious Landscape in the United States) to more specific topics (e.g., Religion and Politics), but all were designed for introductory social science courses. The modules can be downloaded in either a PDF or Word format, and over 1,000 are downloaded each month. If questions arise about religious or statistical terms used in a survey or module, the Center provides a Dictionary of Religious and Statistical Terms, which also links to other areas of the site that might provide more information.
But the Learning Center offers much more than the modules. A “Compare Yourself” feature allows students, or anyone, to take a survey and see how they compare to other people. The survey has several different questions, clustered into categories like moral views, worldview, beliefs, and experiences. After answering questions in a given category, students are presented with their answers and the responses of people with their same demographic characteristics (e.g., age, gender, etc.). A “Profile Your Home” feature allows students to enter their zip code and receive a religious profile of the county where they live. The profile includes a bar chart showing the proportion of people in each major Christian group (e.g., Evangelical Protestant, Catholic, etc.), estimates for specific religions and denominations (e.g., Assemblies of God), and the percent change in adherents for specific religions and denominations. Finally, if students want to further explore the ARDA, they can easily link to any feature on the ARDA from the Learning Center.
CONCLUSION
The ARDA has long been the most complete archive on American religion and it is now rapidly expanding to the international arena. Over the next few years, the ARDA will continue adding to this growing archive with both survey and cross-national data assembled from a wide range of sources. Moreover, the online features and tools for using the data will continue to grow. The National Profiles will soon be supplemented with cross-national mapping, allowing for the presentation of more information, and global comparisons on a single screen. The QuickStats feature will also expand to include a focus on the international collection, allowing for data profiles with a single click. The virtual research and teaching centers will continue serving as a free public resource for scholars as well as the general public.
Like most public goods, the quality of the services depends on the resources of many. The Lilly Endowment, John Templeton Foundation, Pennsylvania State University, and Baylor Institute for Studies of Religion have generously funded the ARDA, but the ARDA relies on data and expertise from a diverse audience. If you have collected your own data, or know of data sources not in the ARDA, please contact us (feedback@thearda.com).Footnote 7 If you have developed a classroom exercise using ARDA data, submit it to our Learning Center. During the next three years, we plan to develop a “Research Hub” that will provide even more resources for scholars studying religion. We encourage your involvement.