


Introduction
In many elections, American voters are mostly focused on domestic issues when they participate in elections (Ansolabehere et al. Reference Ansolabehere, Meredith and Snowberg2014; Bisgaard et al. Reference Bisgaard, Sønderskov and Dinesen2016; Reeves and Gimpel Reference Reeves and Gimpel2012).Footnote 1 Besides party identification, things such as unemployment, inflation, healthcare, or racial/cultural concerns, have generally proven to be much more powerful drivers of American voting behavior (Aidt and Shvets Reference Aidt and Shvets2012; Ansolabehere et al. Reference Ansolabehere, Meredith and Snowberg2014; Buyuker et al. Reference Buyuker, D’Urso, Filindra and Kaplan2021; Collingwood et al. Reference Collingwood, Morín and Tzelgov2025; Egli et al. Reference Egli, Schmid and Schmidt2022; Glasgow Reference Glasgow2005; Jensen et al. Reference Jensen, Quinn and Weymouth2017; Tesler Reference Tesler2012) than the Ukraine War or the skirmishes along the frontiers of China. American voters often show limited interest in events beyond the border,Footnote 2 unless a foreign-originated issue has become a major national security concern, such as international terrorism during the post-9/11 era,Footnote 3 or a great foreign policy failure, such as the Vietnam War,Footnote 4 the Iran hostage crisis,Footnote 5 or the persistent conflict in post-invasion Iraq.Footnote 6
Additionally, in the federal system of the United States, the roles and powers of different levels of government vary significantly. Since the U.S. Constitution leaves a limited role of foreign policymaking for state and local governments, U.S. state and local elections are most likely focused on and driven by local issues or domestic partisan priorities (Hopkins Reference Hopkins2022).
However, some U.S. communities may nevertheless prioritize international issues or foreign-policy concerns—even in local elections. For example, the recent New York City mayor’s race featured a Muslim candidate, Zohran Mamdani, who expressed criticism of Israel’s war in Gaza thereby dividing many Jewish voters.Footnote 7 Another example might be the Muslim American swing toward Trump in 2024 on account of the Gaza issue. Trump, for instance, defeated Harris in the heavily MENA city of Dearborn, MI, 43%–37% in 2024,Footnote 8 after losing Dearborn in 2020 by 70% Biden—30%. Moreover, changes to immigration patterns in recent decades may challenge the general finding that local and state politics is primarily about local or domestic economic issues. Take, for example, an Asian American candidate running for office in Los Angeles County. Perhaps this candidate has close ties to China—either they were born there or their parents immigrated to California. Because there are many naturalized Chinese-American voters in the region—this candidate may take stances on Chinese politics as a way to appeal to these voters. And so voting behavior in high foreign-born Asian neighborhoods might be driven in part by voters’ stances on Chinese politics back home.
The consistent and massive transnational migration since 1965 has pushed the share of first-generation immigrants in the American population to a historical high (Moslimani and Passel Reference Moslimani and Passel2024; Passel and Rohal Reference Passel and Rohal2015). In addition, technological advancements over the past two to three decades—such as the Internet and smartphones—have enabled the new arrivals to maintain timely and sustainable communication with folks back home. Could the fast-growing immigrant communities across the country, equipped with effective communication tools, transform the image of local and state American politics and make it more international than ever before? More specifically, we ask whether local/domestic or international issues better explain voting behavior in high foreign-born jurisdictions? Here, we focus specifically on voters of East Asian background. We test this question in the context of a high foreign-born majority–minority Asian district in Brooklyn, New York, where seemingly both international and local domestic issues were front and center in the election.
During the 2022 redistricting cycle, New York created State Senate District 17 (SD-17) as Brooklyn’s first majority-Asian district. Nearly half of the newly drawn district’s population is foreign-born, and the biggest ethnic group of the district is Chinese. In this district, Democrats outnumbered Republicans 65,272 to 17,235 among active registered voters.Footnote 9 However, Iwen Chu, a Democrat born in Taiwan, won this district in 2022 by only 1.5 percentage points, showing that the district’s large share of unaffiliated voters and perhaps even some Democrats favored the Republican candidate, Vito LaBella.
Unfortunately for her, Senator Chu lost her next election in November 2024, to a Republican opponent, Steven Chan. The loss was not even close, but by a margin of 10 percentage points. Two exogenous events before the 2024 election likely contributed to Chu’s defeat. Certain news reports, including the New York Times podcast, The Daily, claimed this drastic change in Chu’s vote share could have international elements. For example, reporting by The Daily drew a connection between Chu’s attendance at a pro-Taiwan event in New Jersey and Chinese Hometown Associations’ political mobilization in her district. By ostensibly taking a pro-Taiwan position, Chu may have generated backlash from pro-China voters among her constituency, thereby contributing to her defeat. However, other media coverage points to a very domestic issue as the decider of this state senate seat—the strong local opposition in Senator Chu’s district to a homeless shelter proposed by the New York City government. While Chu’s opponent, Chan, took a strong and consistent stance against the shelter, Chu struggled to express a clear position on this issue throughout the campaign.Footnote 10
To evaluate which issue contributed more to Chu’s defeat and to test whether vote choice is driven more by international or domestic issues in this high foreign-born district, we gathered precinct (election district) election results and shape files from both 2022 and 2024 general elections. Using a change model to control for previous voting behavior and mitigate selection effects, we develop a measure of international influence—the presence/absence of a Chinese Hometown Association in an election district.Footnote 11 To measure local issues, we located the site of the proposed homeless shelter and then took the distance of that in miles from each precinct’s centroid. We find overwhelming evidence that the precincts within 1-mile of the homeless shelter shifted considerably away from Chu from 2022 to 2024, whereas precincts containing hometown associations saw no measurable change in voting behavior across the two elections. These findings suggest that—at least in this case—election outcomes in high foreign-born districts are driven more by local domestic issues as opposed to international concerns.
Finally, we conduct two large-n survey analyses with a particular focus on American voters with East Asian heritage. In both 2016 and 2020, we find that domestic economic issues are much more important to these voters than are international concerns, which is consistent with our precinct analysis.
Literature Review
In the context of the U.S. federal system, the elections for local government officials, including state legislators, are supposedly centered around local issues because subnational government institutions play the pivotal role in local affairs (Frug Reference Frug1984, Reference Frug2001; Gamm and Kousser Reference Gamm and Kousser2010). Subnational governments reserve a significant amount of policymaking authority (e.g., the Tenth Amendment of the U.S. Constitution), especially on issues closest to voters, such as community safety (US Department of Justice 2001) and housing affordability (McFarland et al. Reference McFarland, Funk, Kim, Lasorsa and Rivett2019). While congressional members focus on casework that enables individual constituents to obtain benefits from federal agencies (Johannes and McAdams Reference Johannes and McAdams1981; Johannes Reference Johannes1983; Serra and Moon Reference Serra and Moon1994; Yiannakis Reference Yiannakis1981), state legislators commit themselves to delivering localized, particular benefits to groups of voters concentrated in specific areas of their districts (Aidt and Shvets Reference Aidt and Shvets2012; Bagashka and Clark Reference Bagashka and Clark2016; Gamm and Kousser Reference Gamm and Kousser2010).
Nevertheless, research indicates that public knowledge about subnational government is insufficient (Bachner and Ginsberg Reference Bachner and Ginsberg2020). That is, voters do not necessarily grasp the exact power division between different levels of subnational government (e.g., state and municipal) and could make sub-national legislators’ reelection-seeking activities, such as advertising, position-taking, and credit-claiming (Mayhew Reference Mayhew1974), more complicated than their congressional peers. Therefore, underinformed voters need shortcuts to help them make electoral decisions, raising the importance of partisanship and ideology (Warshaw Reference Warshaw2019) and fueling political polarization. Consequently, even if subnational governments (and their legislators) are not responsible for international issues, constituents may still base their vote on international concerns.
In addition, there are signs that U.S. local elections are getting nationalized in recent election cycles, making the outcomes of local elections more related to the performance of the incumbent U.S. president and the national parties (Hopkins et al. Reference Hopkins, Schickler and Azizi2022; Melusky and Richman Reference Melusky and Richman2020; Rogers Reference Rogers2016). Factors such as ideological clarity, partisan polarization, and the growth of national media at the expense of local news propel voters across the country to apply similar criteria when choosing local office-holders (Hopkins Reference Hopkins2022). If election nationalization is the dominant trend, local controversies, such as the construction of a homeless shelter amid strong community opposition, should not significantly affect local election outcomes.
Not all researchers believe local politics stops being local. Collingwood et al. (Reference Collingwood, Martinez and Oskooii2023), for example, show that local political elites maintain a strong influence on local public decision-making and are capable of affecting as high as 50 percent of voters of a major party against the national trend on high-salience issues such as sanctuary cities. This personalized influence could be particularly robust among certain ethnic groups less affected by national partisan and ideological polarization. Hajnal and Lee (Reference Hajnal and Lee2011) suggest that Asians and Latinos do not have close party attachment in part due to their immigrant background: these communities have unique experiences and concerns but lack family-based partisan ties in American politics and effective engagement from either major party and find being an independent the most rational adaptive strategy. In the absence of family-based partisan socialization, voters of immigrant backgrounds tend to form their voting behavior through the contextual transmission of local partisan norms in their local environments: For example, the metropolitan environment where many immigrants started their lives in America helps shape their Democrat-leaning political preference (Kuo et al. Reference Kuo, Malhotra and Mo2017; Raychaudhuri Reference Raychaudhuri2020; Wong et al. Reference Wong, Ramakrishnan, Lee and Junn2011).
The divergence of personal and group experience generates significant heterogeneity of voter preference among Asian Americans of different national origins: Many Asian ethnic groups are Democratic-leaning in recent election cycles, especially Japanese and Indian American voters, but there are Republican-leaning groups such as Vietnamese Americans, and there has been a noticeable growth of self-identified independents and Republicans among Chinese Americans (Chan et al. Reference Chan, Nguy and Masuoka2024; Xiao and Bass Reference Xiao and Bass2021). At the same time, powerful factors such as social exclusion (Kuo et al. Reference Kuo, Malhotra and Mo2017) and racial discrimination (Chan et al. Reference Chan, Kim and Leung2022; Sadhwani Reference Sadhwani2025) contribute to the negative racialization of Asian American voters and drive them to vote for the Democratic party in self-protection (Le et al. Reference Le, Arora and Stout2020; Li and Nicholson Jr Reference Li and Nicholson2021), since the Democrats are often seen as the political camp of racial diversity and equality (Cheung-Miaw Reference Cheung-Miaw2022; Lam Reference Lam2015). National origin labels and co-ethnic cues play an important role in affecting Asian Americans’ turnout and vote choice, particularly among first-generation immigrants who feature stronger in-group solidarity, but partisanship remains the primary driver of Asian voting, and cross-party voting defection for co-ethnic candidates is rare (Cho et al. Reference Cho, Costa and Horiuchi2026; Leung Reference Leung2022; Sadhwani Reference Sadhwani2022a, Reference Sadhwani2022b; Yeung Reference Yeung2024; Yuan Reference Yuan2025). Therefore, Asian voters may be less likely to follow national partisan trends in their voting at the local level. These findings seem to really bear out in SD-17, where a massive Democratic registration advantage did not lend itself to a massive Democratic election victory. Local political elites’ actions—or lack thereof—on local high-salience matters may be more likely to impact the political behaviors of these voters.
In particular, and directly relevant to the context of our case, the effect of home country ties vs. local issues on the voting behavior of Asian and Chinese voters in American elections remains an under-researched topic. On the one hand, Saito (Reference Saito2023) finds that in the heavily dense Latino and Asian areas of San Gabriel Valley, CA, voters form a pan-ethnic identity when suburban residential issues become important to voting. Likewise, Lai (Reference Lai2011) shows how suburban residential issues characterize much of the Asian-American political experience. On the other hand, Lien (Reference Lien2006) finds that transnational political concerns can influence the degree of participation in regime-influence (e.g. making campaign contributions), and such impact is conditioned on U.S. foreign policy interests. Lien (Reference Lien2010) further argued that the pre-emigration experiences of East Asian immigrants from a politically divided homeland such as China, Taiwan, and Hong Kong may affect the extent of their participation in American politics. Therefore, these findings suggest that the political activation of hometown associations in backlash to Chu’s tacit Taiwan support is a reasonable expectation.
Further, Sadhwani (Reference Sadhwani2022b) finds evidence of political division among Asian American voters at the national origin level in California congressional and state assembly elections contested between Asian candidates. This suggests that Chinese-American immigrant voters with ties to the Mainland vs. Taiwan may vote differently in the 2024 contest between Chu and Chan. Given that our measure of hometown association is associated with mainland China, we should expect precincts with hometown associations to move away from Chu from 2022 to 2024. In line with Ramakrishnan (Reference Ramakrishnan2006) who notes that transnational ties further immigrant assimilation, Sadhwani (Reference Sadhwani2025) argues that the home country connectedness of Indian American voters (as indicated by the voters’ media consumption from the home country) will increase their desire for descriptive representation, and this pattern holds for both 2020 and 2024 elections. This likewise suggests a connection between hometown associations and voting behavior. Finally, Chan et al. (Reference Chan, Nguy and Masuoka2024) and Chan and Leung (Reference Chan and Leung2025) find that transnational events such as the COVID-19 pandemic can increase the turnout of Asian voters and prompt them to vote for Democrats.
The Case: Chinese American Politics in SD-17
On the evening of March 29, 2023, Senator Chu was invited to attend a banquet with various guests from the Taiwanese expatriate and other communities in New York City to welcome the visiting Taiwanese president, Tsai Ing-wen. During the dinner, President Tsai gave a 9-minute speech promoting Taiwan’s pandemic resilience and global importance, lauding the U.S.-Taiwan relations, and thanking the attendance of local dignitaries. President Tsai specifically mentioned the name of New York State Senator Chu, together with other American politicians such as New Jersey Governor Phil Murphy, Deputy Speaker Raj Mukherji of the New Jersey General Assembly, and New Jersey State Senator Gordon Johnson.Footnote 12 No other New York State or City officials appeared to have met with President Tsai during that visit.Footnote 13
President Tsai’s 2023 visit, on essentially a transit flight through America, sparked intense debate among Chinese communities throughout the NYC metropolitan area. The Taiwanese leader had long had a cool relationship with the Chinese government and often received criticism from pro-China commentators due to her and her party’s insistence on Taiwan’s sovereignty and national identity. This Chinese nationalist sentiment against the Taiwanese leader was not confined to the Chinese border but resonated within various Chinese diaspora communities. China’s economic success in recent decades has injected overseas Chinese communities with courage and excitement, and modern communication tools such as the Internet and smartphones have connected and amplified the voices from these previously isolated groups (Barabantseva Reference Barabantseva2010; Chan Reference Chan2018; Délano Alonso and Mylonas Reference Délano and Mylonas2019; Liu Reference Liu2006; Peterson Reference Peterson2013; Wong and Chee-Beng Reference Wong and Chee-Beng2018; Wong Reference Wong2021). These developments make the Chinese diaspora more engaged with international issues involving China and more sensitive to actions they see as harming the interests of the Chinese nation, such as the perceived separatism of Taiwan, which President Tsai was accused of promoting (Barabantseva Reference Barabantseva2010; Forsythe Reference Forsythe2025; Han Reference Han2021).
Over time, the Chinese government itself has also become more adept at transnational ethnic politics and is contacting and mobilizing overseas Chinese with increasing efficacy (Brady Reference Brady2017; Charon and Vilmer Reference Charon and Vilmer2021; DeLisle and Yang Reference DeLisle and Yang2022; Groot Reference Groot2004; Guotu Reference Guotu2013; To Reference To2014; Tsourapas Reference Tsourapas2021). A key strategy Beijing has employed in its diaspora outreach efforts involves the hometown associations based on shared birth or ancestral place of the Chinese immigrant groups. Often housed in some modest buildings within Chinese-majority neighborhoods filled with working-class newcomers, these groups serve various roles in the lives of Chinese immigrants, strengthening community bonds. These roles are sometimes symbolic, such as celebrating the Lunar New Year or the Moon Festival, but can also be pragmatic and personal, like assisting with childcare or funding funerals. They frequently host group activities throughout the year, such as banquets or Mahjong sessions, providing emotional support and a sense of connection for first-generation immigrants struggling with daily life. The locations of these associations—often near concentrated pockets of Chinese speakers—make them easily accessible spaces for working-class residents seeking help, joy, connection, and belonging.
Through these essential, everyday services, these hometown associations become central hubs for first-generation Chinese communities (Bofulin Reference Bofulin2022; Gamlen Reference Gamlen2019; Gamlen et al. Reference Gamlen, Cummings and Vaaler2019; Liu Reference Liu2006; Liu Reference Liu2022a; Peterson Reference Peterson2013; Vasantkumar Reference Vasantkumar2012; Wong and Chee-Beng Reference Wong and Chee-Beng2018). The Chinese government values these community-building effects and promotes the establishment and growth of hometown associations through official endorsement, information sharing, and business collaborations. By strategically leveraging their interests in the rapidly expanding Chinese market, the Chinese government can exert significant influence over the election and behavior of hometown association leaders, ensuring they echo Beijing on issues of importance to China (Bofulin Reference Bofulin2022; Chan Reference Chan2018; Forsythe Reference Forsythe2025; Shambaugh et al. Reference Shambaugh2013; To Reference To2014; Wang and Rosenau Reference Wang and Rosenau2009; Wong Reference Wong2021). Consequently, these associations often align with Chinese government positions, including on Taiwan, which can sway community opinions in China’s favor. The pro-China influence of these hometown associations is especially potent when they subtly incorporate Chinese government propaganda into their community activities. For example, during celebrations such as Lunar New Year or Moon Festival, specific programs or slogans—such as calling for “the unification of the motherland,” which signals the goal of integrating Taiwan into mainland China – are sometimes included. Presented in traditional Chinese dialects when appropriate, this subtle propaganda can influence the political attitudes of Chinese immigrants in America, especially as they become naturalized citizens (Chan and Alden Reference Chan and Alden2023; Chester and Wong Reference Chester and Wong2025; Liu Reference Liu2022b; Wong Reference Wong2022; Xiaojun and La Reference Xiaojun and La2023).Footnote 14 Notably, Chinese hometown associations have been reported to play a crucial role in the political downfall of figures like former New York State senator Iwen Chu, whose presence during President Tsai’s visit was viewed by Chinese authorities and the diaspora as opposing China (Forsythe Reference Forsythe2025).
In contrast to the delicate transnational ethnic identity politics regarding Taiwan, another incident that happened in SD-17 during Senator Chu’s first and only term could be as impactful to her reelection outcome. In November 2023, the Department of Social Services (DSS) of New York City notified residents of Bensonhurst, Brooklyn, that a 32-room homeless shelter would be built at 2501 86th Street to host 150 single males potentially with mental health issues, and it planned to open the shelter for service within 2024.Footnote 15 The DSS of NYC believed the project was a fair share of such facilities for the community district since there was no homeless shelter in Bensonhurst, but residents of this heavily Chinese working-class community strongly disagreed.Footnote 16 The proposal triggered consistent protests near the proposed construction site,Footnote 17 together with a petition online that soon obtained 33,000 signatures.Footnote 18 Local opponents to the project cited community safety and property values as their main concerns—a pattern consistent with the broader NIMBY (Not In My Back Yard) dynamics documented in American housing politics (Einstein et al. Reference Einstein, Glick and Palmer2019; Hankinson Reference Hankinson2018).Footnote 19 Most criticism about the project blamed the NYC government and Mayor Adams, since other layers of government, including the New York state legislature barely got involved.
The dispute over the homeless shelter became so vicious that on July 18, 2024, New York City Councilwoman, Susan Zhuang, bit the arm of a police officer during a protest around the proposed construction site and got arrested as a result.Footnote 20 Supporters of the Councilwoman, however, cheered her as a heroic defender of a community under threat.Footnote 21 Other local politicians also received public attention after weighing in on this dispute. Steve Chan, the Republican contender for Iwen Chu’s state senate seat in SD-17, was one of them. A former U.S. Marine and a retired New York City police officer, Mr. Chan had made community safety the central message of his campaign,Footnote 22 and joined protests and voiced his opposition to the proposed homeless shelter from the beginning of the dispute.Footnote 23 Although the disputed project was proposed by New York City, not New York State, Mr. Chan managed to make this dispute and his opposition to this project the key part of his state senate campaign. The local dispute about the homeless center continues in late March of 2026, and Mr. Chan remains leading the protest against the project.Footnote 24
Compared to them, then-incumbent state senator, Iwen Chu, was an interesting outlier. She kept a low profile on the dispute for most of the 2024 election season and was not seen in the local protests. Instead of taking a clear “Yes-or-No” position on the homeless shelter in the earlier stage of her re-election campaign, Senator Chu launched a petition to Mayor Adams,Footnote 25 noting her “opposition to the process surrounding the proposed 86th Street Shelter” and concern about “the lack of transparency from the City,” and calling the Mayor to “meet with the community.”Footnote 26 According to our interview with one of her former campaign staff members, Senator Chu only expressed a clear opposition to the homeless shelter project three weeks before the 2024 election day. While one single state senator probably had limited influence on the policymaking of a metropolitan city government and could never change the outcome of the city’s project proposal in any significant way, Senator Chu’s response to the bitter dispute happening in her district failed to impress her constituency. On election day, one voter in SD-17 compared Steve Chan and Iwen Chu with obvious frustration against the latter: “Chan always supported us…People call him and he comes right away, Iwen Chu, never.”Footnote 27
Hypotheses
The above discussion and background lead us directly to two hypotheses, which we can test with our data. The first relates to whether international issues influence local elections. In particular, if the Taiwan issue cost Chu her election, we think this is most likely to be observed in areas with high Chinese immigrant influence. These voters presumably would be opposed to Chu’s tacit support of Taiwan and register a vote against her. We think this opposition would therefore be highest in areas with Chinese hometown associations. We state the hypothesis:
-
• H1: International Effect: Precincts with hometown associations located in them will have higher vote movement away from Chu from 2022 to 2024 than will precincts without hometown associations.
To test our second hypothesis, we select a highly localized issue that news reports suggest the campaign may have turned on. It stands to reason that voters living near the proposed homeless shelter at 2501 86th StreetFootnote 28 will disproportionately move against Chu and toward Chan because Chan took a very strong anti-shelter stance, whereas Chu essentially ducked the issue. Therefore, voters were able to relatively easily connect their opposition to the shelter with whom to vote. We formally state the hypothesis accordingly:
-
• H2: Local Effect: Precincts closer to the proposed homeless shelter site will have higher vote movement away from Chu than will precincts further from the homeless shelter site.
Data and Methods
To evaluate our hypotheses, we gathered several types of data. First, we gathered precinct shape files and vote returns for the 2022 and 2024 State Senate District 17 general elections. The data come from the Board of Elections in the City of New York.Footnote 29 We also include results from the U.S. Senate (USS) contests in those same years subset to SD-17. We include the latter as a placebo test—we should not expect to see the local dynamics playing out in the USS contests because this is a hyper-local issue, which the USS candidates are very unlikely to pay attention to when they are campaigning statewide.Footnote 30 Our unit of analysis is precinct or election district. After data cleaning, we have 121 election districts, with each district containing on average 440 cast votes in 2024, ranging from 10 to 875. In 2022, the vote is lower, with the average number of ballots cast falling to 299, with a range of 3 to 629.
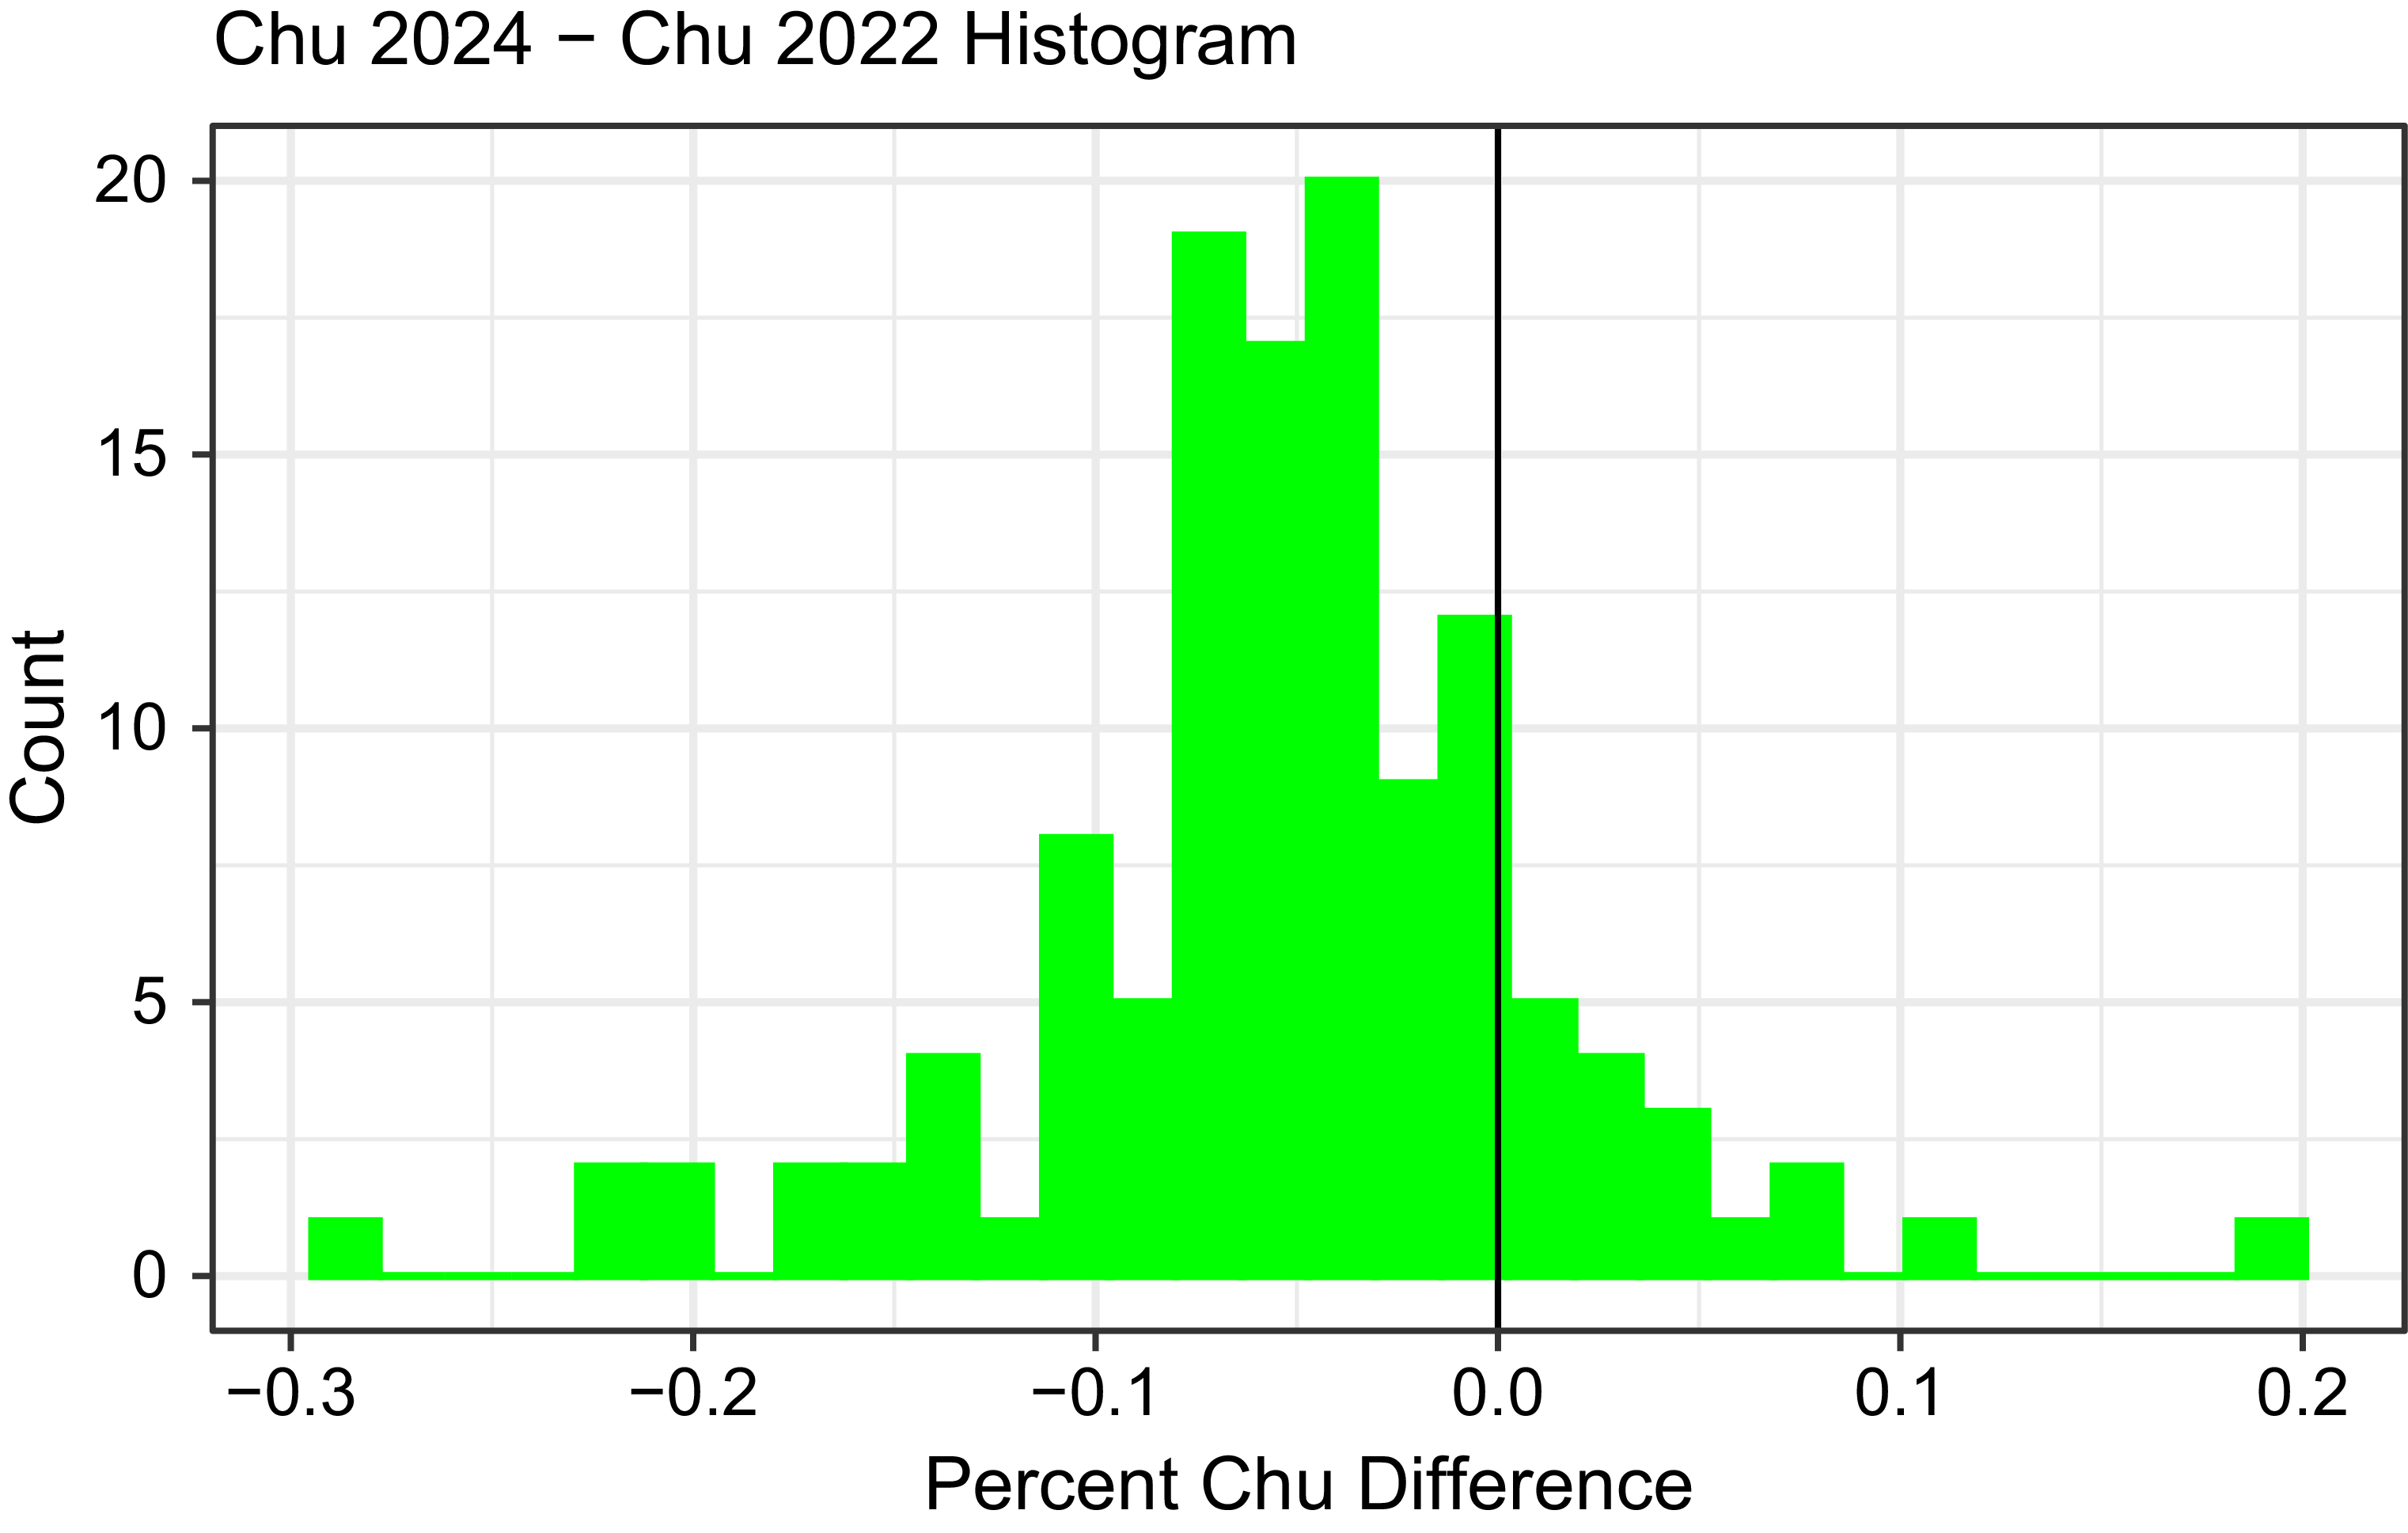
Our primary dependent variable, as depicted in Figure 1, is a difference measure: Percent Chu 2024—Percent Chu 2022.Footnote 31 On the X-axis, the figure shows the change for Chu from one election cycle to the next. The bulk of the distribution falls to the left of the 0 line, indicating clear movement away from Chu. The mean is −.05, with ranges of −.29 to .19. We construct a similar placebo-dependent variable: Percent Gillibrand (Democratic USS candidate) 2024—Percent Schumer (Democratic USS candidate) 2022.
Dependent variable: Percent Chu 2024 - Percent Chu 2022.

To capture our first key independent variable (anti-Taiwan backlash), we identified the location of Chinese Hometown Associations throughout the district. We use two ways to identify a hometown association as local / within-district group: One is that it has a physical address within the district; another is that it has joined an event within the district from 2021 to 2024. We mainly rely on the group’s website or Google Maps to find its physical address. Some small groups (often those connected to the town or village-level origin) may not have a permanent physical address but only function through informal networks. They mostly appear in public when there is an activity such as festival celebrations, funerals, or donations. If a group appears in an SD-17 activity during the term of Senator Chu (2023–2024) and her immediate predecessor (2021–2022), and we cannot find more specific address information, we use the location of the activity instead, because that location is likely the exact place where the group really has an effect. In contrast, if a group has a presence in SD-17 for the four years investigated (2021–2024), it is very unlikely that it never show up in any event during that period for culturally important holidays such as Chinese New Year, Dragon Boat Festival, Moon Festival, or Chinese National Day.
Therefore, including event location when physical address is not available gives us a better picture of a hometown association’s influence in SD-17. When one group has more than one physical address or event location during the focused period (2021–2024), we include all of them. However, our final model includes a dummy for whether a Chinese Hometown Association is present (1)/absent (0) in a precinct using either the physical location or whether the group has appeared at an event in the precinct. This variable correlates at .35 with percent Asian but reveals high face validity. As a robustness check, we also construct a continuous distance measure: the Haversine distance in miles from each precinct’s centroid to the nearest hometown association location or event. This parallels our shelter distance measure and addresses a potential concern that a binary indicator does not capture the intensity of exposure.
The theoretical logic for why hometown association proximity should translate into voting behavior mirrors the exposure argument for the shelter: residents in or near precincts with hometown associations are more likely to (1) participate in association-sponsored events such as festival celebrations, banquets, and community gatherings, (2) receive Chinese-language information flows—including, as discussed above, messaging aligned with Chinese government positions on Taiwan, (3) be embedded in local social networks where pro-China sentiment is reinforced through everyday interactions, and (4) be directly exposed to mobilization efforts organized through these associations. Through these channels, proximity to hometown associations increases both exposure to transnational political messaging and the salience of the Taiwan issue among first-generation Chinese immigrant voters.
However, Figure 2 reveals the locations of the hometown associations and their activity. They are mostly located in the northern section of SD-17—which is the highest density Asian area of the district, where some election districts (precincts) near 90% Asian VAP (see Figure A1 in the appendix). There is also some activity near the homeless shelter precincts (the southern part of the district), but not at all concentrated in comparison to the northern section of the district.
Location of Chinese Hometown Associations or Activity.

To capture our second key independent variable, we identified the location of the proposed homeless shelter: 2501 86th Street. We extracted the geo-coordinates of this site (−73.98689, 40.59798). Figure 3 presents a choropleth map shaded by Percent 2024 Chu—Percent 2022 Chu—in other words the difference in her vote between the two elections. The proposed homeless shelter is presented as a red dot—clearly Chu did worse in the areas in and around the proposed site.
Percent Chu 2024 - Percent Chu 2022 vote map, with proposed homeless shelter as a red dot.

Next, using the election district polygon shape file, we extracted each election district’s centroid. We calculated the straight-line Haversine distance between each precinct’s centroid and the proposed homeless shelter. We then converted this distance to miles and logged it to account for the nonlinearity of the effect.Footnote 32 Distance to event is a common measure used in the study of precinct voting, with examples such as Gerber and Phillips (Reference Gerber and Phillips2003) and Markarian and Newman (Reference Markarian and Newman2025). We use centroid-based distance as our proximity measure because it is a standard approach in the spatial analysis of precinct-level voting (Gerber and Phillips Reference Gerber and Phillips2003; Markarian and Newman Reference Markarian and Newman2025), and because the election districts in SD-17 are small and relatively compact, minimizing the measurement error that can arise from irregularly shaped or large geographic units. We acknowledge that centroid distance is an approximation: some residents within a precinct may live closer to or farther from the shelter than the centroid suggests. However, given the small geographic size of these precincts (mean area under .1 square miles), the centroid provides a reasonable proxy for the average resident’s proximity.
The theoretical logic connecting proximity to voting behavior runs through several channels: residents living closer to the proposed shelter site are more likely to (1) directly observe construction-related activity and protests, (2) attend neighborhood meetings and community protests organized around the site, (3) encounter canvassing and mobilization efforts by local opponents, (4) experience—or anticipate experiencing—spillover effects on property values and neighborhood safety, and (5) be embedded in local social networks where the shelter issue is a dominant topic of discussion. Each of these channels implies that proximity increases both exposure to the issue and the salience of that issue in the voter’s calculus. Thus, we expect this measure’s coefficient to have a positive relationship with vote movement towards Chu from 2022 to 2024. That is, all else equal, as a precinct moves further from the homeless shelter, we expect to see less of an anti-Chu backlash.
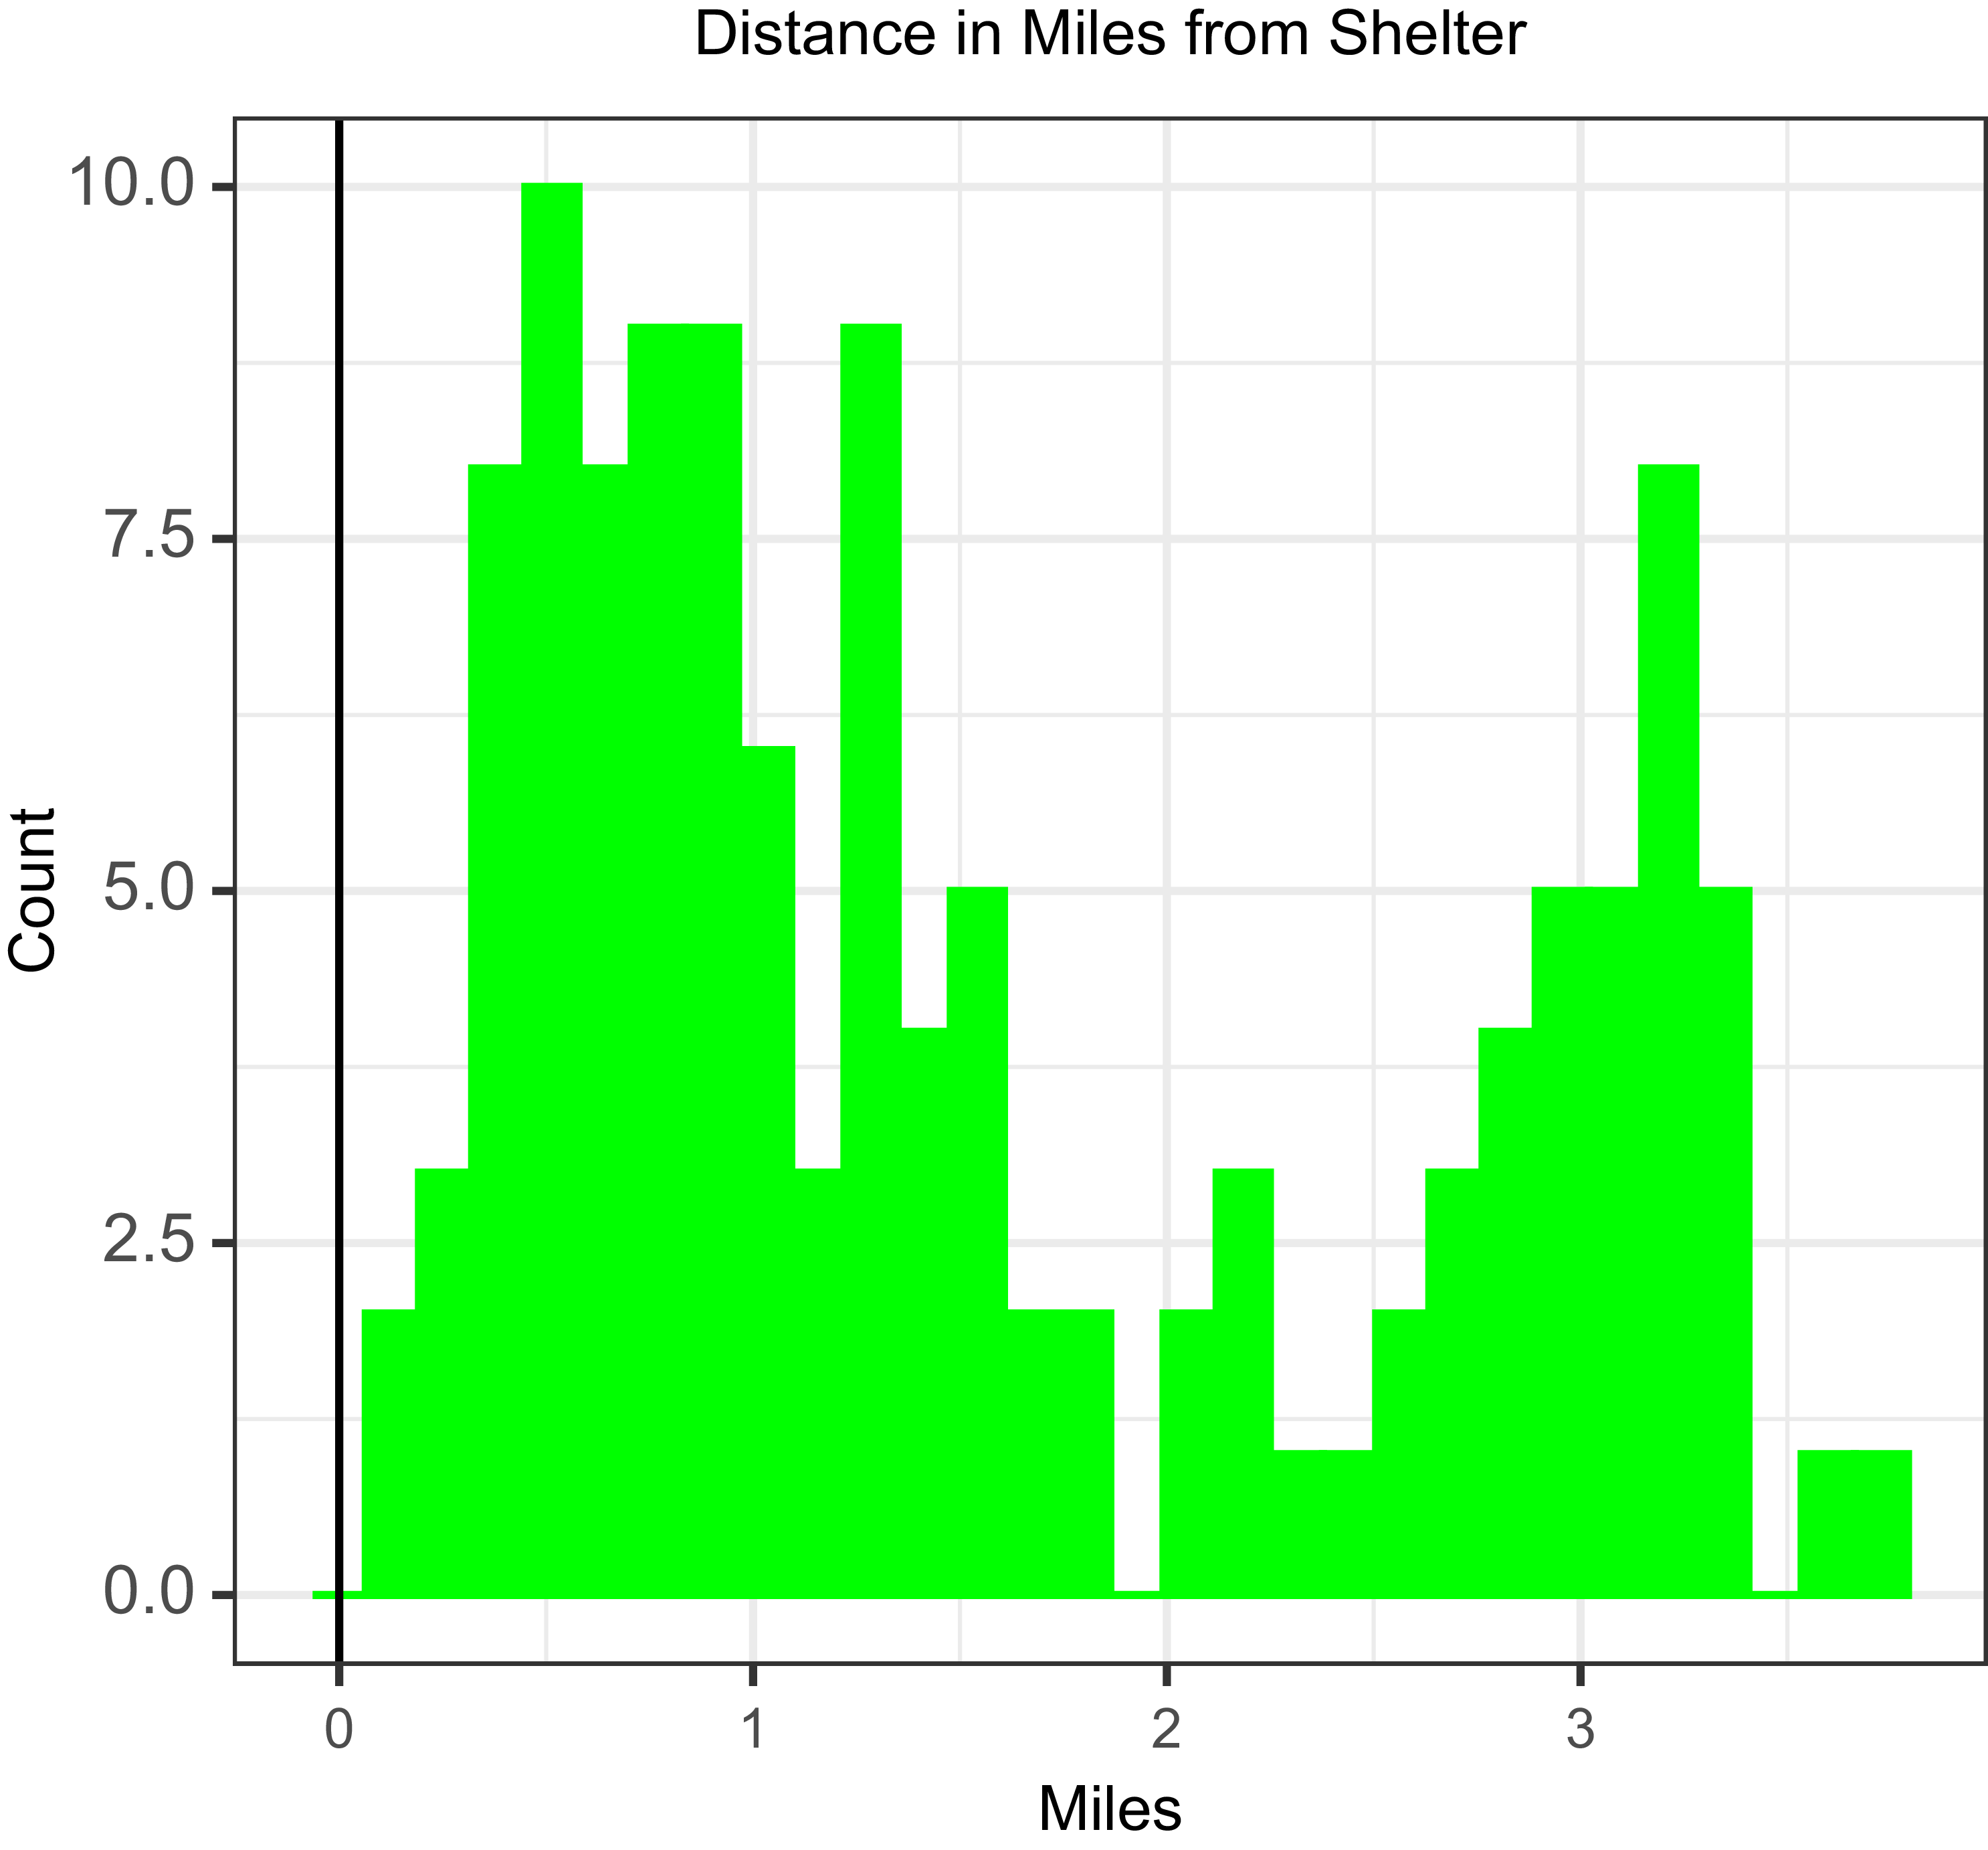
We present the variable’s distribution in Figure 4. The variable’s mean is 1.57 miles, ranging from .1345 miles to 3.72 miles.
Independent variable: Distance in miles from proposed homeless shelter site.

Sadhwani (Reference Sadhwani2022a) shows that the effect of Asian candidates on the ballot increases Asian turnout in high-density districts. So the presence of Republican candidate Chan may have brought new people out to the polls vs. Republican candidate LaBella and that could explain the difference in Chu’s vote share across the two elections. If that were the explanation instead of local issues, for instance, then we would not see a relationship between distance to shelter and vote shifting away from Chu, rather we would see a generalized increase in vote share for Chu’s opponent in high foreign-born or high Asian precincts. We would also see corresponding higher turnout in high-density Asian precincts. We assess this in our discussion of results.
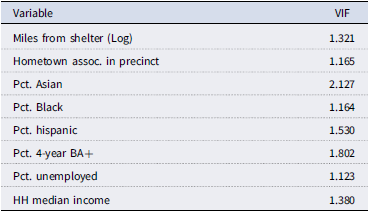
We also control for possible vote movement explanations and demographic differences by precinct. This is important because while the area is majority-Asian, the discussed constituency is located in an area like Brooklyn, long known for its exceptionally high level of demographic and cultural diversity, and there are diverse pockets of voters across the district. Therefore, our controls include Percent Asian, Percent Hispanic, Percent Black (with White left out as the comparison), Percent 4-year educated or higher, percent unemployed, and household median income. Finally, we note here that we conducted variance inflation factor (VIF) tests post-regression (Table A7 in the appendix) and do not suffer from multicollinearity; all VIF values are below 2.2. We also tested for spatial autocorrelation in the model residuals using Moran’s I with a queen contiguity weights matrix; the test is not significant (I = −.049, p = .74), indicating no problematic spatial dependence.Footnote 33
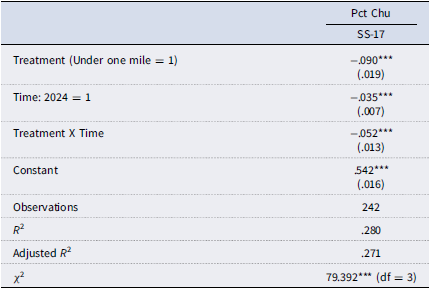
We note that proximity to the shelter is not randomly assigned, and a skeptical reader may worry that pro-development or anti-homeless voters sort into neighborhoods near the proposed site. However, our design mitigates this concern in two important ways. First, our dependent variable is a change measure (Chu 2024 minus Chu 2022), which differences out time-invariant precinct characteristics—including any stable residential sorting patterns. For the shelter proximity to bias our estimates, it would need to be the case that voters near the proposed site changed their political behavior between 2022 and 2024 for reasons other than the shelter controversy and that this change is correlated with proximity to the site. Second, the shelter proposal was announced in November 2023, well after residents had made their residential choices, making it unlikely that voters sorted into or out of these precincts in anticipation of the shelter. A similar logic applies to the hometown association measure: while pro-China voters may sort into areas near these associations, our change model absorbs this baseline sorting because any such preexisting alignment would be captured in the 2022 vote. The hometown associations were generally established prior to both elections, and importantly, the relevant activation event—Chu’s attendance at President Tsai’s dinner—occurred between the two election cycles. We also present a difference-in-differences specification (Table A1 in the appendix) using a one-mile treatment cutoff, and the results are substantively similar.
We note that SD-17 represents what Levy (Reference Levy2008) terms a “most-likely” case for the transnational influence hypothesis: the district has one of the highest concentrations of first-generation Chinese immigrants in the country, active hometown associations with documented ties to the Chinese government, a concrete international trigger event between the two elections, and extensive media coverage attributing the electoral outcome to homeland politics. If transnational issues were going to shape subnational election outcomes anywhere, this is where we would most expect to find it. A null finding here therefore carries substantial inferential weight (Eckstein Reference Eckstein, Greenstein and Polsby1975).
Because our dependent variable is continuous, we estimate all models using weighted least squares, with total precinct vote count as the weight. This gives greater weight to larger precincts, whose vote share estimates are measured with less noise due to larger denominators.Footnote 34
Results
We begin our discussion of the results by examining several bivariate relationships between our dependent variable and key independent variables. First, with respect to the relationship between hometown associations and vote movement, Table 1 shows the mean Chu vote change from 2022 to 2024 by whether the precinct has a Chinese hometown association in it, or not. The vote shift in both is nearly identical and is not statistically significant (t = .31, df = 20.18, p-value = .76). Therefore, we fail to find any evidence that international issues such as those specified pervaded the 2024 SD-17 contest to such a degree that Chu lost on account of it. Therefore, we do not find initial support for H1.
Association between vote movement and Chinese hometown associations

Table 1. Long description
A table comparing vote change with and without hometown association. The table has four rows and four columns. Column headers are Mean vote change, N, and Std. Dev. Row labels are No hometown association, Hometown association, and Total. Row 1: No hometown association, Mean vote change is negative 0.05, N is 105, Std. Dev. is 0.07. Row 2: Hometown association, Mean vote change is negative 0.06, N is 16, Std. Dev. is 0.06. Row 3: Total, Mean vote change is negative 0.05, N is 121, Std. Dev. is 0.07.
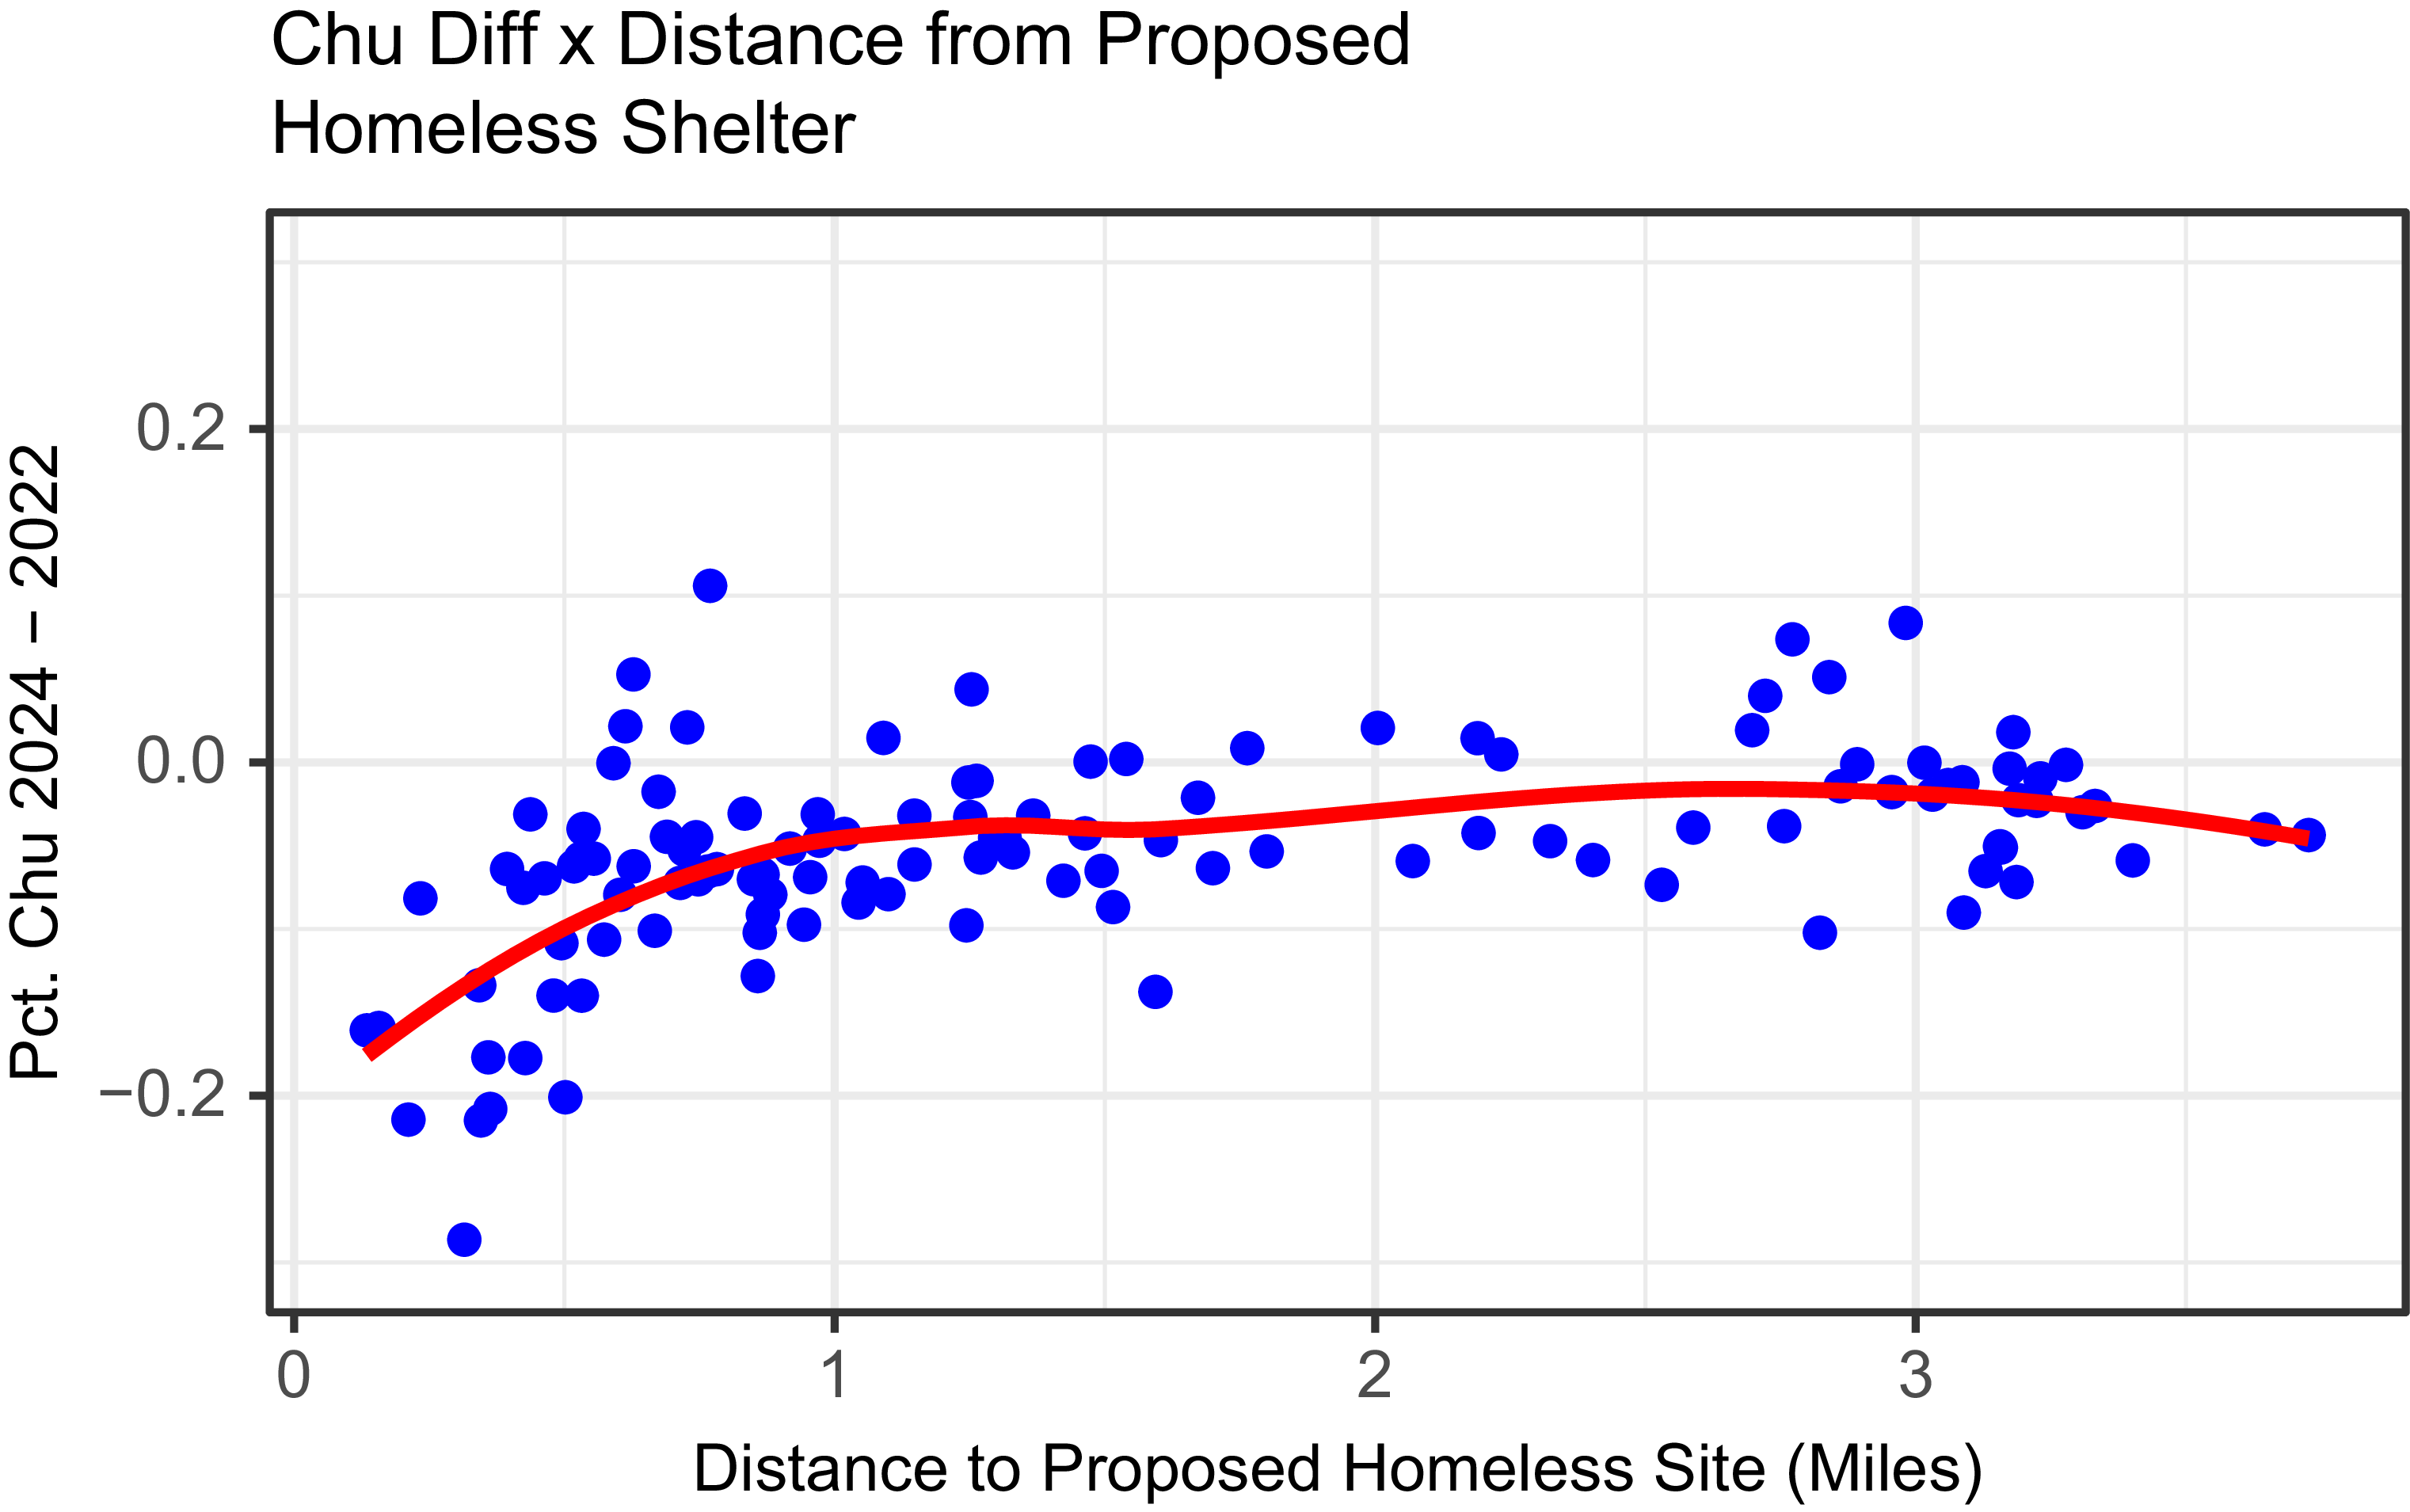
We next assess the bivariate relationship between distance to the proposed homeless shelter and vote movement away from or towards Chu. Figure 5 presents a bivariate scatterplot with a lowess smoother. The figure clearly shows that movement away from Chu is strongest in precincts that are very near the proposed homeless shelter (to the left of the x-axis). Every single precinct within a half-mile of the proposed site shifted away from Chu, but those even closer shifted the most. The correlation between these two variables is .47 and is statistically significant (t = 5.78, df = 119, p-value < .001).
Association between distance in miles from proposed homeless shelter site and vote movement away from or towards Chu, from 2022 to 2024.

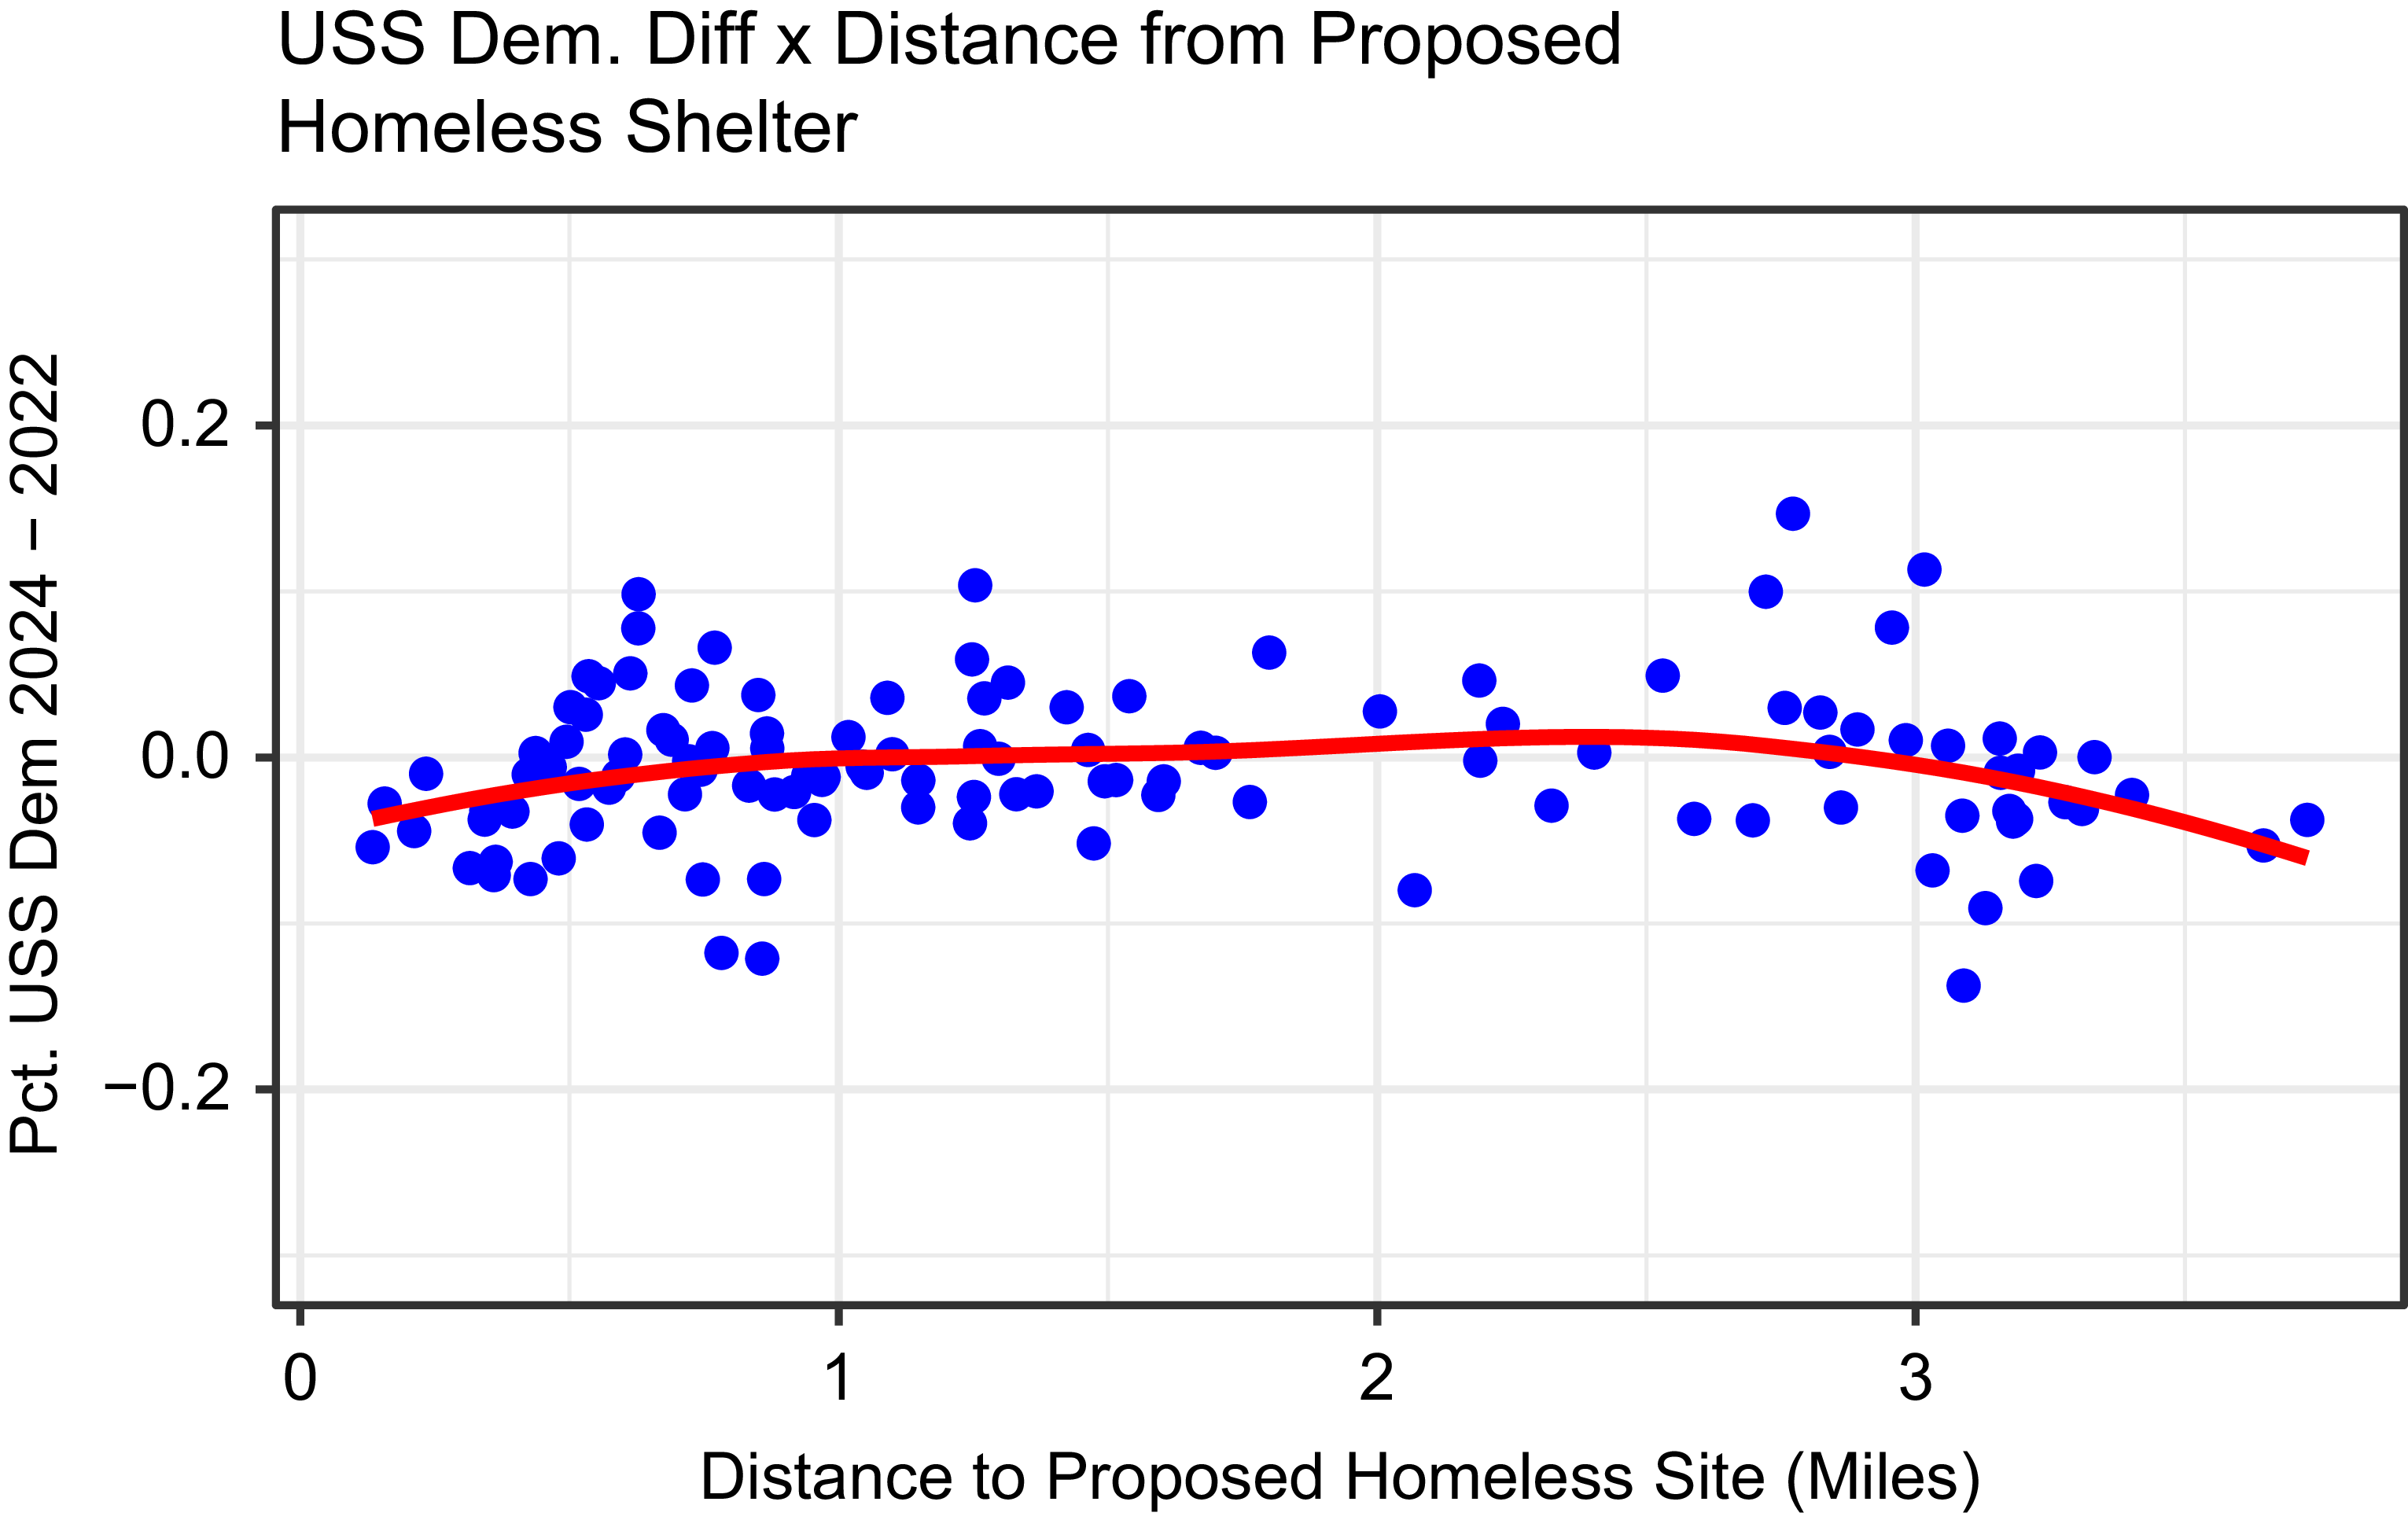
By way of comparison, Figure 6 shows the shift in support for the U.S. Senate Democratic candidate from one election cycle to the next. The plot shows essentially a null relationship between the two variables (t = 1.07, df = 119, p-value = .29).
Association between distance in miles from proposed homeless shelter site and vote movement away from or towards the U.S. Senate Democratic candidate, from 2022 to 2024.

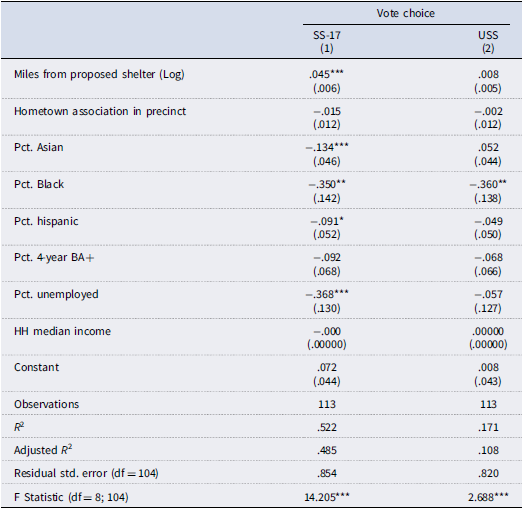
We now turn to our multivariate analysis, where in addition to our key independent variables, we include our controls.Footnote 35 Table 2 presents the core findings. The model on the left, titled SS-17, is the Chu Difference model, whereas the model on the right is the USS difference model (placebo model). To test H1, we turn to the Hometown Association in Precinct row 2—here we do not observe a statistically significant relationship between our measure of international influence and vote movement toward or away from Chu or towards the U.S. Senate Democratic candidate. These findings are consistent with our initial analysis; therefore, H1 is not supported.
Multivariate regression measuring the association between Chu Di_erence 2024–2022, home-town associations, distance from proposed shelter, and controls

Table 2. Long description
A table titled Multivariate regression measuring the association between Chu Difference 2024–2022, hometown associations, distance from proposed shelter, and controls. The table has 12 rows and 4 columns. The columns are labeled as follows: Vote choice, SS-17 (1), and USS (2). The rows are labeled as follows: Miles from proposed shelter (Log), Hometown association in precinct, Pct. Asian, Pct. Black, Pct. Hispanic, Pct. 4-year BA+, Pct. unemployed, HH median income, and Constant. The table presents the coefficients and standard errors for each variable in two models: SS-17 and USS. The coefficients and standard errors are as follows: Miles from proposed shelter (Log): 0.045 (0.006) for SS-17 and 0.008 (0.005) for USS. Hometown association in precinct: -0.015 (0.012) for SS-17 and -0.002 (0.012) for USS. Pct. Asian: -0.134 (0.046) for SS-17 and 0.052 (0.044) for USS. Pct. Black: -0.350 (0.142) for SS-17 and -0.360 (0.138) for USS. Pct. Hispanic: -0.091 (0.052) for SS-17 and -0.049 (0.050) for USS. Pct. 4-year BA+: -0.092 (0.068) for SS-17 and -0.068 (0.066) for USS. Pct. unemployed: -0.368 (0.130) for SS-17 and -0.057 (0.127) for USS. HH median income: -0.000 (0.0000) for SS-17 and 0.0000 (0.0000) for USS. Constant: 0.072 (0.044) for SS-17 and 0.008 (0.043) for USS. The table also includes the number of observations (113), R-squared values (0.522 for SS-17 and 0.171 for USS), adjusted R-squared values (0.485 for SS-17 and 0.108 for USS), residual standard errors (0.854 for SS-17 and 0.820 for USS), and F statistics (14.205 for SS-17 and 2.688 for USS).
Note: *p < .1; **p < .05; ***p < .01.
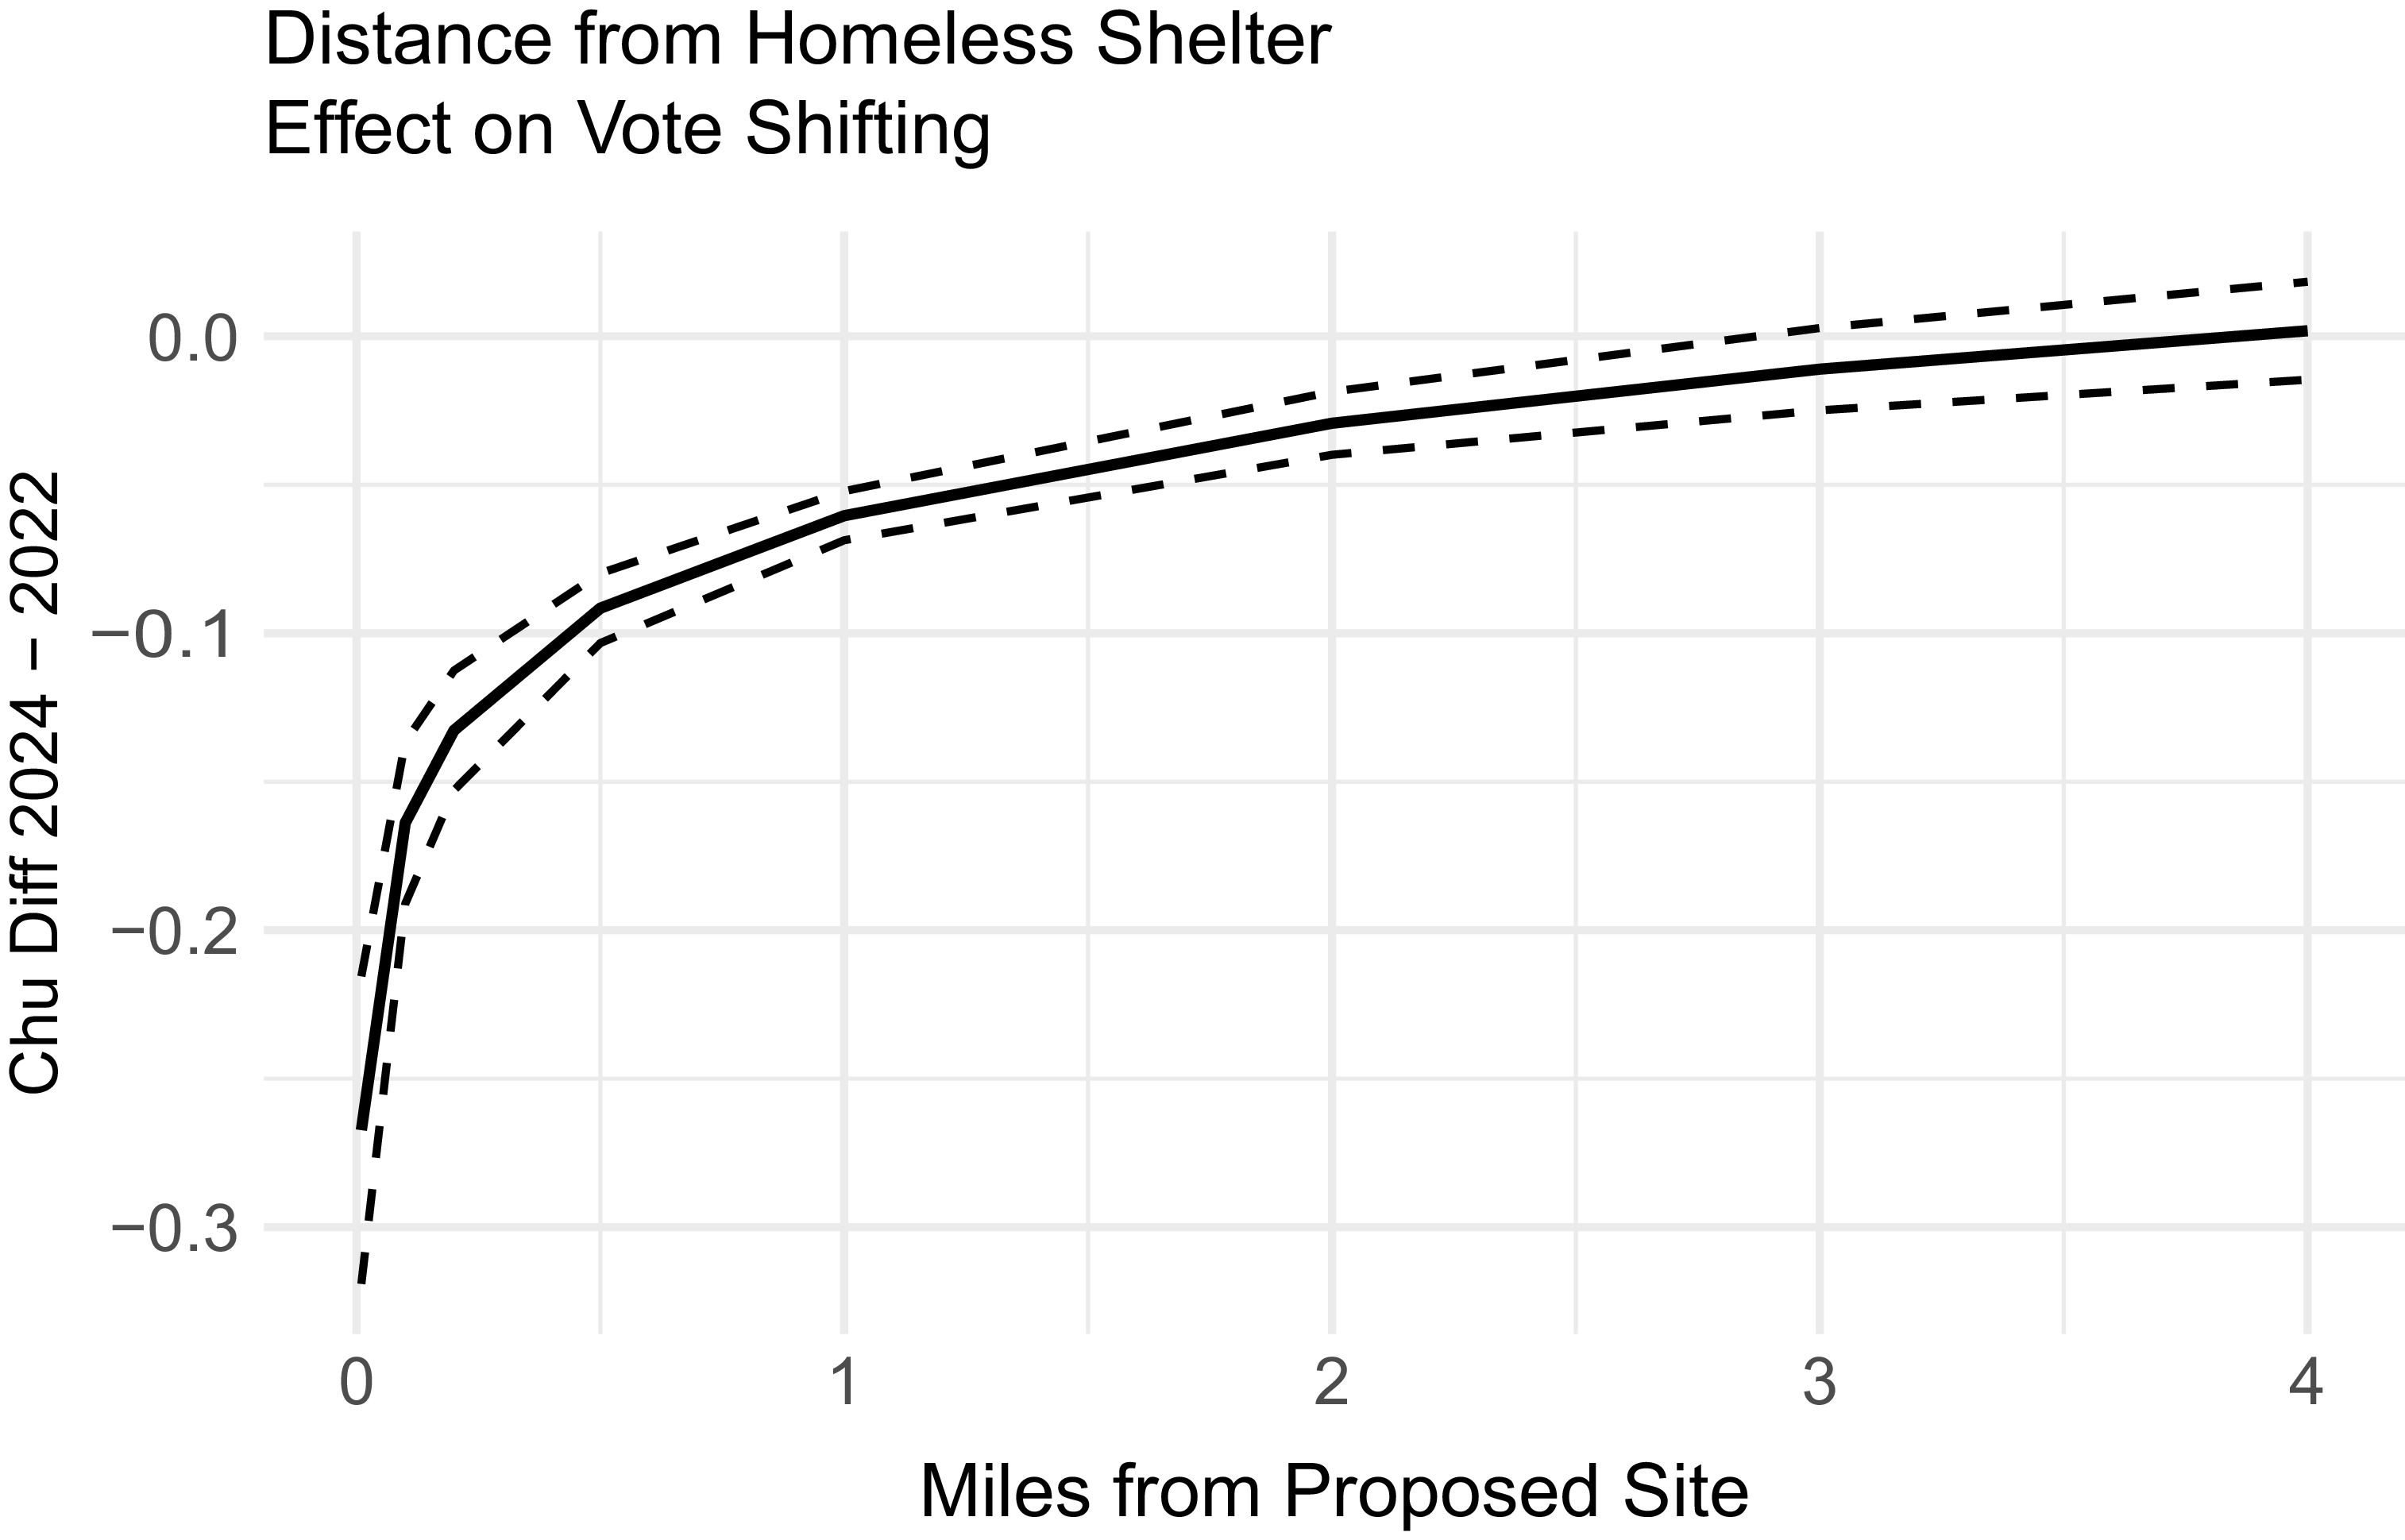
The variable entitled, Miles from Proposed Shelter (Log), captures the relationship between our local policy issue and vote movement away from or towards Chu. The β coefficient is .045 and is statistically significant. This means that as a precinct moves further away from the proposed homeless shelter site, the vote for Chu is relatively higher. And the converse is true. This provides clear support for H2. However, because our variable is logged a linear interpretation is inappropriate; therefore, we present the relationship graphically. We also note that this variable is not at all related to vote change in the U.S. Senate contest—which is consistent with our expectations.
Figure 7 presents the findings from a post-estimation analysis where we predict outcomes of the dependent variable based on different values of the key independent variable, holding all other variables at their central tendency. The results clearly show that precincts very near to the proposed homeless shelter swung strongly against Chu from 2022 to 2024. In fact, the model estimates that precincts adjacent to the site swung against Chu by about 25 percentage points. Further, the analysis shows that most of the vote movement activity occurs in precincts within one mile of the proposed shelter.
Predicted vote movement away from or towards Chu (SS-17) as a function of distance in miles from proposed homeless shelter site, from 2022 to 2024.

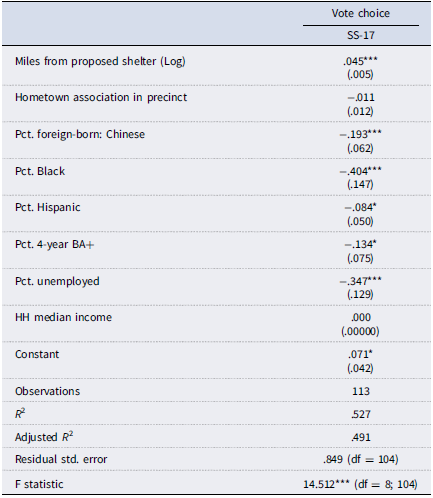
With respect to our control variables—consistent with our case study of campaign dynamics—we observe a movement away from Chu among precincts with larger shares of Asians. We also include a re-estimated model (Table A2 in the appendix) that swaps out percent Asian with percent Foreign-Born: Chinese. The results are substantively the same. However, relative to whites, we also observe movement away from Chu—a Democrat—among Black and Hispanic areas. This is broadly consistent with national-level politics concerning the 2024 election. Finally, we also observe a movement away from Chu in areas with greater unemployment. This finding makes sense when we consider the saliency of the homeless issue. It could be that voters in areas with higher unemployment see Chan as better on employment since some voters may see homelessness contributing to locally weaker economies.
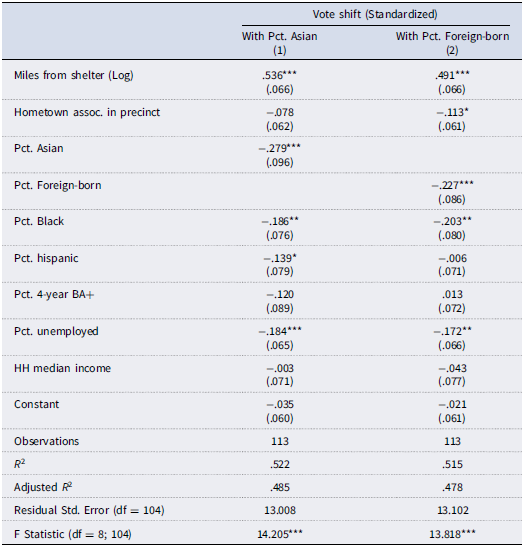
To facilitate comparison between the magnitude of different predictors, we also estimated standardized versions of our model with all variables z-scored (Table A3 in the appendix). In Model 1 (corresponding to the main specification in Table 2), the standardized coefficient for shelter distance is β = .536 (p < .001), far exceeding the next largest predictor, percent Asian (β = −.279, p = .004). In Model 2, which replaces percent Asian with percent foreign-born to compare the two demographic proxies highlighted by a reviewer—percent foreign-born as a proxy for the Taiwan issue and percent unemployed as a proxy for the homelessness issue—the standardized coefficients are β = −.227 (p = .010) and β = −.172 (p = .010), respectively. Both are dwarfed by the shelter distance effect (β = .491, p < .001), underscoring that the local shelter issue was far and away the dominant predictor of vote change.
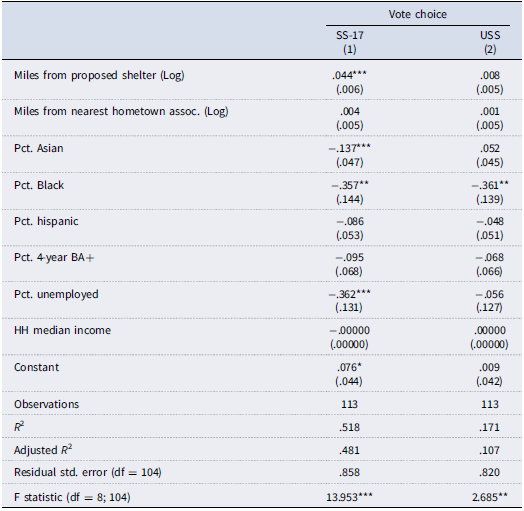
As a robustness check, we also estimated our model, replacing the binary hometown association indicator with the continuous logged distance to the nearest hometown association (Table A4 in the appendix). The coefficient on this measure is substantively small and not statistically significant (β = .004, p = .441), corroborating our finding that proximity to hometown associations does not predict vote shifting away from Chu. This is notable because a reviewer concern is that the binary indicator may not capture the intensity of exposure to hometown association influence. Even when using a continuous distance measure—which mirrors our shelter distance specification—we find no evidence of an international influence effect.
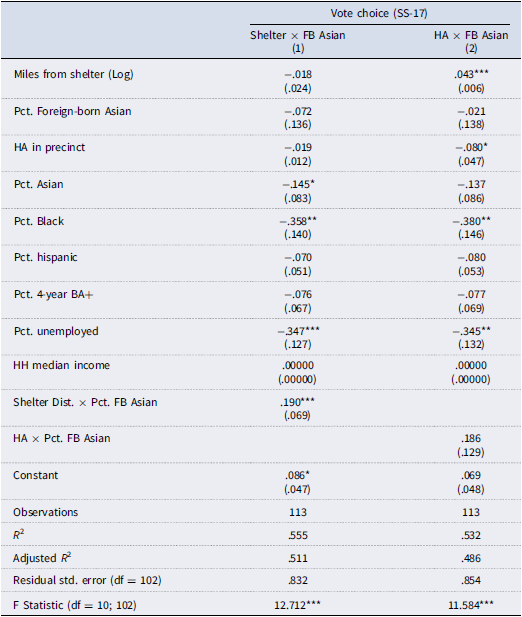
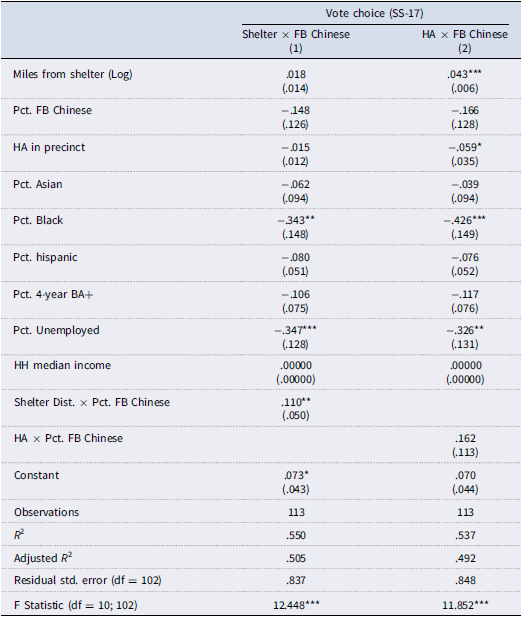
We additionally estimated interaction models to assess whether the shelter and hometown association effects vary with the concentration of Asian immigrants. Table A5 in the appendix interacts each key independent variable with percent foreign-born Asian (computed from ACS table B05006 as the share of the population born in any Asian country). We find a significant positive interaction between shelter distance and percent foreign-born Asian (β = .190, p = .007), suggesting that the shelter’s effect on vote shifting is amplified in precincts with larger Asian immigrant populations. The interaction between the hometown association dummy and percent foreign-born Asian is positive but not statistically significant (β = .186, p = .153).
We also estimated the same interaction models using percent foreign-born Chinese specifically (Table A6 in the appendix). The shelter distance interaction with percent foreign-born Chinese is significant (β = .110, p = .030), confirming that the shelter’s effect is amplified in precincts with more Chinese immigrants specifically. The hometown association interaction with percent foreign-born Chinese is not statistically significant (β = .162, p = .157). Across both specifications, the shelter proximity effect is consistently amplified in immigrant-dense precincts, while the hometown association effect remains null regardless of how immigrant concentration is measured.
We note that while Percent Asian could be considered a possible measure for international influence in the campaign, we are hesitant to draw that conclusion. The percent Asian measure is statistically significant and in a direction consistent with an international influence argument; the bivariate correlation to vote movement away from Chu is just −.10. Thus, even if this were a perfect measure of international influence, the effect size is still a lot smaller than the effect size of the homeless shelter local issue. Finally, when we disaggregated foreign-born by country of origin to generate a percent Chinese variable, the correlation between that and vote shifting is just −.07.
We also consider whether the co-ethnic candidate effect (Sadhwani Reference Sadhwani2022a)—specifically that the presence of Chan, a Chinese-American Republican, on the 2024 ballot may have boosted Asian turnout and generated a uniform swing against Chu in high-Asian precincts—can explain our findings. If this were the primary mechanism, we would expect to see a generalized shift against Chu across all high-Asian precincts rather than the sharp distance gradient centered on the shelter site. The strong distance effect and the null result for the USS placebo model are inconsistent with a uniform co-ethnic mobilization story and instead point to the shelter as the dominant factor.
A related concern is that the hometown association measure may simply capture Chinese density or Chinese-language infrastructure rather than association-specific influence. We assessed this directly. The correlation between the hometown association dummy and percent Asian is .35, and its correlation with percent foreign-born Chinese is .39—moderate but far from collinear. VIFs from our main regression model are all below 2.2, well within acceptable bounds (Table A7 in the appendix). Moreover, we control for percent Asian in all models, meaning the hometown association coefficient captures variation above and beyond what is explained by co-ethnic density. The persistent null result on the hometown association measure—even after controlling for demographic composition and even when using a continuous distance specification—suggests that this measure is not simply a proxy for Chinese population density.
Generalizability
While the presented evidence strongly suggests that American voters of East Asian heritage may prioritize domestic issues over international issues when deciding how to vote, the case study is somewhat rare and is focused on a particular subset of Chinese immigrant voters in Brooklyn. Here, we present some basic bivariate results from the 2016 Collaborative Multi-Racial Post Election Survey (CMPS 2016) as a means of generalizing this finding. We corroborate our findings with a similar analysis of the 2020 CMPS.
The survey is publicly available from ICPSR and contains large samples of voters from different racial groups, including 1,649 U.S. respondents who trace their heritage to China, Taiwan, Japan, and South Korea. We also filter the data to just respondents tracing heritage to China and Taiwan, and the results are substantively the same. We generated a dummy indicator for East Asian (the above countries), then two outcome variables designed to measure domestic economic vs. international issues. The CMPS asks a question concerning issue importance: “On the whole, what are the most important issues facing your community that you think the President and Congress should address?”
We coded respondents as a domestic economic issue priority as someone who stated one of the following categories as their top issue: Job creation / improve economy; Wages / Incomes / Minimum wage; Health care; Housing / Affordable housing; College affordability; and Taxes / Government spending. A respondent who states: Immigration reform; and Terrorism / ISIS / Foreign policy as their top issue is classified as a voter most concerned with international issues. Our tabulations include weights (education, gender, region, and race).
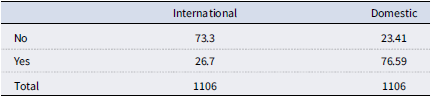
If our Brooklyn SD-17 finding generalizes, then we should expect more respondents to fall into the domestic economic issue priority category than the international category. Among East Asian respondents, this is certainly true. Table 3 shows that 77% of East Asian respondents said the president and Congress should focus on domestic economic priorities vs. 27% who say international issues.Footnote 36 Clearly, these results are statistically distinguishable from one another (t = −31.7, df = 3285, p <.0001) and are consistent with our case study findings.Footnote 37
Domestic economic vs. International issue concerns among East Asian CMPS respondents (weighted)

Table 3. Long description
A table with two columns and three rows. The columns are labeled ‘International’ and ‘Domestic’. The rows are labeled ‘No’, ‘Yes’, and ‘Total’. Row 1: No, 73.3, 23.41. Row 2: Yes, 26.7, 76.59. Row 3: Total, 1106, 1106.
Because our case study centers specifically on Chinese and Taiwanese immigrants rather than all East Asians, we also restrict the CMPS 2016 sample to Chinese and Taiwanese respondents only (N = 1,075). The results are nearly identical: 75.4% of Chinese/Taiwanese respondents prioritize domestic economic issues compared to 28.7% who prioritize international issues (t = −24.5, p < .0001).
Because immigrant status is central to our theoretical argument, we further break down the 2016 Chinese/Taiwanese CMPS respondents by nativity using the survey’s S7 variable (“Were you born in the United States or another country?”). Among the 418 foreign-born Chinese/Taiwanese respondents—the group most theoretically analogous to voters in SD-17—75.4% prioritize domestic economic issues while 29.4% prioritize international issues (t = −13.8, p < .0001). Among the 657 US-born Chinese/Taiwanese respondents, 75.4% prioritize domestic economic issues and 25.7% prioritize international issues (t = −20.4, p < .0001). The slightly higher rate of international issue concern among foreign-born respondents (29.4% vs. 25.7%) is consistent with the theoretical expectation that immigrants maintain stronger transnational ties, but the gap is modest and both groups overwhelmingly prioritize domestic concerns.
We conducted the same analysis using the 2020 CMPS data, given that exogenous events might make international issues more salient at one time or another. The results are similar although not exactly the same, in part because respondents are also now concerned with the COVID-19 pandemic, which we code as neither domestic nor international because it is both. Among all East Asian respondents, about 64% report a domestic economic issue as their top one or two priorities, whereas just 16% report one of the international options. When restricted to Chinese and Taiwanese respondents only (N = 1,127), the results are substantively identical: 63.6% prioritize domestic economic issues compared to 16.2% who prioritize international issues (t = −26.2, p < .0001).
The 2020 nativity breakdown mirrors the 2016 pattern. Among the 434 foreign-born Chinese/Taiwanese respondents, 63.6% prioritize domestic economic issues while 19.1% prioritize international issues (t = −14.9, p < .0001). Among the 693 US-born Chinese/Taiwanese respondents, 63.6% prioritize domestic economic issues, and just 14.4% prioritize international issues (t = −21.7, p < .0001). As in 2016, foreign-born respondents show slightly higher international concern (19.1% vs. 14.4%), but the gap is modest, and both groups overwhelmingly prioritize domestic concerns across both survey waves.
Overall, these results are confirming and provide added evidence that East Asian voters—including specifically Chinese and Taiwanese Americans, and including foreign-born respondents—tend to care about local domestic issues more than international concerns.
Discussion and Conclusion
We began this paper by posing a possible challenge to the all politics is local or domestic maxim. Given the relatively rapid rise in diverse immigration since the 1960s, in conjunction with advances in technology, it is not out of the question that immigrant communities these days maintain deep connections with their country of origin communities. Therefore, if candidates take positions at odds with the interests of their country of origin communities, the candidates may expect punishment at the polls. Thus, despite the fact that American elections tend to turn on domestic issues, we have identified communities where this ostensible truism may not be true.
We tested this basic argument in the context of the Chinese immigrant community of Brooklyn, New York. After she narrowly won in 2022, we noted that Senator Chu— representative of SD-17—both tacitly supported Taiwan independence and failed to strongly oppose the construction of a homeless shelter in her district—or at least was painted that way. Therefore, our measures of the effect of her support for Taiwan independence (hometown associations) and a proposed homeless shelter (local issue) let us test these theories of voting against one another. We found strong support for the local voting issue and basically no support for the international issue. These findings, therefore, provide some evidence that even in high-density Chinese immigrant neighborhoods of New York City, where transnational connections and birthplace identities remain significant, emerging local issues with a sufficient degree of community-wide controversy and impact can still prevail over preexisting international issues in the context of voting.
We acknowledge several limitations of our research design. First, our proximity measures—distance from the shelter site and presence of hometown associations—are indirect proxies for voter-level exposure. While the change model mitigates time-invariant confounds, proximity is not randomly assigned. Voters near the shelter may differ from voters farther away on unobserved characteristics that also predict vote change, although the exogenous timing of the shelter announcement (November 2023, after most voters had already established their residences) reduces this concern. Similarly, while hometown associations were generally established before the 2022 election, we cannot fully rule out the possibility that their locations correlate with unobserved precinct characteristics that dampen vote movement. Our use of a change model, a placebo test (U.S. Senate race), and a difference-in-differences specification provided in the appendix collectively increase confidence in our findings, but we stop short of claiming strict causal identification.
Second, we lack direct evidence on the mechanism linking proximity to vote choice. Our theoretical framework posits that proximity increases exposure to mobilization efforts, neighborhood discussion, and direct observation of the controversy, which in turn increases the salience of the issue and shifts vote choice. However, we do not observe these intermediate steps. Future work with individual-level survey data or canvassing records could help trace this causal chain more precisely.
Third, our evidence is limited to one case study and may not apply to all immigrant groups or political contexts. SD-17 is a unique district: it is Brooklyn’s first majority-Asian state senate district, with a very high foreign-born population and active Chinese hometown associations. Whether our findings generalize to other Asian-American communities, to other immigrant groups, or to different types of international issues remains an open question. California’s San Gabriel Valley, Houston’s Chinatown, and the Flushing neighborhood in Queens, New York, are among the other jurisdictions where similar dynamics might be studied.
That said, as we note in our research design, SD-17 represents a most-likely case for the transnational influence hypothesis (Levy Reference Levy2008). The fact that we find no measurable effect of the international issue on vote shifting—while finding overwhelming evidence that the local homeless shelter issue drove the outcome—suggests that the baseline finding in the American politics literature holds even in these theoretically most-likely conditions: domestic and local issues predominate.
We also note scope conditions under which homeland associations and transnational issues might matter more. These include periods of heightened geopolitical crisis (e.g., a military conflict involving the homeland), dense co-ethnic immigrant networks with strong reliance on ethnic-language media rather than mainstream American media, and situations where the transnational issue directly affects the material well-being of diaspora communities (e.g., sanctions, remittance restrictions). The Taiwan issue during 2023–2024, while politically salient, did not directly impose costs on Chinese-American voters’ daily lives in the way that the shelter proposal threatened to reshape their immediate neighborhood.
Finally, our analysis points toward a broader research agenda on when and why homeland politics travel into American elections. The growing Ukrainian, Iranian, and Venezuelan diaspora communities in the United States offer natural comparative cases. Ukrainian Americans’ responses to the Russian invasion, Iranian Americans’ engagement with the Women, Life, Freedom movement, and Venezuelan Americans’ reactions to the Maduro regime all represent contexts where transnational political concerns might shape domestic political behavior. Examining whether—and under what conditions—these communities prioritize homeland concerns over local domestic issues would provide valuable evidence on the scope and limits of transnational political influence in American elections.
Supplementary material
The supplementary material for this article can be found at https://doi.org/10.1017/rep.2026.10100.
Acknowledgements
The authors thank Jacqueline Nieschmidt for her input into this paper.
Funding statement
The authors received no funding for this work.
Competing interests
None.
Appendix models
Difference in difference regression estimating the relationship between treatment (precinct centroid within one mile of proposed shelter) and control from time one (2022) to time 2 (2024)

Table A1. Long description
The table presents the results of a difference-in-difference regression analysis estimating the relationship between treatment (precinct centroid within one mile of proposed shelter) and control from time one (2022) to time two (2024). The table has 8 rows and 2 columns. Row 1: Treatment (Under one mile = 1), -0.090 (0.019). Row 2: Time: 2024 = 1, -0.035 (0.007). Row 3: Treatment X Time, -0.052 (0.013). Row 4: Constant, 0.542 (0.016). Row 5: Observations, 242. Row 6: R squared, 0.280. Row 7: Adjusted R squared, 0.271. Row 8: Chi-squared, 79.392 (df = 3). The table also notes that p < 0.1, p < 0.05, and p < 0.01.
Note: *p < .1; **p < .05; ***p < .01.
Multivariate regression measuring the association between Chu Difference 2024-2022, hometown associations, distance from proposed shelter, and controls where Percent Asian is swapped out for a measure capturing Percent Chinese

Table A2. Long description
A table with 11 rows and 3 columns showing multivariate regression results for vote choice SS-17. The columns are labeled ‘Vote choice’, ‘SS-17’, and values. Row 1: Miles from proposed shelter (Log), .045, (.005). Row 2: Hometown association in precinct, .011, (.012). Row 3: Pct. foreign-born: Chinese, .193, (.062). Row 4: Pct. Black, .404, (.147). Row 5: Pct. Hispanic, .084, (.050). Row 6: Pct. 4-year BA, .134, (.075). Row 7: Pct. unemployed, .347, (.129). Row 8: HH median income, .000, (.00000). Row 9: Constant, .071, (.042). Row 10: Observations, 113, . Row 11: R2, .527, Adjusted R2, .491, Residual std. error, .849 (df 104), F statistic, 14.512 (df 8; 104).
Note: *p < .1; **p < .05; ***p < .01.
Standardized (z-scored) regression coefficients for the SS-17 Chu Difference model

Table A3. Long description
A table comparing standardized regression coefficients for vote shift models with percentage Asian and percentage foreign-born populations. The table has 15 rows and 6 columns. Column headers are: Miles from shelter (Log), Hometown assoc. in precinct, Pct. Asian, Pct. Foreign-born, Pct. Black, Pct. Hispanic, Pct. 4-year BA, Pct. unemployed, HH median income, Constant, Observations, R2, Adjusted R2, Residual Std. Error (df 104), F Statistic (df 8; 104). Row labels are: With Pct. Asian (1), With Pct. Foreign-born (2). Row 1: Miles from shelter (Log), .536 (.066), .491 (.066). Row 2: Hometown assoc. in precinct, .078 (.062), .113 (.061). Row 3: Pct. Asian, .279 (.096), . Row 4: Pct. Foreign-born,, .227 (.086). Row 5: Pct. Black, .186 (.076), .203 (.080). Row 6: Pct. Hispanic, .139 (.079), .006 (.071). Row 7: Pct. 4-year BA, .120 (.089), .013 (.072). Row 8: Pct. unemployed, .184 (.065), .172 (.066). Row 9: HH median income, .003 (.071), .043 (.077). Row 10: Constant, .035 (.060), .021 (.061). Row 11: Observations, 113, 113. Row 12: R2, .522, .515. Row 13: Adjusted R2, .485, .478. Row 14: Residual Std. Error (df 104), 13.008, 13.102. Row 15: F Statistic (df 8; 104), 14.205, 13.818. The table notes that p < .1, p < .05, p < .01. All variables are z-scored (mean 0, SD 1). Model (1) corresponds to the main model; Model (2) replaces Pct. Asian with Pct. Foreign-Born.
Note: *p < .1; **p < .05; ***p < .01. All variables are z-scored (mean = 0, SD = 1). Model (1) corresponds to the main model (Table 2); Model (2) replaces Pct. Asian with Pct. Foreign-Born.
Robustness check: continuous distance to nearest hometown association replacing the binary indicator

Table A4. Long description
A table with 11 rows and 10 columns comparing vote choice across different variables. The columns are labeled as SS-17 (1) and US (2). The rows are labeled as Miles from proposed shelter (Log), Miles from nearest hometown assoc. (Log), Pct. Asian, Pct. Black, Pct. Hispanic, Pct. 4-year BA, Pct. unemployed, HH median income, Constant, Observations, R2, Adjusted R2, Residual std. error (df 104), and F statistic (df 8; 104). Each cell contains numerical values with standard errors in parentheses. Notable trends include significant values for Miles from proposed shelter (Log) in SS-17 (1), Pct. Black in both SS-17 (1) and US (2), and Pct. unemployed in SS-17 (1). The table also includes R-squared values, adjusted R-squared values, residual standard errors, and F statistics for both vote choice models.
Note: *p < .1; **p < .05; ***p < .01.
Interaction models: shelter distance × percent foreign-born Asian (Model 1) and hometown association × percent foreign-born Asian (Model 2)

Table A5. Long description
A table comparing interaction models for shelter distance and percent foreign-born Asian with vote choice. The table has 17 rows and 7 columns. Column headers are: Miles from shelter (Log), Pct. Foreign-born Asian, HA in precinct, Pct. Asian, Pct. Black, Pct. Hispanic, Pct. 4-year BA, Pct. unemployed, HH median income, Shelter Dist. Pct. FB Asian, HA Pct. FB Asian, Constant, Observations, R2, Adjusted R2, Residual std. error (df 102), F Statistic (df 10; 102). Row 1: Miles from shelter (Log), -0.018 (0.024), 0.043 (0.006). Row 2: Pct. Foreign-born Asian, -0.072 (0.136), -0.021 (0.138). Row 3: HA in precinct, -0.019 (0.012), -0.080 (0.047). Row 4: Pct. Asian, -0.145 (0.083), -0.137 (0.086). Row 5: Pct. Black, -0.358 (0.140), -0.380 (0.146). Row 6: Pct. Hispanic, -0.070 (0.051), -0.080 (0.053). Row 7: Pct. 4-year BA, -0.076 (0.067), -0.077 (0.069). Row 8: Pct. unemployed, -0.347 (0.127), -0.345 (0.132). Row 9: HH median income, 0.00000 (0.00000), 0.00000 (0.00000). Row 10: Shelter Dist. Pct. FB Asian, 0.190 (0.069), . Row 11: HA Pct. FB Asian,, 0.186 (0.129). Row 12: Constant, 0.086 (0.047), 0.069 (0.048). Row 13: Observations, 113, 113. Row 14: R2, 0.555, 0.532. Row 15: Adjusted R2, 0.511, 0.486. Row 16: Residual std. error (df 102), 0.832, 0.854. Row 17: F Statistic (df 10; 102), 12.712, 11.584.
Note: *p < .1; **p < .05; ***p < .01.
Interaction models: shelter distance × percent foreign-born Chinese (Model 1) and hometown association × percent foreign-born Chinese (Model 2)

Table A6. Long description
A table comparing interaction models for shelter distance and percent foreign-born Chinese and hometown association and percent foreign-born Chinese on vote choice. The table has 17 rows and 4 columns. Column headers are Vote choice (SS-17), Shelter FB Chinese (1), and HA FB Chinese (2). Row labels include Miles from shelter (Log), Pct. FB Chinese, HA in precinct, Pct. Asian, Pct. Black, Pct. Hispanic, Pct. 4-year BA, Pct. Unemployed, HH median income, Shelter Dist. Pct. FB Chinese, HA Pct. FB Chinese, Constant, Observations, R2, Adjusted R2, Residual std. error (df 102), and F Statistic (df 10; 102). Row 1: Miles from shelter (Log), 0.018 (0.014), 0.043 (0.006). Row 2: Pct. FB Chinese, -0.148 (0.126), -0.166 (0.128). Row 3: HA in precinct, -0.015 (0.012), -0.059 (0.035). Row 4: Pct. Asian, -0.062 (0.094), -0.039 (0.094). Row 5: Pct. Black, -0.343 (0.148), -0.426 (0.149). Row 6: Pct. Hispanic, -0.080 (0.051), -0.076 (0.052). Row 7: Pct. 4-year BA, -0.106 (0.075), -0.117 (0.076). Row 8: Pct. Unemployed, -0.347 (0.128), -0.326 (0.131). Row 9: HH median income, 0.00000 (0.00000), 0.00000 (0.00000). Row 10: Shelter Dist. Pct. FB Chinese, 0.110 (0.050), . Row 11: HA Pct. FB Chinese,, 0.162 (0.113). Row 12: Constant, 0.073 (0.043), 0.070 (0.044). Row 13: Observations, 113, 113. Row 14: R2, 0.550, 0.537. Row 15: Adjusted R2, 0.505, 0.492. Row 16: Residual std. error (df 102), 0.837, 0.848. Row 17: F Statistic (df 10; 102), 12.448, 11.852.
Note: *p < .1; **p < .05; ***p < .01.
Variance inflation factors (VIF) for the main regression model (Table 2)

Table A7. Long description
A table titled ‘Variance inflation factors (VIF) for the main regression model’ with two columns and nine rows. The columns are labeled ‘Variable’ and ‘VIF’. The rows list different variables and their corresponding VIF values. Row 1: Miles from shelter (Log), 1.321. Row 2: Hometown assoc. in precinct, 1.165. Row 3: Pct. Asian, 2.127. Row 4: Pct. Black, 1.164. Row 5: Pct. hispanic, 1.530. Row 6: Pct. 4-year BA+, 1.802. Row 7: Pct. unemployed, 1.123. Row 8: HH median income, 1.380. A note states that VIF values below 5 indicate no problematic multicollinearity and all values are well below conventional thresholds.
Note: VIF values below 5 indicate no problematic multicollinearity. All values are well below conventional thresholds.
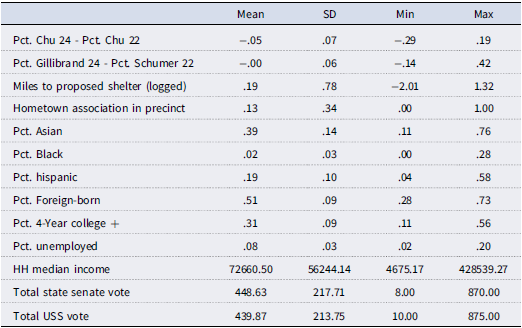
Descriptive statistics
Model variables summary statistics

Table A8. Long description
The table presents summary statistics for various model variables. It includes 12 rows and 4 columns. The columns are labeled Mean, SD, Min, and Max. The rows are labeled with different variables. Row 1: Pct. Chu 24 - Pct. Chu 22, Mean: -0.05, SD: 0.07, Min: -0.29, Max: 0.19. Row 2: Pct. Gillibrand 24 - Pct. Schumer 22, Mean: 0.00, SD: 0.06, Min: -0.14, Max: 0.42. Row 3: Miles to proposed shelter (logged), Mean: 0.19, SD: 0.78, Min: -2.01, Max: 1.32. Row 4: Hometown association in precinct, Mean: 0.13, SD: 0.34, Min: 0.00, Max: 1.00. Row 5: Pct. Asian, Mean: 0.39, SD: 0.14, Min: 0.11, Max: 0.76. Row 6: Pct. Black, Mean: 0.02, SD: 0.03, Min: 0.00, Max: 0.28. Row 7: Pct. Hispanic, Mean: 0.19, SD: 0.10, Min: 0.04, Max: 0.58. Row 8: Pct. Foreign-born, Mean: 0.51, SD: 0.09, Min: 0.28, Max: 0.73. Row 9: Pct. 4-Year college, Mean: 0.31, SD: 0.09, Min: 0.11, Max: 0.56. Row 10: Pct. unemployed, Mean: 0.08, SD: 0.03, Min: 0.02, Max: 0.20. Row 11: HH median income, Mean: 72660.50, SD: 56244.14, Min: 4675.17, Max: 428539.27. Row 12: Total state senate vote, Mean: 448.63, SD: 217.71, Min: 8.00, Max: 870.00. Row 13: Total USS vote, Mean: 439.87, SD: 213.75, Min: 10.00, Max: 875.00.
Demographic map
Percent Asian VAP (2020 Census), SD-17.






 Open access

