Low power results in an ambiguous picture stressing interpretation over observation
Vision is blurred when the eyes do not refract light rays properly on the retina. Everyone wearing glasses or lenses knows this and it is often seen most spectacularly in toddlers. Before their vision deficiency is detected, they look clumsy and less smart than other kids. Then suddenly everything changes when they get proper vision, and they rapidly become attached to their glasses.
Low statistical power is like blurred vision and it is astonishing that researchers would actively opt for such a condition (depicted in Figure 1). It makes the evidence ambiguous so that extra interpretation is needed (a.k.a. educated guessing). Still, that is what bilingualism researchers have been doing for the past 50 years. We are deliberately looking at the world around us with unfocused lenses, constantly shouting to each other that there might be something significant out there without being able to have a proper look. We even developed a very sophisticated statistical machinery to extract the most out of blurred images.
Low statistical power is like blurred vision. It prevents us from having detailed information. What is depicted here? (See the Appendix for a clearer picture).

Low power is not like jaywalking
For a long time, researchers have known about the low power of their experiments, but they thought it was a minor offence, a bit like jaywalking (Simmons, Nelson & Simonsohn, Reference Simmons, Nelson and Simonsohn2018). Their thoughts are something like: “I know it is not law-abiding, but there is no harm in it. The only person who can get hurt is me, when I fail to obtain the predicted, statistically significant effect.”
We now know that the consequences are far more serious. First, a significant effect is more likely to be a false positive finding (reflecting the null hypothesis H0) than a true positive finding (reflecting the alternative hypothesis H1) when the power of the study is low (e.g., LeBel, Campbell & Loving, Reference LeBel, Campbell and Loving2017). This can be illustrated with the following numerical example. Suppose H0 is 10 times more likely than H1 (a reasonable assumption if we are doing cutting edge research)Footnote 1. Further suppose we use alpha = .05 and power = .80. Then suppose we run 1,100 studies. ||In 1,000 studies H0 applies. Of these, 50 will be significant if we use p < .05. In 100 studies, H1 applies and we will obtain a significant effect in 80 of them (due to our power). So, when we obtain a significant effect, chances of it pointing to a true finding (H1) are 80/(50+80) = 62%. Now suppose, we run the same 1,100 studies with power = .40. Then we still have 50 significant false positives when H0 applies, but we have only 40 significant effects when H1 is valid. In other words, when we obtain a significant effect, chances that it reflects H0 [50/(50+40) = 56%] are larger than chances that it reflects H1 [40/(50+40) = 44%]. So, a significant effect is more likely to be a false positive than a true positive.
Second, when the outcome is not statistically significant, researchers have an incentive to “improve things”, by running extra participants, by trying extra analyses, by excluding data from bad participants, or by amending their hypotheses after the results are obtained (Gelman & Loken, Reference Gelman and Loken2013; Kerr, Reference Kerr1998; Simmons, Nelson & Simonsohn, Reference Simmons, Nelson and Simonsohn2011). These efforts increase the chances of finding statistical significance when there is none. As a result, they have been called questionable research practices (John, Loewenstein & Prelec, Reference John, Loewenstein and Prelec2012) and they are known to contribute to the so-called replication crisis: the observation that fewer published findings are replicated than expected on the basis of statistical considerations (Maxwell, Lau & Howard, Reference Maxwell, Lau and Howard2015; McElreath & Smaldino, Reference McElreath and Smaldino2015; Shrout & Rodgers, Reference Shrout and Rodgers2018).
Third, findings that fail to reach statistical significance are less likely to be published than significant findings, leading to the so-called file drawer problem (Rosenthal, Reference Rosenthal1979) and a biased literature (Brunner & Schimmack, Reference Brunner and Schimmack2020; De Bruin, Treccani & Della Sala, Reference De Bruin, Treccani and Della Sala2015). This is particularly true when data come from a study with low power. In case of a null effect, the spontaneous (and correct) reaction of most researchers is that “nothing can be concluded”. In contrast, when a significant finding is obtained in a low power study, researchers (wrongly) assume that they have come across a big effect (otherwise it would not have been significant as shown in the figures below) and hence a “potentially important finding”, worthwhile to be shared with the research community (Vasishth, Mertzen, Jäger & Gelman, Reference Vasishth, Mertzen, Jäger and Gelman2018). The same is true for underpowered interactions: significant interactions that make sense (i.e., confirm our beliefs) are published, and the others are discarded.
All in all, deliberately running underpowered studies and pushing to get significant effects published not only leads to a blurred, ambiguous picture (Figure 1), but is wrong in a way that swindling is wrong (as opposed to jaywalking).
What is good power? Repeated measures
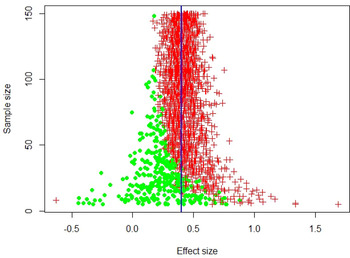
Figure 2 shows the outcome of a simulation with 2000 studies to test a typical effect size (d = .4; Brysbaert, Reference Brysbaert2019)Footnote 2 between two conditions in a repeated measures design (for instance, bilingual participants doing a task in their first and second language). The R commands for the simulation (and those for the other figures) are explained in detail in the supplementary materials, so that interested readers can adapt them to their needs. The numbers of participants per study differ from 5 to 150. Looking at the figure, most people would agree that a sample of 100-120 participants is a decent target: it allows you to get a pretty good estimate of the effect size in each study and the effect is always statistically significant. In contrast, sample sizes of less than 30 give a very blurry picture. You get divergent estimates of the effect size in different studies, and the effect size is seriously overestimated when you find statistical significance. As it happens, the correct conclusion (that there is a significant effect of d = .4) is almost never obtained in an experiment with fewer than 30 participants. So, running such a study more often increases the ambiguity in the literature instead of decreasing it. Remember that, if you run only one study, you do not have the advantage of the bird's eye view shown in Figure 2. All you have is a single data point that can range from d < -.5 to d > 1.0 and is or is not statistically significant. On the basis of this single data point you draw theoretical conclusions. Also notice the small-size study with a significant effect in the opposite direction (entirely due to sampling error), which could seriously complicate the literature if published (Gelman & Carlin, Reference Gelman and Carlin2014).
Outcome of 2000 experiments trying to estimate a typical standardized effect size in psychology (d = .4, indicated by the blue vertical line) in a within-participants design with two conditions and participants taking part in both. Each symbol describes the outcome of a single study. It shows how large the effect was in the study and how many participants took part (ranging from 5 to 150). + signs indicate experiments with a statistically significant finding (p < .05); o signs indicate experiments that failed to reach significance.

Unfortunately, many researchers do not have Figure 2 in mind when they design a study (also known as a funnel plot; Sterne, Becker & Egger, Reference Sterne, Becker, Egger, Rothstein, Sutton and Borenstein2005). All they think of is the amount of work required for their study and how to get away with the smallest possible sample size (building on a tradition of similar sizes). As a result, sample sizes are more often closer to 20 than to 100.
Designs involving a between-groups variable require more participants, also for interactions with a repeated measure
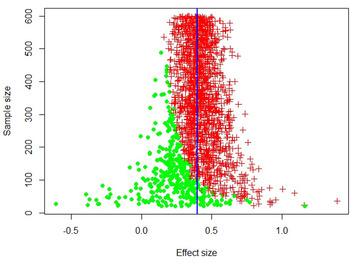
Researchers on bilingualism have the extra complication that they often want to compare two groups of people: bilinguals versus monolinguals, or bilinguals with different degrees of proficiency. For instance, many articles have been published on the question of bilinguals having better executive control than monolinguals (for recent reviews, see Lehtonen, Soveri, Laine, Järvenpää, De Bruin & Antfolk, Reference Lehtonen, Soveri, Laine, Järvenpää, De Bruin and Antfolk2018; Paap, Mason, Zimiga, Silva & Frost, Reference Paap, Mason, Zimiga, Silva and Frost2020). As is generally known, research between groups requires more participants. Figure 3 gives the same information as Figure 2, but now in a design that compares two groups of people. For such research, we easily need 300+ participants (150 per group) if we want to get a stable, clear picture. Notice how bad the situation is for sample sizes smaller than 100 (50 per group)! Still, of the 1004 studies reviewed by Lehtonen et al. (Reference Lehtonen, Soveri, Laine, Järvenpää, De Bruin and Antfolk2018) 878 had sample sizes smaller than 50 participants per group (i.e., 87%) and 987 had sample sizes smaller than 100 (98%).
Outcome of 2000 experiments trying to estimate a typical standardized effect size in psychology (d = .4, indicated by the vertical blue line) in a between-groups design with two conditions. Each symbol describes the outcome of a single study. It shows how large the effect was in the study and how many participants took part in the study (ranging from 20 to 600; 10-300 per condition). + signs indicate experiments with a statistically significant finding (p < .05); o signs indicate experiments that failed to reach significance.

In large-scale replication attempts it has been found that in particular between-groups manipulations are difficult to replicate. This is understandable given the large sample sizes needed for unambiguous evidence (Figure 3).
What is generally not known is that Figure 3 also applies to a design in which a within-participants effect is compared across two groups, a so-called split-plot design. For instance, Kim (Reference Kim2020) compared Spanish heritage speakers with Spanish monolinguals on the processing of Spanish words that differed on the position of the lexical stress (penultimate or final syllable). In such a 2×2 design, the interaction has similar power requirements as the main effect of the between-groups variable (speaker group). This can be understood if you know that the interaction effect boils down to a between-groups t-test of the difference scores (e.g., Judd, McClelland, & Ryan, Reference Judd, McClelland and Ryan2008). Try it out. Take the differences scores between the two within-participants conditions per participant (e.g., responses to words with final stress minus responses to words with penultimate stress) and run a between-groups one-way ANOVA on the difference scores. You will get the same F-value as the F-value of the interaction in the 2×2 design.
Because interactions between repeated measures and between-groups variables resemble comparisons between independent groups, it is to be feared that they will fare badly in replication attempts too, which is bad news for bilingualism research. As it happens, the situation is even more demanding than in Figure 3: because we not only want significant interactions, but interactions that agree with the model underlying the analysis. So, if the effect size for group 1 is d = .4 and the effect size for group 2 is d = .0, we not only want a significant interaction, but also a significant difference in the pairwise comparison for group 1 and no significant difference for group 2.
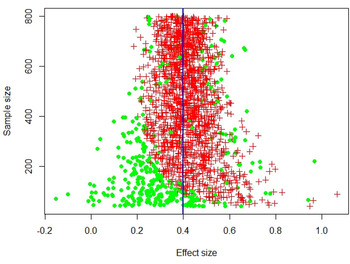
Figure 4 shows how often we obtain the required pattern as a function of the number of participants tested. As expected, it looks much more like Figure 3 (between-groups effect) than like Figure 2 (within-participants design). The situation is even slightly worse, because we have studies without the full pattern for large numbers of participants, in line with the fact that interactions (involving a comparison of two difference scores) include more noise than main effects (involving only one difference score). It may be worthwhile to stress that the lowest sample size (the worst) already includes 40 participants; that is 20 per condition!
Outcome of 2000 experiments trying to estimate the outcome of a 2×2 split-plot design, in which group 1 has an effect size of d = .4 and group 2 has an effect size of d = .0. Each symbol describes the outcome of a single study. It shows how large the interaction effect was in the study and how many participants took part in the study (ranging from 40 to 800; 20 to 400 per condition). + signs indicate experiments with a statistically significant interaction (p < .05), a statistically significant main effect for group 1 (p < .05) and no significant effect for group 2 (p > .05); o signs indicate experiments that failed to reach the pattern (for large sample sizes mostly because the effect in group 2 was significant). Remember that if you run only one study, you have only one data point and nothing to compare with. This is particularly a problem for sample sizes below 100 (50 per group), where the results cover all the range from -0.2 to +1.2 and rarely include the right conclusion (a significant interaction effect because one group has an effect of d = .4). Unfortunately, small sample sizes are the default option in the vast majority of studies on bilingualism.

You also need more observations for interactions of within-participant variables
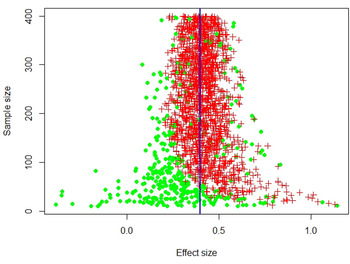
Also fully within-participant designs require more observations for interactions than for main effects (although thankfully not as many as an interaction with a between-groups variable). The effect size of an interaction is only as big as that of a main effect when the interaction is fully crossed: so, for an interaction of d = .4 in a 2×2 repeated measures design, you need d = +.4 for variable B at one level of variable A and d = -.4 at the other level. This pattern is virtually never expected. What is more likely is an effect of d = .4 at one level of variable A and no effect at the other level. This, however, effectively halves the effect size, meaning that you need four times as many participants (Brysbaert, Reference Brysbaert2019; Perugini, Gallucci & Costantini, Reference Perugini, Gallucci and Costantini2018; Simonsohn, Reference Simonsohn2014). Furthermore, we not only want a significant interaction, but we also want to see a significant pairwise comparison for B at the level of A known to show the effect, and no significant pairwise comparison at the level known not to have the effect. This requires extra participants. Figure 5 shows how often we obtain the expected pattern as a function of total sample size. As you can see, there is much noise below sample sizes of 100. Even above this sample size you do not always find the expected pattern, mostly because there is an effect of B at the A level where no effect is expected.
Outcome of 2000 experiments trying to estimate the outcome of a 2×2 repeated measures design, in which variable B has an effect size of d = .4 at the first level of variable A and no effect size at the second level of A. Each symbol describes the outcome of a single study. It shows how large the interaction effect was in the study and how many participants took part in the study (ranging from 10 to 400). + signs indicate experiments with a statistically significant interaction (p < .05), a statistically significant main effect for variable B at the first level of variable A (p < .05) and no significant effect of variable B at the second level of variable A (p > .05); o signs indicate experiments that failed to reach the pattern. Remember that if you run only one study, you have but one data point and nothing to compare with.

Multiple stimuli per condition
So far, the discussion was limited to designs with one (summary) variable per participant per condition. In bilingualism research we often have many observations per condition and we want to generalize across stimuli as well as across participants. For instance, if we want to compare the word frequency effect in first and second language, we will present more than one low-frequency word and one high-frequency word in each language. The analysis of such datasets is increasingly done with linear mixed effects (LME) models.
At present, there is a dearth of information on the power of designs with multiple observations per participant per condition (see Brysbaert & Stevens, Reference Brysbaert and Stevens2018) and the present short report precludes further discussion. However, simulations suggest that, as a general rule of thumb, the numbers mentioned so far also work for reaction time studies with 40 or more observations per condition.
Discussion
In the introduction we argued that investigating scientific issues with underpowered studies is like looking at scenes with bad lenses (Figure 1). It increases the weight of interpretation over that of observation. As a result, statistical tests lose their power to decide between likely and unlikely hypotheses and are reduced to a rhetoric prop, shoring up claims that look sensible to the researchers (and the reviewers).
The situation looks particularly dire for between-groups comparisons and for interactions. For these effects it is to be feared that a substantial percentage of significant findings published in the literature are false alarms due to an alpha rate of 5%. The risk is augmented by the fact that complex designs easily include several interaction effects, so that false positives are prevalent if no correction for multiple testing is made (analyses involving 20 interaction terms are on average expected to yield one significant effect on the basis of sampling error alone). The risk may further be augmented by the use of questionable research practices and the fact that researchers often have considerable freedom in which dependent variables to analyze and which analyses to use (Gelman & Loken, Reference Gelman and Loken2013; Von der Malsburg & Angele, Reference Von der Malsburg and Angele2017).
Whereas the probability of false alarms is very similar for main effects and interaction effects, obtaining a genuine effect requires many more participants for interactions than for main effects. A sensible rule of thumb is four times as many. This means that genuine interaction effects will often be insignificant in studies with small numbers of participants and remain undetected if the researcher has no particular interest in them. This is particularly true for interactions with a between-groups variable.
Finding a significant interaction is one thing, being able to replicate it is another, because what we want is to replicate the same pattern of effects. If the significant interaction was due to a significant effect at A1 and not at A2, we want to replicate not only a significant interaction, but also the same pattern of effects. This is particularly a problem for complicated, higher-order interactions. Herzog, Francis, and Clarke (Reference Herzog, Francis and Clarke2019, pp. 91-93) illustrate how the power of exact replications of complex interactions can be rather low and sometimes cannot be improved by running extra participants.
Given what we know now, it is clear that we have to step up our game if we want research on bilingualism to be more than an endless quarrel about exciting, new, significant observations that others find difficult to replicate. The solutions are not overly complicated; they just require us to organize our work differently (see also Brysbaert, Reference Brysbaert2019). These are some suggestions.
– Keep your design as simple as possible. Each extra variable multiplies the number of participants you have to test. This is particularly important if you are testing a small or difficult to reach population.
– Organize the work so that more participants can be tested, for instance by collaborating with many labs (ManyBabies Consortium, 2020) or by using online testing (Nichols, Wild, Stojanoski, Battista & Owen, Reference Nichols, Wild, Stojanoski, Battista and Owen2020).
– If the data are variable (e.g., reaction times), test participants more thoroughly, so that you get reliable effects at the participant level.
– Be happier with one properly powered study than with 10 underpowered studies, which mainly increase the noise in the literature.
– Do not accept hopelessly underpowered studies as reviewer or editor, even though the finding is exciting and was predicted by the authors. Ask for a well-powered, preregistered replication, which you will publish independent of the outcome.
Supplementary materials
A file describing the simulations with R code to reproduce them is available at https://osf.io/t7f2n/.