Introduction
Weed management is critical for achieving a high crop yield (Oerke Reference Oerke2006). There are many ways to control weeds: chemical, mechanical, biological, thermal, and cultural. Among them, chemical and mechanical means are the most commonly used methods (McErlich and Boydston Reference McErlich and Boydston2014). Chemical weed control is usually biologically efficacious and economically effective, but it has high impacts on the environment along with decreased efficacy due to evolved herbicide resistance. Increasing concerns about agricultural sustainability and a steadily increasing conversion to organic farming have driven the adoption of mechanical weed control tactics worldwide. In Canada, mechanical weed control is a well-established practice in small- and medium-acreage organic horticulture crop production systems in central and coastal regions (Frey and Entz Reference Frey and Entz2014). At the same time, organic producers in the Canadian Prairies rely heavily on crop rotation and cultural weed control methods in large-scale farms growing mainly cereals, oilseed, and pulse crops (Frick Reference Frick2005). These large organic grain operations require a weed solution that provides effective weed control, uses resources efficiently (time and cost), and meets soil conservation requirements, which have hindered the adoption of mechanical weed control in the Prairies (Johnson et al. Reference Johnson, Thomas, Leeson, Shirtliffe and Brandt2011). This study aimed to bridge this gap through field testing of a spring-tine harrow for weed control in a cereal crop.
Crops planted in rows may often require both between-row and in-row weeding. Between-row weeds in row-crop systems can be dealt with through hoeing, but in-row weeds remain a challenge for mechanical weeding due to potential damage to the crop. Several types of weeders have been developed and tested for in-row weeding, such as torsion weeders, brush weeders, and finger weeders (Cloutier et al. Reference Cloutier, Van der Weide, Peruzzi and Leblanc2007). Among them, the spring-tine harrow is capable of both between-row and in-row weeding (Pannacci et al. Reference Pannacci, Tei and Guiducci2017). However, tine harrowing has shown low efficacy against certain weeds, such as grasses (Pardo et al. Reference Pardo, Cirujeda, Aibar, Cavero and Zaragoza2008) and well-established weeds (Pannacci et al. Reference Pannacci, Tei and Guiducci2018). Also, it poses a high-level risk of crop damage, because the crop is exposed to the same level of mechanical action as the weeds (Rasmussen and Svenningsen Reference Rasmussen and Svenningsen1995).
Weeding performance indicators of a spring-tine harrow include weeding effectiveness and selectivity (the ratio of weed control over crop damage). Weeding effectiveness is often assessed by measuring weed-related traits, such as weed density, biomass, and cover, and selectivity is evaluated by determining crop-related traits, such as plant height, density, biomass, and yield. Tine weeding efficacy has been shown to vary with many factors, such as weed density and growth stage (Rasmussen Reference Rasmussen1992), timing and frequency (Dastgheib Reference Dastgheib2003), tillage system (Kurstjens Reference Kurstjens2007), and travel pattern (Johnson and Davis Reference Johnson and Davis2015). Weeding effectiveness and selectivity often require different implement settings and operational conditions for maximal results (Duerinckx et al. Reference Duerinckx, Mouazen, Anthonis and Ramon2005). It is therefore important to find a balance between the two indicators for the optimal overall performance of spring-tine harrows.
When using harrows for mechanical weeding, uprooting and burial of weeds are the primary modes of weed killing (Kurstjens et al. Reference Kurstjens, Perdok and Goense2000). Previous harrowing studies showed that uprooted weeds (covered or not) had a mortality rate of 47% to 61% compared with 1% to 17% if weeds were buried but not uprooted (Kurstjens and Kropff Reference Kurstjens and Kropff2001). Another study suggested that the tine harrow does not kill the weeds, but instead acts by moving soil that may crush and bury weeds (Rasmussen et al. Reference Rasmussen, Mathiasen and Bibby2010). Understanding soil disturbance patterns of tine harrows and linking patterns to the weeding performance are therefore important to optimize the design and use of spring-tine harrows. This study was conducted to link soil dynamics and weeding performance of spring-tine harrows.
Most previous studies on mechanical weeding focused on weed kill in field conditions. Duerinckx et al. (Reference Duerinckx, Mouazen, Anthonis and Ramon2005) pointed out that it is important to focus first on the action of harrow tines in the soil without plants to minimize biological variances before conducting field experiments. Controlled environment tests permit more control over experimental treatments, such as precise implement adjustment, and allow researchers to measure detailed soil disturbance characteristics, such as soil displacement and working depth that may impact weeding performance. Soil cutting forces required to operate a tine harrow are important information for the design and management of agricultural equipment. Therefore, both the amount and type of soil disturbance and their influence on weeding efficacy, as well as associated soil cutting forces, need to be investigated to optimize the overall performance of a mechanical weeder.
Spring-tine harrows offer an alternative method for weed control in cereal grain production. However, how soil disturbance characteristics resulting from spring-tine harrow action are associated with weeding performance has been lacking in the literature. This study (1) assessed the effects of travel speed and spring-loading setting on the working depth, soil displacement, and soil cutting force resulting from spring-tine harrow action in a controlled setting; and (2) evaluated the effects of spring-loading setting and weeding timing on the weeding performance and crop damage for a wheat (Triticum aestivum L.) crop under field conditions.
Materials and Methods
Description of the Spring-Tine Harrow
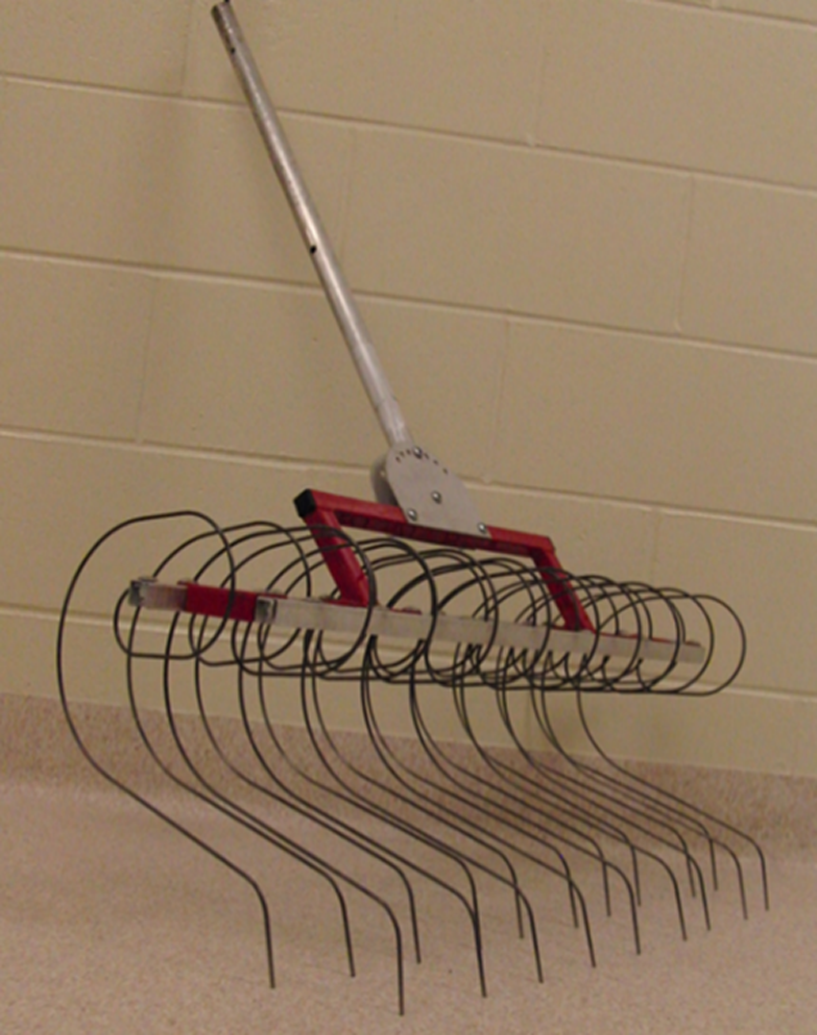
The spring-tine harrow (Figure 1) examined was a lightweight weeder with flexible tines of 3.2 mm in diameter and 14.5 N m−1 in stiffness. A total of 19 tines were arranged in two ranks and staggered. The two ranks were spaced at 90 mm. The tine spacing was 38 mm, which gave a total harrow width of 722 mm. A mounting bar was designed to attach the harrow to a pulling mechanism for lab and field tests. The bar was inclined at a 45° angle, which allowed the tines to rest evenly on the horizontal plane.
Spring-tine harrow used in the experiments.

Controlled Setting Study
Soil Bin Test Setup
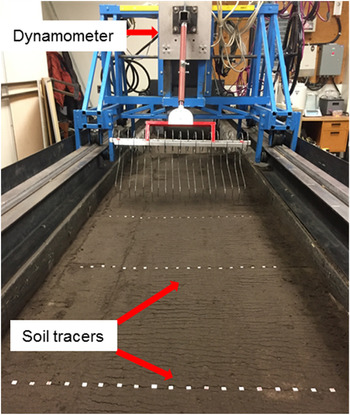
An indoor soil bin experiment was conducted at the Department of Biosystems Engineering, University of Manitoba, Canada. The harrow was mounted on the tool carriage of the soil bin through a dynamometer (Figure 2). The soil bin was 0.91-m wide and 10-m long and filled with a sandy loam soil composed of 70% sand, 16% silt, and 14% clay. The soil was thoroughly tilled, leveled, and compacted before each test to ensure a consistent initial soil condition. The average gravimetric moisture content was 16.2 ± 1.3% (dry basis), and the average bulk density was 1030 ± 0.12 kg m−3 measured using the soil core and oven-drying method at 105 C for 24 h (ASABE 2015). The soil shear strength was 2.3 ± 0.2 kPa, and the penetration resistance of the soil surface was 51.3 ± 7.8 kPa, measured using a Geotechnics geovane tester (Humboldt Manufacturing, 875 Tollgate Road, Elgin, IL 60123, USA) and a Geotester pocket penetrometer (Zoli Maurizio, via de Gasperi 10, Alfonsine 48011, Italy), respectively.
Soil bin test setup.

Experimental Design
A completely randomized factorial design was used for the soil bin experiment. The treatments were four different travel speeds (4, 6, 8, and 10 km h−1) combined with three different spring-loading settings of the harrow (low, medium, and high). The speeds were selected based on speed ranges in the literature (Cirujeda et al. Reference Cirujeda, Melander, Rasmussen and Rasmussen2003; Duerinckx et al. Reference Duerinckx, Mouazen, Anthonis and Ramon2005). The three spring-loading settings (low, medium, and high) were fixed by lowering the harrow frame 50, 100, and 150 mm after the tine tips touched the soil surface, which was equivalent to applied loads of 14, 28, and 42 N, respectively. Each treatment was replicated four times, which resulted in a total of 48 test runs.
Measurements
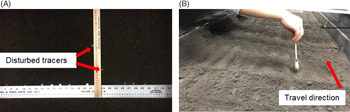
The draft and vertical forces of the harrow were measured using a plate dynamometer (Figure 2). The average value of the measured forces within the central 2-m region where the harrow traveled at constant preset speeds was calculated and reported. The soil displacement was measured using the soil-tracer method (Rahman et al. Reference Rahman, Chen and Lobb2005). A total of 57 numbered aluminum tracers (10-mm cube) were divided into three rows of 19 each (Figure 2). All three rows were located in the constant velocity region of the path. The adjacent tracers were evenly spaced at 38 mm, which was the same as the tine spacing. The tracers were pushed into the soil until their tops were flush with the soil surface. The original coordinates of the tracers were recorded. After the harrow was run, the coordinates of disturbed tracers were measured using two perpendicular rulers (Figure 3A). The soil forward displacement was calculated as the difference between the coordinates before and after the harrowing along the travel direction and averaged over the 57 tracers. Similarly, the soil lateral displacement was measured along the width of the soil bin. Then, the disturbed soil was carefully brushed away to expose the soil furrow bottom (Figure 3B). The distance from the furrow bottom to the original soil surface was measured at 10 subsampling points that were randomly distributed within the measured region. The working depth was averaged over the 10 data points.
Soil bin test measurements: (A) measuring disturbed tracer location for soil displacements; (B) excavating loose soil for measuring working depth.

Field Testing
Field-Test Setup
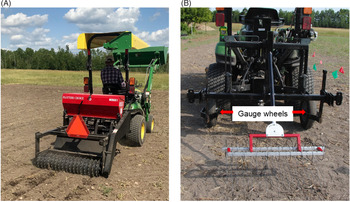
Two field experiments were carried out in 2019 and 2020 at a farm in Piney, Manitoba, Canada (49.12°N, 96.13°W), which is located in the Canadian Prairies. The soil was Sprague Series loamy sand composed of 79% sand, 19% silt, and 2% clay. Before the tests, the field was thoroughly tilled to achieve a weed-free condition and leveled to create a smooth soil surface. Field conditions, including soil moisture content and bulk density, were measured using the soil core and oven-drying method at 10 random locations across the field. Wheat (‘AAC Brandon’; class: Canada Western Red Spring) was planted using a four-row seeder (Plotters Choice, Kasco Manufacturing, 170 W 600 N, Shelbyville, IN 46176, USA) at a row spacing of 254 mm (Figure 4A). The seeding rate was 112 kg ha−1, and the target seeding depth was 51 mm, as recommended by Manitoba Agriculture (2019). The wheat was planted on August 1 in 2019 and on June 15 in 2020.
Field-test setup: (A) wheat planting using a four-row seeder; (B) the mounting frame between the harrow and the tractor three-point hitch.

For weeding, the harrow was mounted on the tractor three-point hitch through a mounting frame supported by two gauge wheels (Figure 4B). The gauge wheels were used to change the harrow frame height for different spring-loading settings. The harrow was pulled at a constant speed of 7 km h−1, which was the average value of the four speeds used in the soil bin test. The factor of speed was not included in the field tests based on the soil bin test results, which will be discussed later.
Experimental Design
Each field experiment was a randomized complete block design with treatment levels replicated across four blocks in 2019 and five blocks in 2020. The three spring-loading settings (low, medium, and high) were combined with three different weeding timings (early, middle, and late), producing a total of nine factorial combinations of treatments. The control was not weeded after the planting. The block design was used to minimize the random effect of weed distribution uniformity, because weed patches had been observed in the field in the past. The three weeding operations occurred at 9, 22, and 36 d after planting (DAP) in 2019 and at 8, 20, and 33 DAP in 2020, corresponding to the early, middle, and late weeding. The weeding timings were determined based on the crop growth stages, which were 12, 22, and 30 on the Zadoks scale (Zadoks et al. Reference Zadoks, Chang and Konzak1974). Each block comprised a full set of nine factorial treatment combinations and one control plot. Each plot had a length of approximately 35 m and a width of 1 m, consisting of four rows of the crop. In total, 40 and 50 plots were included in the 2019 and 2020 tests, respectively.
Measurements
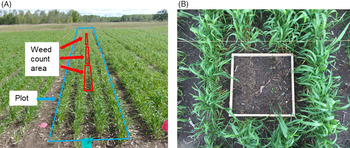
Field measurements were identical in the 2019 and 2020 experiments. Weed population density was counted both before and immediately after the weeding operations on the three aforementioned dates. The counting was conducted in an area between the central two crop rows and of a length of 4.5 m (Figure 5A). Three weed-counting areas were chosen randomly in each plot, at least 10 m away from all sides of the field. Weed control efficacy was calculated as the average percentage of weed killed to the original weed counts of that plot before weeding operations using the following equation:
 $\eta = {1 \over 3}\mathop \sum \nolimits_{i = 1}^3 \left({{{N_{bi}} - {N_{ai}}} \over {{N_{bi}}}}\right)*100\% $
where η is weed control efficacy (%), N bi is weed count before the harrowing at count region i, and N ai is weed count after the harrowing at count region i.
Field-test measurements: (A) weed-counting areas; (B) crop biomass sampling.

Crop damage was indirectly monitored by measuring crop biomass. Crop yield was not determined because there were not sufficient growing degree days for plants to grow to maturity. The crop aboveground biomass was harvested within a 500 by 500 mm quadrat (Figure 5B). Three subsamples were removed in random locations within each plot away from the weed-counting areas. The collected plant samples were then oven-dried at 55 C for 72 h (ASABE 2012). Harvesting was conducted for all plots at 2 wk after the late weeding operation. The final weed population was counted at the same time for all plots. The crop biomass and final weed density per unit area were calculated using their corresponding sampling areas. Weed biomass was not measured, because similar weed growth stages were observed across the field. Weed growth stage at each field operation was monitored.
Data Analyses
Working depth, soil cutting forces, soil displacements, weed control efficacy, final weed density, and crop damage data were analyzed with ANOVA using the PROC GLM in SAS v. 9.4 (SAS Institute, 100 SAS Campus Drive, Cary, NC 27513, USA) to examine the main effects of the experimental factors, including travel speed, spring-loading setting, and weeding timing, as well as their interaction effects. Treatments were considered fixed factors, while block was treated as a random factor. Field-test data for the 2 yr were analyzed separately due to the differences in season and field conditions. Soil moisture level at different dates of field weeding operations was used as a covariate in the analyses. The assumptions of ANOVA were tested using Levene’s test and the normality test to ensure that the prerequisites for the statistical analysis were fulfilled. The means among treatments were compared with Duncan’s multiple-range test at a significance level of 0.05.
Results and Discussion
There were no interactions among travel speed, spring-loading setting, and weeding timing for all measured attributes in the soil bin and field tests. Therefore, all data were presented as the main effects. The final weed density and crop biomass in the control group of the two field tests were also included in the comparison.
Soil Bin Testing Results
Working Depth
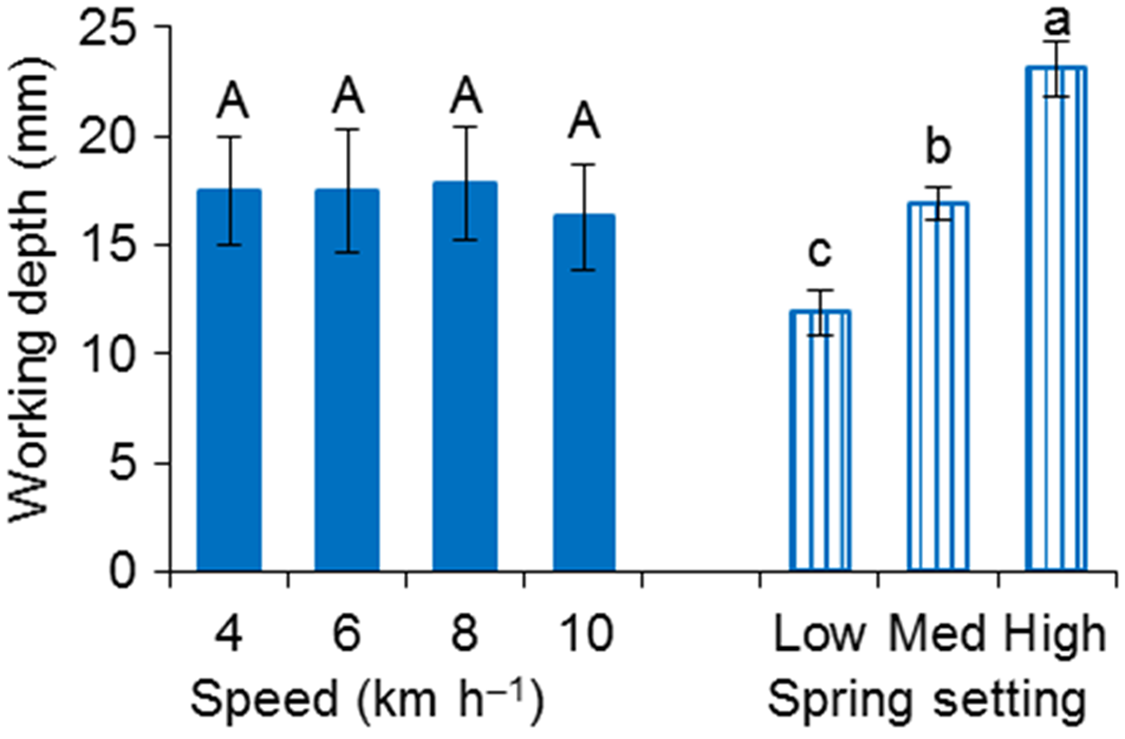
The travel speed did not impact the working depth. The soil working depth increased as the harrow spring loading increased (Figure 6). The high loading setting resulted in the greatest soil working depth of 23.1 mm, which was almost more than double that at the low loading (11.9 mm). The soil working depth at the high loading setting was 37% greater than that at the medium setting. The relationship between the depth and the spring-loading setting was expected, because the two are closely related. However, the working depth was always much less than the depth that the frame was lowered to when setting different spring levels. This demonstrated that a great level of bending occurred in the tines due to the downward pressure. On average, the soil working depth was 17.3 mm across the treatments.
Working depth of the spring-tine harrow at different speeds and spring-loading settings; means followed by different lowercase or uppercase letters are significantly different according to Duncan’s multiple-range test at a significance level of 0.05; error bars are standard deviations.

The working depth is an important performance indicator in mechanical weed control, as it indicates maximum weed uprooting. The deeper the working depth, the greater the weed uprooting efficiency. For example, an increase in working depth from 10 to 30 mm of a tine harrow doubled the average fraction of uprooted plants (Kurstjens et al. Reference Kurstjens, Perdok and Goense2000). Previous studies also showed significant positive correlations between the working depth and the amount to which weeds were covered with soil (Sogaard Reference Sogaard1998), as well as between the amount of soil covering and weed control (Rasmussen Reference Rasmussen1990). For instance, a 10-mm increase in tine working depth resulted in weed biomass reductions ranging from 121.3 to 153.8 kg ha−1 (Barberi et al. Reference Barberi, Silvestri, Peruzzi and Raffaelli2000). Therefore, high spring loading would be desired regardless of the travel speed for optimized weed-harrowing performance. On a practical note, crop seedlings that are shallowly seeded could be negatively affected by aggressive spring-loading settings if the resulting soil working depth exceeded the seeding depth.
Soil Cutting Forces
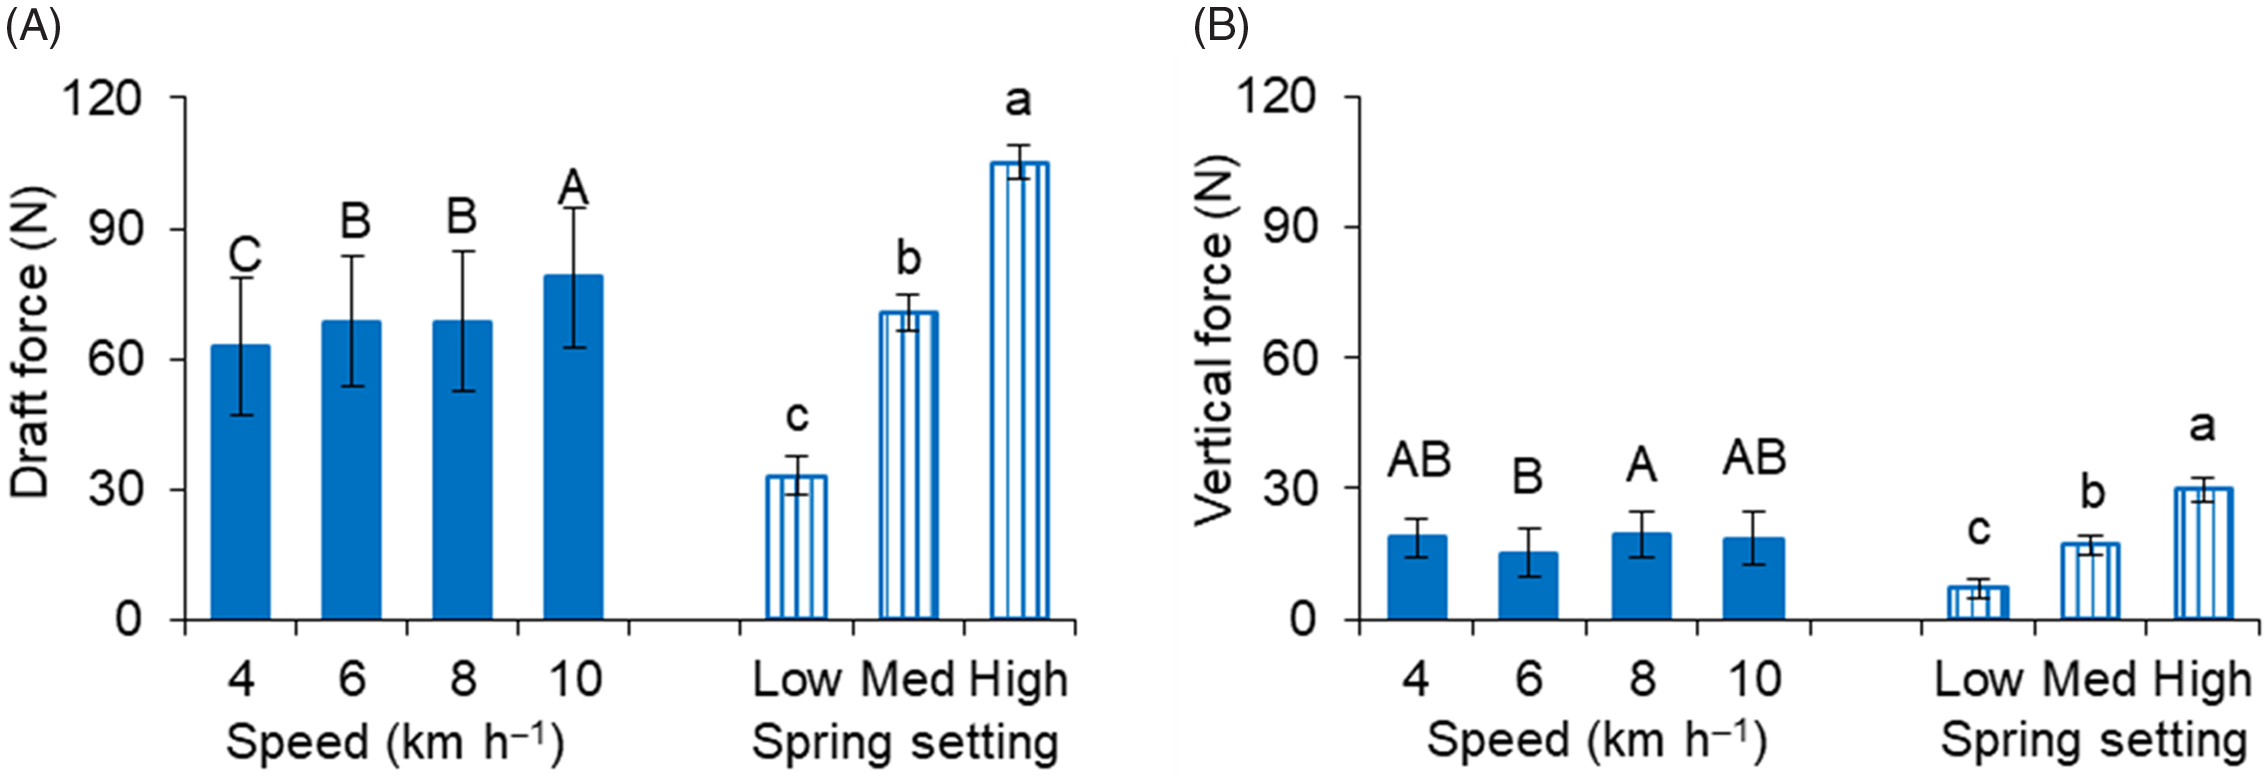
Soil cutting forces were affected by both travel speed and spring-loading setting (Figure 7). The draft force increased by 9% and 15% as the speed increased from 4 to 6 km h−1 and from 8 to 10 km h−1, respectively (Figure 7A). This was consistent with the soil dynamic theory of draft force increasing with travel speed (McKyes Reference McKyes1985). The draft force dramatically increased from 33.2 to 105.2 N as spring loading increased from low to high. This was attributed to the increased soil working depth at higher spring loadings. The spring loading had a greater impact than speed. The draft force is a major indicator of the horsepower needed to pull the implement. The maximum draft measured was 119.5 N at the speed of 10 km h−1 with the high loading setting. Given the width of the weeder, the power required to pull a 1-m-wide spring-tine harrow would be 0.62 horsepower. This result has important implications for developing a field-scale spring-tine harrow for mechanical weeding.
Soil cutting forces of the spring-tine harrow at different speeds and spring-loading settings: (A) draft force and (B) vertical force; means followed by different lowercase or uppercase letters are significantly different according to Duncan’s multiple-range test at a significance level of 0.05; error bars are standard deviations.

All vertical forces were in an upward direction. No particular trend was found for the effect of the speed, whereas the spring-loading setting was positively correlated to the vertical force (Figure 7B). The speed of 8 km h−1 resulted in the maximum vertical force of 19.4 N, which was greater than that of 6 km h−1. The reasons for this were unknown. The vertical force doubled as the spring loading increased from low to medium, and further increased by 76% as the loading increased from medium to high. The increasing relationship between the vertical force and the spring loading was expected, because increasing the loading would result in a larger vertical force. The effects of spring loading on the soil cutting force were very similar between the horizontal and vertical directions. However, the average vertical force of 18 N was much smaller than the average draft force of 70 N.
Soil Displacements
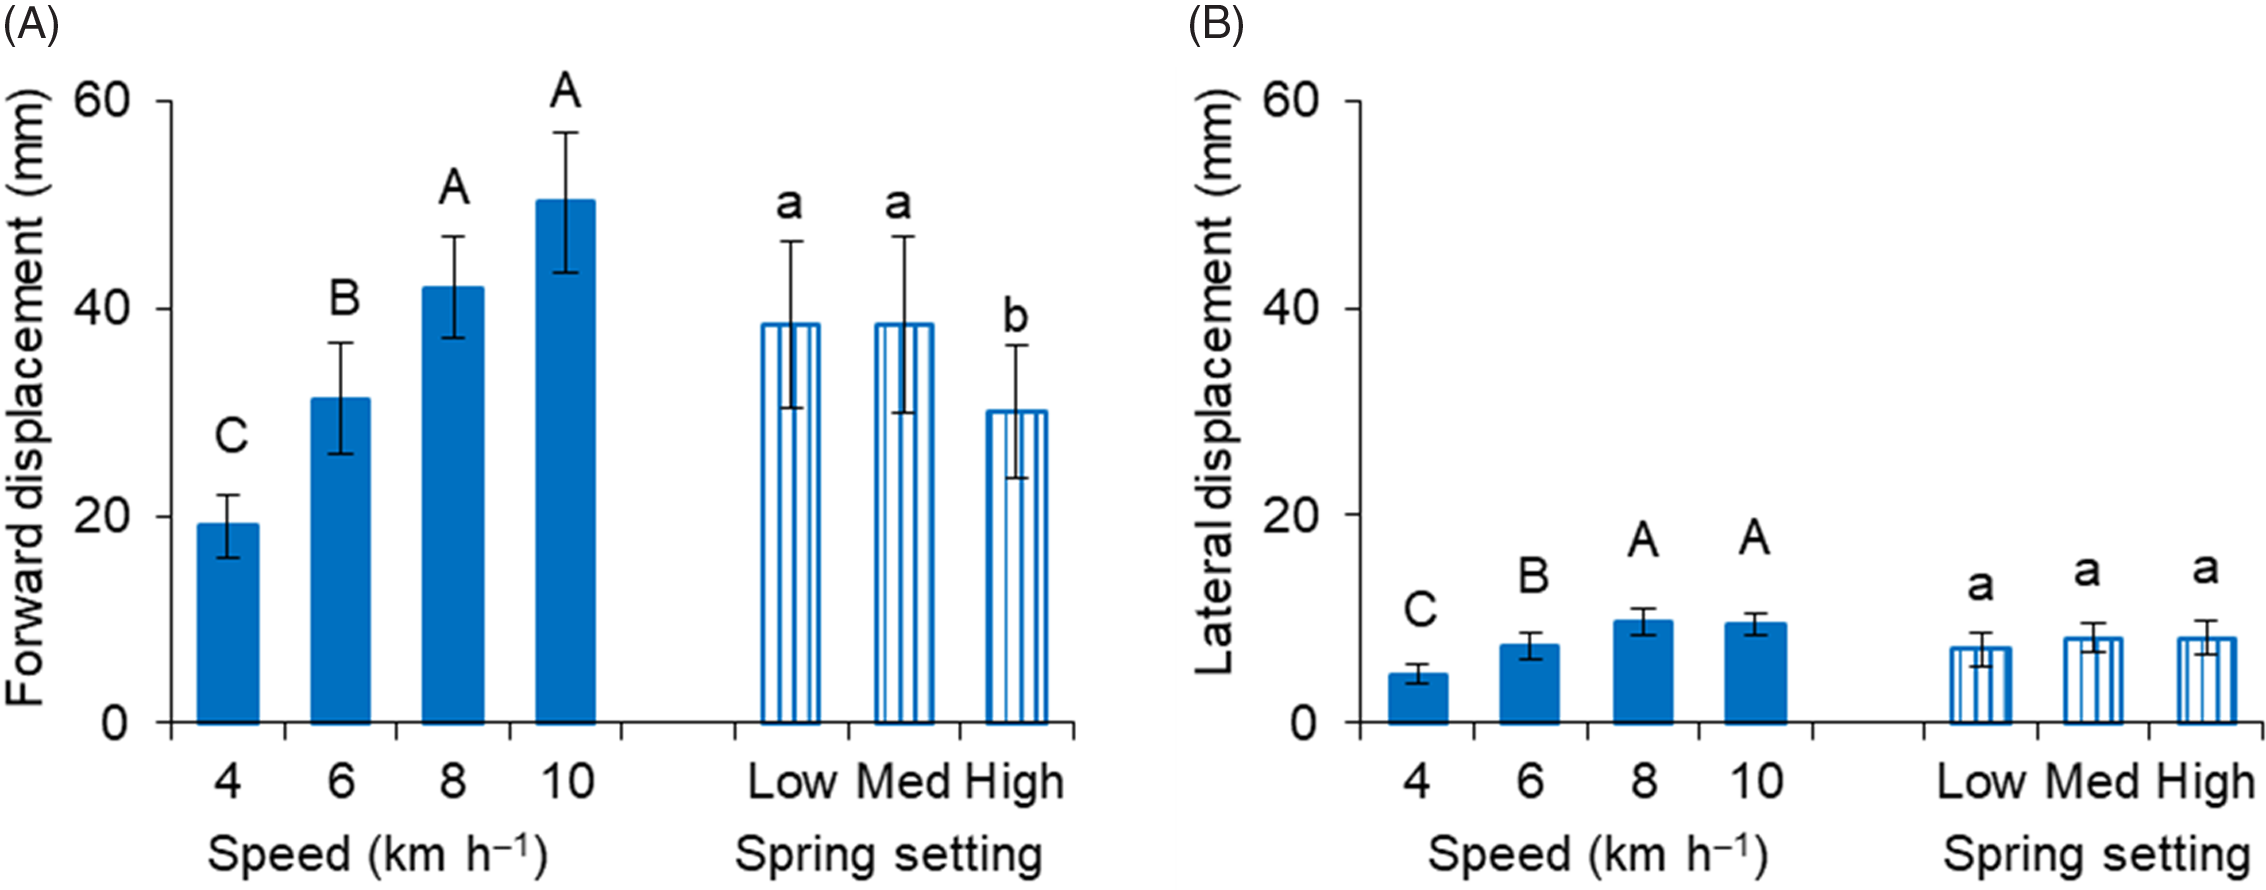
The forward displacement increased as the speed increased, and it decreased as the spring loading increased (Figure 8A). For example, the tine weeder disturbed soil 19 mm along the travel direction at the speed of 4 km h−1, which increased to 31.3 and 42.0 mm as the speed increased to 6 and 8 km h−1, respectively. The soil forward displacement increased to 50.2 mm as the speed increased to 10 km h−1, which was similar to the displacement measured at 8 km h−1. The soil forward displacement declined by 22% as the spring loading increased from medium to high level.
Soil displacements of the spring-tine harrow at different speeds and spring-loading settings: (A) forward displacement and (B) lateral displacement; means followed by different lowercase or uppercase letters are significantly different according to Duncan’s multiple-range test at a significance level of 0.05; error bars are standard deviations.

The lateral displacement also showed an increasing trend as the speed increased (Figure 8B). The lateral displacement increased from 4.7 to 7.4 mm as the speed increased from 4 to 6 km h−1, and further increased to 9.8 mm as the speed increased to 8 km h−1. The lateral displacement ranged from 7.1 to 8.2 mm as the spring loading varied. The average soil forward displacement was four times higher than that in the lateral direction. The effect of the speed on the soil displacements was more dominant than that of the spring-loading setting.
Soil displacement is associated with the weed control method of burial, which is accomplished by covering weeds with a layer of soil, and thus depriving them of air and sunlight. The greater the level of the soil displacement, the greater the chance of weeds being buried. A consideration that must also be made, however, is that the crops will also be negatively affected by burial. The effect of speed on soil displacement agreed with the previous finding that an increase of speed from 4 to 8 km h−1 increased the percentage of weeds being covered by disturbed soil (Kurstjens and Perdok Reference Kurstjens and Perdok2000). Other studies suggested that burial depth rather than the distance of soil disturbance should be the reference parameter for harrowing intensity, because burial depth was well correlated with weed control and crop yield (Rasmussen Reference Rasmussen1991a; Rydberg Reference Rydberg1993). In this study, greater speeds showed a more spreading soil disturbance pattern than lower speeds, because soil displacements were greater with a similar working depth, which suggested greater speed might not always be optimal if burial depth is of major concern.
Field-Testing Results
Field Conditions
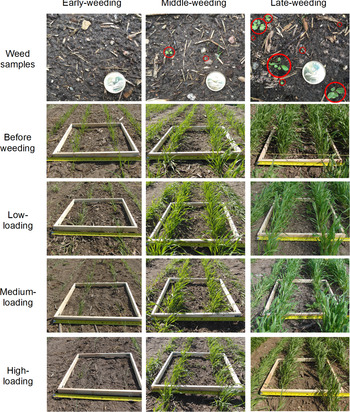
Field conditions, including soil, weed, and crop, are summarized in Table 1. Soil moisture and bulk density were similar between the 2 yr. The soil was dry at the time of planting and gradually gained moisture through multiple natural rainfalls totaling 192 and 143 mm in 2019 and 2020, respectively, which helped the emergence of crops and weeds. Only annual broadleaf weeds were observed in the plots. The major differences between the 2019 and 2020 tests were weed density and growth stage, due to different seasons of the year. No weeds were observed in 2019 at the early weeding treatment when the wheat was at stage 12; whereas weeds with cotyledon leaves were measured at a density of 10.8 plants m−2 in 2020 at the same time. Small weeds at the 2-leaf stage in 2019 and the 4-leaf stage in 2020 were scattered between crop rows at the middle weeding operation (Figure 9). Larger weeds up to the 4-leaf stage in 2019 and 6-leaf stage were counted at much higher densities of 48.9 and 88.7 plants m−2 in 2019 and 2020, respectively, at the time of late weeding. In general, the weed pressure of 2020 was higher than that of 2019 in terms of both weed density and size.
Summary of field conditions.

a Wheat growth stages are described using Zadoks et al. (Reference Zadoks, Chang and Konzak1974) decimal code.
Field photos taken at different weeding timings and spring-loading settings in 2019 as examples; the coin in the first row of photos measured 26.5 mm in diameter, and the quadrat had a dimension of 500 by 500 mm.

The realized wheat seeding depths were 55 ± 9 and 52 ± 8 mm and the realized crop populations were 253 ± 24 and 248 ± 21 plants m−2 in 2019 and 2020, respectively, which were within the recommended range of Manitoba Agriculture (2019). As can be seen in Figure 9, young wheat seedlings were bent down on the ground or buried by disturbed soil at the time of early weeding, especially at the high loading setting. However, as the crop matured, little or no immediate impact of the harrowing on crop stand was observed. Most of the crop plants injured during the early weeding recovered later in the season.
Weed Control Efficacy
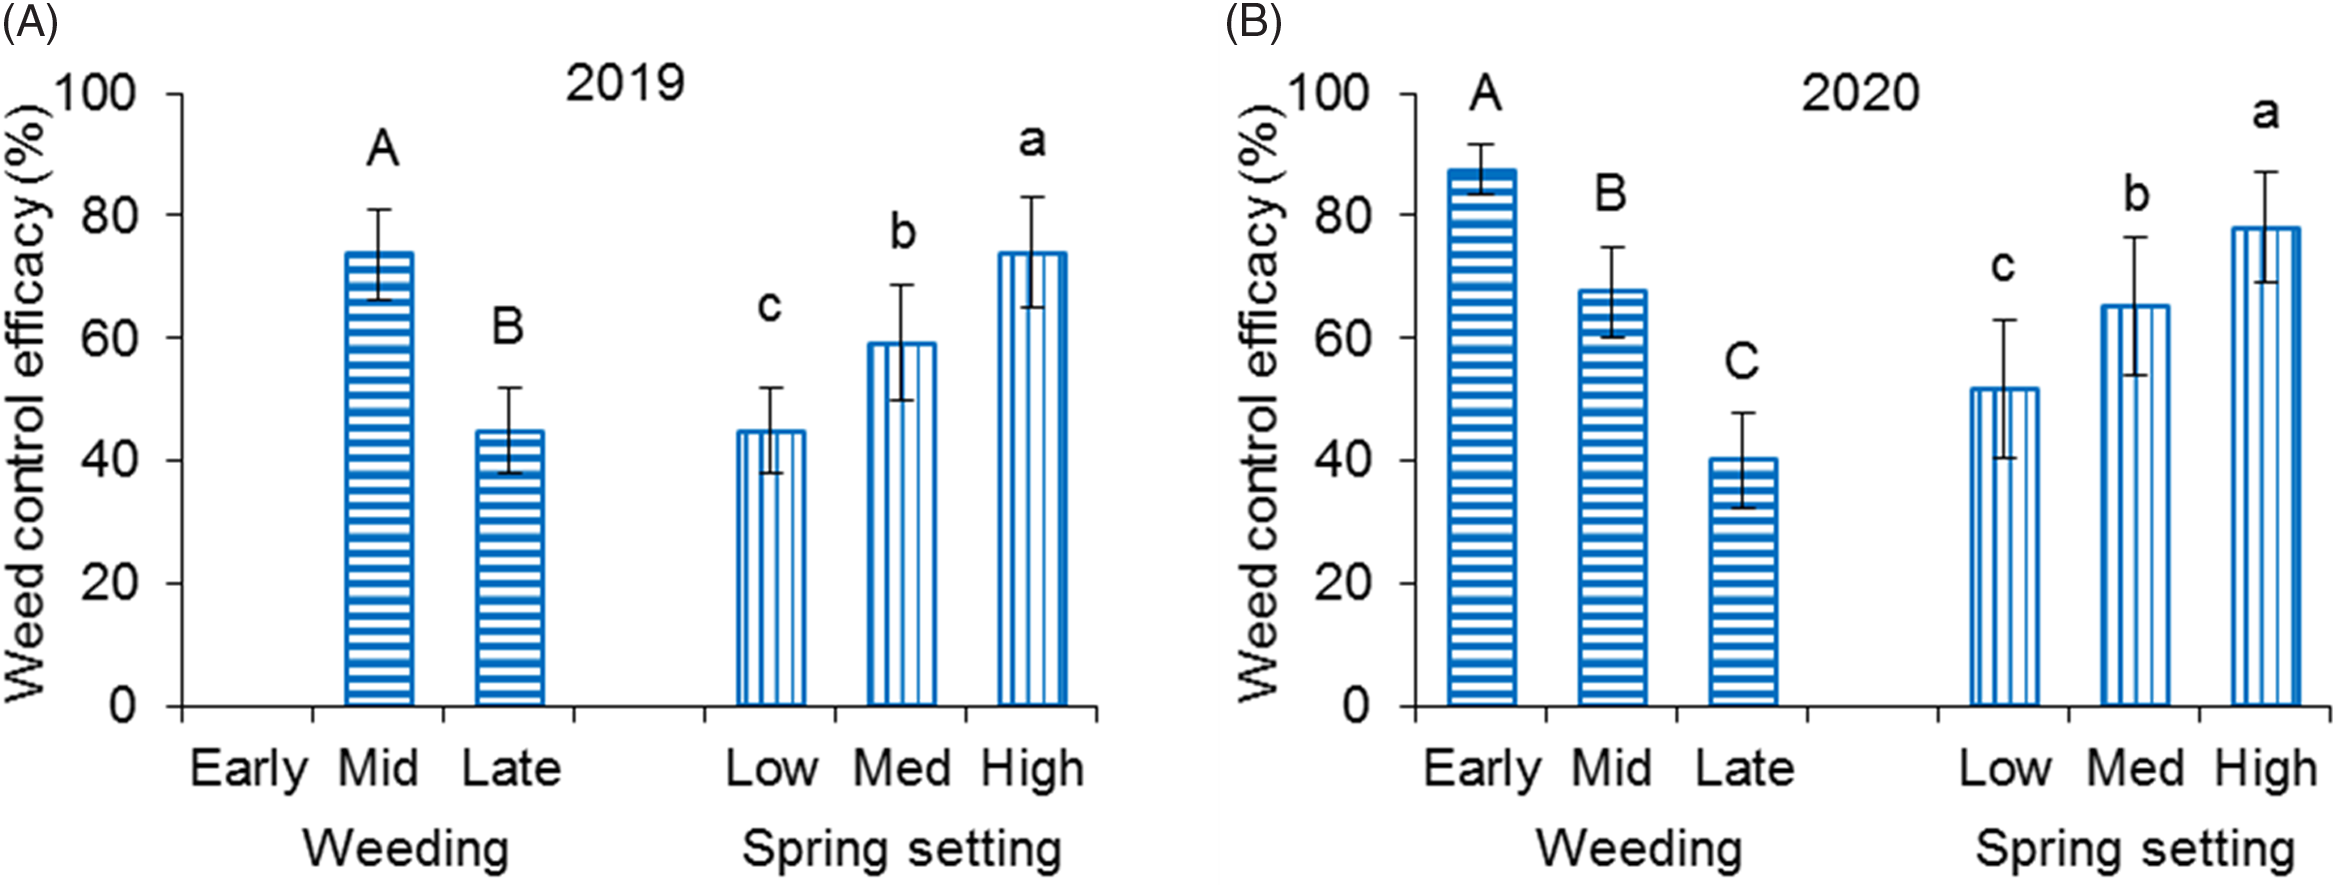
Weed control efficacy was affected by weeding timing and spring-loading setting (Figure 10). The effectiveness of the early weeding operation was zero in 2019, because zero weeds were present when the treatment was applied. In contrast, the tine weeder removed 87.4% of cotyledon-stage weeds in 2020 at the early timing, which was the greatest efficacy measured among any treatments. The weeding effectiveness was 73.7% at the time of middle weeding, which was greater than the 44.9% observed at the late weeding time in 2019. The data in 2020 showed a similar trend: delaying the weeding operations reduced the weed control efficacy. However, increasing the spring-loading setting improved the weeding effectiveness, regardless of the timing. The tine weeder had weed control efficacy of 44.9% and 51.6% in 2019 and 2020, respectively, at the low-loading setting, which increased to 59.2% and 65.3% in 2019 and 2020, respectively, as the spring loading increased to medium. The high loading setting resulted in maximum efficacy of 73.9% in 2019 and 78.1% in 2020.
Weed control efficacy of the spring-tine harrow measured immediately after each weeding operation at different spring-loading settings in (A) 2019 (no data were collected for early weeding, because no weeds were present) and (B) 2020; means followed by different lowercase or uppercase letters are significantly different according to Duncan’s multiple-range test at a significance level of 0.05; error bars are standard deviations.

As individual weeds grew larger and weed populations became denser later in the season, the harrow had difficulties in effectively controlling the weeds, as shown by the significant drop in the weed control efficacy. This result was consistent with the field observation that the harrow either missed weeds between tines or simply could not uproot well-established ones, especially at the late weeding treatment. Previous studies also suggested that harrowing is only effective in uprooting emerging weeds, for example, an average uprooting rate of 51% of the emerging weeds compared with 21% of the more established plants (Kurstjens et al. Reference Kurstjens, Perdok and Goense2000). High weed control efficacy, ranging from 69% to 95%, was achieved using tine weeding in winter wheat when four passes at each of two harrowing times (late spring) were employed (Rasmussen Reference Rasmussen1991b), which offered alternatives for using the harrow late in the growing season.
Final Weed Density
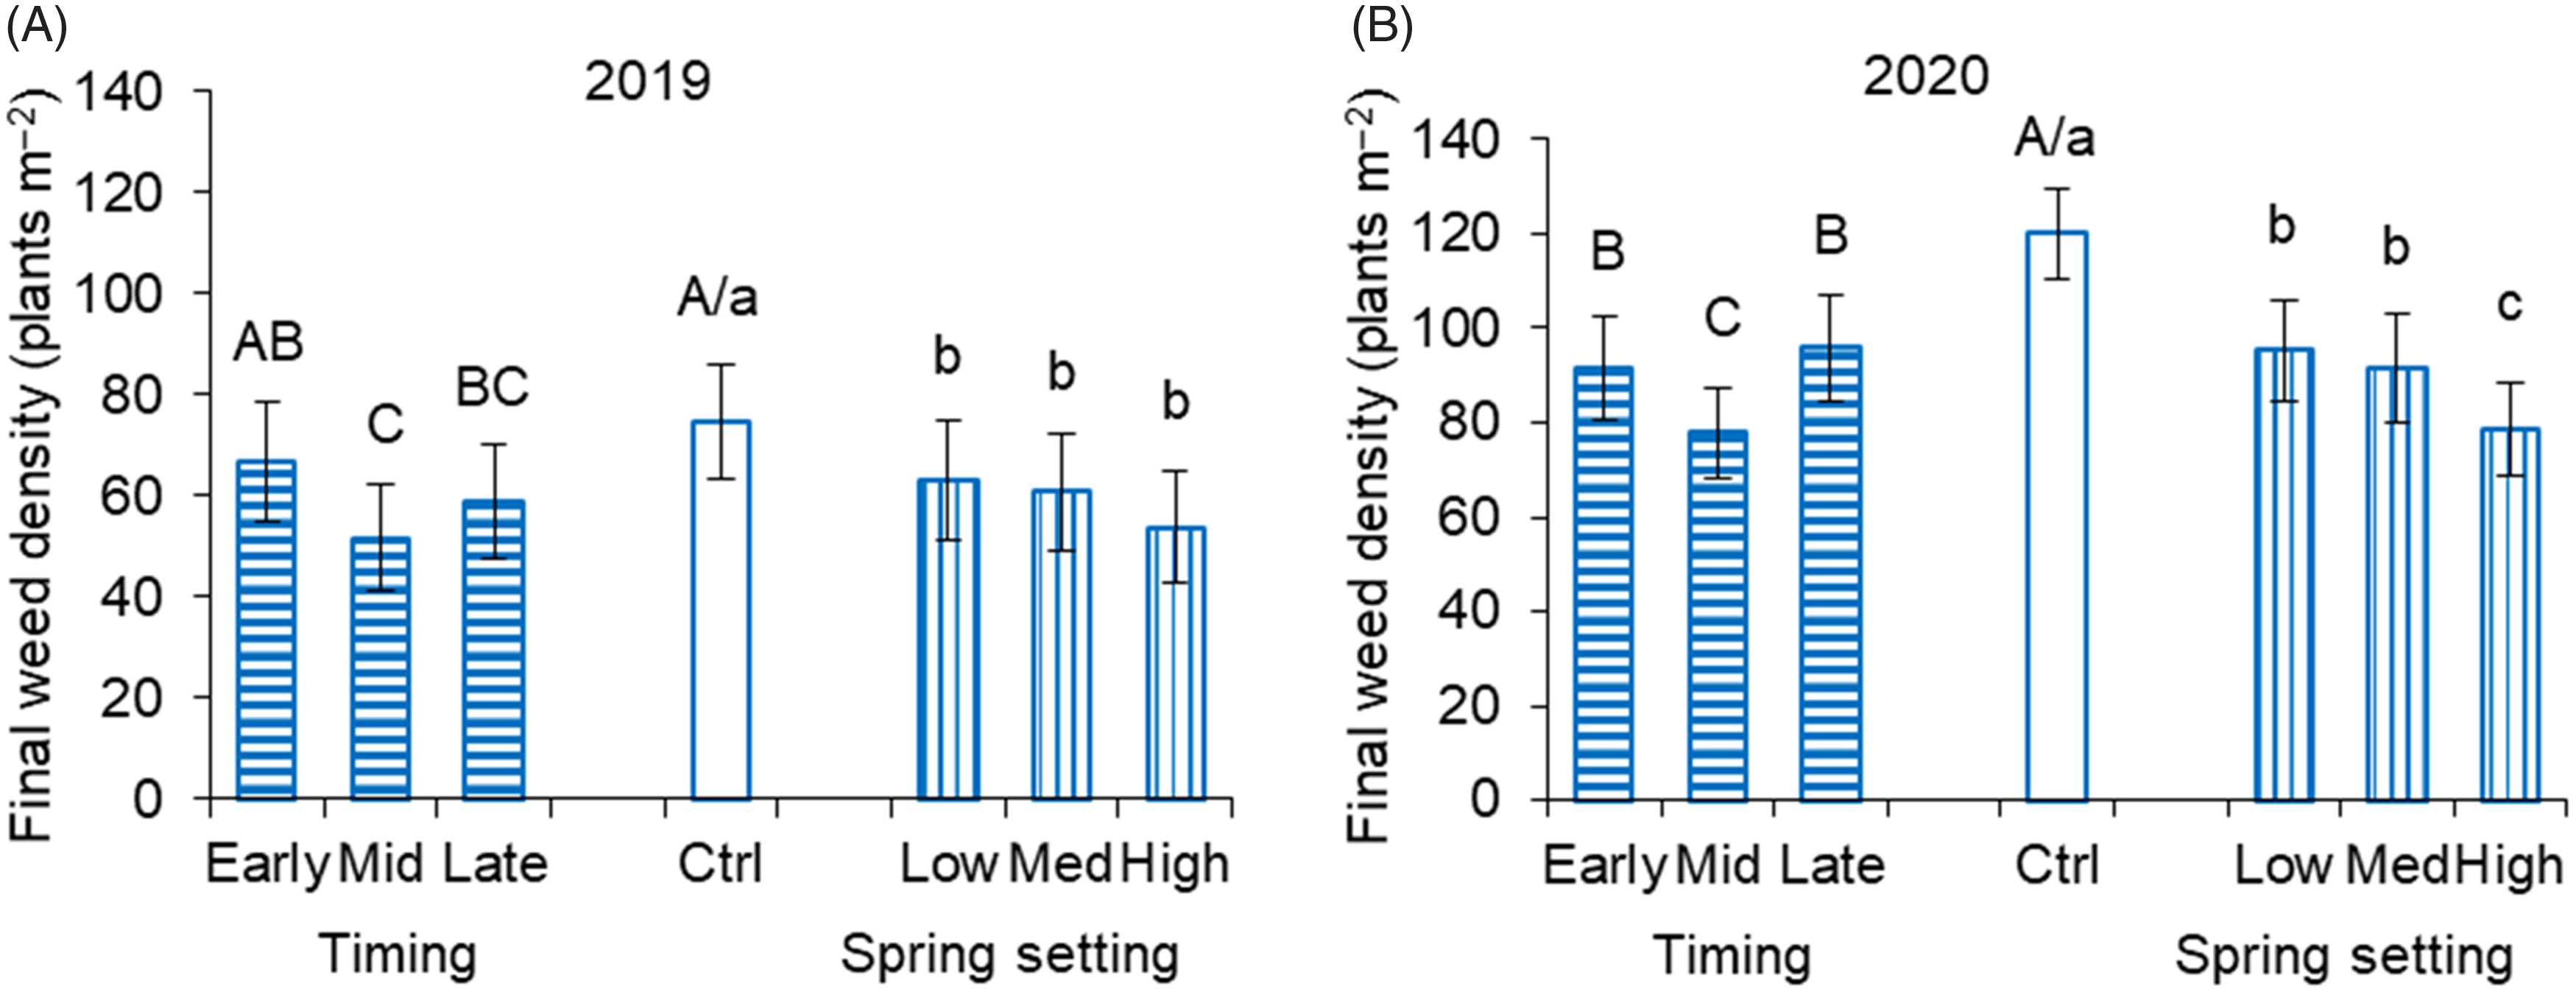
The final weed density at the time of harvesting was affected by weeding timing and spring-loading setting, and they were all lower than the control group of 75 plants m−2 in 2019 and 120 plants m−2 in 2020 (Figure 11). The early weeding reduced weed density by 24% in 2020 compared with the control but did not affect weed density during 2019. Weed density was reduced by 21% in 2019 and 20% in 2020 when the weeding was done late in the season compared with the control. The middle weeding timing resulted in the minimum weed density of 52 plants m−2 in 2019 and 79 plants m−2 in 2020, which was a reduction of 31% in 2019 and 35% in 2020 compared with the control. All three spring-loading settings reduced the weed density compared with the control. However, among the different spring-loading settings, a difference was only noted between the high loading setting and the other two in 2020.
Final weed density at the time of harvesting of the spring-tine harrow at different timings and spring-loading settings in (A) 2019 and (B) 2020; means followed by different lowercase or uppercase letters are significantly different according to Duncan’s multiple-range test at a significance level of 0.05; error bars are standard deviations.

The maximum reduction of about 33% in the weed density resulting from weeding at wheat stage 22 was comparable with that measured in Peruzzi et al. (Reference Peruzzi, Silvestri, Gini and Coli1993), in which a single pass of the tine harrow resulted in a 40% weed reduction in winter wheat of tillering stage 23. The greater weed density associated with the early weeding compared with the middle weeding can be explained by the postcultivation germination of weeds. Previous studies have shown that early cultivation might stimulate more weed seeds to germinate than late cultivation, depending on the field, season, and weed species (Baerveldt and Ascard Reference Baerveldt and Ascard1999; Botto et al. Reference Botto, Scopel, Ballaré and Sánchez1998).
Crop Damage
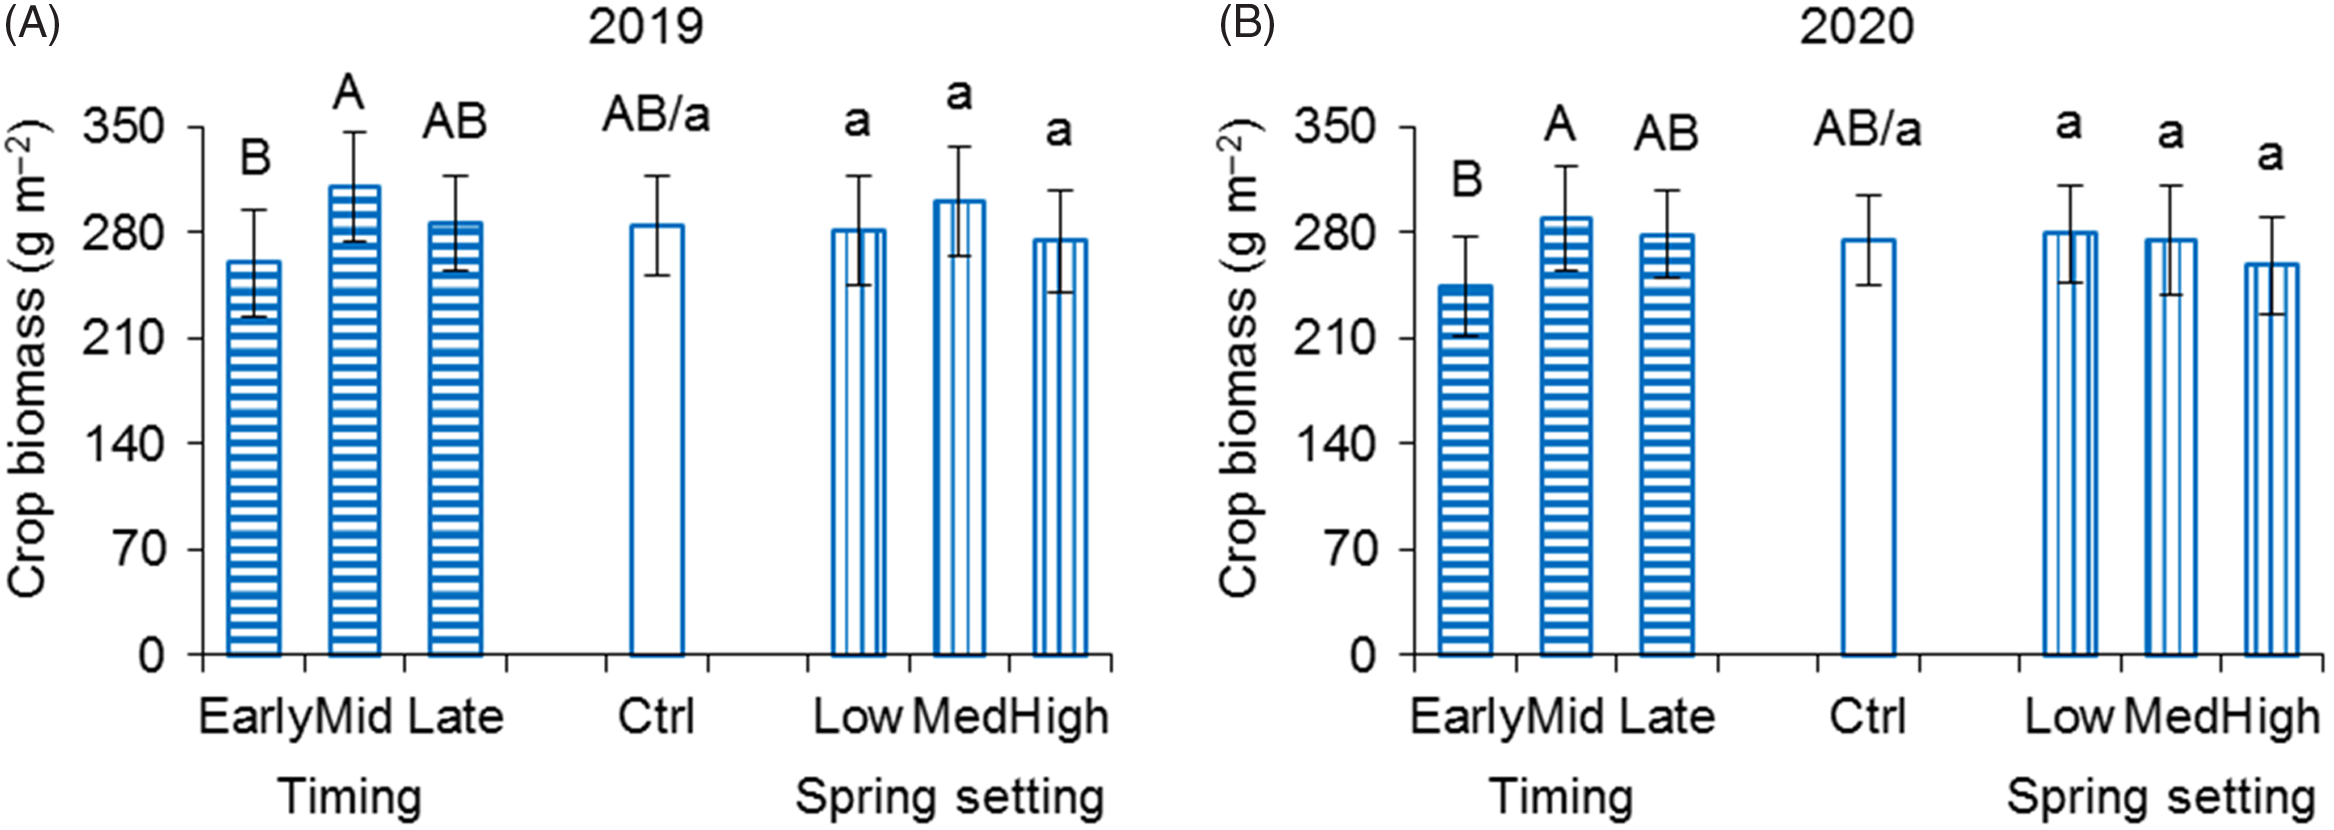
Crop biomass was impacted by weeding timing during both years (Figure 12). Crop biomass associated with the early weeding treatment (260 and 245.1 g m−2 in 2019 and 2020) was less than with the middle weeding (310.2 and 289.7 g m−2 in 2019 and 2020), which indicated substantial crop damage occurred when the field was weeded early in the season. None of the treatments resulted in crop biomass differences compared with the control. Crop biomass based on spring-loading setting was similar to the control for all settings, although the highest setting tended to have the lowest crop biomass.
Crop damage as measured by the crop biomass of the spring-tine harrow at different timings and spring-loading settings in (A) 2019 and (B) 2020; means followed by different lowercase or uppercase letters are significantly different according to Duncan’s multiple-range test at a significance level of 0.05; error bars are standard deviations.

The results suggest that tine weeding was least detrimental to the crop when crop plants were well developed, which was wheat stage 22. Previous studies have shown that POST weed harrowing could reduce crop yields when the timing is unfavorable or the implement’s setting is inappropriate (Rasmussen and Nørremark Reference Rasmussen and Nørremark2006). The effect of weeding timing on crop damage agreed well with the literature. An early harrowing event would be warranted on dry soils in terms of weed control efficacy (Cirujeda and Taberner Reference Cirujeda and Taberner2006).
Overall, realized planting depths of 55 and 52 mm were greater than the maximum working depth measured (29 mm) in the soil bin test. This would prevent the harrow from disturbing the crop seeds and roots at aggressive settings, which was important for the overall success of implementing whole-field harrowing (Cirujeda et al. Reference Cirujeda, Mari, Aibar, Fenández-Cavada, Pardo and Zaragoza2014). The average weed density reduction in all treatments was 24% across 2 yr with similar average crop biomass compared with the control group. It is worth noting that the harrow used in this study was a small implement, which was narrower than a typical field weeding harrow used in crop production. Wider and more aggressive tine harrows are commercially available, which in theory would result in further reductions in the weed density, but perhaps at the same time would lead to higher levels of crop damage. Only one site was used for the field experiments. It is recommended that similar studies should be repeated in more sites with contrasting soil conditions.
The tine harrow affects the plants either directly by contact between plants and tines or indirectly by soil movement caused by the tines. The working depth recorded was related to weed uprooting, and the soil displacement recorded was related to the burial of weeds. Therefore, it is vital to maximize these two effects by selecting the variables that achieve this. Working depth was maximized at the highest spring-loading setting, whereas soil displacement was maximized at the highest speed. The highest speed of 10 km h−1 had a similar working depth and doubled soil displacement at a cost of a 25% increase in draft force compared with the lowest speed of 4 km h−1. These results suggest that harrowing at higher speed, which would result in a high working capacity and is economically more attractive for producers, especially for large-scale farming in the Canadian Prairies, could be recommended. Higher working speeds also promoted weed uprooting in laboratory experiments with small seedlings (Kurstjens et al. Reference Kurstjens, Perdok and Goense2000) and no negative impact on wheat biomass in field experiments (Cirujeda et al. Reference Cirujeda, Melander, Rasmussen and Rasmussen2003), all of which supports the recommendation for higher speeds.
A greater degree of soil displacement did not translate into improvements in weed control efficacy in this study. This was consistent with the field study of Cirujeda et al. (Reference Cirujeda, Melander, Rasmussen and Rasmussen2003), in which the soil layer thrown into the row was not related to the overall weeding efficacy of harrowing. Both suggested that burial was not the main factor responsible for the weed control of the spring-tine harrow. Rather, uprooting was the driving force of weeding effectiveness, as suggested by the strong correlations between the working depth and both weed control efficacy and final weed density. Kurstjens and Perdok (Reference Kurstjens and Perdok2000) found that limited burial depth may be an important factor in limited weed control effectiveness of harrowing, because less than 10% of the covered weeds were buried deeper than 15 mm. The results suggested that the working depth was a better measure of weeding efficiency than the soil displacement of the harrow.
The effect of timing on weeding performance agreed with the previous field test of Dastgheib (Reference Dastgheib2003). The late weeding treatment had a lower weed control efficacy immediately after the treatment compared with the early weeding in 2020. The results would not support the findings of Rasmussen et al. (Reference Rasmussen, Mathiasen and Bibby2010), who suggested that the timing of POST harrowing is not as important as adjusting harrowing aggressiveness to match the crop growth stage. Both the weed density and crop biomass were more dependent on the timing than the spring-loading setting. The critical period of weeding was the middle weeding, at wheat growth stage 22, which resulted in the lowest final weed density and caused minimal crop damage. Previous studies suggested that alternative weeding strategies could be employed if early weeding is desired; for example, early applications of abrasive grit in organic silage corn (Zea mays L.) effectively controlled in-row weeds and increased silage yield (Erazo-Barradas et al. Reference Erazo-Barradas, Forcella, Humburg and Clay2018). However, the weed control efficiency and crop damage of these alternative strategies in wheat production remain to be evaluated.
Acknowledgments
The authors acknowledge the financial support of the Natural Sciences and Engineering Research Council of Canada, the National Natural Science Foundation of China (no. 51675188), and the Earmarked Fund for Modern Agro-industry Technology Research System (no. CARS-01-43). The authors also thank Kobby Acquah, Xue Lei, Vahid Sadrmanesh, Joash Adajar, Jesse Wurch, and Ian Guihuly for their help in the experiments. No conflicts of interest have been declared.