


Introduction
The timing and volume of runoff from predominantly snow-covered mountainous basins is determined by the interplay between snow accumulation and seasonal heat energy input to the snowpack. Conceptual snowmelt-runoff models must either assume a mean snow-water equivalent (SWE) and distribution at the beginning of the modelled melt season or accumulate snowfall throughout the preceding winter (Reference Turpin, Ferguson and JohanssonTurpin and others, 1999). The latter approach is taken by many general-purpose conceptual hydrological models with a snow routine.
Runoff simulations generated by such models may be imperfect not because of any problem with the snowmelt routine or its parameter values, but because of errors in the simulated snowpack, for example, through uncertainties in the precipitation gradient or the threshold temperature below which rain turns to snow (Reference FergusonFerguson, 1999). Validation of snowpack properties or related parameters can therefore reveal inadequacies in the model structure or parameterization (Reference BergstromBergstrom, 1991). Spatial and temporal measurements of SWE are most suitable for this task since general-purpose models with a snow routine track SWE change due to snow accumulation and melt. Ground surveys of SWE are long-established but time-consuming. Hence, the data produced are rarely frequent, detailed or extensive enough for model validation. Passive-microwave satellite sensors are able to measure SWE, but the coarse spatial resolution restricts their use to homogeneous flat areas (Reference RangoRango, 1996). SWE can be mapped moderately well in open areas using airborne gamma radiation (e.g. Reference Bergstrom and BrandtBergstrom and Brandt, 1985), but the signal is hard to distinguish from biomass attenuation in forests (Reference Carroll and CarrollCarroll and Carroll, 1989), and the technique is impractical in mountainous basins since low-level overpasses are required to reduce atmospheric attenuation of the signal. While detailed observations of SWE are difficult to acquire, high-resolution snow-cover area (SCA) measurements can be obtained from remote-sensing data. For example, Reference BrandtBrandt (1991) used airborne radar to update the modelled snowpack, while Reference HaggstromHaggstrom (1994) andReference Turpin, Ferguson and ClarkTurpin and others (1997) compared simulated snow cover with Advanced Very High Resolution Radiometer (AVHRR) and Thematic Mapper (TM) data, respectively.
Snow maps from three satellite sensors (Landsat TM, U.S. National Oceanic and Atmospheric Administration (NOAA) AVHRR and European Remote-sensing Satellite synthetic-aperture radar (ERS SAR) were obtained over three melt seasons for a basin in Arctic Sweden. Differences in SCA derived from the three sensor types are analyzed and the implications for validation of modelled SCA are highlighted. The comparison led to a reclassification of the NOAA AVHRR imagery to give snow-cover proportion per pixel. These data were used to test the SCA predictions generated by the Swedish HBV model (Reference Lindstrom, Johansson, Persson, Gardelin and BergstromLindstrom and others, 1997) with different parameter sets for one melt season, and then verify SCA predictions for two subsequent melt seasons.
Tjaktjajaure Basin
The Tjaktjajaure basin drains part of the Sarek mountains in northern Sweden. It is approximately 2250 km2 in area, ranges in altitude from 450 to 2044ma.s.l. (mean 933 m) and is located between 67° and 67°30’ N. The area is characterized by compact massifs surrounding a broad open valley, with steep and narrow side valleys. The basin supports some forest below 800 m (18% of the basin) but is devoid of soil cover above 1000–1200 m, consisting only of boulders and bare rock (Reference CarlssonCarlsson, 1997). Lakes constitute 6% of the basin area, while higher elevations are glacierized (6% of the basin). There are no meteorological stations within the basin, but interpolation of data from surrounding stations indicates a strong east-west precipitation gradient: the mean annual precipitation varies from 700 mm in the east to almost 2000 mm in the west. Annual evapotranspiration is estimated at 200 mm, and the mean annual temperature is around –3°C. The large Tjaktjajaure outlet reservoir is heavily regulated by a hydropower plant. For hydrological simulations and Earth observation (EO) data analysis the Tjaktjajaure basin was divided into four sub-basins (Table 1).
Physiographic characteristics of the four Tjaktjajaure sub-basins

Snow-Cover Data
Time series of EO data (LandsatTM, NOAA AVHRR and ERS SAR) for three melt seasons (1992,1996 and 1998) were geocoded and classified into snow and non-snow using physically based binary decision methods. In all cases sub-pixel geocoding accuracy was achieved.
Snow cover is detected in LandsatTM images using the ratio of planetary reflectance in band 3 (red) to band 5 (shortwave infrared). Reference Rott and MarklRott and Markl (1989) classified areas with a ratio of >2.7 as snow. Subjective assessment of the Tjaktjajaure snow maps indicated that a threshold value of 3.0 was more appropriate. This rule misclassified some areas (eg. water) with a low reflectance in band 3 but an even lower reflectance in band 5. To prevent this, snow is detected only when band 3 reflectance is >0.10.
AVHRR snow maps were generated from midday images, pre-calibrated to planetary reflectance (channels 1 and 2) or brightness temperature (channels 3–5). Images were classified into cloud, vegetation, snow and other using the hierarchical scheme of Reference Voigt, Koch and BaumgartnerVoigt and others (1999). Snow is classified when band 1 reflectance is >0.25 (except where cirrus cloud is classified, when the threshold is raised to 0.30) in areas that have not already been classified as cloud or vegetation.
The wet-snow mapping method of Reference Nagler, Rott and GlendinningNagler and others (1998) was used to classify wet snow in ERS SAR images. There are two steps. First, a ratio image is generated from the image thought to contain wet snow and a reference image which is known to contain no or dry snow. Second, backscatter ratios less than or equal to a predefined threshold are classified as wet snow. After a sensitivity analysis was conducted, a threshold of ― 3 dB was chosen for all SAR images. The same threshold was successfully used in alpine basins to detect wet snow from G-band SAR imagery. The method can be applied in areas of layover or radar shadow, and performs poorly at local incidence angles of ω17° or >78° (Reference NaglerNagler, 1996). Within discrete elevation/aspect classes these areas of missing coverage were inferred to be wet snow if detected wet snow already formed most of the non-missing coverage areas. Dry snow was inferred uphill of large areas of wet snow (>1 km2), above the mean elevation of wet snow and uphill from wet snow, or 200 m above the mean elevation of wet snow.
Reference Caves, Turpin, Clark, Ferguson, Quegan and JohanssonCaves and others (2000) give a fuller description of the geocoding and classification methods used. SCA classification from optical sensors is hampered by cloud. Snow in these regions was interpolated from unaffected areas using topographic variables. Sub-basin snow maps were not generated for imagery with 50% or more cloud.
Throughout a melt season the time series of snow-cover maps show a progressive reduction in SCA. However, there are considerable discrepancies between SCA values derived from the three sensors (Fig. 1). AVHRR snow maps indicate a larger SCA thanTM snow maps, which are snowier than SAR snow maps. A detailed comparison of images that were coincident or near-coincident (within a couple of days when little snowmelt was known to have occurred) was conducted to investigate the reasons for these differences (Reference Caves, Turpin, Clark, Ferguson and QueganCaves and others, 1999). This indicated that agreement between TM and AVHRR is best on flat and gently sloping areas, such as glaciers. In narrow valleys and on steep slopes TM detects patchy snow, whereas AVHRR snow maps indicate continuous snow (although where snow is very patchy it is shown only by the TM snow maps). The SAR classification fails to detect patchy snow at lower elevations but shows more snow thanTM at higher elevations, partly due to erroneous dry-snow inference. Although AVHRR snow maps reveal more snow thanTM, estimates from both sensors vary in a similar manner with elevation. A different pattern is shown on the SAR snow maps. In these the SCA maximum occurs at a higher elevation, and SCA declines more rapidly as the basin is descended than for either AVHRR orTM.
SCA depletion determined from EO data (NOAA AVHRR, Landsat TM and ERS SAR) for the Tjaktjajaure basin.
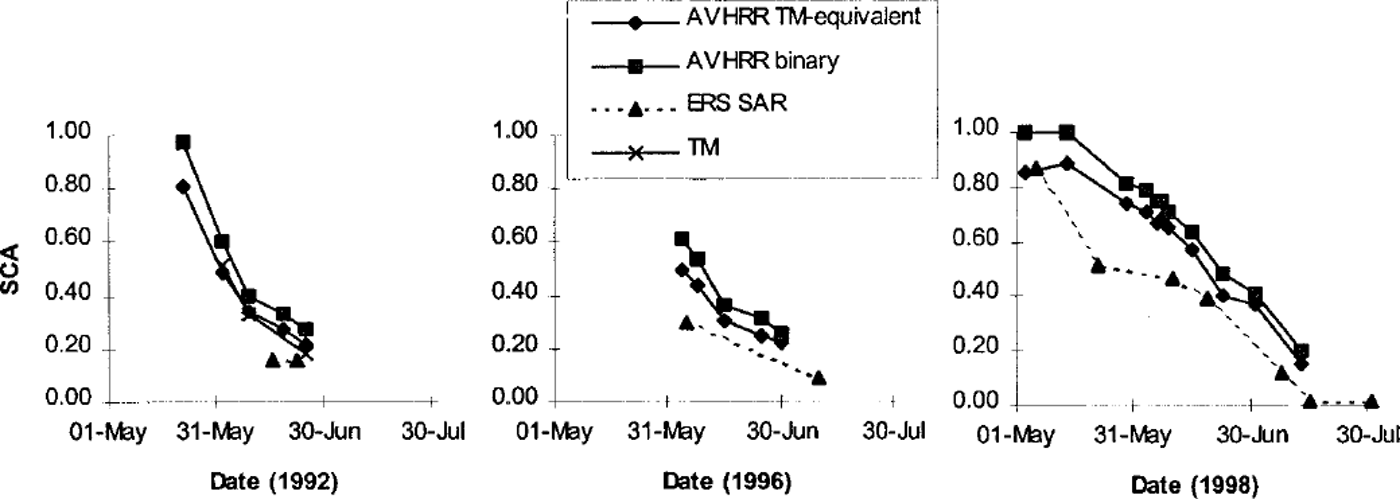
It is clear that SCA estimates from different sensors cannot be assumed to be equivalent for calibration or verification of modelled SCA. In the absence of field data,TM snow maps were assumed to be nearest to truth since TM has a finer spatial resolution than AVHRR, and production of SAR snow maps requires spatial averaging and dry-snow inference. Since the differences between AVHRR andTM snow maps appear to be a systematic effect of spatial resolution a method was developed to estimate TM-equivalent SCA from AVHRR.
Based on three dates in 1992 for which there are coincident AVHRR and TM images, the snow-covered proportion of each AVHRR pixel, Ps, as determined from the coincident TM snow map, was related to AVHRR channel 1 reflectance, R 1 (Reference Caves, Turpin, Clark, Ferguson and QueganCaves and others, 1999). Each date shows a strong positive linear relationship (correlation coefficient >0.85). The average linear function

based on all three dates was used to relate cloud-free AVHRR channel 1 reflectance, R1 to TM-equivalent snow cover. As for the binary snow classification, snow in cloud-covered areas was interpolated from cloud-free areas using topographic variables.
As expected, the AVHRR TM-equivalent SCA estimates for the Tjaktjajaure basin were similar to the TM-estimated SCA. There was slightly more variation for the sub-basins than for the Tjaktjajaure basin as a whole. The AVHRR TM-equivalent snow map on 2 June showed a little less snow than theTM snow map in three sub-basins (maximum difference 6% in Sitojaure), while the AVHRR TM-equivalent snow map on 25 June showed slightly more snow than the TM snow map in all sub-basins (maximum difference 4% in Sitojaure and Laitaure). The AVHRR TM-equivalent and TM snow maps for 9 June were very similar.
Dissimilarities betweenTM and SAR are not so simply related as differences between TM and AVHRR. Thus, it has not yet been possible to devise a method to estimate TM-equivalent SCA from SAR.
Conceptual Snowpack Modelling within Hbv
HBV is a general-purpose hydrological model that simulates snow accumulation and melt, soil-moisture fluctuations, ground-water flow and runoff generation from daily values of temperature and precipitation (Reference BergstromBergstrom, 1992). The modelled basin can be disaggregated into sub-basins to allow for time lags in runoff from different parts of a large basin or for regional gradients in precipitation. The snow and soil components can be further subdivided into elevation zones and four land-cover classes: forest, glacier, lake and open (short vegetation, bare rock, etc.). Only the snow component, described below, is relevant to this study. SMHI (1996) and Reference Lindstrom, Johansson, Persson, Gardelin and BergstromLindstrom and others (1997) provide a complete description of the most recent version of the model (HBV-96).
Input data may be taken from one or more meteorological stations. In the latter case, stations are weighted to form a composite station. Precipitation may also be rescaled by a general correction factor and under-catch correction factors for rain, snowfall in forest and snowfall in other areas. Precipitation recorded at a real or composite station is extrapolated to each elevation zone using a linear gradient of the form:

where Pz is the precipitation (mm) extrapolated to zone z, Pstat is the precipitation (mm) measured at the station, pcalt is the precipitation gradient (per 100 m) and hz and hstat6 are the altitude (both ma.s.l.) of the zone and the station, respectively. An upper limit, pcaltl (m a.s.L), can be set for pcalt, above which precipitation may increase at a different rate, often zero, and a separate gradient can be used for glacier zones. In this case Pstat (mm) in Equation (2) is replaced by the precipitation at pcaltl, Pρcalt l (mm), and hstat6 is replaced by pcaltl. Pρcalt l is computed as:

Precipitation form is dependent on the elevation of the freezing level. As high-level temperature measurements are rarely available, HBV extrapolates temperature using a lapse rate. The occurrence of rain or snow is determined from the extrapolated air temperature using a threshold temperature or ramp change between two temperatures. The threshold is critical, as an incorrect assumption will lead to an erroneous snowpack size. The problem is particularly acute for models such as HBV that use daily precipitation and temperature, as neither the temperature during precipitation nor the time of precipitation is known.
Snowmelt is simulated using a degree-day melt coefficient when the air temperature in a zone is above a critical temperature. The melt coefficient can be different for forest zones. Snowmelt is retained in the snowpack until a water-holding capacity is exceeded. If air temperature drops below the critical temperature, snowmelt held within the snowpack is assumed to refreeze.
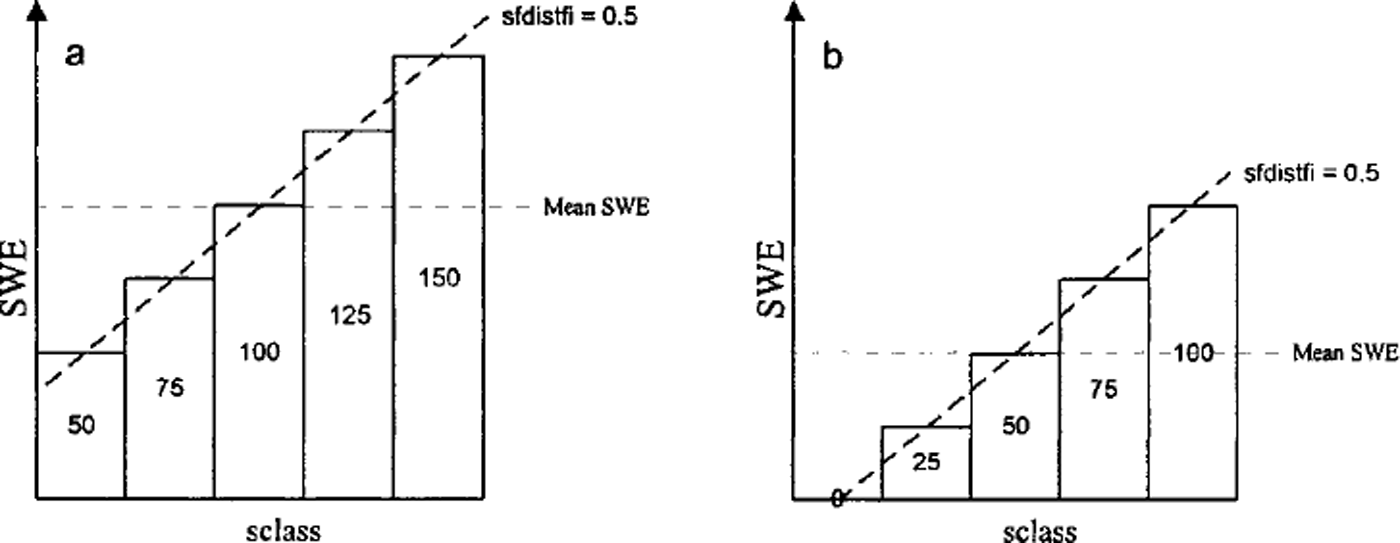
HBV allows for variable SWE within elevation zones (Reference Lindstrom, Johansson, Persson, Gardelin and BergstromLindstrom and others, 1997; Reference Turpin, Ferguson and JohanssonTurpin and others, 1999) by separating SWE into a number of equal-area subzones whose SWE values form an arithmetic series centred on the zone mean (Fig. 2). The relative SWE increase between subzones is given by a distribution factor that may be different in forest and non-forest. SCA is implicitly tracked as the snow in each subzone and elevation zone melts out.
Distribution of SWE within a zone with sclass = 5 and sfdistfi = 0.5 (a) Distribution of 100 units of SWE after snowfall, ( b) Result of melting 50 units of SWE.
Hbv Simulation of the Tjaktjajaure Basin
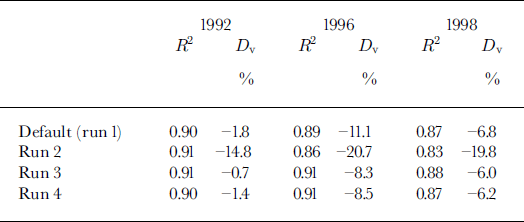
The four sub-basins of the Tjaktjajaure basin were each further divided into 100 m elevation bands and land-cover classes, giving a total of 64 sub-areas ranging in area from 1 to 177 km2 (average 35 km2). The only available input data were from four low-level meteorological stations outside the basin. Runoff from the basin was computed from reservoir-level data, outflow through the hydropower plant turbines and spill through its gates. The model was calibrated on 10 years’ continuous daily runoff data (September 1976–August 1986) using an automatic optimization procedure (Reference LindstromLindstrom, 1997), and validated on a further 10 years’ runoff data (September 1986–August 1996). It produced very good Nash-Sutcliffe R2 fits for both the calibration and verification periods (0.87 and 0.84, respectively) with only slight volume underestimations (-0.8% and –1.3%, respectively). The Nash-Sutcliffe R2 fits for each of the three years with EO data were also very good, although discharge was under-predicted in each year (Table 2).
Discharge fits generated by model runs 1–4 for the Tjaktjajaure basin in 1992,1996 and 1998 (1 September-31 August in each case). Fits calculated using Nash-Sutcliffe R2 and relative volume deviation (Dv). Volume under-predictions shown as negative
Snowpack Recalibration and Verification Using Eo Data
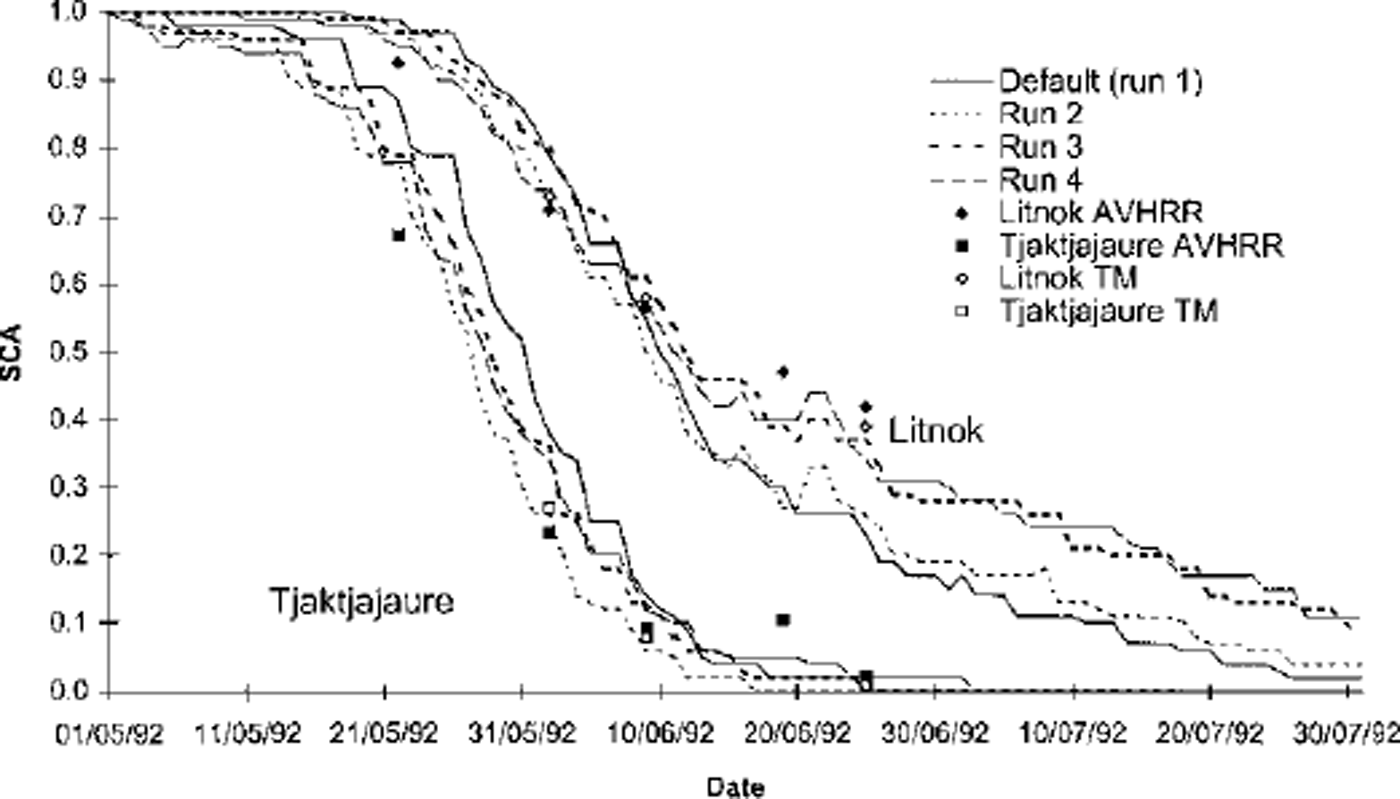
Landsat TM data were initially used to verify HBV snowpack predictions during the 1992 melt season. The TM snow maps (Fig. 3) show that on 2 June the modelled SCA is too high, especially in the lower, predominantly forested, basins (Laitaure and Tjaktjajaure), but that simulated SCA declines too fast through June so that SCA is greatly under-predicted on 25 June in the upper, mostly open, basins (Litnok and Sitojaure). Between 2 and 25 June the default HBV parameter set simulates 56% of the Litnok and 38% of the Tjaktjajaure sub-basin area to become snow-free, while the TM snow maps indicate only 34% and 26% SCA depletion, respectively.
HBV SCA simulation for the Litnok and Tjaktjajaure sub-basins generated by runs 1–4 for the 1992 melt season with TM and AVHRR TM-equivalent SCA (<50% clouds) for comparison. To improve clarity only two basins are shown. Dates are dd/mm/yy.
Since 1992 SCA simulations were poor, model parameters that affect snowpack accumulation and ablation were recalibrated with the aim of improving snowpack simulation while retaining good runoff simulations. Several parameters that affect snow cover are set at fixed values before HBV is calibrated. These include the meteorological-station weights used for estimation of areal precipitation and temperature, the precipitation gradient (pcalt) and its upper limit (pcaltl), the temperature lapse rate, the number of snow classes within an elevation zone and the snowpack distribution within an elevation zone (sfdistfi).
For the purposes of calibration and verification of the model against runoff, precipitation weights were set subjectively, based on the distance of each meteorological station from the centre of the basin. To improve snowpack simulation in each of the sub-basins, the precipitation weightings were recalculated using Thiessen polygons to account for the proximity of each meteorological gauge to each sub-basin. This had little impact on the simulated SCA or the Nash-Sutcliffe R2 runoff fit but increased under-prediction of runoff for the 1992 melt season. The revised meteorological weightings were retained since theoretically they provide a better areal estimation of the precipitation received by the Tjaktjajaure basin.
For HBV simulations, it is usually assumed that precipitation does not increase above the tree line (approximately 800 m in the Tjaktjajaure basin). Hence, the default settings (used for model calibration) were pcalt = 0.1 per 100 m and pcaltl = 800 m (also termed run 1). By modification of pcalt and pcaltl the distribution of snow with elevation can be altered (Fig. 4). Since the nature and size of the snowpack in a basin may vary annually, modifications to snowpack parameters that are advantageous in one melt season may be detrimental in another. Ideally time series of TM snow maps would be available for other melt seasons to enable the effect of alterations to snowpack parameters to be verified. Instead, TM-equivalent snow maps generated from AVHRR imagery were used to calibrate and verify the effect of snowpack parameter changes on HBV SCA predictions.
Relative SWE (compared to unit snowfall at an average station elevation of 400 m) for three parameter combinations: default (run 1): pcalt = 0.lperl00 m, pcaltl = 800 m; run 2: pcalt = 0.05, pcaltl = 1400; and run 3: pcalt = 0.05, pcaltl = 1700.
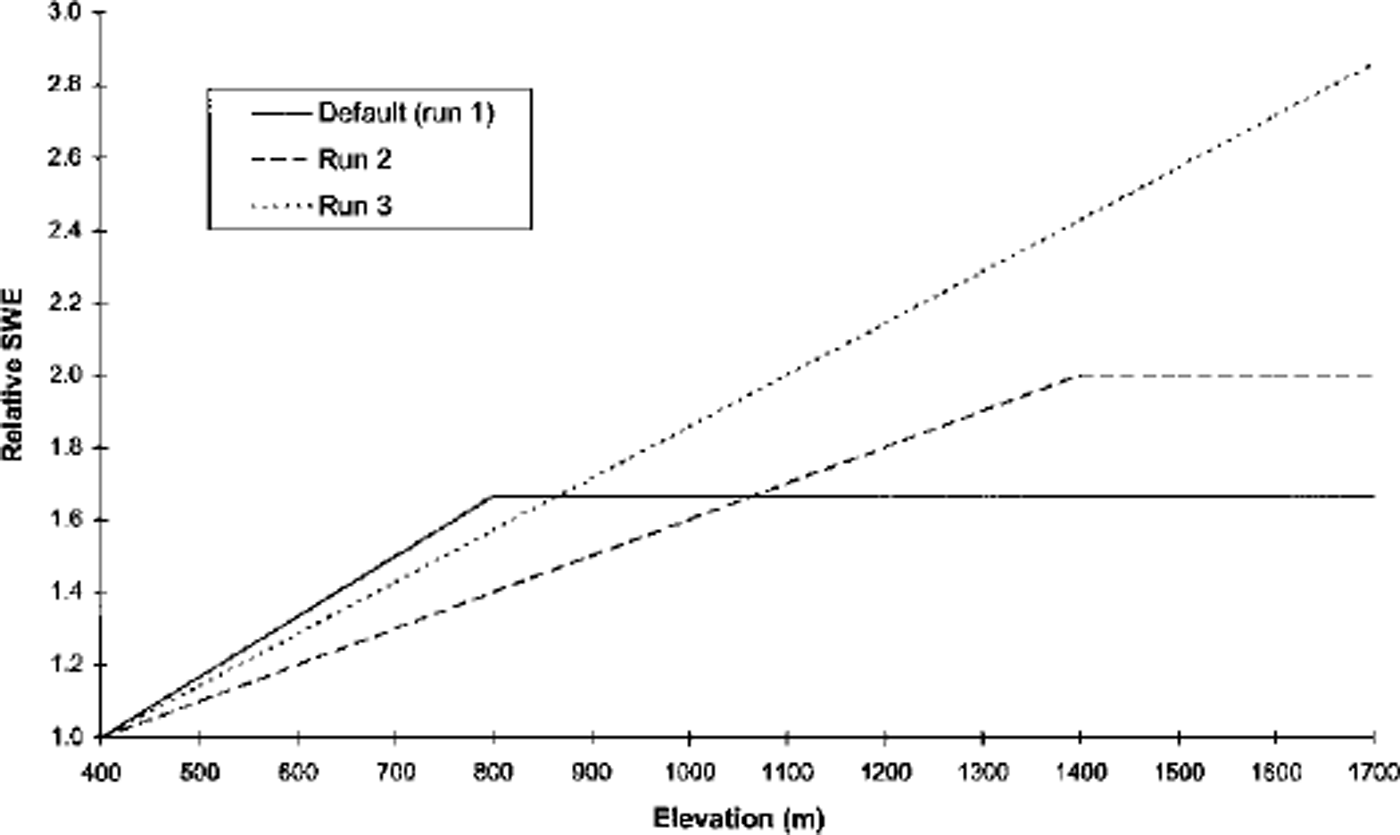
With pcalt = 0.05 per 100 m and pcaltl = 1400 m (run 2) the TM snow maps show that SCA was predicted extremely well on 2 June in the Litnok and Sitojaure sub-basins, and reasonably well on all threeTM dates (2, 9 and 25 June) in the Tjaktjajaure and Laitaure sub-basins. However, SCA depletion was still too fast in the upper two basins, resulting in under-prediction of SCA on 9 and 25 June (Fig. 3). With pcalt = 0.05 per 100 m and pcaltl = 1700 m (run 3) SCA was over-predicted on 2 and 9 June in all four sub-basins but simulated reasonably well on 25 June.
Runs 2 and 3 over-predict the AVHRR TM-equivalent SCA on 22 May and under-predict the AVHRR TM-equivalent SCA on 19 June in each of the four sub-basins. Increasing sfdistfi increases the variability of SWE within an elevation-zone-land-cover class. Hence, SCA reduces slightly more quickly at the beginning of the melt season as shallower SWE subzones melt out, but remains higher for longer towards the end of the melt season as deeper SWE subzones take longer to melt out. With pcalt = 0.05 per 100 m, pcaltl = 1700 m (the values used for run 3) and sfdistfi = 0.7 (termed run 4) the simulated SCA reduces more rapidly at the beginning of the melt season than for any of the other runs. Thus the simulation of the TM-equivalent SCA on 22 May is improved. Subsequently SCA reduces more gradually, producing good SCA predictions on 2 and 9 June in the upper two basins. Since SCA remains high towards the end of the melt season, SCA simulation on 19 and 25 June was also better. However, run 2 simulated SCA better on 2 and 9 June in the lower two sub-basins.
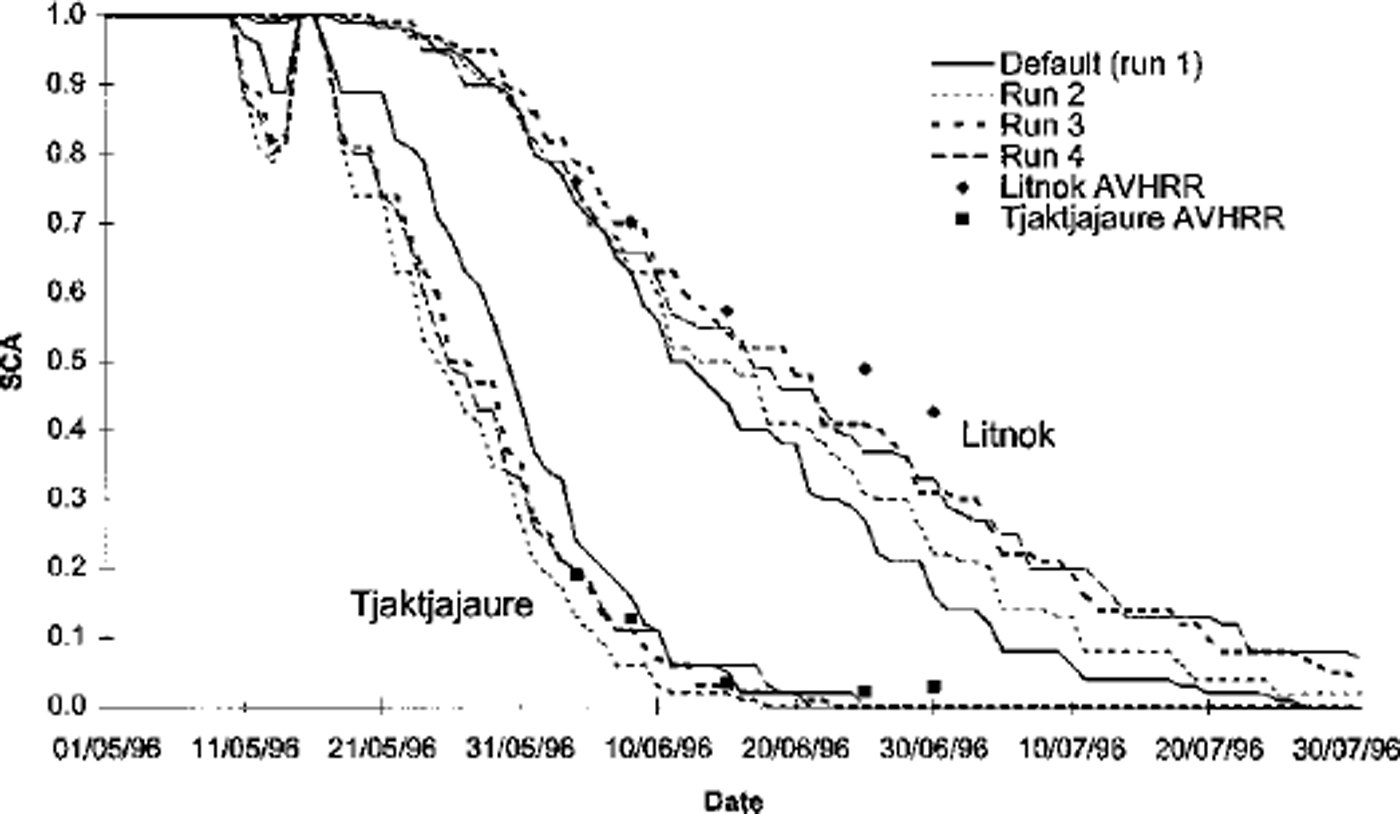
The recalibrated parameter settings were verified using TM-equivalent SCA for 1996 and 1998. The five TM-equivalent snow maps for 1996 (Fig. 5) show SCA depletion curves very similar to those in the 1992 snow maps for the Sitojaure, Laitaure and Tjaktjajaure sub-basins. The Litnok sub-basin had a little more snow than in 1992. Hence, SCA reduction occurred slightly later. SCA in the Sitojaure and Litnok sub-basins is simulated well on 4 and 8 June by all runs. Runs 3 and 4 maintain good SCA estimations on 15 June, although SCA predicted by runs 1 and 2 declines too rapidly throughout June, under-predicting the TM-equivalent SCA. Runs 3 and 4 also under-predict the TM-equivalent SCA on 25 and 30 June, but by a smaller amount. Over the whole melt season, run 4 is the best simulator of SCA in the upper basins as its SCA decline is most gradual. The SCA simulations produced by all runs for the lower Laitaure and Tjaktjajaure sub-basins were very good. Very littleTM-equivalent SCA decline occurred which coincided with the tail end of the model-predicted SCA depletion.
HBVSCA simulation for the Litnok and Tjaktjajaure sub-basins generated by runs 1–4 for the 1996 melt season with AVHRR TM-equivalent SCA ( ω50% clouds) for comparison. Dates are dd/mm/yy.
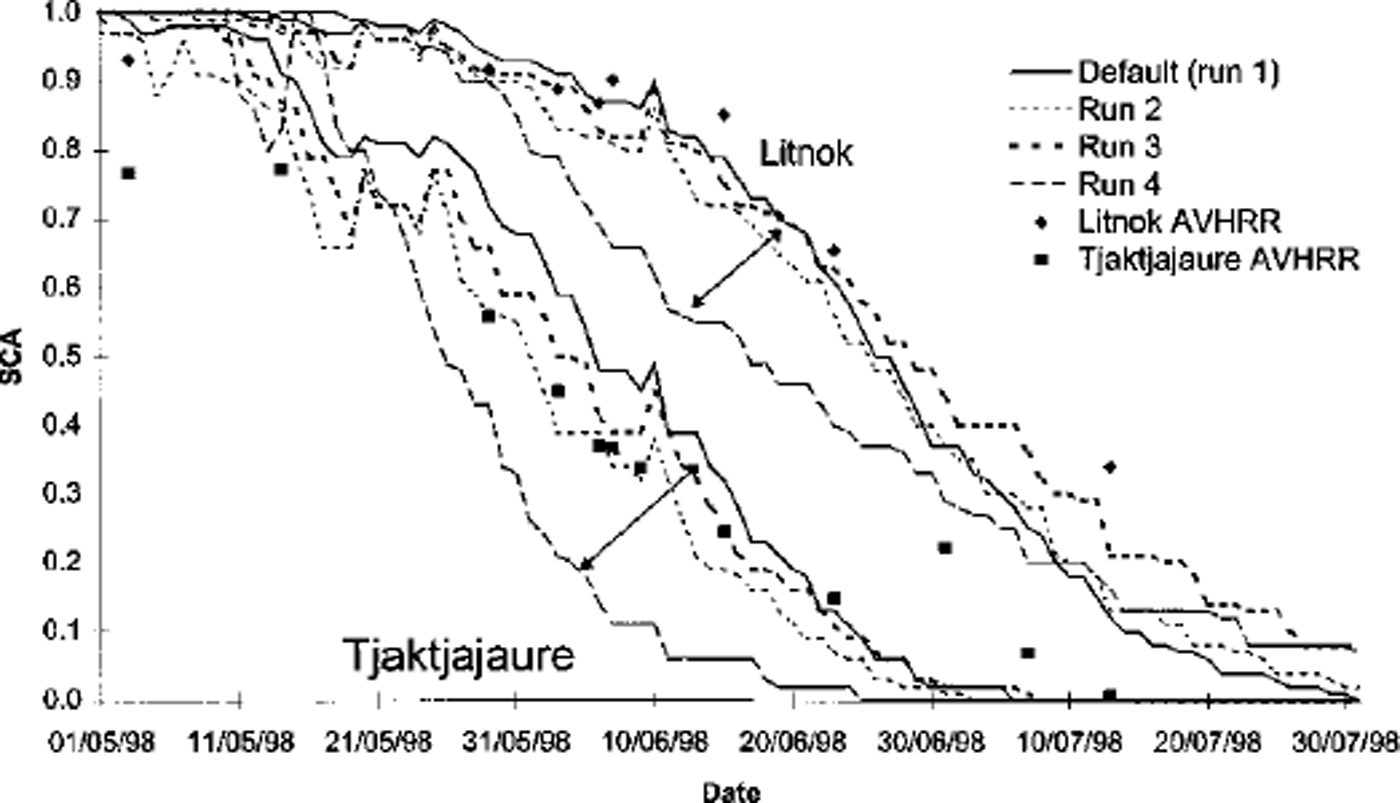
Model simulations and EO-derived snow maps show that SCA was greater in all sub-basins throughout the 1998 melt season (Fig. 6) than in 1992 or 1996. Run 3 generated the best SCA predictions in all sub-basins. In the Litnok sub-basin there was a tendency to under-predict the TM-equivalent SCA towards the end of the melt season. Run 4 produced very poor SCA predictions in all four sub-basins. Apart from early and mid-May it under-predicted the TM-equivalent SCA throughout the melt season in all sub-basins. All parameter sets overestimated SCA at the beginning of May in all four sub-basins.
HBVSCA simulation for the Litnok and Tjaktjajaure sub-basins generated by runs 1–4 for the 1998 melt season with AVHRR TM-equivalent SCA ( ω50% clouds) for comparison. Dates are dd/mm/yy.
Run 2 had a slightly negative impact on the R2 runoff fit in 1996 and 1998. Runs 3 and 4 either had no effect or caused a slight improvement in the R2 runoff fit in all three years. Furthermore, they both gave better volume fits than the default parameter settings (Table 2).
Discussion and Conclusions
It has been proposed that a conceptual hydrological model may have a number of parameter sets that are equally proficient in terms of runoff prediction (Reference Beven and BinleyBeven and Binley, 1992). In this study it has been possible to improve the simulation of the snowpack via small modifications to the parameters affecting snow accumulation without detrimental effects on the runoff fit. Indeed runs 3 and 4 resulted in improved runoff fits, in terms of both Nash-Sutcliffe R2 and volume error (Table 2), relative to the default parameter settings.
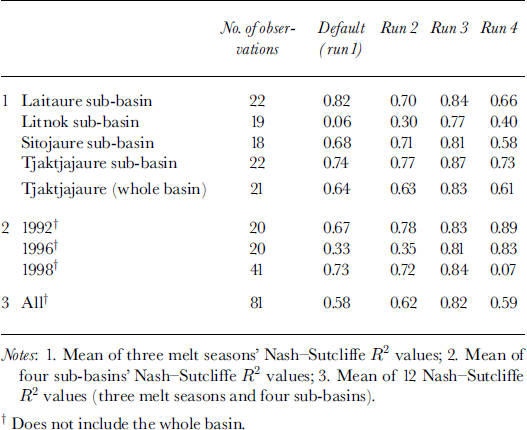
Careful adjustment of the precipitation weightings and a selection of the snow accumulation and distribution parameters led to progressive improvement in the simulated SCA for 1992 (Table 3). Run 3 maintained good SCA fits for the 1996 and 1998 melt seasons. However, although run 4 performed well during 1996 it failed to adequately simulate SCA depletion in 1998. Similarly the SCA fit for run 2 was poor in 1996 despite reasonable fits in 1992 and 1998. Overall, the parameter sets simulated the lower basins marginally better than the upper basins, with run 3 achieving the best R2 fits. The SCA i?2 fit generated by the default parameter set (run 1) for the Litnok sub-basin was substantially poorer than the fit for any other sub-basin. Although runs 2–4 simulate SCA depletion in the other three sub-basins better than in Litnok, the best SCA i?2 improvement is generated for Litnok. Run 4 generates poorer SCA fits for each sub-basin than the default parameter set. This is due to its weaker performance in 1998, as fits in 1992 and 1996 are better than the default parameter set.
Summary of SCA fits for the Tjaktjajaure basin
So far in this paper it has been assumed that discrepancies between modelled SCA and the AVHRR-generated TM-equivalent SCA are due to inadequacies in model simulation of the snowpack. However, it is also probable that the AVHRRTM-equivalent SCA is not a perfect representation of the true SCA. Even thoughTM has a better spatial resolution than AVHRR, snow maps generated from TM are likely to be a misrepresentation of the true SCA. Furthermore, the empirical function used to relate AVHRR channel 1 reflectance to TM snow-covered proportion is based on three dates with similar solar illumination angles, TM-classified snow cover in mainly non-forested parts of the basin, and virtually no cloud. It may not hold so well earlier in the melt season when larger areas below the tree line are still snow-covered, solar incidence angles are lower and the area of shadow is greater. Snow interpolation from cloud-free to cloud-covered regions of AVHRR imagery is likely to further increase the error in an SCA estimate. If coincident AVHRR-TM pairs were available early in the melt season, it might be possible to derive separate relationships for forest and non-forest areas and to include a correction for shading.
Acknowledgements
This work was funded by the European Union, DG-XII, contract ENV4–CT96–0364 (Hydrology of Alpine and High Latitude Basins).



