Implications
The current study provides estimates of heritabilities of thermoregulation traits in lactating sows which were poorly previously described in the literature. Despite the low accuracy of the genetic associations with production traits, our results showed that thermoregulatory responses such as rectal temperature or respiratory rate are heritable, suggesting that selecting for better thermoregulation is possible. It is important to define heat tolerant lactating sows. Based on the traits studied in the present study, a heat tolerant sow could be defined as a sow showing little variation in thermoregulation responses (reflecting low variation in energy requirements for maintaining thermal equilibrium) while keeping high lactating performances.
Introduction
Heat stress (HS) can be defined as the magnitude of environmental and metabolic loads on the animal, for which the animal cannot dissipate an adequate quantity of heat to maintain homeostasis with minimal performance losses. HS impacts pig performance and welfare and thus the economic viability of pig production. For example, in the United States, HS has been estimated to increase sow mortality by 0.01% to 0.36% and to increase growing pig mortality by 0.02% to 0.6%, leading to a global yearly economic loss around $300 million (St-Pierre et al., Reference St-Pierre, Cobanov and Schnitkey2003). Genetic selection performed in optimally controlled conditions, has allowed significant improvement in reproductive traits and lean tissue growth rate (Merks et al., Reference Morris, Jones and Wilson2012). Thus, metabolic heat production of pig had increased with the improvement of production traits. These improvements were achieved at the expense of adaptive capacities of animals. Consequently, it is suspected that the animal’s ability to cope with high ambient temperatures has decreased as suggested by the meta-analysis of Renaudeau et al. (Reference Renaudeau, Gourdine and St-Pierre2011).
Several alternatives to mitigate the impact of HS are available, such as modifying the environmental (cooling options) or feeding management (changes in diet composition/distribution). However, these mitigation strategies come at a high cost and these expenses may not be economically and environmentally advantageous in many tropical situations. In a context of increased occurrences of economic losses due to HS, the genetic selection of heat tolerant genotype is a promising long-term option. Pig studies have shown genetic variation in HS (Zumbach et al., Reference Zumbach, Misztal, Tsuruta, Sanchez, Azain, Herring, Holl, Long and Culbertson2008), suggesting that the genetic solution can be envisaged, but results on lactating sows are scarce. Thermoregulation indicators have been proposed as parameters that reveal heat tolerance (Renaudeau et al., Reference Renaudeau, Mandonnet, Tixier-Boichard, Noblet and Bidanel2004). Among possible traits, indicators of the total thermoregulation process, such as rectal temperature (RT), can be distinguished from those related to heat production, such as residual feed consumption, and from others related to heat dissipation, such as respiratory rate (RR) or skin temperature.
To our knowledge, the inheritance of traits directly related with thermoregulation indicators under HS is poorly quantified in pig. The aim of the present study was to estimate genetic parameters for thermoregulatory traits of lactating Large White sows reared in a tropical humid climate. A further objective was to estimate the genetic relationships between thermoregulation parameters and lactating performance.
Material and methods
All measurements and observations on animals were operated in accordance with the regulations of the French animal breeding regulations. The care and use of animals were performed according to the Certificate of Authorization to Experiment on Living Animals issued by the French Ministry of Agriculture, Fishing, and Feeding.
Animal management and phenotypic records
Animals belonged to the Tropical Platform for Animal Experimentation (INRA-PTEA) experimental farm in Guadeloupe, French West Indies (16°N latitude, 61°W longitude). This experimental station is located in the humid zone of the island, with about 24.7±1.3°C as daily average temperature, 89.3±5.6% as daily average relative humidity and 7.3±4.5 mm/day as daily average rainfall. Animals were housed in a semi-open building in which daily climatic variations (temperature, humidity and photoperiod) followed those of outdoor conditions. Data used in the present study were collected on Large White purebred sows from March 1998 until January 2012. Until 2008, the batch system was based on a 6-weekly and 3-weekly batch farrowing (four batches of 12 sows). From 2009, the batch farrowing has switched to a 3-week batch farrowing (seven batches of 10 sows). The full pedigree was used for all analyses and contained 416 ancestors for sows having records. Sow and litter performances (n=329 and 931, respectively) were available for sows issued from 53 sires and 162 dams.
During pregnancy, sows were restrictively fed a standard commercial diet containing 13 MJ/kg of digestible energy (DE) and a minimum of 140 g/kg of CP. In order to standardize body condition at farrowing, pregnancy feed allowance was calculated for each sow from BW and backfat thickness at estrus according to the model proposed by Dourmad et al. (Reference Dourmad1997). The lactation diet contained 14 MJ/kg of DE and a minimum of 170 g/kg of CP. Sows were restrictively fed until day 5 to avoid over-consumption and agalaxia problems: they received 1 kg of standard gestation diet on farrowing day and the proportion of gestation diet decreased over the 3-day postpartum (i.e. 0.75, 0.50 and 0.25 on days 1, 2 and 3, respectively). Sows were fed to appetite from day 5 to day 26 postpartum. Creep feed (15 MJ/kg of DE, 200 g/kg of CP) was provided to the piglets after day 21 of lactation. The total number of piglets nursed by the sow was recorded for each lactation. Piglets were individually weighed at birth and at weaning (27.8±2.2 day). Sow BW were measured after farrowing and at weaning. The daily feed intake of the sows was determined from farrowing to weaning by difference between the amount of feed offered and the amount of refusals collected in the next morning around 0800 h. The production traits retained for the analysis were as follows: average daily feed intake (ADFI) from farrowing to weaning; litter BW gain (LBWg) and sow proportion of BW change between farrowing and weaning (BWc).
RT as an indicator of core body temperature, cutaneous temperature (CT) as an indicator of heat loss and RR as an indicator of latent heat loss, were measured twice daily at 0700 and 1200 h, respectively, every Monday and Thursday from farrowing to weaning (nine time points, days=0, 4, 7, 11, 14, 18, 21, 25 and 28, with day 0=first measurement after the theoretical farrowing day). Previous study (not showed) on the daily fluctuation of thermoregulatory responses of lactating sows have shown that the most discriminating measurement period (i.e. maximum range) for thermoregulatory variation within a day is between 0400 to 0700 h and 1900 to 2300 h. This study have also shown that the choice of periods between 0700 and 1200 h remains relevant and it is a good compromise between physiological measurements on sows and labor management on farm. The RT was obtained using a digital thermometer (Microlife Corporation, Paris, France). The CT was measured on the backs (middle point) and bellies (flank) using a digital thermometer (HH-21 model; Omega, Stamford, CT, USA) with a K thermocouple probe (model 88002K-IEC, Omega, Stamford, CT, USA). The RR was visually determined by counting flank movements over a period of 1 min when animal was resting. The RT measurements were available from 697 lactations, recorded from October 2002 until January 2012. The CT and RR measurements were available from 242 and 397 lactations, respectively, recorded from October 2006 until January 2012.
In the present study, we focused both on the longitudinal aspect of the production data (RT, CT, RR and daily feed intake) and on the average performance during lactation (RT, CT, RR, ADFI, BWc and LBWg). On the average performance level, the RT and RR were calculated as the average of measurements obtained for each sow within lactations (n=14±2). The CT was calculated as the average of CT measurements on back and flank locations. The difference between thermoregulation parameters measured at 1200 and 0700 h were calculated (RT difference (∆RT), CT difference (∆CT), RR difference (∆RR) for differences between RT, CT and RR, respectively). These differences were used as an indicator of the daily variation of thermoregulatory responses: they give an idea of the thermoregulation effort.
Climatic records and calculations
Records of climatic parameters were available outside the experimental farm from a closed Campbell weather station within 50 m of the experimental unit (from the AGROCLIM INRA web interface). A thermal humidity index (THI) was calculated for each day based on the following formula proposed by the National Oceanic and Atmospheric Administration (NOAA) (1976; cited by Zumbach et al., Reference Zumbach, Misztal, Tsuruta, Sanchez, Azain, Herring, Holl, Long and Culbertson2008):
 $${\rm THI}\;(^{\circ}{\rm C})\,{\equals}\,T{\minus}(0.55{\minus}0.0055{\times}{\rm RH}){\times}({\rm T}{\minus}14.5)$$
where T is the average daily ambient temperature (°C) and RH the average daily relative humidity. In a preliminary study, different daily climatic parameters for ambient temperature and THI (maximum, average, range, at 0700 h, at 1200 h) were compared using partial correlations analysis (R package ppcor), to identify the climatic parameter that better explains the variation in performance (ADFI, LBWg, BWc, RT, CT and RR). Results showed that the average daily THI during lactation was the climatic parameter with highest partial correlations with the performance traits. Furthermore, THI classes were defined in five classes as THI<22.5°C, 22.5°C⩽THI<23.5°C, 23.5°C⩽THI<24.5°C, 24.5°C⩽THI<25.5°C and THI⩾25.5°C.
As proposed by Renaudeau et al. (Reference Renaudeau, Kerdoncuff, Anais and Gourdine2008), a thermal circulation index (TCI) was calculated as an indicator of blood and heat transfer to the skin under steady-state thermal conditions. However, the ambient temperature was replaced in the initial formulae by the average THI during lactation as follows:
 $${\rm TCI}\,{\equals}\,({\rm CT}{\minus}{\rm THI})/({\rm RT}{\minus}{\rm CT})$$
The thermoregulation traits within lactation retained for the analysis were as follows: average RT, CT and RR during lactation; the average ∆RT, ∆CT and ∆RR, between measurements in the morning and the afternoon. Shapiro–Wilks tests of normality were performed and when the assumption of normality was rejected (P<0.10), a Box–Cox procedure was performed to choose the optimal transformation using the function boxcox of the R package MASS. Hence, the following variable was transformed: TCI as TCI0.11.
Statistical analyses
Because of the low number of sows per batch, contemporary groups were formed by the combination of consecutives batches within the same season and the same year (n=29 groups of 32±13 sows). Six parity groups were constructed, namely 1, 2, 3, 4, 5 and parity 6 and above (n=225, 180, 155, 149, 104 and 118, respectively, for ADFI records). First, the effects of parity (1 to 6), THI (1 to 5), contemporary group (1 to 29) and the linear covariates of lactation length, number of piglets to be nursed, and the random effect of the sow were tested on the sow lactation performance and their thermoregulation parameters through an ANOVA using the MIXED Procedure of SAS/STAT (version 9; SAS Institute, Inc., Cary, NC, USA, 1999). Only significant effects (P<0.05) were kept in the final models. Second, animal mixed models were run to estimate variance components for all the traits. However, the unbalanced and incomplete data added computational difficulties, and preliminary single-trait analyses showed that the heritability of ∆RT, ∆CT, ∆RR and TCI were closed to 0 with standard error higher than the corresponding estimated heritabilities. These traits were not considered in further genetic analyses. The final explanatory variables for genetic analyses included six traits (ADFI, LBWg, BWc, RT, CT and RR) for data averaged by lactation and seven traits for repeated data (daily feed intake, RT, CT and RR at 0700 and 1200 h).
Variances were estimated using the REML procedure fitting an animal model with ASREML version 3.0 (Gilmour et al., Reference Gilmour, Gogel, Cullis and Thompson2009). For the estimation of variance components of repeated measures data during lactation, random regression models (RRM) were performed. Additive genetic and permanent environmental effects were modeled using linear splines functions. The general RRM used in the analyses can be written as:
 $$\eqalign {y_{{ijkl}} \,{\equals} \,CG_{i} \,{\plus}\,aNp_{{ijk}} {\plus}\mathop{\sum}\limits_{m\,{\equals}\,0}^1 {\beta _{{jm}} \phi _{m} (t)\, {\plus}\mathop{\sum}\limits_{m\,{\equals}\,1}^3 {\alpha _{{km}} \phi _{m} } } (t)\cr{\plus}\mathop{\sum}\limits_{m\,{\equals}\,1}^3 {\rho _{{km}} \phi _{m} } (t){\plus}e_{{ijkl}} $$
where y ijkl is the lth observation recorded on day of lactation t in sow k, which belongs to the parity group j and contemporary group i, CG i the effect of the ith contemporary group, a the coefficient associated with the number of piglets Np, β jm the set of m fixed regression coefficients for the mean trajectory of parity group j, φ m (t) the covariate of the regression function according to day of lactation (t), α km and p km the sets of m regression coefficients for additive genetic and permanent environmental effects of each sow k and e ijkl the temporary measurement error associated with observation l of sow k, which belongs to contemporary group i and parity group j.
For not repeated measured data, preliminary analysis of single-trait models and bivariate models were run to check the consistency of phenotypic and genetic parameters across traits and models (results not shown). The final model included all six traits described previously: ADFI (ADFI during lactation), LBWg (LBWg from birth to weaning), BWc (BWc of the sow between farrowing and weaning), RT (average RT during lactation), CT (average CT during lactation) and RR (average RR during lactation). The multivariate animal model was
 $$\eqalignno{ & \left[ {\matrix{ {y_{1} } \cr \matrix{ y_{2} \hfill \cr y_{3} \hfill \cr y_{4} \hfill \cr y_{5} \hfill \cr y_{6} \hfill \cr} \cr } } \right]{\equals} \left[ {\matrix{ {X_{1} } \hfill & 0 \hfill & 0 \hfill & 0 \hfill & 0 \hfill & 0 \hfill \cr 0 \hfill & {X_{2} } \hfill & 0 \hfill & 0 \hfill & 0 \hfill & 0 \hfill \cr 0 \hfill & 0 \hfill & {X_{3} } \hfill & 0 \hfill & 0 \hfill & 0 \hfill \cr 0 \hfill & 0 \hfill & 0 \hfill & {X_{4} } \hfill & 0 \hfill & 0 \hfill \cr 0 \hfill & 0 \hfill & 0 \hfill & 0 \hfill & {X_{5} } \hfill & 0 \hfill \cr 0 \hfill & 0 \hfill & 0 \hfill & 0 \hfill & 0 \hfill & {X_{6} } \hfill \cr } } \right]\left[ {\matrix{ {b_{1} } \hfill \cr {b_{2} } \hfill \cr {b_{3} } \hfill \cr {b_{4} } \hfill \cr {b_{5} } \hfill \cr {b_{6} } \hfill \cr } } \right] \cr& \ \ \qquad {\plus}\left[ {\matrix{ {Z_{1} } \hfill & 0 \hfill & 0 \hfill & 0 \hfill & 0 \hfill & 0 \hfill \cr 0 \hfill & {Z_{2} } \hfill & 0 \hfill & 0 \hfill & 0 \hfill & 0 \hfill \cr 0 \hfill & 0 \hfill & {Z_{3} } \hfill & 0 \hfill & 0 \hfill & 0 \hfill \cr 0 \hfill & 0 \hfill & 0 \hfill & {Z_{4} } \hfill & 0 \hfill & 0 \hfill \cr 0 \hfill & 0 \hfill & 0 \hfill & 0 \hfill & {Z_{5} } \hfill & 0 \hfill \cr 0 \hfill & 0 \hfill & 0 \hfill & 0 \hfill & 0 \hfill & {Z_{6} } \hfill \cr } } \right]\left[ {\matrix{ {a_{1} } \hfill \cr {a_{2} } \hfill \cr {a_{3} } \hfill \cr {a_{4} } \hfill \cr {a_{5} } \hfill \cr {a_{6} } \hfill \cr } } \right] \cr &\ \ \qquad {\plus}\left[ {\matrix{ {W_{1} } \hfill & 0 \hfill & 0 \hfill & 0 \hfill & 0 \hfill & 0 \hfill \cr 0 \hfill & {W_{2} } \hfill & 0 \hfill & 0 \hfill & 0 \hfill & 0 \hfill \cr 0 \hfill & 0 \hfill & {W_{3} } \hfill & 0 \hfill & 0 \hfill & 0 \hfill \cr 0 \hfill & 0 \hfill & 0 \hfill & {W_{4} } \hfill & 0 \hfill & 0 \hfill \cr 0 \hfill & 0 \hfill & 0 \hfill & 0 \hfill & {W_{5} } \hfill & 0 \hfill \cr 0 \hfill & 0 \hfill & 0 \hfill & 0 \hfill & 0 \hfill & {W_{6} } \hfill \cr } } \right]\left[ {\matrix{ {c_{1} } \hfill \cr {c_{2} } \hfill \cr {c_{3} } \hfill \cr {c_{4} } \hfill \cr {c_{5} } \hfill \cr {c_{6} } \hfill \cr } } \right]{\plus}\left[ {\matrix{ {e_{1} } \hfill \cr {e_{2} } \hfill \cr {e_{3} } \hfill \cr {e_{4} } \hfill \cr {e_{5} } \hfill \cr {e_{6} } \hfill \cr } } \right] $$
where y i is the vector of observations available for each sow, b i the vector of fixed effects, a i the vector of random additive genetic effects, c i the vector of random non-genetic effects of the permanent environment of the sow and e the vector of the residuals; the X i , Z i and W i the corresponding incidence matrices. A multivariate normal distribution was assumed for all random effects. The variance–covariance structure of the model was as follows:
 $$\eqalignno{ & {\rm Var}\left[ {\matrix{ {a_{1} } \hfill \cr {a_{2} } \hfill \cr {a_{3} } \hfill \cr {a_{4} } \hfill \cr {a_{5} } \hfill \cr {a_{6} } \hfill \cr } } \right]{\equals}\left[ {\matrix{ {A\sigma ^{2} a_{1} } \hfill & {A\sigma ^{2} a_{{12}} } \hfill & {A\sigma ^{2} a_{{13}} } \hfill & {A\sigma ^{2} a_{{14}} } \hfill & {A\sigma ^{2} a_{{15}} } \hfill & {A\sigma ^{2} a_{{16}} } \hfill \cr {A\sigma ^{2} a_{{21}} } \hfill & {A\sigma ^{2} a_{2} } \hfill & {A\sigma ^{2} a_{{23}} } \hfill & {A\sigma ^{2} a_{{24}} } \hfill & {A\sigma ^{2} a_{{25}} } \hfill & {A\sigma ^{2} a_{{26}} } \hfill \cr {A\sigma ^{2} a_{{31}} } \hfill & {A\sigma ^{2} a_{{32}} } \hfill & {A\sigma ^{2} a_{3} } \hfill & {A\sigma ^{2} a_{{34}} } \hfill & {A\sigma ^{2} a_{{35}} } \hfill & {A\sigma ^{2} a_{{36}} } \hfill \cr {A\sigma ^{2} a_{{41}} } \hfill & {A\sigma ^{2} a_{{42}} } \hfill & {A\sigma ^{2} a_{{43}} } \hfill & {A\sigma ^{2} a_{4} } \hfill & {A\sigma ^{2} a_{{45}} } \hfill & {A\sigma ^{2} a_{{46}} } \hfill \cr {A\sigma ^{2} a_{{51}} } \hfill & {A\sigma ^{2} a_{{52}} } \hfill & {A\sigma ^{2} a_{{53}} } \hfill & {A\sigma ^{2} a_{{54}} } \hfill & {A\sigma ^{2} a_{5} } \hfill & {A\sigma ^{2} a_{{56}} } \hfill \cr {A\sigma ^{2} a_{{61}} } \hfill & {A\sigma ^{2} a_{{62}} } \hfill & {A\sigma ^{2} a_{{63}} } \hfill & {A\sigma ^{2} a_{{64}} } \hfill & {A\sigma ^{2} a_{{65}} } \hfill & {A\sigma ^{2} a_{6} } \hfill \cr } } \right] \cr\cr & {\rm Var}\left[ {\matrix{ {c_{1} } \hfill \cr {c_{2} } \hfill \cr {c_{3} } \hfill \cr {c_{4} } \hfill \cr {c_{5} } \hfill \cr {c_{6} } \hfill \cr } } \right]{\equals}\left[ {\matrix{ {I\sigma ^{2} c_{1} } \hfill & {I\sigma ^{2} c_{{12}} } \hfill & {I\sigma ^{2} c_{{13}} } \hfill & {I\sigma ^{2} c_{{14}} } \hfill & {I\sigma ^{2} c_{{15}} } \hfill & {I\sigma ^{2} c_{{16}} } \hfill \cr {I\sigma ^{2} c_{{21}} } \hfill & {I\sigma ^{2} c_{2} } \hfill & {I\sigma ^{2} c_{{23}} } \hfill & {I\sigma ^{2} c_{{24}} } \hfill & {I\sigma ^{2} c_{{25}} } \hfill & {I\sigma ^{2} c_{{26}} } \hfill \cr {I\sigma ^{2} c_{{31}} } \hfill & {I\sigma ^{2} c_{{32}} } \hfill & {I\sigma ^{2} c_{3} } \hfill & {I\sigma ^{2} c_{{34}} } \hfill & {I\sigma ^{2} c_{{35}} } \hfill & {I\sigma ^{2} c_{{36}} } \hfill \cr {I\sigma ^{2} c_{{41}} } \hfill & {I\sigma ^{2} c_{{42}} } \hfill & {I\sigma ^{2} c_{{43}} } \hfill & {I\sigma ^{2} c_{4} } \hfill & {I\sigma ^{2} c_{{45}} } \hfill & {I\sigma ^{2} c_{{46}} } \hfill \cr {I\sigma ^{2} c_{{51}} } \hfill & {I\sigma ^{2} c_{{52}} } \hfill & {I\sigma ^{2} c_{{53}} } \hfill & {I\sigma ^{2} c_{{54}} } \hfill & {I\sigma ^{2} c_{5} } \hfill & {I\sigma ^{2} c_{{56}} } \hfill \cr {I\sigma ^{2} c_{{61}} } \hfill & {I\sigma ^{2} c_{{62}} } \hfill & {I\sigma ^{2} c_{{63}} } \hfill & {I\sigma ^{2} c_{{64}} } \hfill & {I\sigma ^{2} c_{{65}} } \hfill & {I\sigma ^{2} c_{6} } \hfill \cr } } \right] \cr \cr & {\rm Var}\left[ {\matrix{ {e_{1} } \hfill \cr {e_{2} } \hfill \cr {e_{3} } \hfill \cr {e_{4} } \hfill \cr {e_{5} } \hfill \cr {e_{6} } \hfill \cr } } \right]{\equals}\left[ {\matrix{ {I\sigma ^{2} e_{1} } \hfill & {I\sigma ^{2} e_{{12}} } \hfill & {I\sigma ^{2} e_{{13}} } \hfill & {I\sigma ^{2} e_{{14}} } \hfill & {I\sigma ^{2} e_{{15}} } \hfill & {I\sigma ^{2} e_{{16}} } \hfill \cr {I\sigma ^{2} e_{{21}} } \hfill & {I\sigma ^{2} e_{2} } \hfill & {I\sigma ^{2} e_{{23}} } \hfill & {I\sigma ^{2} e_{{24}} } \hfill & {I\sigma ^{2} e_{{25}} } \hfill & {I\sigma ^{2} e_{{26}} } \hfill \cr {I\sigma ^{2} e_{{31}} } \hfill & {I\sigma ^{2} e_{{32}} } \hfill & {I\sigma ^{2} e_{3} } \hfill & {I\sigma ^{2} e_{{34}} } \hfill & {I\sigma ^{2} e_{{35}} } \hfill & {I\sigma ^{2} e_{{36}} } \hfill \cr {I\sigma ^{2} e_{{41}} } \hfill & {I\sigma ^{2} e_{{42}} } \hfill & {I\sigma ^{2} e_{{43}} } \hfill & {I\sigma ^{2} e_{4} } \hfill & {I\sigma ^{2} e_{{45}} } \hfill & {I\sigma ^{2} e_{{46}} } \hfill \cr {I\sigma ^{2} e_{{51}} } \hfill & {I\sigma ^{2} e_{{52}} } \hfill & {I\sigma ^{2} e_{{53}} } \hfill & {I\sigma ^{2} e_{{54}} } \hfill & {I\sigma ^{2} e_{5} } \hfill & {I\sigma ^{2} e_{{56}} } \hfill \cr {I\sigma ^{2} e_{{61}} } \hfill & {I\sigma ^{2} e_{{62}} } \hfill & {I\sigma ^{2} e_{{63}} } \hfill & {I\sigma ^{2} e_{{64}} } \hfill & {I\sigma ^{2} e_{{65}} } \hfill & {I\sigma ^{2} e_{6} } \hfill \cr } } \right] $$
where A is the additive genetic relationship matrix, I the identity matrix, σ 2 a i and σ 2 a ij the additive genetic variance and covariance for the direct effect, σ 2 c i and σ 2 c ij the variance and covariance for the permanent environmental effects, σ 2 e i and σ 2 e ij the variance and covariance for the residual effects, respectively. Heritability and repeatability of each of the six traits was estimated as
 $$h^{2} \,{\equals}\,{{\sigma _{a}^{2} } \over {\sigma _{a}^{2} {\plus}\sigma _{c}^{2} {\plus}\sigma _{e}^{2} }}$$
and
 ${\rm repeatability\,{\equals}}\,{{\sigma _{a}^{2} {\plus}\sigma _{c}^{2} } \over {\sigma _{a}^{2} {\plus}\sigma _{c}^{2} {\plus}\sigma _{e}^{2} }}$
.
The significance of differences between estimates of genetic parameters (heritabilities, correlations, repeatabilities) against a value of 0 was assessed by calculating z scores:
 $$z\,{\equals}\,{x \over {\sqrt {{\rm SE}^{2} } }}$$
where x is the estimate and SE the corresponding standard error. The corresponding two-tailed significance level for z scores with a type I error of 5% was taken from a standard normal distribution.
Results and discussion
Descriptive statistics
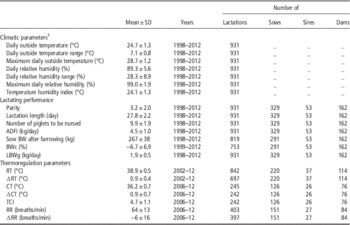
Under HS, sow’s feed intake is decreased, reducing milk production and thus piglet BW, with possible subsequent negative consequences on reproductive sow performance (Black et al., Reference Black, Mullan, Lorschy and Giles1993). The descriptive statistics for the main variables in the database are reported in Table 1. Phenotypic characteristics of sow performances were in accordance with the values reported in the literature on lactating performance under HS conditions (Martins et al., Reference Martins, Costa and Silva2008; Lewis and Bunter, Reference Lewis and Bunter2011). The average daily outside ambient temperature and relative humidity were 24.7±1.3°C and 89.3±5.6%, respectively. The average THI during lactation was 24.1°C, ranging between 21.1°C and 26.4°C. The THI allows combining the effect of ambient temperature and humidity on the studied traits. It is well recognized that high relative humidities emphasize the negative impact of high ambient temperature on pig performances by limiting evaporative heat losses capacity (Huynh et al., Reference Huynh, Aarnink, Verstegen, Gerrits, Heetkamp, Kemp and Canh2005). Above a relative humidity of 80%, the effects of HS on ADFI are magnified (Granier et al., Reference Granier, Massabie and Bouby1998). Even if the thermoneutral zone, in which no extra energy is used to maintain thermoregulation, varies according to many factors (such as breed, age and BW), it is admitted that the lower and the upper ambient temperature limits of this zone are between 12°C and 22°C for the lactating sow (Black et al., Reference Black, Mullan, Lorschy and Giles1993). Fixing humidity at 80%, the corresponded THI for these limits values was between 12°C and 21.2°C, which are lower than the average THI of the current study. Consequently, lactating sows in the present study were HS most of the time (98% of the average daily THIs during lactation were above 21.2°C). On average, lactating sows nursed litters of 9.9 piglets with daily gain of 1.9 kg/day, by eating 4.5 kg/day and losing 6.7% of their BW. Lewis and Bunter (Reference Lewis and Bunter2011) found a similar ADFI for Large White and Landrace sows during the Australian summer. However, the value obtained in our experimental data set is lower than the value of 5.5 kg/day reported by the review of Akanno et al. (Reference Akanno, Schenkel, Quinton, Friendship and Robinson2013) from international pig breeds in the tropics. The average CT and RT during lactation were 36.2°C and 38.9°C, respectively, with the same difference range (0.9°C) between the measurement in the afternoon and in the morning. The average RT is less than the predicted values based on the equations from the meta-analysis of Dourmad et al. (Reference Dourmad, Le Velly, Lechartier, Gourdine and Renaudeau2015) (39.1°C or 39.3°C depending on equation). Williams et al. (Reference Williams, Safranski, Spiers, Eichen, Coate and Lucy2013) have found than the largest change in RT of primiparous sows in a controlled HS conditions was obtained at 2000 h. Data from previous study (Delannoy, Reference Delannoy2007) are in agreement with these results, as we have found maximum range for RT between 0400 to 0700 h and 1900 to 2300 h. Consequently, we may underestimate the average RT and also the changes in RT, when we used only two measurements at 0700 and 1200 h. The average RR was 64 breaths/min. Martins et al. (Reference Martins, Costa and Silva2008) found slightly higher average values for hybrid lactating sows reared in the Brazilian tropical environment of Paudalho (7°S latitude, 35°W longitude; 39.2°C and 75 breaths/min for RT and RR, respectively). The discrepancy between the two sets of results could be partly explained by genotypes differences. Brazilian hybrid lactating sows have higher productive level with probably higher metabolic pressure to achieve these lactating performance. The TCI averaged 4.7 with large range between 2.2 and 10.2. The large THI range means a high variability in thermoregulation responses between sows.
Descriptive statistics for the variables and traits averaged within lactation in Large White sows reared in tropical humid conditions

ADFI=average daily feed intake during lactation; BWc=% of change of BW of the sow during lactation; LBWg=litter BW gain during lactation; RT=average rectal temperature of the sow during lactation; ∆RT=average difference between sow RT measured at 1200 and 0700 h during lactation; CT=average cutaneous temperature; ∆CT=average difference between CT measured at 1200 and 0700 h during lactation; TCI=thermal circulation index: TCI=(CT−THI)/(RT−CT); RR=average respiratory rate of the sow during lactation; ∆RR=average difference between RR measured at 1200 and 0700 h during lactation; THI=thermal humidity index.
1 Campbell weather station closed within 50 m of the experimental unit.
Fixed effects
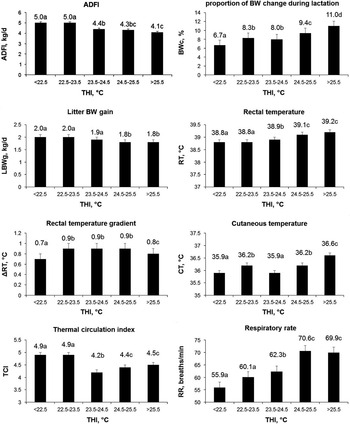
The THI effect was significant for all studied traits. The parity effect was significant for the most studied traits, except for ∆RT and ∆CT. First parity sows consumed 7% less feed than higher parities, in agreement with results of the literature (as reviewed by Dourmad, Reference Dourmad, Etienne, Noblet and Causeur1988). This was accompanied by greater BW loss and lower LBWg for first parity than higher parity sows. Milk production and thus sow’s feed intake and litter performance are known to increase with parity. Body temperatures and RR were greater in first parity than in multiparous lactating sows. In hybrid lactating sows reared in the hot Brazilian climate, Martins et al. (Reference Martins, Costa and Silva2008) have reported similar results with a decrease of the average RT with parities (from 39.5°C to 38.9°C for party 1 to parity >5). Primiparous sows could be more sensitive to high temperatures because of their heat production both from milk production and growth. All the studied traits (lactating performance and thermoregulatory responses) were depressed by the increase of THI (Figure 1). Performance of sows raised in highest THI during lactation (THI>25.5°C) are different from sows raised in lowest THI (THI>22.5°C). Indeed, ADFI was reduced from 5.0 to 4.1 kg/day (P<0.05), with more important BW loss (from 6.7% to 11.0%, P<0.05), and lower LBWg (from 2.0 to 1.8 kg/day, %, P<0.05). The TCI decreased with the increase of THI and the RR increased in accordance with results obtained by Williams et al. (Reference Williams, Safranski, Spiers, Eichen, Coate and Lucy2013) in HS lactating sows. These results underline that sow’s ability to lose heat by sensible pathways is reduced at high THI and then the role of latent pathway (respiratory evaporation) becomes more important for loosing heat.
Least square means for the classes of temperature humidity index (THI) on average daily feed intake (ADFI), proportion of BW change during lactation (BWc), litter BW gain (LBWg), rectal temperature (RT), rectal temperature gradient (∆RT), cutaneous temperature (CT), thermal circulation index (TCI) and respiratory rate (RR) in Large White sows reared in tropical humid conditions. a,b,c,dDifferent letters represents values that are significantly different between THI classes (P<0.05) in a model described in Table 1.

Heritabilities and variance components
Genetic variability with longitudinal records according to the stage of lactation
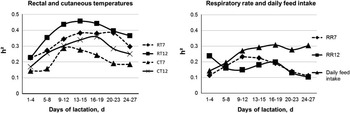
Heritabilities as a function of days of lactation, for thermoregulation traits and for daily feed intake are presented in Figure 2. Heritabilities for RT and RR were higher than for skin temperatures. Heritabilities were generally lower during the 1st days of lactation; they increased after and remained fairly constant afterward. To our knowledge, these are the first results reported in pig. Furthermore, the curve of heritability for feed intake followed the sow’s feed consumption curve during lactation. This in accordance with other studies (e.g. Hermesch, Reference Hermesch2007). However, the estimates of heritability of feed intake are higher than the range of results reported in the literature (range between 0.02 and 0.20). Estimations of genetic parameters at the beginning and the end of the trajectory obtained from random regression analysis are generally over or underestimated (Fischer et al., Reference Fischer, Gilmour and van der Werf2004). Ignoring these values, it seems that the traits studied can be treated as the same trait throughout days of lactation, with fairly constant heritability and variances (results not showed for variances). Nevertheless, the largest heritabilities and genetic variances were estimated in mid-lactation. In a practical point of view, it seems that measuring thermoregulation in mid-lactation and during the afternoon should be the best period to discriminate heat tolerant animals.
Heritability (h 2) for rectal temperature (RT), cutaneous temperature (CT), respiratory rate (RR) at 0700 and 1200 h, and daily feed intake as a function of days of lactation in Large White sows reared in tropical humid conditions.

Genetic variability of average performance in lactation
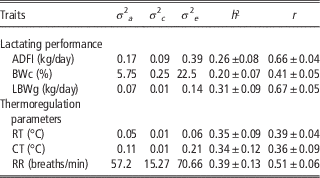
The heritabilities of the studied traits ranged between 0.20±0.07 and 0.31±0.09 for lactating performance traits and between 0.34±0.12 and 0.39±0.13 for thermoregulation traits (Table 2). Repeatability estimates were low to high for lactating performance traits and for thermoregulation traits (>0.36) because of strong permanent environmental effect for some traits such as ADFI or RR. The heritability estimate of ADFI (0.26±0.08) was in agreement with estimates obtained in studies performed in temperate conditions such as for commercial crossbred sows reared in the Netherlands (h 2 between 0.19 and 0.27; Bergsma and Hermesch, Reference Bergsma and Hermesch2012), or for purebred Large White lines reared in France (h 2=0.26±0.07; Gilbert et al., Reference Gilbert, Bidanel, Billon, Lagant, Guillouet, Sellier, Noblet and Hermesch2012). However, the estimate of heritability of ADFI of our study is greater than the weighted mean of heritability estimates of ADFI (0.08±0.04) obtained in commercial mainstream breeds in the tropics from meta-analysis performed by Akanno et al. (Reference Akanno, Schenkel, Quinton, Friendship and Robinson2013). Actually, the authors used only two heritability estimations with high between study variance.
Variance components and heritabilities (±SE) of traits related to lactating performance and thermoregulation in Large White sows reared in tropical humid conditions

σ 2 a =direct additive genetic variance; σ 2 c =permanent environmental variance of the sow; σ 2 e =residual variance; h 2=heritability; r=repeatability; ADFI=average daily feed intake; BWc=% of change of BW of the sow during lactation; LBWg=litter BW gain; RT=rectal temperature; CT=cutaneous temperature; RR=respiratory rate.
The heritability estimate of LBWg was moderate (0.31±0.09) and greater than the estimate of 0.18±0.05 reported by Bergsma et al. (Reference Bergsma, Kanis, Verstegen and Knol2008). The heritability estimate of sow proportion of BW change during lactation (0.20±0.07) was in accordance with the 0.20 heritability estimate of sow BW change score reported in Rydhmer’s review (Reference Rydhmer2000) or BW losses (in kilogram) reported by Bergsma et al. (Reference Bergsma, Kanis, Verstegen and Knol2008). These values are slightly lower than the 0.13±0.05 heritability estimate of change of BW of the sow during lactation reported by Gilbert et al. (Reference Gilbert, Bidanel, Billon, Lagant, Guillouet, Sellier, Noblet and Hermesch2012).
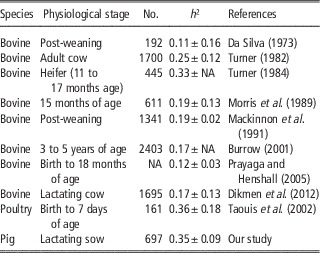
To our knowledge, little has been published on the genetic of thermoregulation traits in pigs. Among them, RT is one of the parameters the most quantified to indicate heat tolerance in species. This is mainly because it is a parameter easy to implement experimentally. Interpretations have often been based on the assumption that RT is the result of the entire thermoregulation process. Therefore, it is one of the heat tolerance parameters for which estimations of heritability and correlations with other traits are available in many species (Table 3). The heritability estimate of RT (0.35±0.09) in our study was in line with the range of estimates (0.11 to 0.36) for RT previously reported in other species. The moderate-to-high repeatability obtained for RT and RR suggest that little will be gained in accuracy by increasing the number of measurements during sow career. RR of sows showed heritability of 0.39±0.13. Literature is scarce on genetic variation of RR. To our knowledge, this is the first estimated heritabilities obtained in pig. In a study on lactating sows produced from lines divergently selected for residual feed intake, Renaudeau et al. (Reference Renaudeau, Anais, Billon, Gourdine, Noblet and Gilbert2014) reported that RR tended to be lower in line selected for low residual feed intake. Thermoregulation parameters of homeothermic animals are constrained traits which tend to return to a basis physiological value (e.g. around 39.0°C for RT of lactating sows). Consequently, the possibility to select animals for lower RT for instance is questionable. Our results show that thermoregulation traits are heritable which can be changed by selection. The aim of selection for a shorter or a higher RT should not be viewed to move the average core temperature from 39.0°C to 39.7°C or from 39.0°C to 38.7°C, but rather to decrease the number of HS sows (i.e. reducing the variance than changing the mean). Koga et al. (Reference Koga, Sugiyama, Del Barrio, Lapitan, Arenda, Robles, Cruz and Kanai2004) suggested that the estimations of thermoregulation traits made from fluctuation with diurnal or seasonal variation is more interesting than absolute values. Low fluctuations around an average value should reflect a low energy level consumed for keeping homeostasis and a higher nutrient proportion available for production purposes.
Heritabilities (h²±SE) of rectal temperature in different mainstream livestock species

No.=number of observations used for the estimation of heritability; NA=not available.
Correlations within lactating performance traits
Table 4 presents the genetic and phenotypic correlations across the six traits from the multi-traits analysis. The significant (P<0.05) phenotypic and genetic correlations ranged from 0.10 to 0.49 and from 0.25 to 0.80 (in absolute values), respectively. In most cases, the standard error of these correlations were high (on average 0.09) as a result of low number of observations. The genetic correlation between ADFI and sow proportion BW change during lactation was −0.80±0.14 suggesting that sows with a high genetic merit for ADFI have less BW loss during lactation. This correlation was similar to the estimate of −0.62±0.16 between ad libitum feed intake and BW change in Dutch climate (Bergsma et al., Reference Bergsma, Kanis, Verstegen and Knol2008). This correlation was expected because a genetic increase of sows voluntary feed intake reduces the utilization of maternal body reserves to support high nutrient requirements for milk production. LBWg is genetically favorably related to sow’s ADFI (r g =0.25±0.11) and more strongly related to sow’s BW change (r g =0.59±0.20). Similar favorable genetic correlations have been reported by Bergsma et al. (Reference Bergsma, Kanis, Verstegen and Knol2008) but with higher values for genetic correlations between ad libitum feed intake and LBWg (r g =0.48±0.20) and lower values between LBWg and sow BW change (r g =0.28±0.20). High LBWg which partly reflected high milk production, leads to high BW loss during lactation as nutrient requirements during lactation are rarely fully covered by feed intake. In addition, under HS the genetic potential related to increase feed intake might be lower than under thermoneutral conditions (due to the reduction of appetite with HS). Furthermore, HS increases the compensation of nutritional deficit by the mobilization of body reserves.
Phenotypic (below the diagonal) and genetic (above the diagonal) correlationsFootnote 1 between traits related to lactating performance and thermoregulation in Large White sows reared in tropical humid conditions

ADFI=average daily feed intake; BWc=% of change of BW of the sow during lactation; LBWg=litter BW gain; RT=rectal temperature; CT=cutaneous temperature; RR=respiratory rate.
1 Bold values significantly differ from 0 (P<0.05).
Correlations within thermoregulation traits
The phenotypic and genetic correlations between RT and CT parameters were positive and high, reflecting the physiological link between these parameters (i.e. heat transfer from the core to skin). The phenotypic and genetic correlation between RT and RR was moderate and positive (r p =0.24±0.07 and r g =0.25±0.12). This result is consistent but numerically lower than the observation of Martins et al. (Reference Martins, Costa and Silva2008) in hybrid lactating sows (r p =0.40).
Correlations between thermoregulation and lactating performance traits
As reviewed by Renaudeau et al. (Reference Renaudeau, Mandonnet, Tixier-Boichard, Noblet and Bidanel2004), there is a moderate-to-strong negative phenotypic correlation between RT and production traits in many species, but with large standard error due to the limited number of animals in most experimental designs (Table 3). In the present study, no significant correlations between RT and performance traits were reported. The phenotypic and genetic correlations between ADFI and thermoregulation traits were only significantly different from 0 for RR. These correlations were positive and ranging from 0.27 to 0.35, meaning that sows with higher ADFI would be the ones with the greatest RR. No literature was found to compare with our estimated correlations between ADFI and RR. Renaudeau et al. (Reference Renaudeau, Anais, Billon, Gourdine, Noblet and Gilbert2014) studied thermoregulation responses in tropical conditions of lactating sows from two divergent lines for residual feed intake. This study showed that ADFI and RR in the line selected for high residual feed intake were higher than in the line selected for low residual feed intake (+590 g/day and +8 breaths/min, respectively).
The majority of nucleus farms are not submitted to chronic HS conditions such as those of our study. An important question that arises from this work is to what extent thermal tolerance traits measured under HS are related to the same indicators measured under thermoneutral conditions. To our knowledge, little has been published on this topic for thermoregulation traits. In more common traits such as reproductive or production traits, Lewis and Bunter (Reference Lewis and Bunter2011) have showed that high genetic correlations between seasons, suggested that separated specification of traits by environment would not be necessary. On the other hand, Bloemhof et al. (Reference Bloemhof, Mathur, Knol and van der Waaij2013) have found sensitive and robust sires in regard to the effect of ambient temperature on reproductive performance of their daughters.
In terms of breeding objectives, different choices can be envisaged, such as selecting for pigs adapted for specific environments of production, or selecting for robust pigs able to perform in most conditions of production (Knap, Reference Knap2005). Based on our results and the poorly accurate estimates of correlations, it is difficult to give advises for the integration of heat tolerance in a breeding program. Further studies are needed. For instance, researches are needed to develop new technologies for automatic recording of thermoregulation measurements in order to accurately estimate individual variation. However, the evaluation of heat tolerance in breeding programs could be conducted basically through (i) the use of conventional traits (production and reproduction) by evaluating pig’s breeding values as a function of thermal HS (ii) using new phenotypes (Merks et al., Reference Morris, Jones and Wilson2012) such as selecting for heat resistance while keeping up the production efficiency. The first method is simpler to implement than the second, but the second method explores both resistance and resilience pathways.
Acknowledgments
The financial support of the Guadeloupe Region and the European Union social funds is gratefully acknowledged. The authors thank Hélène Gilbert for stimulating discussions and helpful comments on the manuscript. The authors also wish to thank C. Anaïs, K. Benony, D, Beramice, B. Bocage, M. Bructer and M. Giorgi for their technical assistance.