


This study presents two first-ever long-run wage indices for the former capital of the Roman Empire, one for skilled and one for unskilled construction workers. Our wages, which concern labor hired by the Papal States to build and maintain St. Peter’s Basilica in Rome, escape the complications inherent to earlier wage series for Italy, which are based on biased wage data and suffer from regional shifts. Our novel wage indices confirm the widespread (though disputed) view that urban Italy endured a prolonged early-modern recession starting in the mid-seventeenth century. They also show, remarkably, that urban Italian workers outearned their urban Northwest-European counterparts in the run-up to the Industrial Revolution once the issues pestering earlier wage indices for England and Italy are accounted for. This suggests that high wages alone were not enough to trigger industrialization or, alternatively, that urban construction wages provide a poor testing ground for that idea.
Most historical wage indices are compilations of statistics drawn from secondary sources. This presents a wide range of problems. For example, the lack of access to the underlying primary sources has led to confusion about how much historical workers effectively earned. Certainly, the wages reported in account books from early-modern building sites in London and Milan habitually included a profit margin of foremen and subcontractors, obscuring how much construction workers were actually paid (Stephenson Reference Stephenson2018; Mocarelli Reference Mocarelli, Hatcher and Stephenson2019). Earlier wage data for Italy are also plagued by the presence of harvest-inflated summer wages (Mocarelli Reference Mocarelli, Hatcher and Stephenson2019). Worse still, they include a major shift in the locations where the wages were observed (Malanima Reference Malanima2013). The resulting jump in existing wage indices could distort the suggested timing of the onset of Italy’s downturn as well as its severity, with implications for our understanding of the underlying causes.
Our new Italian wages are drawn from the account books of the Fabbrica of St. Peter, a primary source covering the same city (Rome) across several centuries leading up to the classical years of the Industrial Revolution in England and spanning the period of Italy’s supposed downturn. The Fabbrica hired and paid its laborers directly, with no profit margins needing to be adjusted for and with summer wages easily removed. Our new wages, thus, offer a fresh assessment of the timing and nature of Italy’s early-modern downturn based on more consistent wage data. The new data also enhance the quality of historical wages used for international comparison.
Our improved wages confirm that both unskilled and especially skilled urban workers in Italy experienced sustained depression in their real earnings during the seventeenth and eighteenth centuries. Comparison with pre-existing Italian wage indices (to the extent that we can trust these) indicates that the downturn began some two decades later in Rome than in the north of Italy. The regional variation in the onset of decline matches the timing of seventeenth-century plague outbreaks, thus supporting the hypothesis that epidemics were decisive in triggering Italy’s prolonged recession (Alfani and Percoco Reference Alfani and Percoco2019). We also provide a novel long-term skill premium for historical Italy, finding that this ranged around 50 percent across the entire early-modern period consistent with the size of the skill premium observed early into the modern era (Federico et al. Reference Federico, Nuvolari, Ridolfi and Vasta2019). Matching the size of the skill premium in early-modern London as well, our finding, therefore, contests the conventional view that premodern skill premiums were significantly higher in the south of Europe than in the northwest (van Zanden Reference van Zanden2009).
Our novel wage indices also inform ongoing debates about the root causes of the Industrial Revolution. One of the leading theories—commonly known as the high-wage hypothesis—holds that expensive labor and cheap energy induced English producers to substitute workers with machines (Allen Reference Allen2009). Earlier work has argued that Italian workers were relatively inexpensive, meaning that the incentive to introduce labor-saving technology in Italy was lacking at the time (Allen Reference Allen2001). Our novel wage comparison between Rome and London shows, however, that Italian construction workers in the run-up to the Industrial Revolution were paid significantly more than their English counterparts after subcontractors’ profit margins and other biases are removed. This suggests that high wages alone were not sufficient to induce labor-saving innovations, stressing the importance of focusing on other factors as well. Moreover, since the Industrial Revolution began in the English countryside and not in urban centers, the high-wage hypothesis is probably better tested using labor wages from provincial rather than metropolitan areas (Ridolfi Reference Ridolfi2019; Rota and Weisdorf Reference Rota and Weisdorf2020b).
We proceed as follows. First, we summarize earlier works on the timing and causes of Italy’s early-modern downturn as well as the country’s position in the little divergence in European wages and prices. In this context, we highlight the key problems with earlier wage indices, motivating why new Italian wage data are called for. Next, we describe the nominal wages and prices underlying our new Italian real-wage indices and draw comparisons with previous wage and price data for Italy as well as for England, the cradle of the Industrial Revolution and the main reference country in the high-wage debate. We also offer a first-ever consistent early-modern skill-premium index for Italian construction workers. We finish by comparing our novel real-wage indices of skilled and unskilled workers with earlier indices for Italy and England and then conclude.
BACKGROUND
This section revisits earlier long-run wage indices for Italy and looks at their interpretation with respect to the timing and causes of Italy’s early-modern economic downturn. We highlight a number of weaknesses with existing wages, explaining the advantages of using our Roman wage data as a reference point instead. From an international perspective, we also emphasise the importance of placing our more consistent Italian wage indices in the context of the recently downscaled London labor wages for ongoing debates about the root causes of the Industrial Revolution.
The Decline of Italy and Issues with Earlier Wage and Price Data
Much discussion surrounds Italy’s early-modern downturn, an episode that appears to have followed a long epoch of economic prosperity between the Middle Ages and the end of the sixteenth century. One aspect of the discussion concerns whether Italy’s downturn applied to all sectors of the economy or only to some. Cipolla (Reference Cipolla1952), half a century ago, dated the onset of the downturn to the seventeenth century, linking it to the combined effects of epidemics and falling competitiveness vis-à-vis foreign markets. Cipolla’s idea of an absolute decline of Italy paled, however, in the face of Sella’s (Reference Sella1997) proposition that the downturn was mainly an urban phenomenon, as the countryside witnessed both rising agricultural productivity and growing proto-industry at the time. Sella, thus, made Italy’s decline a relative one in which the urban economy fell behind, with respect to both its rural counterpart and the emerging economies in Northwest Europe.
The onset of the downturn is also debated. Using revised estimates of real wages and per-capita output, Malanima (Reference Malanima2011, Reference Malanima2013) pushed the starting point of Italy’s decline forward in time to the eighteenth century. The adjusted timing consequently shifted focus toward new reasons for the decline. Malanima contended that the downturn was powered by Malthusian forces, arguing that unparalleled growth of population exhausted the available resources and drove wages down. Based on new mortality data, however, Alfani (Reference Alfani2013) subsequently reversed the onset of decline back to the previous century, arguing with Cipolla that epidemics set off the downturn. In Alfani’s view, the decline in population not only curbed total output, thus preventing plague-ridden areas from sustaining the fiscal capacity necessary to compete with Italy’s Northwest-European counterparts; the damage done by the plague to internal aggregate demand was also detrimental in an age of mercantilism with high barriers to international trade.
Alfani and Malanima’s views, thus, conflict both on timing and nature: Was Italy’s decline driven by population growth (Malanima Reference Malanima2002; Capasso and Malanima Reference Capasso and Malanima2012) or by population decline triggered by epidemics (Alfani Reference Alfani2013; Alfani and Percoco Reference Alfani and Percoco2019)? Fochesato’s (Reference Fochesato2018) analysis of the effect of demographic shocks on European real wages showed that the immediate response to population decrease was growing real wages. Yet, for both Alfani and Malanima, what mattered for Italy’s decline was not the short-term reaction to demographic change but rather its longer-run effect. We return to this issue later, when we discuss the timing of the onset of decline in light of our new and more consistent wages.
Much of the debate reported above about the timing and causes of Italy’s downturn relies heavily on wage indices. The wage statistics underlying those indices ultimately come from account books of large historical construction sites in central and northern Italy and are summarized in four key secondary sources: Parenti (Reference Parenti1939), Sella (Reference Sella1968, Reference Sella1979), and De Maddalena (Reference De Maddalena1974). Parenti’s data come from the construction sector in Tuscany (Florence) in the center of Italy, whereas Sella and De Maddalena’s wages come from the construction sector in Lombardy (Milan), some 300 km north of Tuscany. Displayed in Figure 1, these wage data show that the daily payments (measured in grams of silver) made to workers in Florence were significantly lower when Parenti’s wage index for Florence (dashed line) ends in the early seventeenth century than those of Sella (dotted line) and particularly those of De Maddalena (black line) observed in Milan around the same time.
SILVER-WAGE INDICES OF UNSKILLED WORKERS IN CENTRAL AND NORTHERN ITALY, 1540–1810
Note: Local polynomial smooth plots with confidence intervals were created using lpolyci in Stata IC/16. The narrowing confidence interval for Milan is caused by a very low variability in the wage series after 1700 (see De Maddalena Reference De Maddalena1974).
Sources: Parenti (Reference Parenti1939), De Maddalena (Reference De Maddalena1974), Sella (Reference Sella1968), and Mocarelli (Reference Mocarelli, Hatcher and Stephenson2019).

When the wage indices of Parenti, Sella, and De Maddalena are merged into a composite index for Central-Northern Italy, following Allen (Reference Allen2001) and illustrated in Figure 2, the regional jump from Florence to Milan creates what appears to be a temporary boost to construction workers’ daily pay rates. Equally, the subsequent downturn may have been exaggerated by the regional shift in the wage index around 1600. It should be noted that Malanima (Reference Malanima2013) offered a revised wage index for Central-Northern Italy. However, Malanima’s revised wages build on the same sources as Allen’s original ones, and so have similar problems. Our Roman wage data presented below are free of any regional shifts, thus informing whether the shift affects the timing and severity of Italy’s early-modern downturn.
COMPOSITE SILVER-WAGE INDEX OF UNSKILLED WORKERS IN CENTRAL-NORTHERN ITALY, 1540–1810
Note: Local polynomial smooth plot with confidence intervals was created using lpolyci in Stata IC/16.
Source: Allen (Reference Allen2001).

Mocarelli’s (Reference Mocarelli, Hatcher and Stephenson2019) subsequent and meticulous investigation of the underlying sources of the wages and prices for the area of Milan makes it transparently clear that the indices for Central-Northern Italy are afflicted by more than just the regional shift. Indeed, both wages and prices turned out to be imprecise. For example, Mocarelli found that the consumer price index for Milan, because its price information came from wholesale rather than retail statistics, tended to overestimate the costs of living. The overestimation emerged from the fact that retail merchants benefitted from public food subsidies, while wholesale merchants normally did not. We return to this matter further below when we report our new consumer price index.
Mocarelli also demonstrated that earlier wage indices were built upon secondary sources that lacked exact information about the wage payments made to masters and their assistants. Similar to the issues pestering the labor wages of London construction workers discussed below (Stephenson Reference Stephenson2018), Mocarelli discovered that the wages reported in De Maddalena (Reference De Maddalena1974) were actually paid to foremen and, therefore, in most cases exceeded the wages paid to the laborers themselves. Figure 1 shows that the adjusted wages reported by Mocarelli were, in fact, significantly lower than those reported in De Maddalena and, thus, in Allen and Malamina’s indices. Our new Italian wages and prices presented below avoid the issues emphasized by Mocarelli, thus providing a better setting for considering the timing and nature of Italy’s early-modern downturn, as well as the country’s position in the little divergence in European wages and prices.
Italy in the Little Divergence and High-Wage Hypothesis Debate
From an international perspective, early-modern Italy assumes a rather inferior position in the little divergence within Europe, especially compared to England, the cradle of the Industrial Revolution. However, as suggested above, Italy’s position is determined on the basis of imperfect indices of wages and prices. Similar issues appear to apply to the wages of London workers originally reported in Allen (Reference Allen2001). Below, we explore the significance of accounting for these imperfections for how much English and Italian workers earned and cost during the early-modern period. But we first summarize the debate to date.
It has long been recognized that the frontier of Europe’s economic development moved from the south toward the northwest during the early-modern period (Braudel Reference Braudel1992; Pomeranz Reference Pomeranz2000). Consistent with this view, Allen’s (Reference Allen2001) influential comparison of construction workers’ wages across historical Europe showed that workers in late seventeenth- and early eighteenth-century London were paid considerably better, in real terms, than workers living elsewhere in Europe. Allen (Reference Allen2001, Reference Allen2009) deftly used these divergent trends—now known as the little divergence in European wages and prices—to explain England’s position as a frontrunner in the Industrial Revolution, arguing that the high cost of English labor made it profitable for English producers to replace workers with machines.
Follow-up work has pointed to a number of issues with Allen’s original study. One complication concerned the consumption basket used by Allen to transform nominal wages into real wages. Humphries argued that the caloric needs of women and children were not properly accounted for and suggested that the budget underlying Allen’s cost-of-living deflator should contain more calories (Humphries Reference Humphries2013). Subsequent studies also argued that Allen’s nominal wages were either too pessimistic, as in the cases of France (Geloso Reference Geloso2018; Ridolfi Reference Ridolfi2019), Italy (Malanima Reference Malanima2013), and Spain (García-Zúñiga and López-Losa Reference García-Zúñiga and López-Losa2019), or too optimistic, as in the case of England (Stephenson Reference Stephenson2018). For example, after re-examining Allen’s wages and prices for Central-Northern Italy, Malanima (Reference Malanima2013) proposed that England diverged from Italy significantly later than Allen’s study showed—that is, after c. 1700. A crucial part of Malanima’s conclusion came from substituting Allen’s London wages for Allen’s wages for Southern England. Since the latter did not include an urban wage premium, Malanima was able to narrow the English-Italian wage gap considerably, achieved, however, by comparing urban Italy to rural England.
The amendments proposed in the follow-up studies mentioned above did not challenge Allen’s conclusion of England’s late eighteenth-century supremacy. But their studies emphasized several drawbacks connected to the wages used to substantiate Allen’s work, which chiefly built upon wages and prices reported in secondary sources. A main problem with secondary sources, as was discussed above in the case of Italy, is that they do not allow a proper examination of the underlying data. Similar to the original Italian wages concerning Milan (Mocarelli Reference Mocarelli, Hatcher and Stephenson2019), Allen, for his London wage index, had relied on studies assuming that the major building institutions in London had paid their workers directly (e.g., Boulton Reference Boulton1996; Gilboy Reference Gilboy1934; Schwarz Reference Schwarz1985).
Stephenson’s (Reference Stephenson2018) re-examination of the primary sources behind Allen’s original study showed, however, that this was not the case at all. Instead, beginning in the seventeenth century or possibly even earlier, London construction workers were commonly appointed by subcontractors. These contractors retained a markup for their services, paying workers only a portion of the pay rates reported in the building institutions’ account books. Once the profit margins were deducted, it turned out that the sampled construction workers’ actual earnings were significantly lower than suggested by the secondary sources underlying Allen’s London wage index. While the same issue applies to the original payment observed in Milan (Mocarelli Reference Mocarelli, Hatcher and Stephenson2019), our Roman wages, along with the revised London wages reported in Stephenson (Reference Stephenson, Hatcher and Stephenson2019), were paid to workers directly. The comparative implication of using these unbiased wages instead is considered later on.
A further issue concerns the fact that unskilled workers usually received a premium for seniority, possibly linked to aptitude achieved via learning by doing (García-Zúñiga and López-Losa Reference García-Zúñiga and López-Losa2019; Mocarelli Reference Mocarelli, Hatcher and Stephenson2019; Stephenson Reference Stephenson, Hatcher and Stephenson2019). Because secondary sources are prone to simply report the average or median payment among all unskilled workers employed, they neglect the fact that wages might have varied over time depending on the composition of more or less senior, and hence apt, workers, or because some unskilled tasks were more dangerous than others and, therefore, paid a hazard premium.
Stephenson’s downscale of the London wages might mean that London was no longer the most labor-expensive European city at the onset of the Industrial Revolution. Shedding light on this question requires an apple-to-apple comparison with an appropriate candidate. Clear of any profit margins, stripped of any regional shifts, and with the possibility to account for harvest-inflated wages and wage premiums paid to semiskilled unskilled workers, our Roman wage data will form the basis of a new and more consistent historical wage index for urban Italian construction workers compared to previous indices.
DATA
This section describes the Roman wages and prices underlying our comparison with earlier real-wage indices for Italy and London. Data and replication codes are available for download (see Rota and Weisdorf Reference Rota and Weisdorf2020a). We compute our new Italian real wages in the traditional way, that is, by dividing workers’ nominal wages by a standardized cost-of-living index based on appropriate commodity prices. In the following, we first present our nominal wages of skilled and unskilled workers: where they come from, how we treat them and identify skilled work, and how their levels compare with existing nominal skilled and unskilled wages for Italy and England. Next, we present the prices used to calculate the cost-of-living index: the sources used, the country-specific consumption baskets, and how our new cost-of-living index compares with earlier price indices for Italy and England. The resulting real wages are presented and discussed in the next section.
Nominal Wages
Our nominal wages come from the archive of the Fabbrica of St. Peter. The Fabbrica was an autonomous building institution initiated in 1506 by Pope Julius II with the aim of constructing a new cathedral in the capital city of the Papal States. The previous cathedral, today known as the old St. Peter’s Church and built in the fourth century, had long been neglected and by the fifteenth century had fallen into disrepair. The new St. Peter’s Church, designed by famous Italian artists, including Michelangelo, is one of the world’s largest churches and one of the finest works of Renaissance and Baroque architecture. Suitably, the wages representing England and Central-Northern Italy come from comparable building sites. In particular, Stephenson’s English wages come from St. Paul’s Cathedral in London, the construction of which began shortly after the Great Fire of London in the late seventeenth century. Architecturally, St. Paul’s Cathedral was greatly inspired by its Roman equivalent (Summerson Reference Summerson1969), emphasizing the direct comparability of the wages used in our comparison between London and Rome below. The wages representing Central-Northern Italy come from the construction and maintenance of cathedrals in Florence and Milan.
Rome during our period of interest was the heart of the Papal States, a large territory covering several regions of today’s Italy. Rome’s population tripled between 1500 and 1800, from some 55,000 people to 153,000. While the Roman population by 1500 was one-third of that of Naples and half of that of Milan (Malanima Reference Malanima1998), it was not significantly different in terms of how public administration or private commodity markets operated (Palermo Reference Palermo1997; Strangio Reference Strangio1999; Piola Caselli Reference Piola Caselli2008; Mocarelli Reference Mocarelli, Hatcher and Stephenson2019). In particular, the Roman labor market functioned just like other European labor markets at the time (Sabene Reference Sabene2012). This is confirmed not least by the fact that the trends in our Roman wages were remarkably similar to those in Central-Northern Italy, as we show further below.
The Fabbrica of St. Peter was responsible for organizing and supervising the construction of the new Roman cathedral, as well as its subsequent maintenance. The wages used below come from the registers of the Soprastante and of the Fattore, the managing units of the Fabbrica’s employees. The records begin in 1541 and contain the daily wage rates of the workers employed, their occupational titles, their numbers of days worked per week, and the worker’s names. Although registration continued beyond 1810, the books are not publicly available between 1810 and 1858. Hence, our wage indices end in 1810, though leaving us sufficient time coverage to address the questions of the timing and severity of Italy’s downturn.
Not all wages found in the Fabbrica’s registers before 1810 were used in our analysis below. First, the Roman harvest season—notably the months of June and July—largely emptied the building site and moreover inflated the wage rates of the remaining employees. Indeed, the absence of competition from agriculture meant that winter wages were some 40 percent lower than the wages paid during the summer period (Ait and Piñeiro Reference Ait, Piñeiro and Cavaciocchi2004). Similar to the English wage series, which is adjusted for high-season wages, our sampled wages were drawn from the months covering October –March. The wages of Milan reported by De Maddalena (Reference De Maddalena1974) and shown in Figure 1 did not systematically exclude summer wages—a problem that, therefore, extends to the existing wage indices for Central-Northern Italy (Mocarelli Reference Mocarelli, Hatcher and Stephenson2019).
Furthermore, Stephenson’s (Reference Stephenson, Hatcher and Stephenson2019) downscaled wages for London, which we compare to below, exclusively concern unskilled construction work. In order to make our wage series comparable to hers, payments made to skilled workers had to be separated from those of unskilled workers. We did this in two steps. First, the registers’ occupational categories helped us to sort workers by skill. The most common occupations and those most relevant for our unskilled wage index below concerned manovali and lavoratori (laborers), scopatori (sweepers), pulitori (cleaners), and portieri (doormen). Less frequent professions, for example, guardiania (guards) and brunitori (burnishers), together with a long list of generic occupational titles, were also included in the pool of unskilled labor. Making up four out of five of the Fabbrica’s employees between 1541 and 1810, these occupational titles are traditionally considered to be unskilled work (but see the discussion about strictly unskilled work further below).
Skilled workers mentioned in the registers included falegnami (carpenters), maestri (masons), scalpellini (highly skilled stonecutters), stuccatori (plasterers and decorators), and mosaicisti (mosaic makers). These occupations all required specialist training leading to a skill premium, the size of which we estimate below. For our unskilled wage index, all wages paid to skilled workers were, therefore, dropped—and vice versa. We dropped entirely payments made to aspiranti (boys and very young men in training), condannati (criminals helping on the site), and penitenti (men in community service due to marital exemption). These workers were excluded on the presumption that they were employed under conditions that were out of tune with the regular labor market for construction work. Indeed, their payments were usually some 50 percent lower than the average day rate of a typical unskilled worker.
Our truncations left us with a total of 348,280 low-season, day-wage observations of unskilled workers and 80,598 low-season, day-wage observations of skilled workers spread across 269 years. Summary statistics are given in Table 1. Of course, these numbers include repeated entries for the same workers. Because not all workers were recorded by name, and since those that were frequently shared the same name, we are unable to observe to what extent repeated entry happened, which is perfectly common in historical wage indices. Our average of more than 1,500 daily low-season wage observations per year (more than ten observations per week day on average) places our new historical wage indices among the most comprehensive to date.
SUMMARY OF WAGE AND COST-OF-LIVING STATISTICS

Notes: All payments are expressed in grams of silver per day. The expression p(x) indicates the xth percentile below which our wages are used in the analysis.
Sources: The Fabbrica of St. Peter (see Online Appendix 1).
There is still one more step to take before our unskilled wage index is complete. As emphasized in Stephenson (Reference Stephenson2018), unskilled workers did not all earn the same daily wage rate. Figure 3 shows the distribution of our sampled unskilled wage rates, expressed in terms of deviations from the yearly (low-season) median payment. The graph shows that the best-paid unskilled workers received roughly twice as much as the typical unskilled day rate. Conversely, the poorest-paid unskilled workers received some 70 percent less than the norm. Despite these variations, about 90 percent of the unskilled wages fell within a 40 percent deviation of the median unskilled wage.
DEVIATIONS OF UNSKILLED LABOR WAGES FROM THE YEARLY (LOW-SEASON) MEDIAN WAGE RATE
Source: The archive of the Fabbrica of St. Peter (see Online Appendix 1).

Variation in unskilled workers’ day rates have implications for how we identify and exclude what Stephenson (Reference Stephenson2018) refers to as semiskilled unskilled workers. Sabene (Reference Sabene2012), who studied how work was organized in the Fabbrica of St. Peter during the eighteenth century, was occasionally able to trace workers across time by using their names. This exercise informs that the wage profiles were usually upward sloping over time (Sabene Reference Sabene2012, p. 161). For example, Papi Giuseppe, a manuale, received 20 baiocchi per day in 1738, which was less than the median wage rate that year, namely, 27.5 baiocchi. In 1766, 28 years later, he received 35 baiocchi per day, which was now more than the median wage rate of 25 baiocchi. We suspect seniority and aptitude could both have accounted for such wage promotions, even if the contribution of each component cannot be isolated since wage promotions were not justified in the Fabbrica’s registers. Irrespective of the underlying reasons, we must, therefore, proceed with care when estimating the typical wage rate of a strictly unskilled worker.
Our second step aimed to make our unskilled wage index comparable to Stephenson’s for England, thus, involves a focus on the lower-end tail of our sampled (truncated) unskilled wage distribution. We have experimented with different cut-off points, covering the wages falling below the 75th percentile, the 50th percentile, and the 25th percentile of the sampled unskilled (low-season) wages. Figure A2 in Online Appendix 2 shows how the unskilled wage index evolves in the different cases. We ultimately settled for a compromise cut-off point, which involved taking the average payment of the wages below the 50th percentile in each year. A lower cut-off point (the 25th percentile) would mean discarding two-thirds of the sampled unskilled wages (see the numbers in Table 1). On the other hand, a higher cut-off point (the 75th percentile) entails the risk of including laborers who earned a wage premium for aptitude. Note that the qualitative nature of our conclusions below is robust to using any cut-off point above the 50th percentile. Of course, this strategy does not entirely rule out the possibility of compositional effects caused by variation in the share of strictly unskilled workers to the total. But, by removing the payments of the most well-paid unskilled workers in our sample, the strategy mitigates the portion of wages including premiums paid for occupational dexterities or hazards. For skilled workers, as is standard, we used the entire wage distribution.
Figure 4 displays the resulting (post-truncation) nominal wages of unskilled Roman workers (gray line) between 1543 and 1810, measured in grams of silver. Our transformation of the local Roman currency (baiocchi) into silver is based on the conversion rates reported in Martini (Reference Martini1883) and Piola Caselli (Reference Piola Caselli1999). Figure 4 also shows the pre-existing silver wages for unskilled workers in London (dashed line) and Central-Northern Italy (black line), both of which are taken from Allen’s (Reference Allen2001) original study. The nominal London wages were only mildly higher than those in Central-Northern Italy up until the 1630s. After that, workers in Central-Northern Italy received increasingly less per day—and the Londoners increasingly more—until our indices end. The Roman wages were higher, still, than those in London to begin with, rising in tandem with these until the 1650s before beginning a descending trend similar to that of Central-Northern Italy, but at a somewhat higher level. Regional variation in the onset of decline in the Italian indices is worth noting and something we return to further below when discussing the reasons for Italy’s early-modern downturn.
SILVER WAGES OF UNSKILLED WORKERS: LONDON, ROME, AND CENTRAL-NORTHERN ITALY, 1543–1810
Notes: Daily silver wages. Local polynomial smooth plots with confidence intervals were created using lpolyci in Stata IC/16.
Sources: Central-Northern (CN) Italy: Allen (Reference Allen2001). Rome: the Fabbrica of St. Peter (see Online Appendix 1).

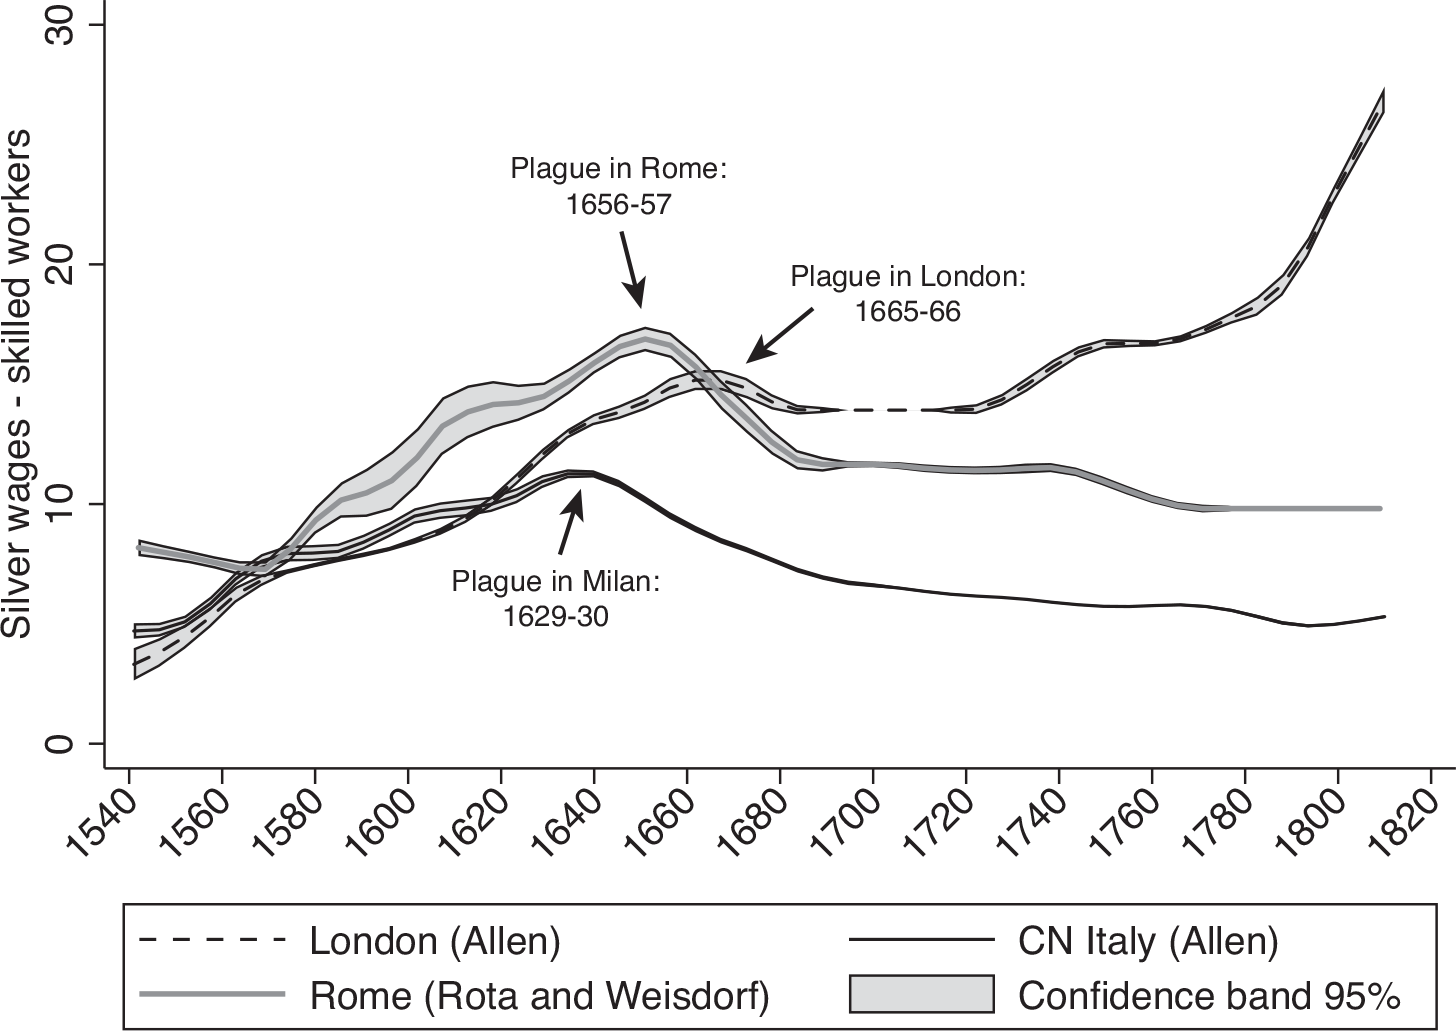
The trends in the nominal wages of skilled workers (Figure 5) are very similar to those of unskilled workers (Figure 4). Among the three regions, skilled Roman workers were paid most until the 1650s, after which decline set in. The onset of decline in Rome, however, came with a delay of some two decades compared to Central-Northern Italy (assuming we can trust the wages). Indeed, the timing of regional peaks is worth highlighting. The nominal wages in Central-Northern Italy peaked in the 1630s; the Roman wages in the 1650s; and the London wages in the 1660s (even if the English highpoint was a temporary one during the period of interest). Remarkably, the observed regional downturns clearly coincide with episodes of epidemic outbreaks, as hypothesized in Alfani and Percoco (Reference Alfani and Percoco2019). In particular, a plague hit Milan and Northern Italy in 1629/30 leaving Rome unaffected. A later plague hit Rome and Southern Italy in 1656/57 leaving Milan unaffected. Finally, London was hit by a plague in 1665/66 leaving both Milan and Rome unaffected. Plague outbreaks, thus, appear to have turned wage growth into wage decline in all three regions. We revisit this important point in the next section.
SILVER WAGES OF SKILLED WORKERS IN LONDON, ROME, AND CENTRAL-NORTHERN ITALY, 1543–1810
Note: Local polynomial smooth plots with confidence intervals were created using lpolyci in Stata IC/16.
Sources: Wages: Central-Northern Italy: Allen (Reference Allen2001). Rome: the Fabbrica of St. Peter (see Online Appendix 1). Plague outbreaks: Alfani and Percoco (Reference Alfani and Percoco2019).
The Skill Premium
Our indices of skilled and unskilled workers’ wages described above allow us to calculate a new skill-premium index for urban Italy. Figure 6 reports the skill premium in all three regions under investigation. The premiums in Rome and London were remarkably similar, with skilled construction workers earning some 50 percent more than their unskilled counterparts throughout the early-modern period—a level that also aligns with the skill premium reported for Italy after 1861 (Federico et al. Reference Federico, Nuvolari, Ridolfi and Vasta2019). The pre-existing skill premium for Central-Northern Italy is bizarrely high in comparison, with skilled workers consistently receiving pay rates twice as large as those of their unskilled colleagues. There is no apparent reason why the skill premium would have been that much higher in Central-Northern Italy than it was in Rome, except that the northern wages might be biased, as discussed above. At any rate, the size of the new and more consistent Roman skill premium contests the common belief that skill premiums in early-modern southern Europe were significantly higher than in the northwest, as suggested in van Zanden (Reference van Zanden2009). Indeed, if we had based our unskilled wage index on the entire wage distribution for unskilled workers rather than on those whose wages fell below the 50th percentile, then this would have made the Roman skill premium even smaller.
THE SKILL PREMIUM IN LONDON, ROME, AND CENTRAL-NORTHERN ITALY, 1543–1810
Notes: The skill premium is computed as the average skilled daily wage rate divided by the average unskilled daily wage rate each year. Local polynomial smooth plots with confidence intervals were created using lpolyci in Stata IC/16.
Sources: London and Central-Northern Italy: Allen (Reference Allen2001). Rome: the Fabbrica of St. Peter (see Online Appendix 1).

The Consumption Basket
We now turn to the regional cost-of-living indices used to convert the nominal wages into real ones. Here, we follow Allen’s (Reference Allen2001) original work, but with a couple of adaptations. In particular, Allen’s original basket included 1,940 daily calories for an adult male. This number of calories is less than the estimated caloric ingestion suggested in Gross (Reference Gross1990) for Roman individuals during the middle of the eighteenth century. Gross proposed that a middle-class adult consumed 2,315 calories per day on average, whereas a lower-class adult consumed somewhat less, namely, 2,124 calories per day. Inspired by Gross’ estimations, as well as Humphries’ critique discussed above, suggesting that Allen’s original basket was too meager, we proceed to apply the common assumption of allocating 2,500 calories per person per day in Rome, London, and Central-Northern Italy.
Different from Allen’s original baskets, and because we were unable to construct a Roman price series for linen, this item was excluded from our cost-of-living indices for Rome, London, and Central-Northern Italy. The five meters of linen contained in Allen’s original basket for London make up some 4 percent of the annual consumption expenditures in London during our period of interest. We know from Friz (Reference Friz1980) and Gross (Reference Gross1990) that clothing for lower-class people in Rome accounted for some 2 percent of their annual budget. Moreover, it seems reasonable to assume that more linen was needed in London than in Rome due to temperature differences. Hence, we do not suspect that including linen in the index will alter our conclusions below. The items contained in each of the two baskets used in the real-wage indices below—one for England and one for Italy—are reported in Table 2.
ALLEN’S RESPECTABILITY CONSUMPTION BASKETS FOR ENGLAND AND ITALY
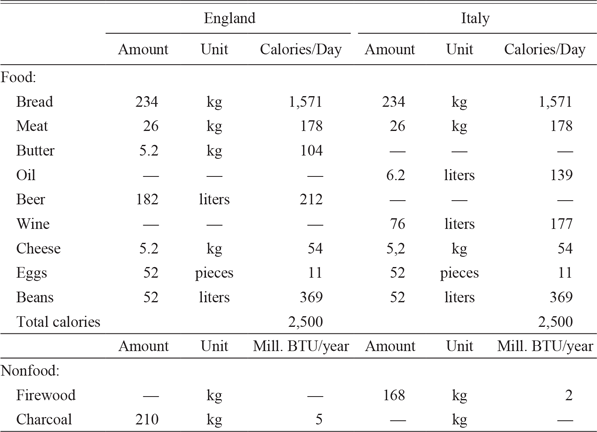
Note: Rent allowance is 5 percent of the total cost of the remaining items in the basket.
Source: Allen (Reference Allen2009).
Prices and Daily Costs of Living
Our Roman prices come from a variety of sources, which are detailed in Online Appendix 1. The bulk of our prices were reported in the Monography on the City of Rome (Direzione generale di statistica 1878) and in Delumeau’s detailed historical Roman economic indicators (Delumeau Reference Delumeau1957). Commodity prices for London and Central-Northern Italy were taken from Allen (Reference Allen2001). Similar to earlier price indices, sporadic gaps in our price series were closed using interpolation (see Online Appendix 1 for details).
It should be noted that Allen predicted the prices of bread from the prices of wheat and labor using his so-called bread equation. Different from that approach, we use the retail market prices of bread published in Reinhardt (Reference Reinhardt1990) instead. This is relevant because public food-price control in Italy—known as the Annona—meant that retailers sometimes received price subsidies (Mocarelli Reference Mocarelli, Hatcher and Stephenson2019). For example, unlike wholesale wheat merchants, whose prices were usually unregulated, retailers, such as bakers, were able to keep their prices stable thanks to these subsidies—except during extreme episodes of famine (Alfani, Mocarelli, and Strangio Reference Alfani, Mocarelli, Strangio, Guido and Cormac2017). Because our bread prices are retail rather than wholesale values, our new Italian cost-of-living index provides a more precise measure of the costs of bread—a main staple in the consumption basket—than the existing index for Central-Northern Italy, which does not fully account for the influence of the Annona. This is clearly visible in the cost-of-living indices below.
Figure 7 shows the daily cost-of-living indices between 1560 and 1810, measured in grams of silver, for Rome (gray line), London (dashed line), and Central-Northern Italy (black line). Although our wages begin in 1543, our prices for Rome were only available from 1560 on, explaining why we start in 1560 rather than in 1543. The indices for Rome and Central-Northern Italy were rather similar, both in size and trend, though with Central-Northern Italy being systematically less expensive than Rome after the 1630s. While the English basket was cheaper during the early part of the period, costing some 60–70 percent of the Italian baskets over the course of the late sixteenth century, it was more than twice as expensive as the Italian ones after 1800. Yet, for most of the period under observation, the costs of living in all three regions differed much less from each other than the observed nominal wages did (see Figures 4 and 5).
SILVER COST-OF-LIVING INDICES IN LONDON, ROME, AND CENTRAL-NORTHERN ITALY, 1560–1810
Notes: The cost-of-living indices are calculated using the baskets reported in Table 2 and express the daily cost in silver of obtaining them. Local polynomial smooth plots with confidence intervals were created using lpolyci in Stata IC/16.
Sources: Prices for London and Central-Northern Italy: Allen (Reference Allen2001). Prices for Rome: see Online Appendix 1.
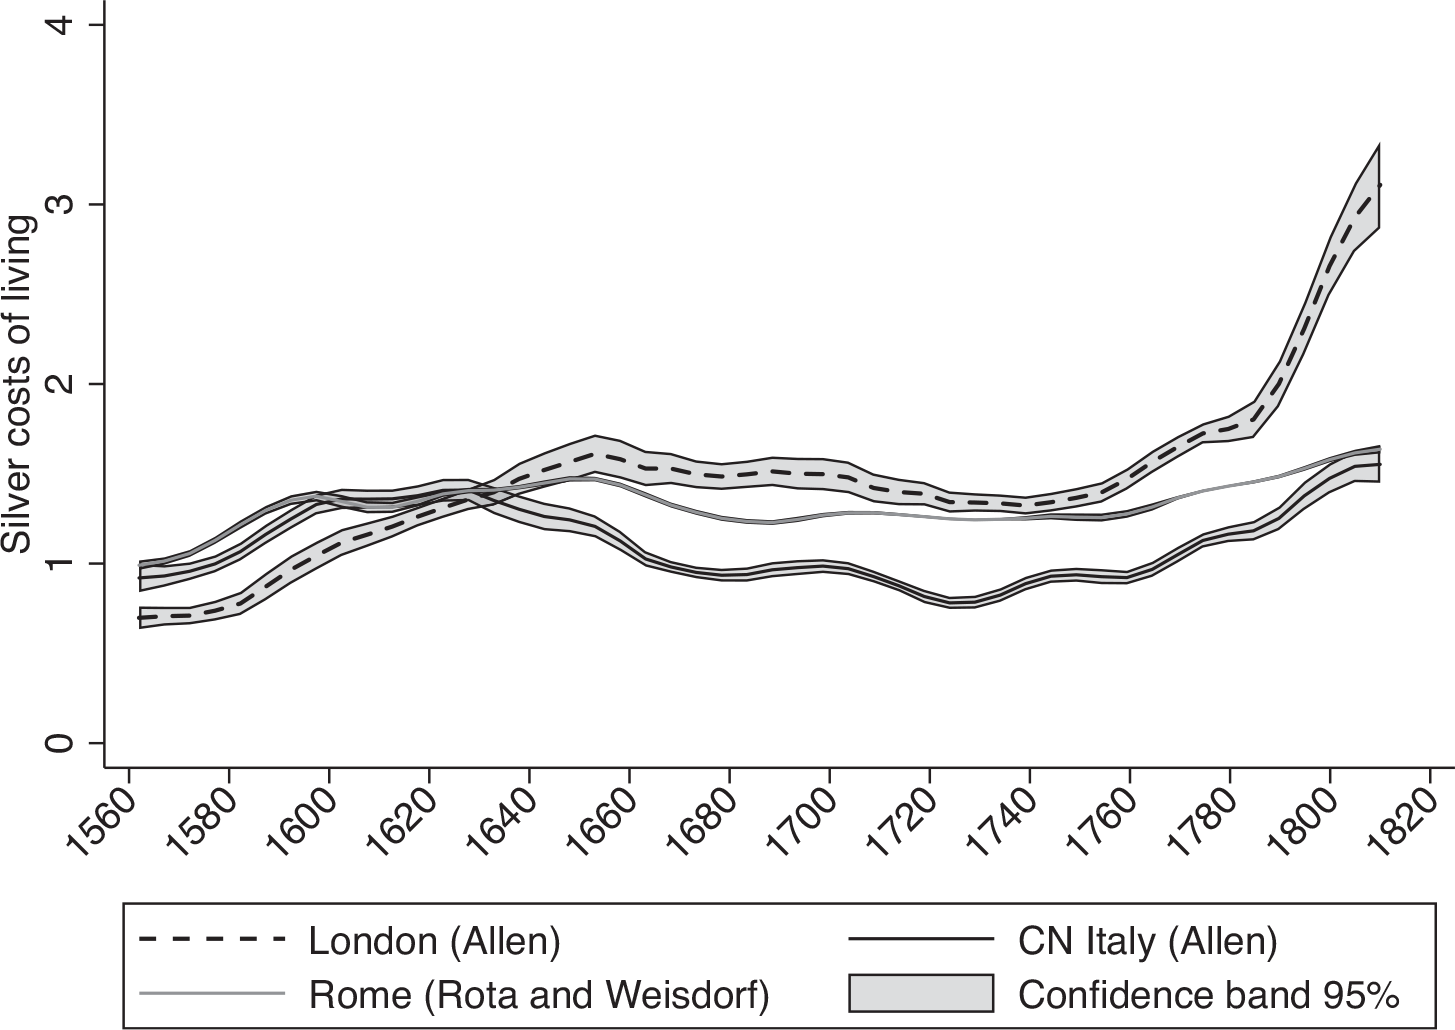
The cost-of-living index also varied much less in Rome than in London and Central-Northern Italy. For the two Italian indices, we suspect their different variability is due to differences in how well the system of the Annona functioned. It is well known that the Annona effectively regulated food prices in Rome, whereas public price intervention in Florence and Milan normally only took effect during food shortages (Strangio Reference Strangio1999; Mocarelli Reference Mocarelli, Hatcher and Stephenson2019; Maffi and Mocarelli Reference Maffi, Mocarelli and Clerici2020). Finally, it is worth noting how the peaks in living expenses roughly coincided with the timing of regional plague outbreaks (Central-Northern Italy: 1629/30, Rome: 1656/57, and London: 1665/66).
REAL-WAGE COMPARISON
This section places our new Italian real-wage indices for skilled and unskilled workers in the context of earlier indices for Italy and England. This serves a dual purpose: to take a fresh look at the timing of Italy’s early-modern downturn and, from an international perspective, to consider our new Italian real wages against Allen’s (Reference Allen2001) original real wages for London before ultimately replacing Allen’s London wages with the downscaled London wages provided in Stephenson (Reference Stephenson, Hatcher and Stephenson2019). The dual goals are, thus, to re-examine Italy’s downturn and its position in the little divergence in European wages and price in light of Mocarelli and Stephenson’s critiques as well as to reconsider the high-wage hypothesis after accounting for the imperfections inherent to earlier real-wage indices.
The real-wage indices for each of the three locations—Rome, Central-Northern Italy, and London—were computed by dividing the nominal daily wage rates by the daily costs of living described above. Similar to the real wages reported in Malanima (Reference Malanima2013), this calculation makes no assumptions about the number of days worked per year or the size of families potentially needing support. Hence, the real wages reported in the following inform simply how many consumption baskets a skilled or unskilled construction worker was able to buy on days when he was working.
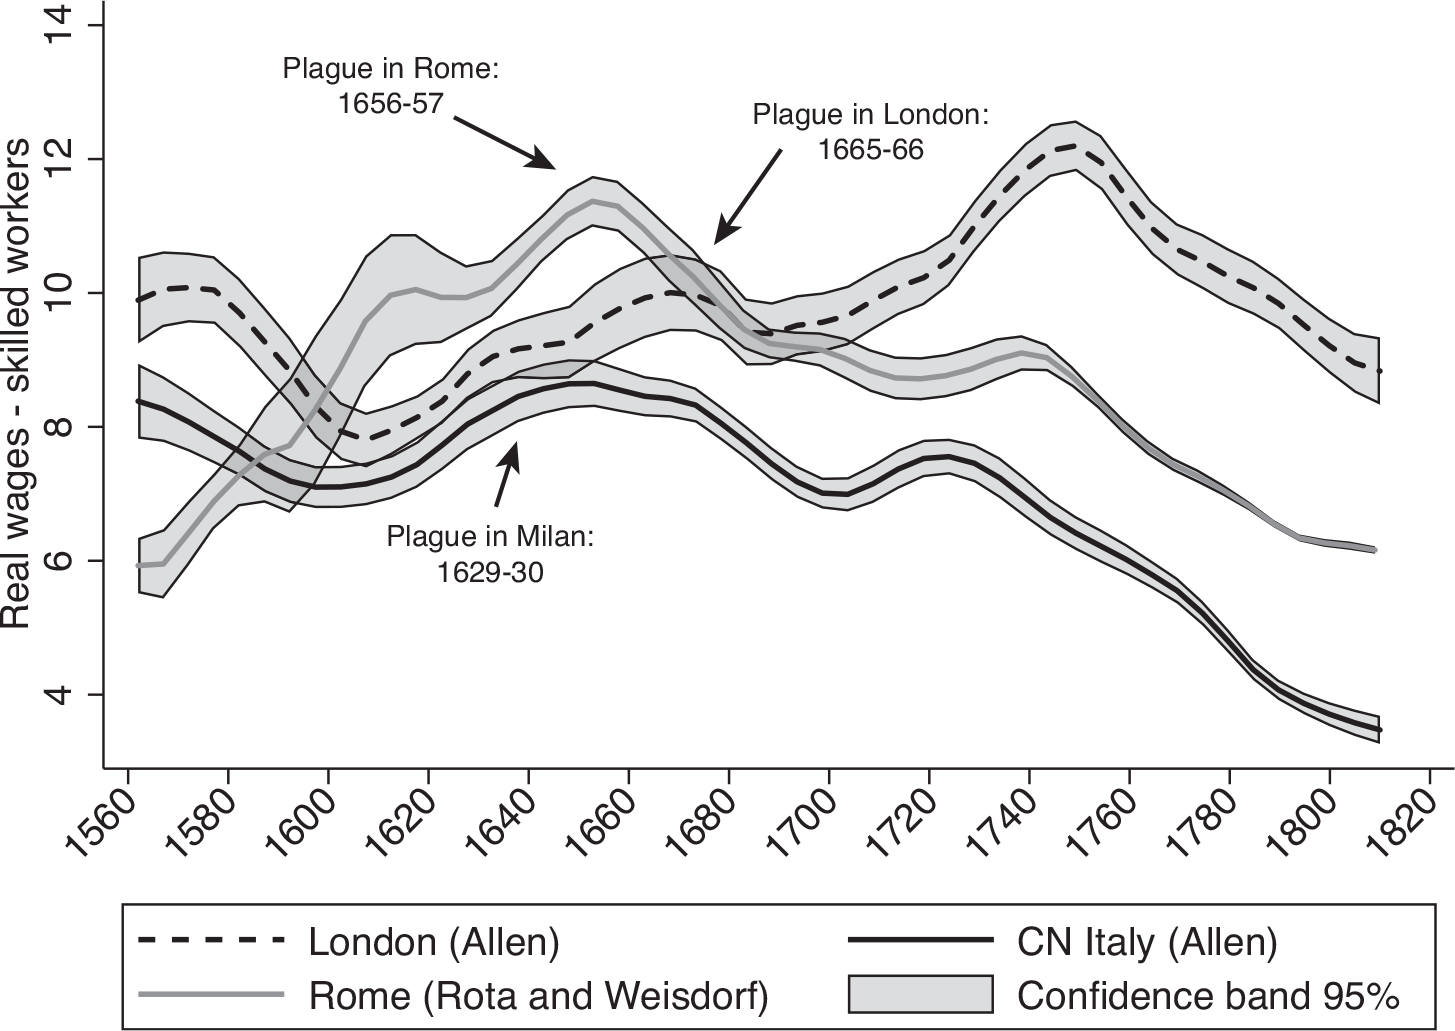
Figure 8 shows, consistent with Allen’s original findings, that the unskilled real-wage gap between London (dashed line) and Central-Northern Italy (black line) was already significant by the mid-sixteenth century. The gap tightened slightly in the early seventeenth century but then grew wider again after the 1630s. By the mid-eighteenth century, at the onset of the classical years of the Industrial Revolution, the real wages in London were some three times higher than in Central-Northern Italy. These developments were roughly similar in the case of skilled workers, as shown in Figure 9, and confirm Allen’s little divergence evidence, except that Italian workers according to the Roman index (gray line) cost more during large parts of the seventeenth century than their London counterparts. A table containing the Roman wages presented in Figures 8 and 9 is found in Online Appendix 3.
REAL WAGES OF UNSKILLED WORKERS: LONDON, ROME, AND CENTRAL-NORTHERN ITALY, 1560–1810
Note: Local polynomial smooth plots with confidence intervals were created using lpolyci in Stata IC/16.
Sources: Nominal wages and prices for Central-Northern Italy and London: Allen (Reference Allen2001). For Rome: see Online Appendix 1.

REAL WAGES OF SKILLED WORKERS: LONDON, ROME, AND CENTRAL-NORTHERN ITALY, 1560–1810
Note: Local polynomial smooth plots with confidence intervals were created using lpolyci in Stata IC/16.
Sources: Nominal wages and prices for Central-Northern Italy and London: Allen (Reference Allen2001). For Rome: see Online Appendix 1.
It is also worth noting that London pulled away from Rome some 50 years later than London’s divergence from Central-Northern Italy. Keeping in mind that the Central-Northern Italian wage data might be biased, the supremacy of the Roman wages relative to those paid in Central-Northern Italy was probably the outcome of an extraordinarily high demand for labor in Rome. For example, while the population in Milan grew by 25 percent between 1500 and 1800, the Roman population increased threefold during the same period (Malanima Reference Malanima1998). According to Piola Caselli (Reference Piola Caselli1999), population growth in Rome was driven more by migration than fertility. Piola Caselli asserts that the inflow of labor was prompted by the city’s great employment opportunities offered by the government of the Papal States (the Curia), the noble families, and, above all, an ever-active building sector (Piola Caselli Reference Piola Caselli1999, p. 389).
Coming back to the question of whether Italy’s early-modern downturn began in the mid-seventeenth century, as both earlier and more recent works have suggested (Cipolla Reference Cipolla1952; Sella Reference Sella1997; Alfani Reference Alfani2013), or during the mid-eighteenth century, as Malanima (Reference Malanima2013) has advocated, depends to some degree on whether the wages considered are those of skilled or unskilled workers. For unskilled workers, severe descent is detectable mainly after 1700, consistent with Malanima’s hypothesis that Malthusian forces were a key impetus to Italy’s downturn. For skilled workers, decline—especially in Rome but also in the more northern parts of Italy (assuming the wages and prices there can be trusted)—started much earlier and clearly coincided with the timing of regional epidemics in the mid-seventeenth century (Figure 9), thus strongly suggesting that plague had a pivotal role in initiating Italy’s prolonged recession (Alfani and Percoco Reference Alfani and Percoco2019). Malanima’s hypothesis is valid also for skilled workers, however, in that Malthusian pressure after the 1740s appears to elongate the downturn. But recession in the real wages of skilled workers commenced long before.
It is also clear from the graphs, perhaps most notably for the evolution of unskilled wages (Figure 8), that Italy’s downturn was not enhanced by the regional shift from Florence to Milan, as one might have expected on the basis of Figure 1. If anything, our new and improved wage indices suggest Italy’s downturn could have been even more severe than hitherto thought, as the real-wage peak observed in Rome is more impressive than what earlier wage series have indicated (Figures 8 and 9). Interestingly, London construction workers also saw their purchasing power decline. But this was mainly after 1750 and was seemingly unrelated to the London plague of 1665/66, which only brought a brief halt in the growth of real wages for skilled London workers (Figure 9).
Unbiased Real Wages
Our novel Italian wage indices, different as they are from the previous and possibly imperfect ones for Central-Northern Italy, enable us to reconsider Italy’s economic position in a little-divergence context. As discussed above, recent studies have shown that the earlier wage indices habitually included a profit margin of foremen and subcontractors in London and Milan alike (Stephenson Reference Stephenson2018; Mocarelli Reference Mocarelli, Hatcher and Stephenson2019). These margins need to be eliminated before we are able to assess what workers actually earned and cost to hire in urban Italy and England.
Figure 10 repeats the unskilled real-wage comparison displayed in Figure 8—this time with Stephenson’s (Reference Stephenson, Hatcher and Stephenson2019) downscaled wages for London covering the period from 1660 to 1770. Mocarelli’s adjusted wages for Milan are not included in the graph, since they begin only at the very end of Stephenson’s period, in 1757. A number of important messages emerge from Figure 10. The first is that Stephenson’s corrected wages (dotted line) still confirm Allen’s hypothesis, as long as the comparison is made (as originally) between London and Central-Northern Italy (black line). The pay gap is obviously smaller this time due to Stephenson’s downscaled London wages. But the gap still widens after 1700, coinciding with the spread of steam engines in England, one of the major labor-saving technological efforts (Nuvolari, Verspagen, and von Tunzelmann Reference Nuvolari, Verspagen and von Tunzelmann2011). Hence, this is still consistent with the high-wage hypothesis, according to which expensive English labor was replaced with machines.
PROFIT-ADJUSTED UNSKILLED WAGES: ROME, LONDON, AND CENTRAL-NORTHERN ITALY, 1660–1770
Notes: Local polynomial smooth plots with confidence intervals were created using lpolyci in Stata IC/16. The real wages for Central-Northern Italy are not adjusted for profits.
Sources: Wages for London: Stephenson (Reference Stephenson2016). Prices for London: Allen (Reference Allen2001). Wages and prices for Central-Northern Italy: Allen (Reference Allen2001). Wages and prices for Rome: see Online Appendix 1.

The downscaled London wages are, however, significantly lower than those reported in our Roman wage index (gray line) at least up until the two lines finally meet, in the 1770s. Stephenson does not report adjustments for the wages of skilled workers, which means we can only draw comparison in the case of unskilled labor. But the conclusion is clear. Allen’s original little divergence between urban England and Italy—with more consistent and unbiased data—has transformed into a little convergence during the eighteenth century.
The fact that more accurate wage data have transformed a divergence between England and Italy into a convergence seems surprising at first. But the explanation is simply that the adjusted wage level for England has shifted down, while the wage level for Italy has shifted up. Because the two wage indices have now changed places compared to Allen’s original analysis, and because the Italian economy still slumps while the English economy booms, the two nations converge rather than diverge. However, had we been able to extend the period of observation beyond the 1770s, it is probable that England and Italy would diverge thereafter.
This still begs the question, though, why seventeenth- and early eighteenth-century Roman wages were superior, both compared to those in the more northern parts of Italy and to those in London. We have already proposed that a continuing need of labor—as reflected in the threefold growth of Rome’s population during the early-modern period—was possibly key in keeping early-modern Roman wages high. But, if city population growth is an important indicator of high wages, then London’s population should have grown dramatically, too. Indeed, the population of Greater London increased twice as fast as the population in Rome, rising from some 200,000 persons in 1600 to a staggering one million around 1800.
Yet, there is another important issue looming in the background. This has to do with the fact that the wages underpinning the regional and international comparisons above are daily wage rates paid to casual construction labor. Construction work was a small and volatile sector, and its casually employed workers were, thus, subjected to the risks of un- or underemployment. Casual employment could ultimately have paid a wage premium, which varied from city to city and needs to be accounted for—a main topic of our concluding remarks below.
CONCLUSION
In this paper, we presented two new and improved wage indices for skilled and unskilled urban workers in historical Italy based on payments related to the construction and maintenance of the St. Peter’s Church in Rome. The new indices, which escape the complications inherent in earlier wage indices for early-modern Italy, confirm the widespread view that urban Italy experienced a prolonged economic downturn—one that saw its onset in the middle of the seventeenth century and persisted at least until the early nineteenth century.
We observed in comparison with earlier wage indices that the onset of downturns coincided with regional incidents of plague outbreaks. This was true for Italy as well as for England. However, the growth in real wages, which England and Italy both experienced before the first half of the seventeenth century, quickly re-emerged in England after the plague had ended. In Italy, by contrast, economic decline persevered. These remarkable differences between England and Italy observed on the doorstep into modern economic growth might be worth a deeper investigation in future work, as they could hold the key to why England industrialized before Italy.
Equally relevant, we also found that, despite Italy’s prolonged downturn, day labor was costlier in Italy than in England once the issues pestering earlier wage indices are eliminated. The latter finding suggests that high wages alone are not enough to trigger industrialization, or alternatively that daily urban construction wages need to be interpreted with greater care in future work, since they might fail to match general trends in economic activities. Indeed, Ridolfi’s (Reference Ridolfi2019) recent study of France suggests there are good reasons to believe that the daily wage rates of urban construction workers were out of tune with those of workers employed in more regular sectors of the economy.
Another important reason why care must be taken is that construction work was seasonal or intermittent (Magnac and Postel-Vinay Reference Magnac and Postel-Vinay1997; Clark Reference Clark2001; Lorenzetti and Merzario Reference Lorenzetti and Merzario2005; Ridolfi Reference Ridolfi2017; Gary Reference Gary2019) and, hence, paid workers a premium for the risk of underemployment (Smith Reference Smith1776; Hatton and Williamson Reference Hatton and Williamson1991; Swenson Reference Swenson1991; Fishback Reference Fishback1998; Atack, Bateman, and Margo Reference Atack, Bateman and Margo2002; Averett, Bodenhorn, and Staisiunas Reference Averett, Bodenhorn and Staisiunas2005; Rota and Weisdorf Reference Rota and Weisdorf2020b). The size of this premium supposedly varied with construction workers’ outside options, which probably not only changed over time but also differed from city to city.
It is not implausible, therefore, that the resulting wage premiums provide misleading estimates of the costs of hiring an average worker across Europe. This makes construction wages an ambiguous unit of account for regional or international comparison and, consequently, an unsuitable testing ground for the high-wage hypothesis. A more appropriate empirical setting for considering the hypothesis about an early-modern divergence across Europe—and particularly for addressing the high-wage argument for why the Industrial Revolution was English—would then be to use wages in the relevant countries more widely and not just in cities, a point already stressed in Ridolfi (Reference Ridolfi2019). An improved living-standard and cost-of-labor comparison would also focus on the wages paid for work that was stable rather than seasonal or intermittent (Rota and Weisdorf Reference Rota and Weisdorf2020b).


 Open access

