I. INTRODUCTION
Porous electrodes have been widely applied in electrochemical systems such as batteries,Reference Douglas and Birk1 fuel cells,Reference Srinivasan, Mosdale, Stevens and Yang2 and dye-sensitized solar cells (DSSCs).Reference Grätzel3 The main technological advantage of porous electrodes is the reduction of the kinetic and mass-transfer resistances to electron transfer by providing a large contact area between the electrode and the electrolyte. In 1991, Grätzel et al.Reference O’Regan and Grätzel4 used a nanoporous electrode made of titanium dioxide (TiO2) nanoparticles to improve the efficiency of dye-sensitized electron transfer systems, thereby introducing them to the solar cell market. Despite the two decades of considerable work aimed at improving the efficiency of DSSCs, their efficiency has plateaued at 12.1% for a 0.28 cm2 cell.Reference Cao, Bai, Yu, Cheng, Liu, Shi, Gao and Wang5 Aside from improving the absorption spectrum of the dyeReference Yum, Baranoff, Wenger, Nazeeruddin and Grätzel6 and using nanostructured electrodes,Reference Bisquert and Vikhrenko7, Reference Galoppini, Rochford, Chen, Saraf, Lu, Hagfeldt and Boschloo8 another avenue for efficiency improvement is to increase the open-circuit voltage, VOC, which is determined by the difference between the electron quasi-Fermi level of the electrode under illumination and the redox level of the electrolyte.Reference Grätzel3 Strategies to increase the VOC involve either (i) moving the redox level of the electrolyte by changing the electrolyte, or (ii) inhibiting the recombination rate, i.e., electron transfer to the oxidized dye molecule. Three-dimensionally ordered macroporous (3DOM) structures, such as inverse opals, exhibit a high surface area and internal accessibility, which can accommodate new, generally more viscous electrolytes.
Alternative electrolytes that have received recent attention include cobalt polypyridine complexesReference Feldt, Wang, Boschloo and Hagfeldt9 in a 60:40 mixture of ethylene carbonate and acetonitrile as well as solid-hole conductors such as spiro-OMeTAD in chlorobenzene.Reference Wang, Liu, Cevey-Ha, Moon, Liska, Humphrey-Baker, Moser, Grätzel, Wang, Zakeeruddin and Grätzel10 The solvent mixtures used for these alternative redox couples are more viscous than acetonitrile (ηacetonitrile = 0.369 mPa s at 25 °CReference Lide11 versus ηethylene carbonate = 1.925 mPa s at 40 °C12 and ηchlorobenzene = 0.753 mPa s at 25 °CReference Lide11), which is used in the traditional DSSC configuration. In this case, the open, porous structure of the inverse opal enables enhanced diffusion of electrolyte ions in the cell. Another advantage of the inverse opal over the nanoporous electrode is the accessibility of its internal structure. The infiltration of a viscous electrolyte into a nanoporous structure can be problematic due to incomplete wetting of the structure, which may increase recombination as a result of reduced electrode-electrolyte interface. In addition to having a large surface area per unit volume, the periodicity of the inverse opal electrode also lends itself to trapping of light within the DSSC, thus improving photon capture.Reference Mihi, Calvo, Anta and Miguez13 However, inverse opal electrodes have a smaller surface area in comparison with the nanoporous electrodes. For balancing the advantages of high surface area and accessibility to the electrode surface for more viscous electrolytes, a systematic study of pore-size-dependent electrochemical properties, such as electron diffusion, electron lifetime, and trap density, is of interest. Such a study requires electrodes of uniform structure and varying pore size, which are accessible via colloidal templating methods.
Inverse opal synthesis via colloidal crystal templating is most attractive because of its low cost and versatility. The general recipe for making these porous structures consists of three sequential steps: (i) self-assembly of monodisperse colloidal particles into a crystalline (usually face-centered cubic, hexagonal close-packed, or a blend) template, (ii) infiltration and deposition of the desired inverse opal material or its precursor into the pores, and (iii) removal of the template to yield the inverse opal structure.Reference Stein14 From a survey of the literature,Reference Velev and Kaler15–Reference Waterhouse and Waterland21 it is clear that many colloidal templating methods have been developed, but that there is no single colloidal templating method that can be consistently used to yield pore sizes spanning the submicrometer- to micrometer-length scale. Most colloidal self-assembly methods rely on gravitational, buoyancy, convective/immersion, and/or electrophoretic forces to form large arrays of close-packed (74%) spheres. Accordingly, we have chosen sedimentation (S)Reference Whitmore22–Reference Mayoral, Requena, Moya, López, Cintas, Miguez, Meseguer, Vázquez, Holgado and Blanco24 and interfacial assembly (IA)Reference Liu, Wang, Lee and Kotov25 to study the particle-size-dependent effects of gravitational and buoyancy forces, respectively. Electrophoretic deposition (EPD)Reference Rogach, Kotov, Koktysh, Ostrander and Ragoisha26 is used to study the impact of electrophoretic forces on particle-size-dependent assembly. The particle-size-dependent effects of convective/immersion forces are studied in horizontal and vertical geometry in convective assembly (CA)Reference Prevo and Velev27 and liquid phase deposition (LPD),Reference Jiang, Bertone, Hwang and Colvin28–Reference Shimmin, DiMauro and Braun30 respectively. A more recently developed method, so-called coassembly (CoA),Reference Hatton, Mishchenko, Davis, Sandhage and Aizenberg31, Reference Kumnorkaew and Gilchrist32 combines the opal formation and the infiltration step and its particle-size dependence is therefore also considered here.
In this article, we report on inverse opal TiO2 electrode fabrication from templating particles ranging in size from 0.5 to 10 μm using a set of six most commonly used colloidal assembly methods. Only the method of and the particle size used for the opal assembly are varied, whereas the colloidal particles, infiltration material, and conditions for infiltration are kept the same. Our results identify specific methods for each particle size leading to inverse opal TiO2 electrodes with pore sizes ranging from the submicrometer- to micrometer level with comparable structural quality. The information provided by our study will enable systematic electrochemical studies on inverse opal TiO2 electrodes with various pore sizes, in which the influence of the inverse opal preparation methods used is minimized.
II. EXPERIMENTAL SECTION
A. Materials
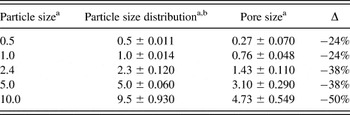
Opals were prepared from colloidal suspensions of sulfate-terminated polystyrene particles (PS) purchased from Invitrogen (IDC Latex; Invitrogen™, Life Technologies, Grand Island, NY). Table I summarizes the particle sizes and standard deviations provided by Invitrogen. With exception of the 10 μm particles, the variability in the diameter of the particles was below the 5–8% threshold, and can therefore be classified as monodisperse.Reference Murray, Kagan and Bawendi33 The inverse opal replicas were prepared by filling the opal pores with a titania precursor solution of a known recipeReference Scolan and Sanchez34: titanium (IV) isopropoxide (Fisher Scientific, Pittsburgh, PA), 1-butanol, acetylacetone (Sigma-Aldrich, St. Louis, MO), para-toluenesulfonic acid, and Millipore deionized water. Titanium (IV) bis-ammonium lactate dihydroxide (Ti-BALDH; 50% aqueous solution) (Sigma-Aldrich) was used as the precursor for the CoA method. All samples were deposited on 1″×1″ fluorine-doped tin oxide (FTO; Pilkington TEC7, 10 Ω/sq) substrates. Three samples were prepared per particle size and assembly method.
Comparison of the size of PS sulfate latex particles with their corresponding inverse opal poresa.

a All values in μm.
b Numbers reported by Invitrogen.
B. Opal fabrication
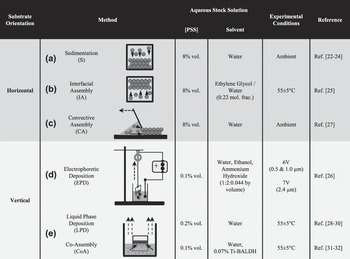
Figure 1 summarizes the experimental setup and materials used for the six colloidal assembly methods. Based on the position of the substrate during opal assembly, the different methods are divided into two categories: horizontal [Figs. 1(a)–1(c)] and vertical deposition [Figs. 1(d) and 1(e)] methods. The thickness of the opals was controlled by adjusting the volume fraction (see Fig. 1) of the colloidal suspension, such that all opals had a thickness of 6–9 layers. The uniformity of the opals was improved by adjusting the withdrawal or evaporation rates. The substrate was washed using isopropanol, acetone, and DI water prior to use. The polystyrene (PS) solution was assembled into a well of dimensions 1.6 × 0.8 cm. The well molds, an acrylic film with adhesive backing, were made using a paper punch of the same dimensions. Further details for each method can be obtained from the references listed in the rightmost column of Fig. 1.
Experimental details for Opal Fabrication Methods. (a) Sedimentation, (b) IA, (c) CA, (d) EPD, (e) Liquid Phase Deposition/CoA. Solid arrows indicate direction of prominent assembly forces. Dashed arrows indicate evaporation flux or direction of moving parts (see text for details).

C. Inverse opal fabrication
Each opal sample, which was left leaning on a larger glass slide, was dipped in a bath of the titanium dioxide precursor.Reference Liu, Zou, Zhao and Cui35 The concentration of TiOx in the Ti-isopropoxide precursor was ∼12.5% in butanol and that of the Ti-BALDH (used for CoA) was ∼10% in water. The precursor infiltrated via capillary action. The slanted position of the substrate prevented the formation of an overlayer. After ∼15 min of infiltration time, the slide was removed and allowed to dry in air vertically for 15 min. This procedure was repeated three times. In subsequent treatments, a top slide was added to help the liquid climb to the top of the sample to ensure complete infiltration. Finally, the samples were sintered in a temperature-controlled furnace (Barnstead Thermolyne 1400, Dubuque, IA) at 450 °C. Note that the pores are on average 31% smaller than the PS template particles used (see Table I) due to conversion of the amorphous TiO2 precursor to the anatase crystal structure, in good agreement with values reported for sol-gel methods.Reference Imhof and Pine36–Reference Wijnhoven and Vos38
D. Characterization
All opal and inverse opal samples were imaged using a Zeiss EVO 40 Scanning Electron Microscope (Carl Zeiss Microscopy, LLC, Thornwood, NY) in high-vacuum mode. SEM images of each sample were taken at four (1250×, 522×, 200×, and 100×) magnifications. The magnification of the images used for comparison were chosen to show a similar number of particles (104 particles) for each particle size: 0.5 μm (1250×), 1.0 μm (522×), 2.4 μm (522×), 5.0 μm (200×), and 10.0 μm (200×).
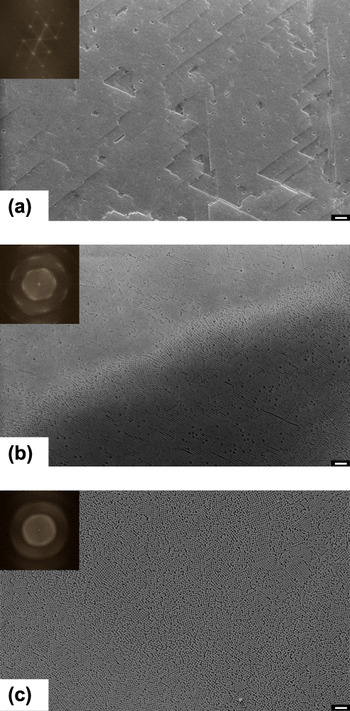
The quality of the opals and inverse opals obtained from each method was analyzed via Fast Fourier Transforms (FFTs) of the respective SEM images.Reference Blanford, Carter and Stein39–Reference Sinitskii, Abramova, Laptinskaya and Tretyakov41 Both opal and inverse opal structures are highly periodic in nature, and any structural defects that lead to a break in the periodicity are detected in the reciprocal of the actual image. Applying FFT to an image transforms it from the spatial domain to reciprocal space. Figure 2 shows exemplary FFTs for opals made from 0.5 μm particles. FFT images show spots for single crystals [Fig. 2(a)] or diffuse spots or rings for polycrystalline samples [Fig. 2(b)] and contain information on lattice periodicity. Crystal defects such as dislocations and stacking faults appear as randomly distributed points grouped along crystallographic directions. For amorphous materials, the FFT images consist of ill-defined diffuse halos [Fig. 2(c)]. The presence of structural defects affects the power spectrum by decreasing the spot intensities and increasing the diffuse background.Reference Palacios-Lidon, Juárez, Castillo-Martinez and Lópex40
Fast Fourier Transform (FFT) of Scanning Electron micrographs (SEM). (a) SEM image of opal made from 0.5 μm particles by liquid phase deposition. Inset: High degree of order in the opal is reflected by the pronounced hexagonal pattern in the FFT. (b) SEM image of opal made from 0.5 μm particles by CA. Inset: Polycrystallinity of the opal is apparent from the appearance of diffuse spots in the FFT. (c) SEM image of opal made from 0.5 μm particles by CA. Inset: Amorphous nature of the close-packed particles is shown by the ill-defined halo in the FFT. Scale bar in micrographs is 10 μm.

The FFT analysis of the images (1023 × 767 pixel area) was done using NIH ImageJ 1.45i. The scale bar determined by the SEM software was used as the calibration standard for spatial dimensions. A square grid was superimposed over an SEM image to assist in the measurement of the single-crystal domain size. The grid size was chosen such that areas of apparent single-crystal domains were contained within the grid windows, while avoiding grain boundaries. The numbers reported for the opals reflect the largest contiguous single-crystal domain with identical FFT, i.e., when the FFT of two neighboring squares was identical they were counted toward the same single crystal domain.
The inverse opal FFT analysis is more delicate due to the presence of cracks. Although cracks break up the inverse microstructure, the orientation of the pores in the “cracked domains” remains unchanged. However, FFT analysis is sensitive to such defects and translates cracks as diffuse halos, and ultimately masks the order shown by the pores on either side of the crack. As a result, single-crystal domains of the inverse opals are measured across cracks, while excluding the crack itself.
III. RESULTS
Sedimentation (S), interfacial assembly (IA), convective assembly (CA), electrophoretic deposition (EPD), liquid-phase deposition (LPD), and assembly (CoA) have been used to prepare opal structures from templating particles ranging in size from 0.5 to 5 μm. Opals were subsequently infiltrated with a titania precursor and were also calcined leading to the formation of inverse opal structures. Both opal and inverse opal structures were analyzed using scanning electron microscopy (SEM) and FFTs. Note 10 μm particles do not yield close-packed opals with any of the six methods due to their polydisperisty and therefore have been excluded from detailed analysis.
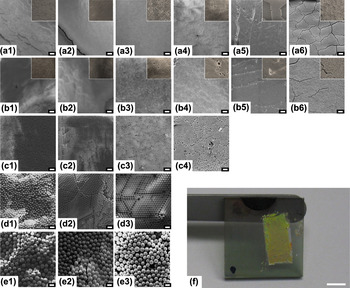
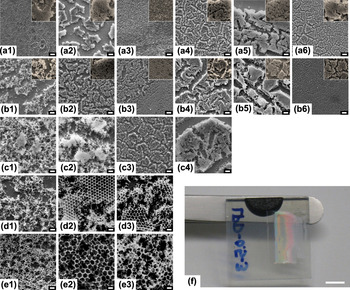
Figures 3 and 4 present representative SEM images of opals and inverse opals, respectively, for each method (rows) and particle size (columns) allowing for a quick qualitative comparison of the opal and inverse opal structures with respect to their quality, number of cracks, and apparent domain size. Figures 3(f) and 4(f) depict a digital image of an opal and an inverse opal electrode, respectively, revealing their long-range order through opalescent colors.
SEM images of PS opals. Rows represent particle sizes—(a) 0.5 μm, (b) 1.0 μm, (c) 2.4 μm, (d) 5.0 μm, and (e) 10.0 μm. Columns represent methods—(1) Sedimentation, (2) IA, (3) CA, (4) EPD, (5) Liquid Phase Deposition, and (6) CoA. Scale bars are 10 μm. Areas of larger magnification (4× for 0.5 μm, 2× for 1.0 μm) are included as insets for opals made from particles with 0.5 and 1.0 μm diameters (top two rows). (f) Photograph of opal prepared from 1.0 μm particles by sedimentation showing typical iridescent appearance. Scale bar is 6 mm.

SEM images of titania inverse opals. Rows represent particle sizes—(a) 0.5 μm, (b) 1.0 μm, (c) 2.4 μm, (d) 5.0 μm, and (e) 10.0 μm. Columns represent methods used for opal template formation—(1) Sedimentation, (2) IA, (3) CA, (4) EPD, (5) Liquid Phase Deposition, and (6) CoA. Scale bars are 10 μm. Areas of larger magnification (4× for 0.5 μm, 2× for 1.0 μm) are included as insets for inverse opals made from opals with 0.5 and 1.0 μm diameter particles. (f) Photograph of inverse opal prepared from 0.5 μm particles by liquid phase deposition showing typical iridescent appearance. Scale bar is 6 mm.

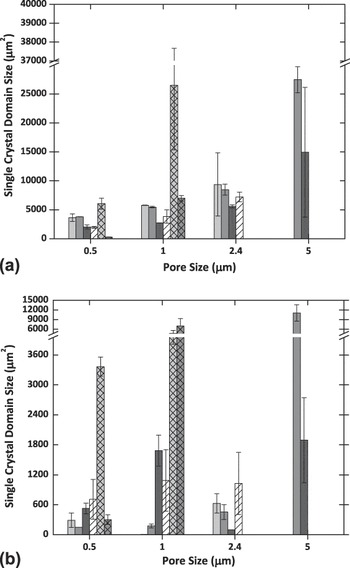
Subsequently, a quantitative comparison of domain size has been performed by analyzing the SEM images using FFT yielding the size of single-crystalline areas (Fig. 5). The typical domain size for each method and particle size is generally smaller than the area displayed at the magnification chosen for FFT analysis. Hence, each image contains at least two complete domains. Reported domain size values are averaged over results from at least three images from three independently prepared samples. Figure 5 shows the trends for the largest single crystal domain found for the opals [Fig. 5(a)] and inverse opals [Fig. 5(b)], respectively, as prepared by the various assembly methods.
Domain size in μm2 obtained from FFT analysis for (a) opals and (b) inverse opals with particles ranging from 0.5 to 5 μm. Patterns and shades indicate the six assembly methods: sedimentation—light gray, IA—dark gray, CA—black, EPD—white hatched, liquid phase deposition—light gray, cross-hatched, and CoA—dark gray, crosshatched.

From Fig. 5, it can be concluded that 0.5 and 1.0 μm particles show a clear preference for vertical deposition methods (hatched), whereas the larger particles (2.4 and 5.0 μm) prefer the horizontal deposition methods (solid). Convective Assembly (CA, black) shows the smallest single crystal domains regardless of particle size. The preference of the smaller particles (0.5 and 1.0 μm) for liquid phase deposition (LPD, crosshatched) translates to their inverse opal structures. On the contrary, the preferred opal assembly method of each of the larger particles (2.4 and 5.0 μm) does not translate to their inverse opals structures. Comparison of Figs. 5(a) and 5(b) reveals an overall decrease of 66% in single-crystal domain size from opals to inverse opals in good agreement with the 33% reduction in pore size due to densification of the TiO2 precursor during calcination (Table I) and the qualitative differences apparent from the SEM images displayed in Figs. 3 and 4.
IV. DISCUSSION
The aim of our study has been the preparation of TiO2 inverse opal electrode structures of comparable quality and domain size with varying pore sizes and minimal grain boundaries to be used for the elucidation of particle-dependent trends in electrochemical studies with viscous electrolytes. An inverse opal electrode, when fabricated under optimum conditions, is a structure with a predictable pore size and porosity. Accordingly, these electrodes are especially apt when the intent is to systematically study pore-size-dependent electrochemical properties. In a traditional DSSC, the TiO2 electrode comprises a random network of interconnected ∼20 nm TiO2 nanoparticles that are sintered together. This configuration has a distribution of cracks and grain boundaries that vary from one electrode to the next. Electrochemical properties of such an electrode would depend on the method of fabrication of the TiO2 nanoparticle as well as the electrode itself. On the other hand, an inverse opal electrode when synthesized by a single method has reproducible qualities. In this section, we show that comparison of inverse opals over a wide range of pore sizes is possible despite the use of different methods. Here, the common factor across the methods is the single domain size of the resulting inverse opal structure (Fig. 5). Using FFT analysis, we show that the inverse opals from LPD for templating particles with sizes ≤1 μm, from EPD for particles ranging in size from above 1 μm and below 5 μm, and from IA for particles with sizes ≥5 μm, all have comparable domain sizes.
A. Quality of FFT analysis
The advantage of the FFT analysis method used for Fig. 5 is that it is a cost-effective way to quantify the crystallinity of an ordered structure from an SEM or optical micrograph in the absence of other tools such as x-ray diffractometry (XRD) or spectroscopy. The analysis of reciprocal space compresses the information of real space images by looking at the spatial periodicities. As a result, it gives quantitative information on domain distribution, size, and orientation as well as defect density and distribution, all of which are often difficult to judge accurately from SEM images. One caveat of Fourier analysis performed on 2D images is that it does not include information about the entire 3D structure of the sample, as could be obtained by conventional diffraction methods.Reference Blanford, Carter and Stein39 However, our analysis of the opals and inverse opals shows that there is a correlation between ordering on the surface and order underneath with the exception of the IA method. Vertical assembly methods, which yield inverse opals with large domains, have less stacking faults compared with the horizontal methods that yield inverse opals with comparatively smaller domains. Overall, we conclude that surface FFT analysis in conjunction with observations on stacking faults is a simple and straightforward diagnostic tool for quantitative evaluation of the quality of multilayered opals and inverse opals.
B. Choosing a method based on particle size
Regardless of particle size, the criteria for selecting an optimum method for inverse opal fabrication are the same: substrate orientation, particle volume fraction, and colloidal assembly forces. Provided that the template spheres are monodisperse, the success of a colloidal assembly method to yield good opals depends on the balance that it affords for the competing assembly forces that are at play in each method. Our FFT analysis shows that there is a method of choice for each particle size range (Fig. 5).
1. Submicrometer particles
For particle sizes ≤1.0 μm, liquid phase deposition [LPD Figs. 4(a5) and 4(b5)] yields the best opals and inverse opals. Considering the similarity in particle assembly conditions between LPD and CoA, their results were expected to be similar. However, CoA inverse opals did not have the six-point FFT that their LPD counterparts had. Careful analysis of the images reveals that the particles are trapped in a precrystallization stage. Most likely, too high an evaporation rate at T = 55 ± 5° arrests the particles in mid-formation. Nonetheless, scrutiny of the CoA inverse opals shown here revealed that they have the narrowest cracks in comparison to all the inverse opals [Figs. 4(e1) and 4(e2)]. However, higher quality inverse opals were obtained (not shown) when the particle-to-precursor concentration was optimized. The salient reasons for the success of the LPD method are as follows:
(i) Evaporation of the solvent over long periods leads to convection as the major driving force of the LPD assembly process. Owing to their size, submicrometer particles stay mobile longer as they experience Brownian motion and hence have more time to self-organize into the FCC crystal arrangement.
(ii) Upon comparing the results for sedimentation (S) and interfacial assembly (IA) with LPD in Figs. 5(a) and 5(b), it becomes apparent that substrate orientation has an impact, i.e., vertical orientation leads to a larger single-domain size. The vertical orientation in LPD wins out mainly because the convective assembly (CA) forces acting on the particles remain essentially the same throughout the opal assembly process. The convective forces acting in LPD move the particles to the meniscus between the solvent and the substrate, and the substrate is covered with the opaline array as the liquid level falls due to solvent evaporation. In the case of the horizontal sedimentation and IA methods, forces at play for the formation of the initial layer are different from those involved in the formation of successive layers. In sedimentation, for example, gravitational forces push the particles toward the substrate. Short-ranged particle-substrate interactions determine the crystallinity of the first layer and the quality of successive layers. In contrast, in IA, the formation of the initial layer is affected by buoyancy and flotation forces, whereas subsequent layers are affected mainly by buoyancy forces. The impact of the differences in formation of initial and subsequent layers can be mitigated but not eliminated by very slow evaporation rates (i.e., days instead of hours). However, regardless of the extent of the assembly period, the changing forces for particle assembly result in a structure that is initially well packed but prone to stacking faults in subsequent layers. The impact of the stacking faults become evident post infiltration in the form of catastrophically broken inverse opal structures.
(iii) In two of the six methods under review, i.e., CA and EPD, the magnitude of the force driving the assembly process can be controlled externally. In CA, evaporation-induced convection hastens the particles to the meniscus. Brownian motion, which predominates the motion of submicrometer particles, leads to an unbalanced crystal growth, resulting in stacking faults. These faults weaken the multilayered inverse opal microstructure, causing cracks to appear with higher spatial frequency. Similarly in EPD, a higher applied voltage causes an increase in the electrophoretic force acting on the particles leading to faster nucleation and crystallization on the substrate. As a result, assembly time is shortened and opal quality is compromised.
2. Particle sizes above 1 μm and below 5 μm
The FFT results show that EPD is best for particles with diameters in the range from 1< d < 5 μm. A comparison of Fig. 5(a) with Fig. 5(b) suggests that this size range represents the boundary of particle sizes that are strongly affected by gravitational forces. Though particles in this size range show larger single-crystal domains with the horizontal deposition methods for opal formation, the inverse opals of these particle sizes are best formed by EPD. Hence, the decision for substrate orientation can vary with the end goal of opal or inverse opal fabrication. Since Fig. 5 shows the absolute domain size with respect to particle size, it is notable that the domain sizes of the 2.4 μm particles are smaller in comparison to the 1 μm particles. This discrepancy is a result of the higher degree of polydispersity of the opal template particles: ∼5% for 2.4 μm compared with <2% for 0.5 and 1 μm particles. The salient reasons for success of the EPD method are as follows:
(i) When it comes to stacking faults, particle size has a significant impact. Gravitational forces acting on particles become significant in this particle size range. The electric field in EPD lengthens the timescale for nucleation and crystallization by counteracting the effect of gravitational forces and thereby improves the quality of the opals and inverse opals. In contrast, the convective forces in CA in conjunction with the sedimentation tendency of particles in this size range lead to an opal structure that is rife with stacking faults. This disadvantage translates to the inverse opal structure as seen in Figs. 4(c3)–4(e3).
(ii) Although the IA method is optimized for the high-particle volume fraction of 8%, it is the inverse opals from EPD that prove to be more robust as evidenced by the larger domain size.
3. Particles ≥5 μm
Last but not least, particle sizes ≥5.0 μm are best assembled into opals by the action of buoyancy forces occurring in IA. Owing to their size and weight, these particles need an extra incentive to stay mobile in the solution, such as density matching and/or ultrasonication. It has been shown that enhanced (20%) ordering of colloid particles can be achieved via particle settling under ultrasonication.Reference Vickreva, Kalinina and Kumacheva42 However, the inverse opal counterparts do not fare as well. In Figs. 4(d2) and 4(e2), the top of the structure is intact whereas the layers underneath are catastrophically broken. The reason for the poor inverse opal quality is likely the mismatch between the packing of the initial layer and subsequent layers (see above). This discrepancy is exacerbated during precursor infiltration and additionally due to shrinkage during calcination. EPD with a density-matched electrolyte or a horizontal substrate orientation are other options for assembly of particles with d ≥ 5.0 μm.
Figure 5(b) can be used for the preparation of either (i) inverse opal electrode structures of constant pore size, but varying single-domain size or (ii) electrodes with comparable single-domain size, but varying pore size. As a result, the effect of single-domain size and pore size on electron diffusion, electron lifetime, and trap density can be studied independently, leading to a better understanding of the factors influencing cell efficiency in the presence of electrolytes of varying viscosity. As long as PS particles are used as templating particles, the trends displayed in Fig. 5 should be applicable to other infiltrating precursors such as zinc oxide (ZnO) and manganese dioxide (MnO2).
V. CONCLUSIONS
We have studied the effect of particle size on inverse opal TiO2 electrode quality using a selection of methods that use gravitational, buoyancy, convective/immersion, and electrophoretic forces. Our study shows that inverse-opal TiO2 electrodes with pore sizes ranging from the submicrometer to the micrometer level can be prepared and compared despite the use of different colloidal assembly methods, opening up the systematic electrochemical study of such electrodes.
Using the same fabrication materials (PS latex, titania precursor) and conditions (aqueous stock solutions), only parameters such as the particle size and assembly method are varied. The experimental parameters themselves allow comparison based on changes in particle volume fraction, temperature, and precursor viscosity. The resulting opals and inverse opals are optically characterized by SEM. FFTs of the micrographs provide quantitative measurements of the quality of both the opals and the inverse opals.
Our analysis shows that in addition to monodispersity and slow crystal growth,Reference Goncalves, Bras and Almeida20, Reference Wong, Kitaev and Ozin29 assembly forces and particle size are important for selecting a method for fabricating high-quality inverse opals. Our FFT results identify the methods that can yield comparable domain sizes with variable pore sizes. In the case of particle sizes ≤1.0 μm, our results confirm what is generally reported in the literature, i.e., good quality opals yield large-area defect-free inverse opals. Among the methods studied, LPD is the best for particles sizes ≤1.0 μm. The results also show that inverse opals by CoA could potentially be better than inverse opals by LPD, provided the particle-to-precursor ratio and temperature are optimized. For particles sizes >1.0 μm, the probability of a mismatch in the orientation of successive layers is higher. Consequently, the best inverse opals are made from opals with the least stacking faults. EPD is the best method for assembling particles ranging from above 1.0 μm to below 5.0 μm. Our results further show that IA coupled with ultrasonication is the best way to make monolayers of particles ≥5.0 μm. EPD or CoA, coupled with density matching emerges as a potential method for fabricating multilayered opals from particles with d ≥ 5.0 μm. Using the data summarized in Fig. 5, one can start to explore the electrochemical properties of inverse opal TiO2 electrodes.
ACKNOWLEDGMENTS
This research was supported by funding from PSC-CUNY Awards (Nos. 69038-0038, -0039, and -0040) and an Electricity Storage Research Seed Grant from the CUNY Energy Institute. SM acknowledges NSF IGERT (No. 0221589) and CENSES (NSF No. 0833180) for graduate fellowships. Prof. Raymond Tu is acknowledged for his helpful comments on an earlier version of this manuscript.