


Identity formation and social development are key components occurring during adolescence. When young people are unable to connect with their peers and lack a sense of belonging, they are likely to feel socially isolated. Maintaining quality connected peer relationships is an essential component of achieving positive mental wellbeing (Carroll, Houghton, Bourgeois, Tan, & Ozsoy, 2014; Corsano, Majorano, & Champretavy, Reference Corsano, Majorano and Champretavy2006; Hall-Lande, Eisenberg, Christenson, & Neumark-Sztainer, Reference Hall-Lande, Eisenberg, Christenson and Neumark-Sztainer2007). Corsano et al. (Reference Corsano, Majorano and Champretavy2006) found that the key factor determining psychological wellbeing in early adolescents is acceptance and integration among peers.
Today, the use of technology and online social networking has become progressively more important in the lives of young people. Social networking sites are web-based services that allow users to partake in activities such as constructing a public profile, managing other users with whom they share a connection, and viewing the activities of others with whom they are connected (Boyd & Ellison, Reference Boyd and Ellison2008). There are many online social networking sites commonly used by adolescents including, but not limited to: Facebook, Twitter, Flickr, Instagram, Snapchat, Tumblr, Google+, Vine, Kik Messenger, and WhatsApp. A study conducted in 2011 by the American Academy of Pediatrics (AAP, 2011) found that more than half of adolescents access online social networking sites more than once a day. It is thus reasonable to expect that acceptance and integration in these online settings would be key factors for adolescent socialisation and wellbeing today. The purpose of this study, therefore, was to understand the influence of online social networking sites on adolescent wellbeing and connectedness to their peers.
Background
This current study is part of a larger four-phase study investigating how schools promote social connectedness and engagement in their students (see Procedure Section). Part of that data examined how young people connected to others using social networking sites and is the subject of this article.
Social Connectedness and Wellbeing
Adolescent social connectedness can be measured across the following domains: family, peers, school, and community (Jose, Ryan, & Pryor, Reference Jose, Ryan and Pryor2012). Peer connectedness, in particular, has been found to be an important predictor of wellbeing in adolescents (McGraw, Moore, Fuller, & Bates, Reference McGraw, Moore, Fuller and Bates2008). Further, these researchers found that a sense of connectedness was negatively correlated with mental health issues such as depression, stress, and anxiety.
A group is able to maintain a sense of social connectedness when individuals feel at ease to contribute to group conversation, as well as foresee social interactions among members (Slagter van Tryon & Bishop, Reference Slagter van Tryon and Bishop2009). Conversely, an individual will experience connectedness when he or she obtains a sense of belonging within the group where they feel a level of comfort to be their authentic self (Jose et al., Reference Jose, Ryan and Pryor2012).
An individual's behaviour within the social world is somewhat controlled by their level of social connectedness, which in turn affects their emotions and life perceptions (Duru, Reference Duru2008). Therefore, those who have a greater sense of social connectedness are more likely to cope with emotions through their ability to adjust to social environments. This behaviour is an important part of how adolescents present and promote themselves for inclusion within a group. Previous research on reputation enhancement and goal setting has shown that adolescents who want to be perceived by others in a certain way regulate self-presentation and self-identity (Carroll, Houghton, Durkin, & Hattie, Reference Carroll, Houghton, Durkin and Hattie2009). This encompasses both academic and social goals. Adolescents manage peer reputations through their social goals usually as conforming or non-conforming individuals (Carroll et al., Reference Carroll, Houghton, Durkin and Hattie2009).
Social Connectedness Online
Face-to-Face Communication Skills
Recently, maintaining a sense of social connectedness to peers also encompasses an online component. Given that the use of social networking sites has become more prominent, some researchers suggest that face-to-face communication is being replaced with time spent online, increasing the possibility of depression and a lack of social support (Harmen, Hansen, Cochran, & Lindsey, Reference Harman, Hansen, Cochran and Lindsey2005). A large component of adolescent development comprises developing efficient social skills essential for maintaining friendships. While there is data that supports skill building such as acquiring and maintaining friendships, a sense of normalcy, and better communication skills due to adolescent internet use, there is also concern that many of these young people can hide behind the screen, hindering their ability to socialise in public settings (Subrahmanyam & Greenfield, Reference Subrahmanyam and Greenfield2008). Pederson (Reference Pederson2012) argues that the heavy use of online communication prevents young people from seeing people's reactions to comments and posts, impeding their ability to have an empathetic reaction, which in turn can affect the development of healthy decision-making processes.
Friendship Problems Online
While online social networking can be beneficial to young people, teenage turmoil and feelings of loneliness are still probable. Reich's (2010) study found that 25% of high school students and 21% of college students have experienced problems with friendships due to activity on social networking sites. The main issues included drama (caused by rumours and discovered betrayal), misunderstandings (due to feelings of exclusion because of friends and romantic partners wrongly interpreting remarks posted by others, related to betrayal that never took place), and aggravation of problems (e.g., peers sharing private information publically, and modifications to ‘top friends lists’; Reich, Reference Reich2010).
While the majority of young people report feeling safe online, social networking sites such as Facebook provide an easy opportunity for young people to harass, criticise, and exclude each other with a peer audience (Barnett, Reference Barnett2009; Dempsey, Sulkowski, Nichols, & Storch, Reference Dempsey, Sulkowski, Nichols and Storch2009; Subrahmanyam & Greenfield, Reference Subrahmanyam and Greenfield2008; Willard, Reference Willard2007). These researchers have outlined some dangers that online bullying can have beyond physical bullying. For example, online bullying is more invasive than face-to-face bullying, taking place anywhere at any time, without allowing the target person to remove him or herself from the situation, and the predator may have access to a greater number of individuals (Dempsey et al., Reference Dempsey, Sulkowski, Nichols and Storch2009). Additionally, it is argued that people can be more verbally aggressive when masked by an electronic device, as opposed to face-to-face contact (Dempsey et al., Reference Dempsey, Sulkowski, Nichols and Storch2009; Patchin & Hinduja, Reference Patchin and Hinduja2006), and there is much less adult supervision (Dempsey et al., Reference Dempsey, Sulkowski, Nichols and Storch2009).
Hinduja and Patchin (Reference Hinduja and Patchin2011) found that the majority of online bullying cases involved peers who knew each other. Furthermore, the young people who are most at risk for victimisation offline are the same as the ones targeted online (AAP, 2011; Paul, Reference Paul2012; Willard, Reference Willard2007). Alice Marwick, a researcher at Microsoft, contends: ‘it's not that the internet is doing something bad to these kids, it's that these bad things are in kids’ lives and the internet is just a component of that’ (Paul, Reference Paul2012). Although there tends to be a focus on the negative effects of online communication, reports show that young people report that social networking sites have provided a safe space for them to mend problems with friends (Reich, Reference Reich2010) and ultimately develop more connected relationships (Boyd & Ellison, Reference Boyd and Ellison2008; Lenhart & Madden, Reference Lenhart and Madden2007; Reich, Reference Reich2010; Valkenburg & Peter, Reference Valkenburg and Peter2007).
Creating a Public Identity Online
Young people create their online profiles for their anticipated audience, which is subtly perceived and not necessarily realistic (Boyd, Reference Boyd and Buckingham2007). This online identity is generally created for two purposes: (1) for close friends who will view and have access to their virtual space; and (2) for outsider access (Barnett, Reference Barnett2009). Research continues to debate whether or not people present their true selves to the virtual world. Public comments and shared photos among peers and online ‘friends’ assist in the development of a person's online identity. Qualitative research has found that young people will sometimes ask their friends to post certain comments on their profile as a means to making others believe something to be true, to create jealousy, and/or to provoke flirtation (Reich, Reference Reich2010).
Adolescents are often challenged with the desire to be cool and fit in with their peers. Boyd (Reference Boyd and Buckingham2007) argued that many teens use a false name, age, and locality when creating a profile (or a secondary profile) as a means of concealing their profile from their parents. Creating a profile that holds a young person's level of popularity, while at the same time appeasing their parents’ requests, can be quite problematic (Boyd, Reference Boyd and Buckingham2007). The question that remains unclear is whether young people create virtual identities to portray who they are, who they want to be, or who they want their audience to think they are.
The use and exposure to online social networking assists with the formation of a young person's identity, which can both amplify and complicate the process (AAP, 2011; Barnett, Reference Barnett2009; Pederson, Reference Pederson2012; Subrahmanyam & Greenfield, Reference Subrahmanyam and Greenfield2008). While some young people create factual profiles, others have damaged their reputation by posting offensive, inappropriate and/or conflicting photos and information (Barnett, Reference Barnett2009).
Furthermore, it has been postulated that some young people create a false sense of identity online, encompassing greater derogatory and aggressive behaviour, while becoming less accountable (Harmen et al., Reference Harman, Hansen, Cochran and Lindsey2005). Harmen et al.'s (2005) study found that users who falsely identify themselves online might jeopardise their social wellbeing. Harmen et al. (Reference Harman, Hansen, Cochran and Lindsey2005) also found that young people who create a false online identity, compared to their factual counterparts, displayed lower self-esteem, greater social anxiety, inferior social skills, and higher levels of aggression towards their peers.
Connecting to Others Online
Willard (Reference Willard2007) argues that when individuals communicate on the internet, they are more likely to say and do things that they would not do face to face, and this behaviour can result in both positive and negative outcomes (Willard, Reference Willard2007). For example, Subrahmanyam and Greenfield (Reference Subrahmanyam and Greenfield2008) found that although adolescents feel closer to their partners during phone conversations and in-person interactions, as opposed to online, they report being more able to ‘talk freely’ (p. 125) to peers of the opposite sex when communicating online or through text messaging.
Reich (Reference Reich2010) found that 83% of high school students testified their need to utilise social networking sites daily as a means of staying connected to their peers. Indeed, nearly half of high school and college students who were not registered with social networking sites still browsed them regularly, either independently or with a friend who was a member (Reich, Reference Reich2010). Many of the young people in this study reported that browsing social networking sites gave them something to do when they were bored. Furthermore, the AAP (2011) found that some young people are so enticed by social networking, and have difficulty resisting, that it can at times hinder homework, sleep, and physical activity.
Most teenagers have been found to make thoughtful choices in regards to what they share online, as well as with whom (see Livingstone, Reference Livingstone2008). While this is a beneficial trend for building connections, negative outcomes can arise from young people sharing personal information, without understanding how to navigate the privacy settings or the full implications of their actions (Boyd & Ellison, Reference Boyd and Ellison2008; Livingstone, Reference Livingstone2008).
In the earlier days of the internet it was hypothesised that online social networking among adolescents predominately occurred with strangers, and reduced current friendships, resulting in superficial relationships with strangers taking the place of real-life friendships (Valkenburg & Peter, Reference Valkenburg and Peter2007). However, today, research demonstrates that the majority of contact young people have online is with people they already know (see Boyd & Ellison, Reference Boyd and Ellison2008; Livingston, Reference Livingstone2008). Therefore, it is argued that utilising online sites increases the level of friendships, due to the notion that users divulge more personal information on the internet than they would in person, which is an essential indicator of mutually trusting, compassionate friendships (Valkenburg & Peter, Reference Valkenburg and Peter2007).
Although excessive internet use may cause a reduction in human interaction, positive internet use can be healthy provided that face-to-face interaction is balanced with that of the online experience (Harmen et al., Reference Harman, Hansen, Cochran and Lindsey2005). Online interactions can provide an outlet for young people to feel accepted, connect with others, and develop a sense of normalcy (Paul, Reference Paul2012). For most young people, healthy internet use through online social networking provides a simple and efficient way to socialise and maintain friendships (Barnett, Reference Barnett2009; Dempsey et al., Reference Dempsey, Sulkowski, Nichols and Storch2009).
Online social networking can also provide a safe space for young people to engage in meaningful discussions, be themselves, explore, flirt, partake in ‘normal’ teenage experiences, and cope with personal problems (Paul, Reference Paul2012; Strom & Strom, Reference Strom and Strom2012), These interactions encourage feelings of connectedness, increase mutual respect and appreciation among peers, and enhance friendships (Lenhart & Madden, Reference Lenhart and Madden2007; Strom & Strom, Reference Strom and Strom2012; Subrahmanyam & Greenfield, Reference Subrahmanyam and Greenfield2008; Valkenburg & Peter, Reference Valkenburg and Peter2007). Valkenburg and Peter (Reference Valkenburg and Peter2007) found that adolescents who use social networking sites primarily to connect with current friends report having closer relationships than those who do not.
Young people who struggle to maintain social friendships offline can utilise the internet and messaging as a means to communicate more comfortably (Szwedo, Mikami, & Allen, Reference Szwedo, Mikami and Allen2012). This opportunity provides young people with poor social skills the opportunity to take their time responding to comments and writing messages (Szwedo et al., Reference Szwedo, Mikami and Allen2012). Ultimately, online social networking can provide more satisfying relationships for those who have a hard time making friends face to face. Some even argue that online social networking can aid in alleviating social anxiety (Harmen et al., Reference Harman, Hansen, Cochran and Lindsey2005; Subrahmanyam & Greenfield, Reference Subrahmanyam and Greenfield2008; Szwedo et al., Reference Szwedo, Mikami and Allen2012).
High school students have reported that social networking sites such as Facebook and MySpace allow them to stay in touch with friends who do not live nearby, and reconnect to those with whom they have lost contact (Lenhart & Madden, Reference Lenhart and Madden2007; Reich, Reference Reich2010). Studies indicate that social media can improve communication, provide opportunities for social interaction, and assist with the development of technical skills for young people (AAP, 2011; O’Keefe, Clarke-Pearson, & Council on Communications and Media, Reference O’Keefe and Clarke-Pearson2011). Furthermore, it is common for teens to use networking sites as a means to organise plans with friends (Boyd & Ellison, Reference Boyd and Ellison2008; Lenhart & Madden, Reference Lenhart and Madden2007), and it provides a place for youth to find opportunities, such as volunteering in the community (AAP, 2011).
To determine the influence of online social networking sites on adolescent wellbeing, a measure of virtual connectedness was developed: Self in a Social Context: Virtual Self subscale (SSC-VC subscale), and the following research questions were examined:
1. What is the factor structure of the SSC-VC subscale and does this reflect the elements of virtual connectedness as defined in the literature?
2. Is the SSC-VC subscale a reliable measure of the underlying constructs of virtual connectedness among adolescents?
3. What differences, if any, are there in the emotional wellbeing of young people who use social media to connect to each other?
Method
The data presented here examined how young people connected to others using social networking sites and were collected as part of the larger four-part study investigating how schools promote social connectedness and engagement in their students.
Survey data were gathered in a cross-sectional study using a convenience sample of young people at three participating high schools. An exploratory factor analysis was used to establish the structure of the data. Information was also gathered to begin to test the reliability and the capacity of the subscale to differ between groups in the frequency of social network site usage.
Participants
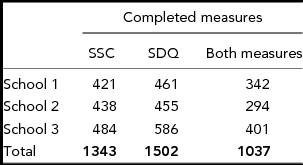
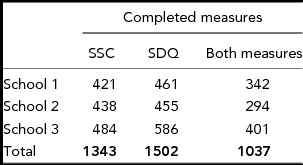
Participants were 1,343 high school students, aged from 11 to 18 years. Females made up 49% of the cohort. Students in the junior school comprised 46% of the participants, while 31% came from the middle school, and 23% from the upper school. Data were collected during school time and in a computer laboratory as part of a computer class. Students were asked to work independently to complete the measures. Where assistance was required, participants were read the questions either by a teacher, teacher aide or one of the researchers. Of students who agreed to participate, complete data for both the SDQ and the SSC-VC subscales were gathered from 1,037 participants (see Table 1).
Data Collection Measures Completed By Participants By School
Measures
Participants were invited to complete the new measure (SSC) and a paper-and-pencil (SDQ) measure. These two measures were chosen to determine the impacts of the use of social networking on social and emotional wellbeing of adolescents in Australia.
SDQ (Youth Self-Report; Goodman, 1997)
This is a behavioural screening questionnaire that measures both positive and negative psychological attributes. It is a self-report, 25-item measure of the psychological health and prosocial behaviours of adolescents aged between 11 and 17 years. For the current study, the SDQ was administered as a pencil-and-paper task and took approximately 5 to 10 minutes to complete. There are five subscales, each comprising five items: Emotional Symptoms, Conduct Problems, Hyperactivity/Inattention, Peer Problems, and Prosocial Behaviour. Of particular interest for this study was the Emotional Symptoms subscale. Participants are asked to rate statements such as ‘I worry a lot’ or ‘I have many fears, I am easily scared’ into three categories: not true (0), somewhat true (1), certainly true (2). Higher scores indicate higher levels of emotional difficulties. The overall prorated score (PRESS) is calculated to categorise levels of emotional symptoms into ‘normal’ (0 to 5), ‘borderline’ (6) and ‘abnormal’ (7 to 10). The SDQ is a reliable measure of emotional symptoms in an Australian context (α = .65; Mellor, Reference Mellor2005). Mean score (and standard deviation) for the Emotional Symptoms subscale for Australian youth aged 11 to 17 years is 2.4 (2.0; Mellor, Reference Mellor2005).
SSC-VC (Carroll & Bower, Reference Carroll and Bower2012)
The SSC-VC is a subscale of the Self in a Social Context Scale (SSC; Carroll & Bower, Reference Carroll and Bower2012). The purpose of the SSC is to gain a measure of how participants feel connected to and engaged with others. This draft scale consists of a total of 97 items that measure levels of connectedness with family, friends, at school, in the community, and online. Of these 97, 20 items comprise the SSC-VC subscale. The purpose of this subscale is to obtain adolescent views about online connectedness, specifically on Facebook. These items are presented if participants indicate that they use social networking websites. Participants use a 4-point Likert scale with strongly agree, agree, disagree, and strongly disagree to indicate their agreement to statements about how they relate to others on Facebook. High scores indicate stronger agreement with each statement.
Procedure
The study was approved in accordance with the ethical review guidelines and processes of the Behavioural and Social Sciences Ethical Review Committee at The University of Queensland, Australia. These guidelines are endorsed by the university's principal human ethics committee, the Human Experimentation Ethical Review Committee, and registered with the Australian Health Ethics Committee as complying with the National Statement. A larger study entitled Investing in our Disadvantaged Youth: New School-Wide Approaches to Understanding and Improving School Engagement and Social Connectedness was run in partnership with three schools on the outskirts of a major city in Australia. The four phases of this larger project included gathering multiple data about school networks (Phase 1) and social connectedness of students (Phase 2); providing lectures and workshops for pedagogical and engagement practices with teachers (Phase 3); and conducting a wait-list control study for a social and emotional learning program within the schools (Phase 4). In Phase 2 of this larger study, data were gathered from young people to measure elements of social connection. Part of that data examined how young people connected to others using social networking sites and is the subject of this article.
Each of the three schools collected data and provided a de-identified file to researchers. Participants were informed verbally about the purpose of the research, the process of de-identification, and storage of data before commencement and that participation was voluntary, and they were free to withdraw from the study at any time.
Results
The results section will first report the psychometric properties of the SSC-VC subscale, including the findings of factor analysis, reliability, and tests for normality, followed by MANOVA and ANOVA using gender and frequency of checking social networking sites as grouping variables. All calculations were performed using the statistical package, IBM Statistical Package for the Social Sciences Analytics Software (SPSS) Version 20.
Factor Analysis
To determine the factor structure of the SSC-VC subscale, the scree plot, factors with eigenvalues greater than 1 and percentage of variance accounted for by the factor solution were systematically examined. Three factors with eigenvalues greater than 1 accounted for 50.5% of the variance.
A maximum likelihood factor analysis with direct oblimin rotation was then conducted to explore the underlying dimensions of the 20 items. The oblique rotation was chosen over orthogonal methods to allow the factors to correlate, because some correlation would be expected when examining social connectedness with others (Costello & Osborne, Reference Costello and Osborne2005).
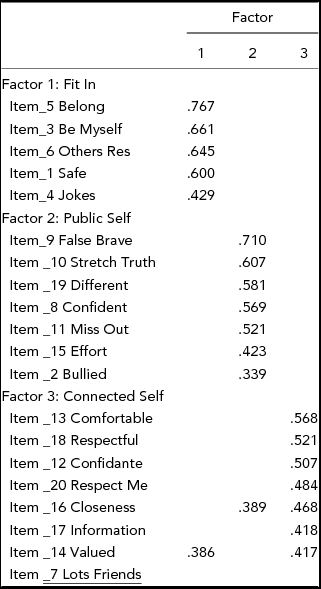
Three clear factors were revealed and were labelled: Fit In, Public Self, and Connected Self (see Table 2). The term Fit In was chosen to encompass a term young people use to describe a sense of belonging, being respected, accepted and feeling safe around one's peers. This is supported in the literature as an important component of social connectedness (see Jose et al., Reference Jose, Ryan and Pryor2012; Libbey, Reference Libbey2004). The term Public Self refers to how young people may behave a different way in public, or in this case online, among their peers to convey extreme confidence or self-assurance in front of an audience (Carroll et al., Reference Carroll, Houghton, Durkin and Hattie2009). Finally, the term Connected Self signifies not only an internal sense of being comfortable with who you are, but also being perceived this way by others, as a respectable, confident, and valued friend (Lee, Draper, & Lee, Reference Lee, Draper and Lee2001). The analysis was run again, forcing three factors, and the factors remained unchanged. Item_2 Bullied (‘I have been bullied on Facebook’) revealed the lowest factor loading (.39) and conceptually did not fit with the other items in that factor. Removing the item increased the reliability of the factor Public Self and so Item_2 Bullied was deleted. Three other items — Item_16 Closeness, Item_14 Valued and Item_7 Lots of Friends — loaded on more than one factor so they were included in the factor with the higher score.
Items and Factor Loadings for the SSC-VC Subscale — Maximum Liklihood Factor Analysis with Direct Oblimin Rotation N = 1343

Note: Extraction method: Maximum likelihood. Rotation method: Oblimin with Kaiser normalisation. A. Rotation converged in 17 iterations. Items with loading <.30 have been omitted.
Reliability
The scales formed on the basis of the factor analysis were analysed for internal consistency using Cronbach's alpha. Fit In (α = .81) and Connected Self (α = .83) had strong internal consistency; the alpha for Public Self in its initial form was acceptable (α = .76) and this increased to .79 when the item Item_2 Bullied was deleted.
Tests for Normality
The SSC-VC subscale dataset and the SDQ dataset were combined and cleaned so that the new dataset included only those cases that were complete for both measures (n = 1,037). Of these, 18% checked their Facebook page less than once a day, 10% once a day, 17% two to three times a day, 17% more than three times and 38% as often as possible.
Before using parametric tests on the combined data, the assumption that data were normally distributed was tested. Several outliers were detected and removed. A total of 979 cases remained. The dependent variables were normally distributed.
Correlations
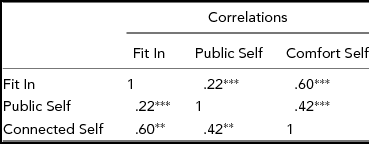
Correlations between the three new factors of the SSC-VC subscale were moderately high (see Table 3); therefore, a Multivariate Analysis of Variance (MANOVA) was deemed suitable for further exploration of the association between the independent variables and SSC-VC subscale.
Correlations of Three Factors of the SSC-VC Subscale (n = 979)
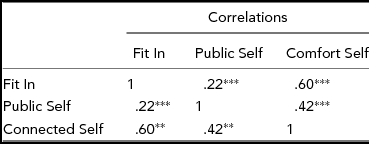
Note: **p < .01, *** p < .001.
Multivariate Analysis of Variance
Multivariate tests were conducted to analyse differences between groups, based on the frequency of checking social networking sites and gender as the two independent variables. The mean scores for the three factors — Fit In, Connected Self, Public Self (SSC-VC subscale) — were the dependent variables. Using Wilks's lambda, there were significant main effects for the number of times students check their Facebook, F(12, 2415) = 13.8, p < .001. This multivariate test of overall difference among groups was also statistically significant for males and females, F(3, 913) = 10.8, p < .001, but there was no interaction effect between gender and the number of times students checked Facebook.
Follow-up univariate tests on the outcome variables revealed significant effects on Connected Self for Gender, F(1, 915) = 15.08, p < .001. Girls who check their Facebook more often indicated feeling more comfortable with their relationships to others online than did boys. Mean scores (SD) for Connected Self for girls and boys were 3.17 (.40) and 3.04 (.42), respectively.
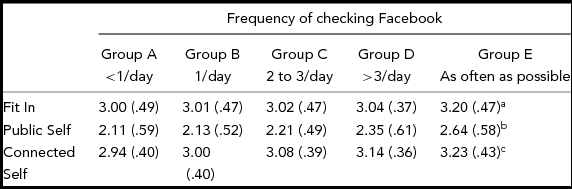
Significant univariate statistics were also revealed for each of the three factors for the dependent variable of frequency of checking Facebook: Fit In, F(4, 915) = 8.38, p < .001; Public Self, F(4, 915) = 35.18, p < .001; and Connected Self, F(4, 915) = 16.15 p < .001, for differences in frequency of checking Facebook. Bonferroni's post hoc test was chosen to determine which results accounted for the difference. Mean scores and significant differences are displayed in Table 4.
Mean Scores (and Standard Deviation) for SSC-VC Subscale Factors by Five Frequency Groups
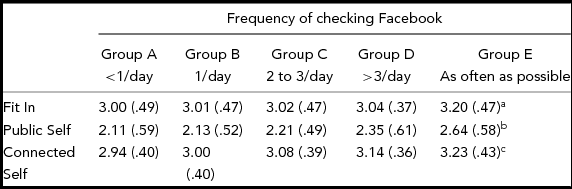
Note: Significance calculated at p < .005. aBonferroni's post hoc test revealed significant differences between Group E and all groups except B, for Fit In. bBonferroni's post hoc test revealed significant differences between Group A and D; and Group E and all other groups for Public Self. cBonferroni's post hoc test revealed significant differences between Group A and D; and Group E and all groups except D for Connected Self.
Emotional Symptoms
Univariate tests were then conducted to analyse differences between groups based on the frequency of checking social networking sites and gender as independent variables and the Prorated Total Score for Emotional Symptoms (PRESS) as the dependent variables. There was a significant univariate result for Frequency of Checking Facebook, F(4, 915) = 4.98, p < .001, and for Gender, F(1, 915) = 46.92, p < .001, on the dependent variable of PRESS, but there was no interaction effect. Bonferroni post hocs revealed the difference in checking frequency could be accounted for between groups who checked Facebook less than once per day and those who checked as often as possible, and groups who checked Facebook once per day and those who checked as often as possible (p < .005).
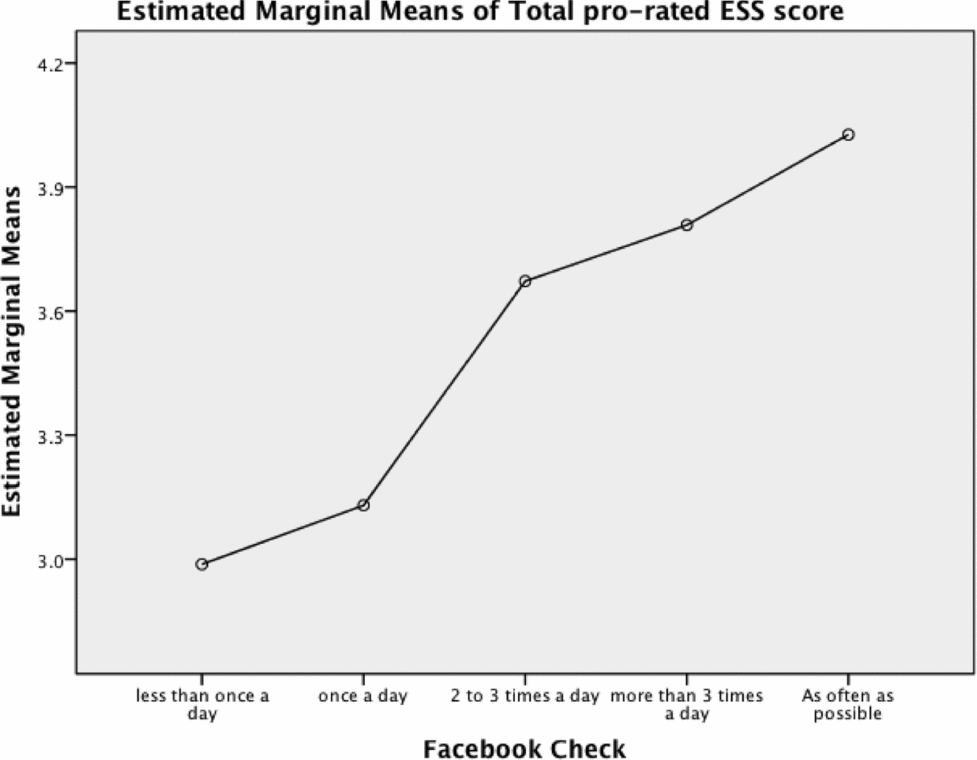
Those who checked Facebook more often than once a day reported a higher incidence of emotional difficulties, as seen in Figure 1.
Emotional difficulties by frequency of checking Facebook.
Discussion
The SSC-VC subscale appears to be a psychometrically sound assessment tool for measuring social connectedness online across groups of males and females aged 11–18 years, with factor analysis revealing three clear factors of Fit In, Public Self and Connected Self, each with strong reliabilities. Frequency of checking Facebook pages seems to be clearly linked to levels of emotional difficulties as measured by the SDQ and to each of the three factors in the SSC-VC subscale, suggesting that the new tool is a valid measure of social connectedness online. The findings from this study support established research that young people participate in online activities to build connections to others in their adolescent years. But there are also some unexpected findings that require further examination.
There were four variables that were examined in this study. A higher score for Fit In indicates feelings of safety, ability to be authentic with others, share jokes, and be respected when using social internet sites. A higher score for Public Self indicates bravado that was not necessarily an indication of true self, such as inflated confidence, expressing opinions, stretching the truth, behaving differently, or investing time and effort into creating and maintaining a Facebook page. And a higher score for Connected Self suggests having close friends who are confidantes, engaging in respectful relationships and feeling valued, and accessing information. A higher score for PRESS indicated higher incidences of physical symptoms, such as headaches, worry, tearfulness, nervousness and fear.
Many researchers have found that the incidence of bullying, harassment and exclusion of others can cause loneliness and trauma for recipients (Barnett, Reference Barnett2009; Dempsey et al., Reference Dempsey, Sulkowski, Nichols and Storch2009; Subrahmanyam & Greenfield, Reference Subrahmanyam and Greenfield2008; Willard, Reference Willard2007). It was expected, therefore, that those who checked their Facebook frequently might have a higher incidence of Emotional symptoms, which they did. What was not expected was that an increase in frequency of checking would also indicate higher scores in Fit In and Connected Self as well as Public Self for the SSC-VC subscale. However, the literature also supports this (Boyd Reference Boyd and Buckingham2007; Pederson, Reference Pederson2012).
On deeper reflection, it makes sense because many of the behaviours that take place online, including making and maintaining friendships, teasing, quarrelling, flirting, bullying, and sharing comments, pictures, and opinions are all normal occurrences during adolescence, with or without the use of a computer (Boyd, Reference Boyd and Buckingham2007; Pederson, Reference Pederson2012; Subrahmanyam & Greenfield, Reference Subrahmanyam and Greenfield2008). In line with findings by the AAP (2011) that more than half of adolescents access online social networking sites more than once a day, a positive sense of connection and feeling comfortable about self would be expected. It is reasonable, therefore, to expect that acceptance and integration in these online settings would be indicated.
This study revealed some differences in the ways that boys and girls use Facebook, with girls who use Facebook more often indicating higher levels of emotional difficulties and public self, but also higher levels of fitting in and comfortable relationships with others online. The reasons for these differences and specific links to wellbeing require further investigation. Lenhart and Madden (Reference Lenhart and Madden2007) conducted a survey that resulted in the notion that older teenage girls utilise social networking websites to strengthen their current friendships, while their male counterparts use them as a way to flirt and find new friends.
Online social networking is an integral part of the lives of young people. Further research is needed to highlight the positive influences of this medium in building social and emotional wellbeing. Some limitations should be acknowledged for this study. Although there was a strong emphasis on gender differences, it is important to learn more about age-related changes. As young people move from primary to upper secondary school, it is likely that the importance of accessing and feeling connected through social networking sites is bound to change, therefore affecting social and emotional wellbeing. Furthermore, our research focused primarily on adolescent use of Facebook as a means to measure online networking, yet it is important to recognise that there are various types of social networking sites commonly used by young people and these are continually changing. Complementary qualitative data would also strengthen the findings of this research. Some future research directions could include semi-structured interviews and more in-depth personalised experiences. Additionally, as suggested by Jose et al. (Reference Jose, Ryan and Pryor2012), it would be beneficial to incorporate a multidimensional approach to the social and emotional wellbeing of young people by utilising other participants such as parents and teachers to authenticate the validity of self-reported measures.
Although there are limitations, it is essential to acknowledge the valuable implications from the results of this research. A fundamental component of attaining positive mental wellbeing involves maintaining quality connected peer relationships (Carroll et al., 2014; Corsano et al., Reference Corsano, Majorano and Champretavy2006; Hall-Lande et al., Reference Hall-Lande, Eisenberg, Christenson and Neumark-Sztainer2007); therefore, the use of online social networking among adolescents is beneficial to building connected relationships, thus enhancing social and emotional wellbeing. Consequently, we suggest that adolescent intervention and prevention programs incorporate elements of promoting and encouraging positive online connectedness, as well as developing and maintaining healthy online relationships.
Acknowledgments
Data for this project were collected through the assistance of an Australian Research Council Linkage Grant (LP110200425) 2012–2014. We would like to acknowledge the students, teachers and school executive staff at out partner schools who contributed to this research.