Introduction: diversity in interactive computational design
In its most basic definition, design is the act of creating a plan for the construction of an object, system, or action (Design, 2017). The early stages of any design process often include rapidly generating a variety of potential solutions to a problem through brainstorming. Historically, this aspect of design has been driven exclusively by humans, frequently accompanied by sketching or other forms of representation to help communicate and clarify ideas (Goldschmidt, Reference Goldschmidt1994). Especially in the field of architecture, a premium has often been placed on creativity and innovation during this process, valuing the ability to come up with many different ideas for possible buildings and structures, as well as ideas that have not been proposed before. Design in architecture and related fields has always required balancing aesthetic, technical, functional, economical, and other concerns, with different priorities taking precedence depending on the building and its context. Increasingly, computers are able to help analyze how a design is performing, navigate the relationships between different design goals, or even overcome human cognitive obstacles (McCaffrey & Spector, Reference McCaffrey and Spector2018). Despite these advances in how design priorities are pursued, fundamental aspects of design remain synthetic, creative, and human.
As such, many computational design methods require interaction with humans primarily in order to be effective, but also to appeal to human designers as a potential creative aid in the first place. In facilitating effective interaction, computers can be much faster than humans at certain tasks such as rapidly generating design variations within a provided scheme and evaluating their performance (Cvetkovic & Parmee, Reference Cvetkovic and Parmee2002), but they must do so in a way that enhances the creative process rather than restricting it. In many cases, this means that computers are used to create sets of potential design options, and these sets are presented to a human for comparison. Unless explicitly implementing optimization in the rare case that a single numerical objective overshadows all other considerations, the possibilities generated by computers must be varied and different, rather than all essentially representing the same or similar options. Otherwise, they cannot provide human designers with the flexibility to exert preferences or simultaneously consider design goals that are more difficult to quantify.
The concept of diversity, which here describes a group that is composed of different elements or qualities, is thus helpful in computational research and practice. It is theorized by many that more diverse design spaces lead to better and more compelling design outcomes (Rusch, Reference Rusch1966; Kolarevic, Reference Kolarevic2003; Gane, Reference Gane2004). Although much of the recent focus on design diversity has been catalyzed by developments in digital technology, this assumption undergirds traditional, non-numeric approaches to brainstorming as well. In these analog situations, humans have often intuitively judged the diversity of potential groups of designs. Yet since computers work more effectively with numbers, there is a need to translate the concept of design diversity into the language of algorithms and code by formulating a way it can be measured numerically. This is especially true as architecture and engineering move toward performance-based design, in which rapid generation and analysis are increasingly integrated into the early-stage design process.
One potential application for diversity measurement in computational design is the ability to build mechanisms into algorithms that ensure the results they produce are diverse enough to be interesting to designers. For example, in genetic algorithms, diversity is preserved in the process itself by using crossover and mutation (Srinivas & Patnaik, Reference Srinivas and Patnaik1994) or some other means. A popular algorithm in this category, NSGA-II, also operates a crowding distance check on the results in performance space to ensure a representative spread along a Pareto front (Deb et al., Reference Deb, Pratap, Agarwal and Meyarivan2002). However, this distance is only considered in objective space and does not directly translate to diverse solutions in the design space, meaning that designs with different performances could still look the same and not be diverse enough for explorative design. Many optimization techniques are similarly limited by focusing only on differences in objective function values. Direct measurement of diversity based on a design set's characteristics rather than its performance could help future algorithms generate solution sets that are more valuable for creative designers.
One could also envision a process in which designers are not only given the best performing solution for a given objective but also able to tune the algorithm to produce a more diverse set while understanding how much of a performance penalty is taken for this higher diversity. In addition, diversity metrics could be used in research, such as comparing which algorithms are more effective as creative design tools by determining which ones yield more diversity of solutions. In each of these cases, the existence of a numerical diversity metric that is trusted to accurately represent a human understanding of the concept could greatly enhance interactive computational design processes.
Organization of paper
Based on the need for a more comprehensive understanding of diversity measurement in computational design, this paper consolidates existing information on the topic and offers new data concerning the link between quantitative diversity metrics and human perception of design diversity. The first section provides a literature review of diversity measurement and potential metrics for use in parametric design, before detailing the contributions of this paper. The next section describes the methodology of a survey-driven research study that tests how well these measurements match human judgments of design diversity and the relative performance of each measurement technique. The third section presents the results of the research study, while the fourth offers a discussion of the results and contributions, as well as an example application. Finally, the last section indicates future work and gives concluding remarks.
Literature review
Background on diversity measurement
Diversity, especially when it is being measured, is also called variation, dissimilarity, or novelty in academic literature, although there can be slight differences between definitions. In comparison with other disciplines, architecture and related design fields have only recently become concerned with quantifying diversity, as parametric and other forms of computational design have begun using algorithms and processes to generate high-performing yet expressive geometries (Brown & Mueller, Reference Brown and Mueller2016). As such, many mathematical methods for measuring diversity are more widely used in other fields, such as biology, where measurement of population genetic diversity has been studied for much longer (Patil & Taillie, Reference Patil and Taillie1982). Nevertheless, many of the concepts created to compare species or phenetic differences within a species are mathematical or geometric in nature and can be applied to conceptual design, especially if design options are defined in a way that can be represented numerically.
However, a key difference between the measurements of biological diversity and parametric design diversity makes it difficult to use biological methods directly in design settings. When used in the context of biology or ecology, a diversity index is a quantitative measure of how many different types exist in a dataset, and how evenly the entities in the dataset are distributed across these types (Hill, Reference Hill1973). Sociologists can similarly use these existing metrics to compare types of people (Agresti & Agresti, Reference Agresti and Agresti1978), and information scientists can use them to distinguish between characters in a password, for example. Common diversity metrics in these situations include the Gini–Simpson Index (Rao, Reference Rao1981), which indicates the probability that two entities randomly have chosen from a set represent different types, the related Inverse Simpson Index, and the Shannon Entropy Index (Shannon & Weaver, Reference Shannon and Weaver1949), which quantifies the uncertainty of being able to correctly predict the type of the next entity in a given set (Jost, Reference Jost2006). Rényi's entropy (Rényi, Reference Rényi1961) is also used for similar purposes. Within the field of engineering design, Kan and Gero (Reference Kan and Gero2018) utilize the concept of entropy to quantify the creativity and productivity of a design session by scrutinizing linkographs from protocol analysis.
In contrast, the different designs being compared within a parametric definition often cannot clearly fit into distinct “types”, especially if there are many continuous variables. It is possible to manually group designs within a set, or use clustering algorithms to achieve categorization automatically, but parametric design spaces frequently transform too gradually and subtly for an approach relying on a first-step classification to yield meaningful results. Such sorting-based metrics could be used when comparing typologically different conceptual architectural sketches generated during a brainstorming process, but this comparison is less directly relevant for implementation in computational settings and is thus outside the scope of this paper. Although clustering is a promising idea and will be discussed later, this paper focuses on faster, single-step, geometric measurements that can be applied for early-stage conceptual design models. Nevertheless, despite the difficulty in using probabilistic biological measurements directly, many mathematical techniques related to their calculations can be applied to quantify diversity in parametric design.
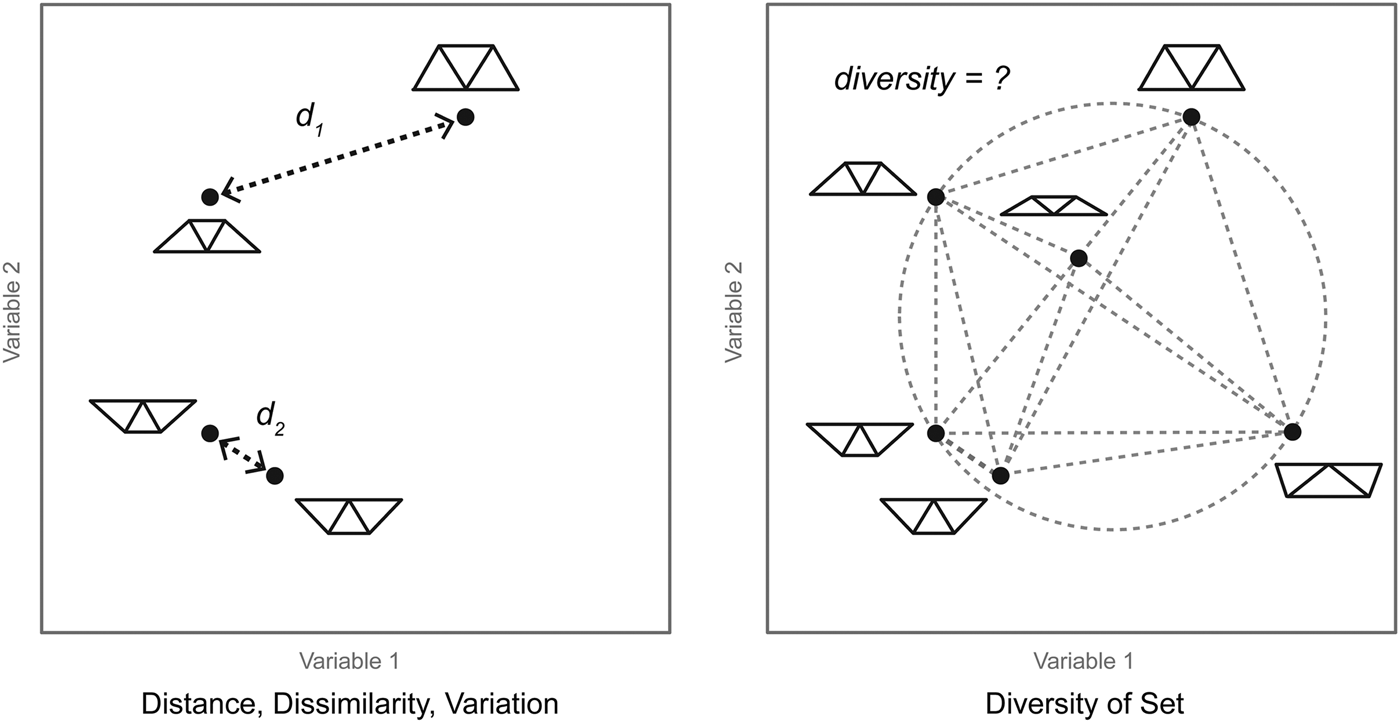
It is possible to borrow concepts from other fields because most diversity metrics rely on distance measurement. Distance measurement is itself a distinct topic, and although it is used to create the diversity indexes mentioned above, it exists within the more fundamental fields of geometry and statistics. Since the question of diversity in parametric design is not necessarily how many different types are present, or how well distributed these distinct types are across a set, but rather involves characterizing how far apart different designs are in relation to all other designs, distance measurements can be especially useful for design settings. However, in most cases, a distance measurement must be combined with another geometric or statistical concept to create a meaningful metric relating to an entire set of designs. The difference between measuring raw distance, versus attempting to quantify the diversity of an entire design set based on combinations of distances or other geometric properties, is illustrated in Figure 1.
A diagram illustrating the difference between measuring distance and measuring the diversity of a set of designs. In the image on the left, the distance between two sets of parametric designs can represent their dissimilarity or variation, as closer designs look more similar than those far away; in this example, d 1 is clearly greater than d 2. However, if trying to quantify the diversity for the set on the right, judgments must be made about which geometric properties to use.

Relevant distance measures include Euclidean, City-block, Correlation, Geodesic, and when the distance is between groups rather than points, χ 2 and Mahalanobis distance (McCune & Grace, Reference McCune and Grace2002). Distance metrics are widely studied and characterized in computer science, as the choice of method can have a significant effect on algorithmic performance in applications such as pattern recognition, data mining, segmentation, and signal analysis (Kokare et al., Reference Kokare, Chatterji and Biswas2003; Perlibakas, Reference Perlibakas2004; Wang et al., Reference Wang, Neskovic and Cooper2007). Although there are important differences to each, many of these metrics attempt to normalize for the size of the entire possibility space or adjust based on the relative importance of the axes being considered (in the case of ecology, these axes generally represent species). As such, they often collapse to Euclidean distance in simple cases when axes are equal and already unitized. However, each of these measurement techniques, although not necessarily directly applicable to measuring set diversity rather than pair similarity in parametric design, are worth considering because they have the potential to inspire modified versions that can be applied in architecture or structures. More sophisticated distance metrics, such as the Manhattan distance, may also be required to increase the accuracy or effectiveness of diversity measurement for some applications, including higher dimensional problems (Aggarwal et al., Reference Aggarwal, Hinneburg and Keim2001). This paper makes use of distance measurement in each diversity metric considered.
Creativity, novelty, variety, and related concepts in engineering design
In engineering design, there has been considerable research into idea generation during early-stage brainstorming, often called product ideation (Shah et al., Reference Shah, Kulkarni and Vargas-Hernandez2000). While attempting to improve ideation methods, researchers have created empirical laboratory or simulated environment studies that require characterizing and measuring ideation effectiveness (Shah et al., Reference Shah, Smith and Vargas-Hernandez2003). Common metrics for evaluating the outcomes of brainstorming sessions include creativity, novelty, and variety. Novelty is defined as being original, rare, unusual, or unexpected when compared with other ideas, while Variety is a characterization of the explored solution space. Measuring novelty often involves defining what is not novel, decomposing a problem into key functions and characteristics, assessing how an individual design fulfills these functions, and then grading its novelty with reference to all other possible designs. Although variety applies to a group of ideas rather than an individual idea, it is often measured by examining how different functions are satisfied and calculating differences in physical/working principals, followed by less relevant details such as dimensions. Creativity is defined in a variety of ways, including pure notions of novelty or originality (Runco & Charles, Reference Runco and Charles1993), or adding aspects such as quality, workability, and relevance (Dean et al., Reference Dean, Hender, Rodgers and Santanen2006), or importance and affect (Horn & Salvendy, Reference Horn and Salvendy2009). Others have proposed defining creativity in an entirely subjective manner based on observer response (Amabile, Reference Amabile1982).
Diversity in the context of architectural computational design aims to capture some combination of these inter-related concepts of novelty, creativity, and variety. However, within the parametric design, there is a direct need for numerical measurements that do not depend on expert judges or qualitative assessments and can thus be applied immediately in current design environments. Many architects and engineers working in building design are already relying on strategies such as creating catalogs of the design space or using multi-criteria optimization to obtain sets of designs for final selection (Balling, Reference Balling1999; Stump et al., Reference Stump, Yukish, Simpson and Harris2003). These designs are frequently generated rapidly using parametric scripts, as described in the next section. Although performance simulation is regularly attached to decisions between options (Tsigkari et al., Reference Tsigkari, Chronis, Joyce, Davis, Feng and Aish2013), experts do not necessarily sort designs into hard categories of feasibility, functionality, or other traditional engineering metrics. This is because it is common for parametric options in later conceptual design to be typologically or functionally consistent, yet contain subtle visual or geometric differences that are still relevant to the designer as he or she weighs the quantitative performance and qualitative experience of a future building. Thus, metrics for diversity measurement in this paper are valuable because they can be used to tune algorithms and processes in human–computer collaborative design, leading to creative, innovative, yet high-performance design outcomes.
Diversity in parametric formulations
It has become increasingly common in architectural and engineering design to define designs parametrically, using digital software to generate a geometry based on a set of variables (Burry, Reference Burry1996; Monedero, Reference Monedero2000; Holzer et al., Reference Holzer, Hough and Burry2008). This approach lends itself to both rapid design space exploration since many potential designs exist for a given parametric formulation, and optimization, since different design possibilities can be evaluated for performance and these variables can be adjusted accordingly using a guiding optimization algorithm (Oxman, Reference Oxman2008). Parametric software, such as Grasshopper for Rhinoceros (Robert McNeel & Associates, 2014) or Dynamo (Autodesk, 2013) enable parametric formulations as part of an integrated conceptual design process. Since parametric formulations at their root contain a numerical design vector, which denotes a point in space that is mathematically distinct from other vectors, the diversity of a parametric set of designs can be measured using mathematical or geometric techniques.
Parametric design also has limitations, which can relate to how diversity is quantified computationally. Although parametric design is more flexible than earlier digital design tools, which focused on documenting a single idea, it requires considerable input and knowledge by the designer to properly formulate the parametric logic and set appropriate variables and constraints. Parametric definitions are also commonly frozen to a specific typology, which can be limiting in architectural or structural design, and their results can be dependent on specific decisions made during the formulation of the design problem itself. In this way, a human could easily draw a suspension, arch, cable-stay, and truss bridge on a sheet of paper, and declare that this collection of designs is more diverse than any parametric set offered in this paper. Computers would not only have a difficult time generating each of these structures from a single definition, but also measuring diversity without a hierarchical rubric of function, aesthetics, or other properties devised by a human designer.
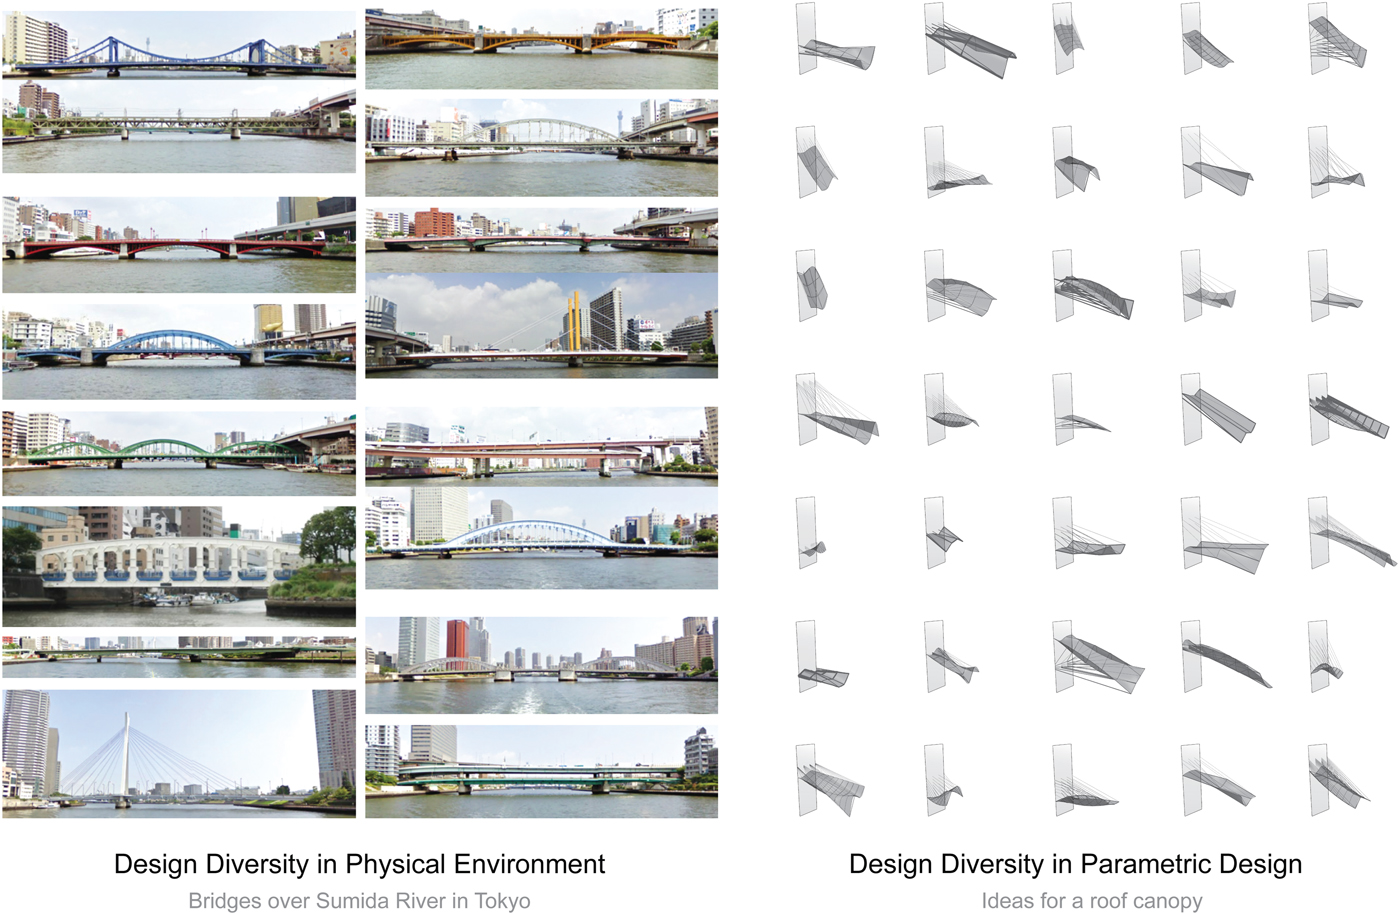
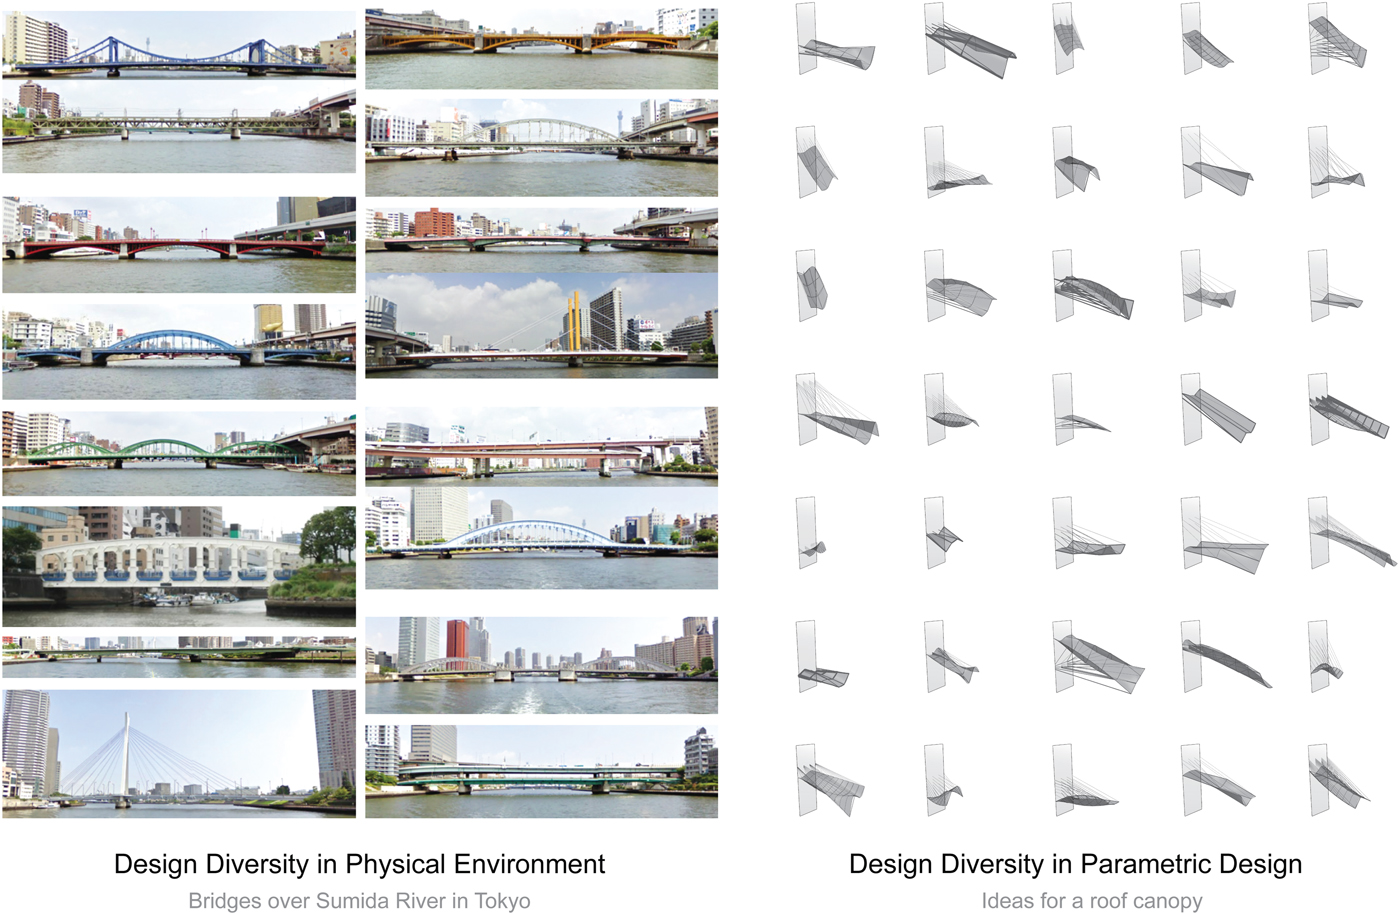
Nevertheless, despite still being reliant on human creativity and labor, parametric design is a useful tool for all types of designers looking to rapidly iterate, prototype, and explore. Consider Figure 2, which illustrates diverse design spaces in the physical world and a digital design context, both of which are relevant to architecture. Diversity during the design process can stimulate creativity and imagination, leading to a more diverse built environment. At the same time, it also allows designers to consider more ideas during brainstorming, which can improve design outcomes. The left image shows bridges over the Sumida River in Tokyo, where there are 26 bridges in 27 km. Despite each site having a similar span and loading, the bridge designers felt it was important to respond to a diverse range of creative structural solutions rather than one standard form. The image on the right shows a sampling of options generated by a parametric script for a hanging canopy structure. Despite limitations to parametric design, the visual diversity of the canopy solutions on the right would give designers substantial creative freedom to select an effective and expressive design. When such diversity is the desired outcome, the underlying mathematics behind design vectors in parametric modeling becomes an advantage, since it can be measured computationally using geometric concepts. The next section describes existing methods for this purpose. First, metrics that are evaluated comparatively in the survey portion of this paper will be presented, after which other related or composite methods will be described.
Diversity of architectural solutions for similar design conditions, in both the physical world and parametric design. The bridges in Japan demonstrate the creative instincts of architects and engineers during design, which leads them to consider larger design spaces. Although the designs on the right were generated with a parametric script, there are many visually different options to consider for the final solution. Images of the bridges are from (Google Maps, 2017).
Methods for measuring diversity in parametric modeling
This paper consolidates and synthesizes existing literature on diversity measurement to highlight the following metrics for use in parametric design. Some of these metrics have been directly proposed and used by others before, and are cited accordingly. Each metric measures the diversity of a set of designs, which is sometimes required to contain a minimum number of designs in order for the measurement to be possible. The study does not assign priority to design variables or classify designs into species or types, and the vectors are normalized to the unit square. The problems in this paper are two-dimensional (2D) – it is assumed that the proposed metrics would apply to early-stage parametric designs, which generally have low dimensionality so that designers can meaningfully interact with all variables that influence visual appearance and performance. As such, standard Euclidean distance was chosen as an intuitive, commonly accepted distance measurement for these applications. Euclidean distance between two points in space is defined as:
 $$\hbox{dist}(\,p\comma \,q) = \sqrt {{(\,p_1 - q_1)}^2 + {(\,p_2 - q_2)}^2 + \cdots + {(\,p_n - q_n)}^2}.$$
Distance from centroid to outlier
The first diversity metric under consideration is the maximum distance between the centroid of the group and each of the individual designs, effectively measuring the furthest outlier in the set:
 $$D = \max [\hbox{dist}(x_{{\rm centroid}}\comma \,x_i)].$$
This metric was proposed by Mueller and Ochsendorf (Reference Mueller and Ochsendorf2015) and is used in Brown et al. (Reference Brown, Tseranidis and Mueller2015). Although a single outlier can have a large effect on the value of the metric, the distance to this outlier is only considered once, rather than multiple times, as is the case with other methods.
Sparseness at center (centroid and median)
The second metric involves a similar distance measurement but considers each of the points in the set simultaneously. It does so by measuring the sparseness at the center of the design set, which is the average distance between a given point and each of the surrounding points. Thus, the diversity is equal to the measured sparseness:
 $$D = \displaystyle{1 \over k}\mathop \sum \limits_{i = 0}^k \hbox{dist}(x_{{\rm centroid}}\comma \,x_i).$$
This concept is taken from the novelty search algorithm developed in Risi et al. (Reference Risi, Vanderbleek, Hughes and Stanley2009) and Lehman and Stanley (Reference Lehman and Stanley2011). This algorithm, designed to overcome difficulties in finding intermediate, stepping stone solutions in fitness-driven evolutionary optimization, repeatedly measures sparseness and rewards points in sparser areas of the design space. This paper considers two different metrics involving sparseness to evaluate the diversity of a set of parametric designs. The first takes the average distance from the centroid, as described in Eq. (3) above. The second takes an average distance from the median value for each dimension of the design set:
 $$D = \displaystyle{1 \over k}\mathop \sum \limits_{i = 0}^k \hbox{dist}(x_{{\rm median}}\comma \,x_i).$$
Although these two measurements are often similar, they have different sensitivities to outliers and would yield drastically different results in the case where the centroid is not near the median.
Enclosing hypersphere
The next two diversity metrics involve geometric properties of the entire set rather than direct distance measurements. The first metric is the radius of the smallest hypersphere in n-dimensional space that contains each of the designs in the set:
 $$D = \hbox{min}(r_{{\rm hypersphere}}).$$
Finding the enclosing hypersphere, sometimes called the bounding or enclosing ball, is a common problem in computer graphics, computational geometry, and statistics. Consequently, various algorithms exist for this purpose, including Ritter (Reference Ritter and Glassner1990) and Welzl (Reference Welzl1991). These algorithms have different runtimes and degrees of accuracy, but for diversity measurement, faster approximations are likely acceptable. The idea for employing the enclosing ball to quantify diversity comes from Pavoine et al. (Reference Pavoine, Ollier and Pontier2005), which uses enclosing hypersphere radius while discussing quadratic entropy as a measurement for diversity when the entities being considered are divided among a fixed set of categories.
Convex hull
The final diversity metric studied in this paper is the volume of the convex hull formed by the designs in n-dimensional space:
 $$D = \hbox{volum}\hbox{e}_{{\rm convex\; hull}}.$$
The convex hull is often described in two dimensions as the shape a rubber band would take if stretched around all points in the set. Convex hulls are used by Cornwell et al. (Reference Cornwell, Schwilk and Ackerly2006) to look at habitat filtering, by Layman et al. (Reference Layman, Arrington, Montana and Post2007) to measure trophic diversity in food webs, and by Villéger et al. (Reference Villéger, Mason and Mouillot2008) to quantify functional richness of communities. A description of the suitability of convex hulls for these tasks, as well as their pros and cons in diversity measurement, is given in Podani (Reference Podani2009). As with the enclosing hypersphere, various algorithms exist for calculating its volume for a given set of points, including the “convhull” and “convhulln” functions in MATLAB.
Related metrics
In addition to these metrics, other measurements exist that are either similar to those already presented, or less relevant to interactive, conceptual design. Nevertheless, they are worth mentioning, as they are potentially useful for researchers and designers with slightly different applications. One such metric measures the average distance between each point and every other point in the design set while ignoring the centroid or median (Smaling, Reference Smaling2005). However, this metric gives similar results to the sparseness measurement at the centroid and has more potential to be thrown off by outliers, since the distance to a faraway point would be counted multiple times. Another potential metric is counting the number of points on a boundary or taking the average distance between points only on that boundary. These concepts are related to crowding distance, which is employed by various optimization algorithms to ensure an even distribution of points along a significant edge of the design space, such as the Pareto front in multi-objective problems. Such metrics are more useful when diversity is desired along a specific boundary, or when a larger number of designs are present.
As mentioned before, other diversity metrics could be employed if the user is willing to categorize the designs in the set either manually, through clustering (Berkhin, Reference Berkhin, Kogan, Nicholas and Teboulle2006; Jain, Reference Jain2010), or by creating a rubric. However, a manual or rubric approach is more labor-intensive and susceptible to the inherent bias of the categorization process. If the design space is of a relatively high dimension and there are many designs, an automated clustering algorithm could be used along with available statistical methods for diversity or entropy mentioned in the literature review. Yet this method has issues as well since many common clustering algorithms are not deterministic and could give results that are not replicable, especially if design space clusters are not particularly distinct. Furthermore, it is not immediately clear that an interactive design process where a human must simultaneously consider many tens or even hundreds of design variables and iterations is effective. Although the concept of choice fatigue has been extensively studied and hotly debated (Scheibehenne et al., Reference Scheibehenne, Greifeneder and Todd2010), smaller, more manageable sets are likely the preferred approach of designers who want creative choice, but do not want to be overwhelmed by options. The metrics selected for study in this paper focus on these types of conceptual design sets.
Research contributions
After reviewing existing methods for measuring diversity within parametric formulations, it is clear that although a number of possible metrics exist, there is no consensus on the single best metric. Furthermore, when considering the human-centric context of architectural or structural design, there has been no rigorous investigation as to whether or not the given metrics accurately translate to a human perception of design diversity, and how the use of different diversity metrics might influence the conceptual design process. When design computation applications require diversity measurement, many researchers borrow an existing methodology, propose their own that is problem specific (Yousif et al., Reference Yousif, Yan and Culp2017), or suggest that designers themselves should choose one interactively (Erhan et al., Reference Erhan, Wang and Shireen2015), since the metric itself was not the focus of their research.
In response, this paper contributes to existing scholarship on the topic of diversity measurement and connects it to computational design in a number of ways. First, it consolidates methodologies proposed in different fields and provides an overview of available measurements for future use by both designers and researchers. Second, it demonstrates the extent to which existing diversity measurement metrics match up with human perception, which is essential to understanding how humans and computers can best collaborate while creatively brainstorming during the architectural or engineering conceptual design process. Finally, it provides a quantitative comparison between each of the methods as well as a qualitative discussion of their merits, which can assist tool developers and even designers in selecting the most appropriate diversity metric for a given application. The following sections describe the methodology and result leading to these last two contributions.
Methodology
Relying on the methods described in Eqs (2)–(6), a visual survey was developed and conducted to determine the agreement of human and computer perceptions of design diversity and to compare metrics directly. This research utilized Mechanical Turk (Buhrmester et al., Reference Buhrmester, Kwang and Gosling2011), which is a service provided by Amazon that allows users to distribute tasks requiring human intelligence to a diverse, on-demand, temporary workforce. The survey contained a series of questions asking participates to pick the most diverse group between two sets of designs presented visually on a computer. An analysis of these head-to-head results over a large number of participants yielded significant insight into human perceptions of diversity in relation to geometric representations of design concepts.
Mechanical Turk is commonly used for social science research since it allows for a quick, high volume of responses that tend to be representative of the general population (Paolacci et al., Reference Paolacci, Chandler and Ipeirotis2010). Due to its advantages, such as supportive infrastructure, accessibility, and anonymity, Mechanical Turk is increasingly employed in engineering and product design as well (Macomber & Yang, Reference Macomber and Yang2011; Häggman et al., Reference Häggman, Tsai, Elsen, Honda and Yang2015). Although Mechanical Turk is most often used in product design to obtain crowdsourced feedback from potential end-users or related stakeholders external to the design process, it has been demonstrated that unlike design quality metrics, there is a strong correlation between novelty as judged by online respondents and design experts (Kudrowitz & Wallace, Reference Kudrowitz and Wallace2017). In that study, the researchers propose a three-attribute metric of novelty, usefulness, and feasibility for narrowing a large pool of early-stage product ideas down to a manageable number for design exploration. Although experts are required to adequately judge the second two metrics, the researchers tested crowdsourcing strategies like Mechanical Turk and found them to be effective for assessing novelty. Since the evaluation of parametric design diversity is strongly related to novelty, and it involves helping computers to be more effective brainstorming partners for creative architectural design, feedback from Mechanical Turk should provide information about general human perceptions of diversity that are relevant even for trained designers.
Generation of test data
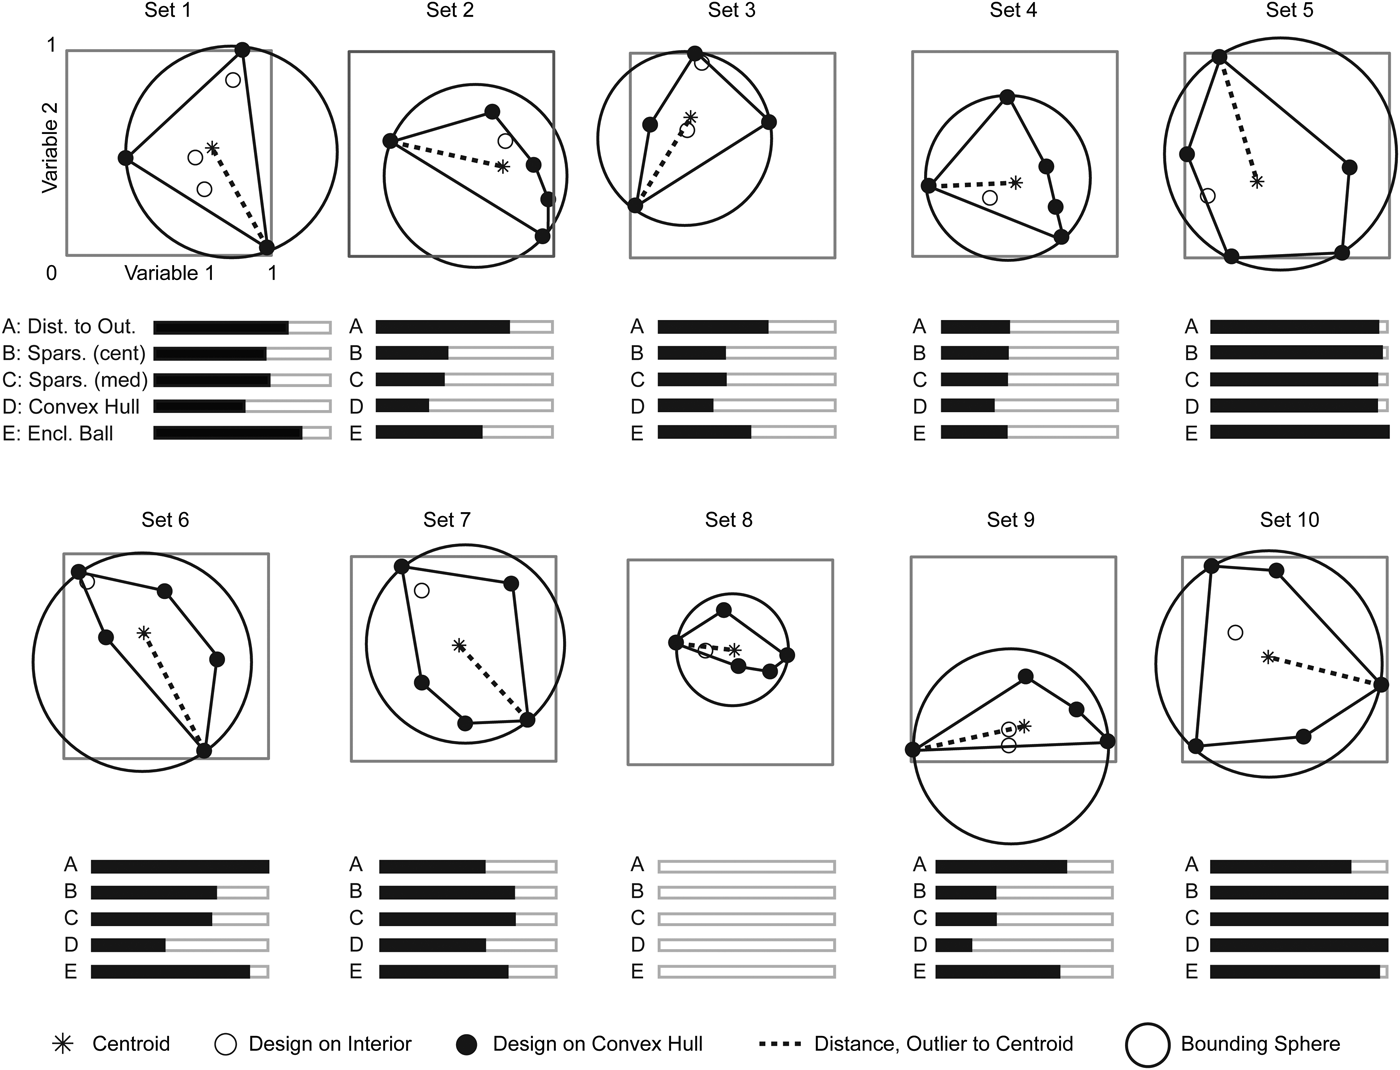
To create the survey content, ten sets of six design vectors were randomly generated, with each design vector containing two variable settings between 0 and 1. The diversity of each set was then calculated using the methods described in section “Methods for measuring diversity in parametric modeling”. A visualization of these diversity measurements is provided in Figure 3. In these figures, each dot represents a design with variable settings corresponding to its location on the two variable axes. The variety of lines, circles, and hatches describe the geometric measurements used in the diversity calculations. A “smaller” grouping of points, such as in set 8, has a lower measured diversity than a “wider” grouping, such as set 10, although the metrics can disagree. For example, a long, narrow grouping could have opposite points that on their own dictate the size of an enclosing ball, which would cause this metric to measure the same diversity as in a spread grouping where each point lies on the boundary of the same ball. However, the other metrics would judge the spread grouping to be considerably more diverse than the narrow grouping. In addition, although each metric is based on some form of geometric measurement, their units are mixed, and their original values are of vastly different scales. As such, each diversity value is normalized based on the minimum and maximum of the set, which can also be seen in the bar graphs in Figure 3. For simplicity, this normalization is consistent throughout this paper, and diversity measurements are presented in terms of relative percentages between sets rather than raw scores.
A visualization of the diversity calculation for each design set, as well as the normalized diversity value for each metric. Each dot represents a design at the corresponding variable settings, while the lines and hatches show the different calculations, described in the key at the bottom. The normalized diversity is shown by the horizontal bar graphs where the dark bar represents the diversity of the set, and the white bar shows the maximum normalized diversity calculated for any of the sets.

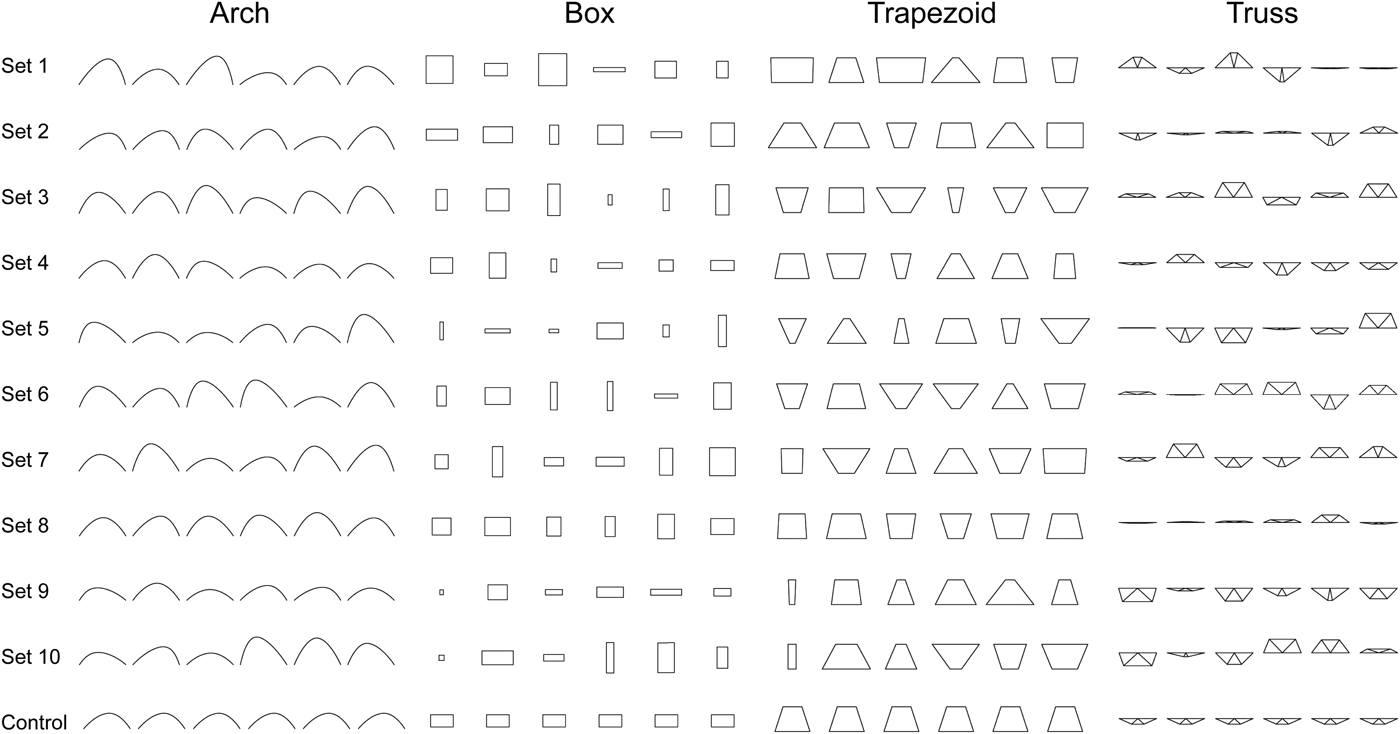
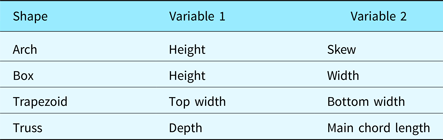
Next, the design vectors were fed into parametric scripts in Grasshopper that generated simple shapes, and the resulting images were recorded. Four different geometric shapes were used in the study to reduce the possibility of one noticeable, visual effect skewing the survey data, and to test for effects such as variable dominance. The chosen shapes were arches, boxes, trapezoids, and trusses, which simulate simple architectural possibilities that might be sketched as part of a conceptual design exercise. The variables in each design vector set global properties such as width and height for each shape. Although the sets of design vectors were generated randomly, the same random sets were used throughout the survey, ensuring that each participant answered similar questions. Figure 4 presents the set of shapes used for the survey, and Table 1 provides a list of the variable properties for each shape.
The parameterized shapes of each design set used in the survey.

A list of the different shapes used in the human perception study, along with a description of the geometrical quality controlled by each variable

Survey
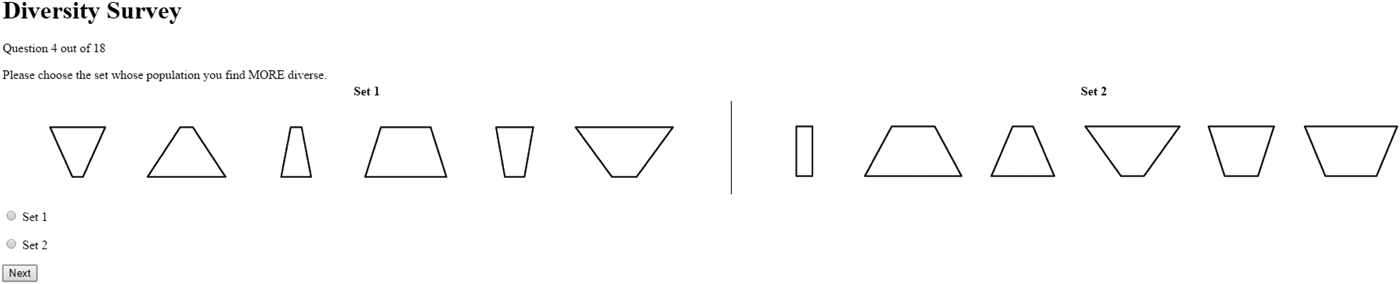
The survey itself consisted of 18 separate questions, each of which asked participants to examine two sets of geometric shapes and determine which is more diverse (see Fig. 5). The 18 questions were broken down into three types: human–computer agreement, the distinction between metrics, and controls. For the six human–computer agreement questions, each diversity metric agreed on which set should be considered more diverse. However, these questions ranged in terms of magnitude differences between diversity scores, from questions in which the more diverse set should be easily determined by visual inspection to more ambiguous comparisons. In each of the eight distinction questions, one or more of the metrics disagreed with the others on which set should be considered more diverse. Every metric disagreed with each other one at least once, allowing for head-to-head evaluations for all of the metrics. As such, an overall analysis of how often each metric was chosen can determine if there is a significant difference between metrics, and if so, which metric best approximates human perception of diversity. The remaining four control questions displayed a set of identical shapes opposite a randomly selected set, which is trivial for a human to answer correctly. The control questions ensured data quality by confirming that participants understood the instructions properly and were actively engaged in the task. The order of questions, whether each set appeared on the left or right, and which shapes were displayed were all randomized.
An example survey question as shown to a study participant.

Procedure
The survey was distributed to workers through Mechanical Turk, and 400 quality survey responses were recorded. No additional qualifications, other than being a Mechanical Turk worker, were required to participate in the survey. In the Mechanical Turk interface, workers were given a brief description of the task and a link to the survey, which was hosted on a private server. If the worker passed each of the four control questions, he or she was given a unique code to input back into Mechanical Turk for payment. Upon successful completion of the survey, workers were compensated $0.50. The survey recorded 65 survey attempts that were not accepted along with the 400 accepted responses, for a success rate of 86%. The surveys were taken anonymously, and there is no way for the authors to directly identify the participants. Each participant used his or her own computer, and no additional resources were provided other than the survey itself. The preferred set for each question was collected, along with the time spent, as well as the shape and position that the participants viewed. The average time for survey completion was just under 3 min, with participants spending an average of 22 s on the first question presented to them and around 7 s on the last several, indicating a slight learning curve and suggesting that a longer survey likely would have led to diminishing concentration.
Results
Human–computer agreement
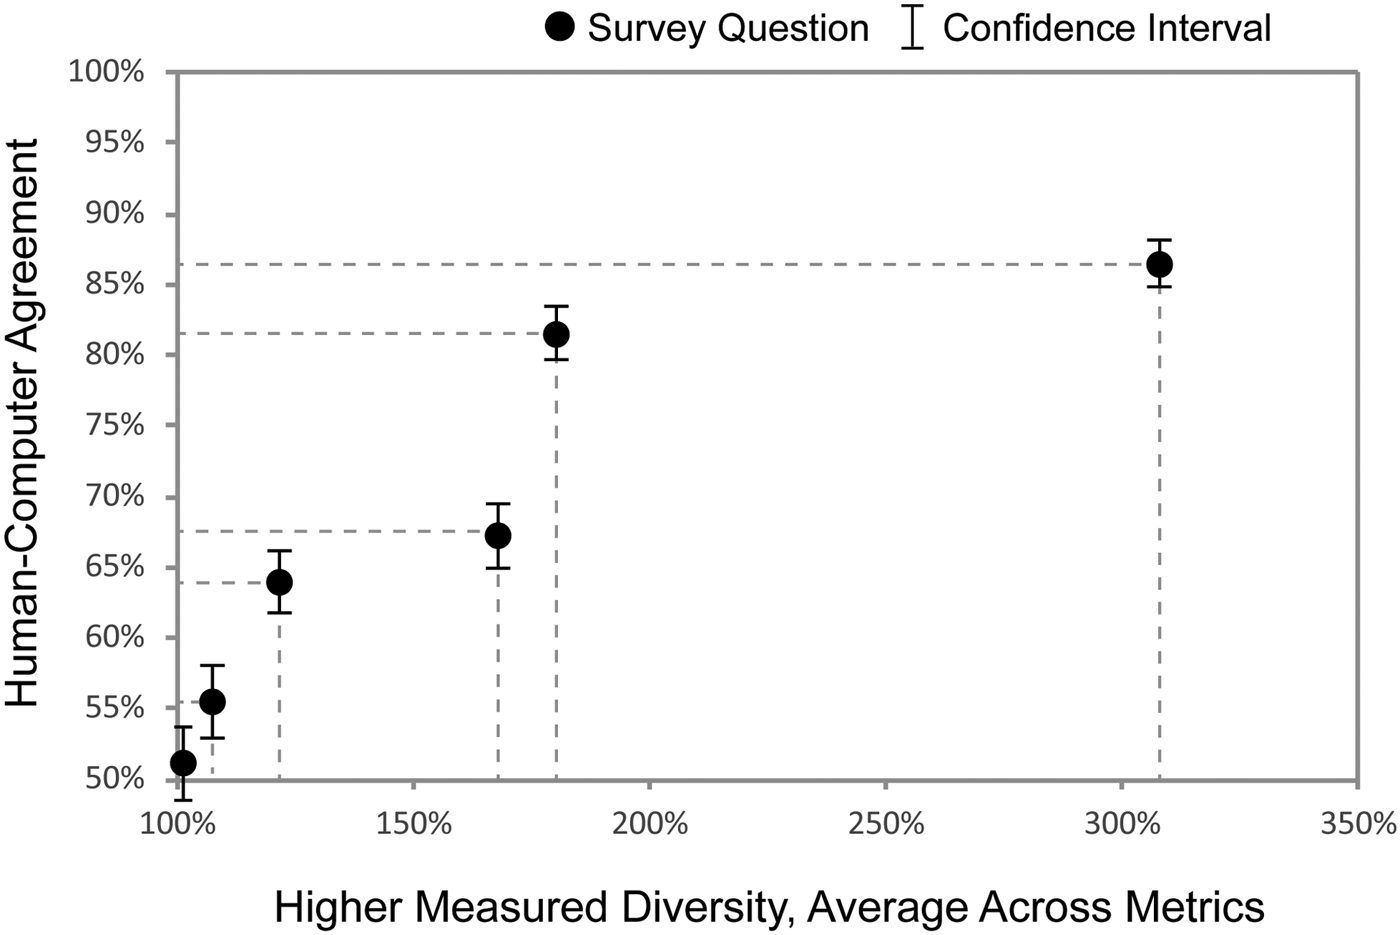
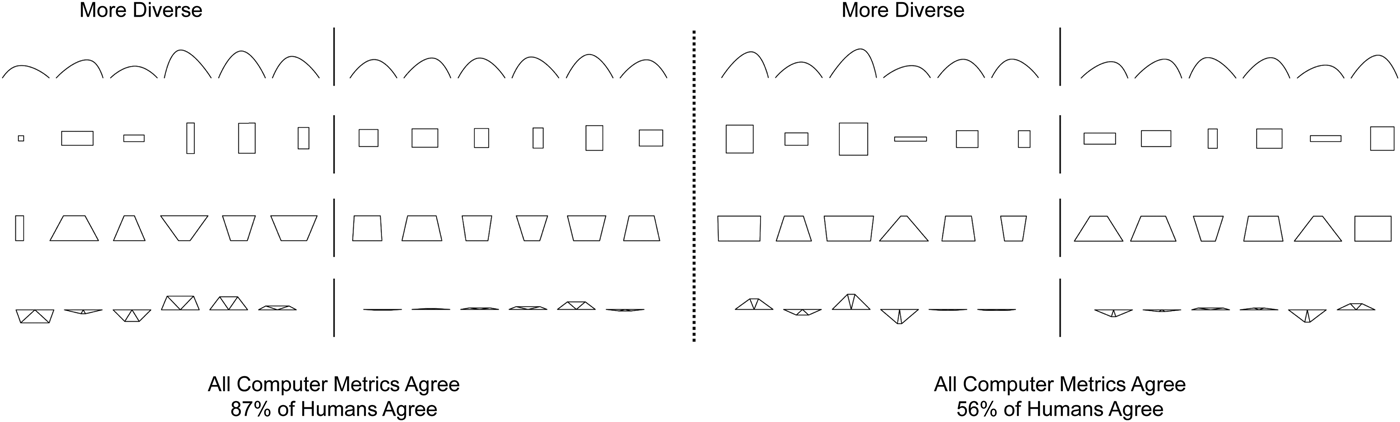
The results for the human–computer agreement portion of the survey are presented in Figure 6. The cumulative percentage of how many respondents agreed with all metrics for each question are plotted against the average higher diversity of the correct set as measured by the metrics. The x-axis refers to the relative diversity of the higher set, or the diversity of higher set divided by the diversity of the lower set, as a percentage. As expected, a greater difference in diversity between the two sets led to more participants identifying the correct set as more diverse. For the question testing the largest difference in diversity, 87% of respondents agreed with the computer, with a confidence interval of 3.3. On the other end, when the computational metrics barely agree on which set is more diverse, many humans were not able to correctly identify the more diverse set – survey responses for these questions were close to 50%. These results indicate that in general, computer metrics are able to match human perceptions of diversity, a finding that encourages their usage in interactive, creative design. Yet at a certain point, the distinctions made by diversity metrics become almost meaningless to humans (see Fig. 7). While these metrics still may be useful at small differences in measured diversity for certain applications, the magnitude of relative diversity measurements must be considered in interactive computational design, and perhaps even controlled by the user, in order to yield meaningful results.
The results of the human–computer agreement survey questions, showing the magnitude of the difference in measured diversity versus the percentage of respondents that agreed with all computer metrics.

An example illustrating the difference between two sets of designs that are easy for humans to select the most diverse set and two sets that are more difficult to distinguish.

Differences between metrics
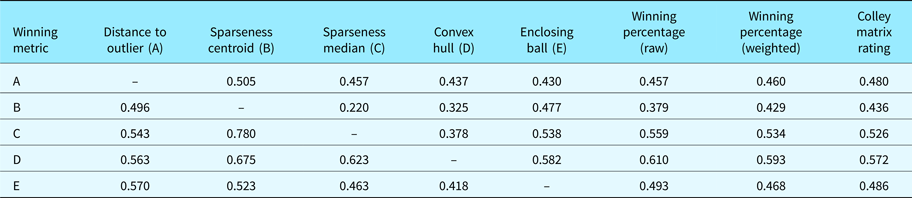
To determine the overall best metric as judged by human participants, the results of head-to-head matchups between the metrics were recorded, and the overall winning percentage for each metric was calculated. These results are provided in Table 2, where each entry in the matrix represents the winning percentage of the row's metric over the column's metric. The overall winning percentage is given as both a simple average and a weighted average based on the number of matchups conducted for each entry. However, due to the nature of the survey questions and their ability to make specific distinctions, metrics could face off against a relatively strong or weak slate. To compensate for these differences, an adjusted score was also calculated using the Colley matrix ranking system (Colley, Reference Colley2002). This system, which was developed for ranking college football teams but is increasingly used for academic research such as Häggman et al. (Reference Häggman, Tsai, Elsen, Honda and Yang2015), adjusts the winning percentage for each metric based on its strength of schedule, or how many times it faced off against strong metrics versus weak metrics. The adjusted Colley rankings are also given in Table 2, and produced similar results to the weighted average.
The final results of the faceoff question analysis, showing the winning percentage of each diversity metric, the raw and weighted overall average winning percentage, and the Colley matrix winning percentage
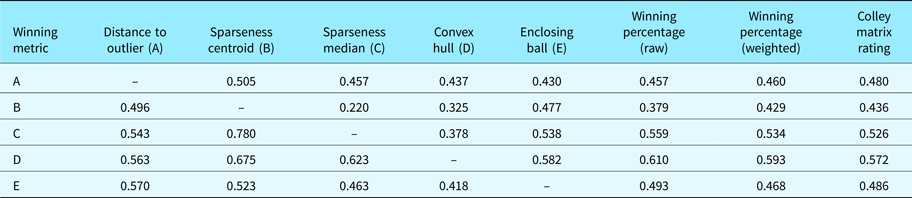
As demonstrated by this survey, the convex hull metric performed the best, followed by the sparseness at the median, enclosing hypersphere, distance to the outlier, and sparseness at the centroid. Since the two sparseness metrics are so closely related, they had the fewest numbers of face-to-face matchups. The median metric performed surprisingly well in these matchups, which significantly impacted the overall average winning percentages. Yet despite the weighted average and Colley matrix method adjusting for this situation, the ranking among all of the metrics remains the same. However, it is important to interpret these results in light of the human–computer agreement questions. No metric proved to be by far the best choice, as the highest adjusted winning percentage was only 57%. Furthermore, the distinctions between metrics in many of these questions seem to be below the threshold of what humans can accurately and repeatedly perceive. As such, any of these metrics could likely be used in applications where the magnitude of diversity difference is high enough to be meaningful for a designer.
Additional factors in the study
Visually dominant variables
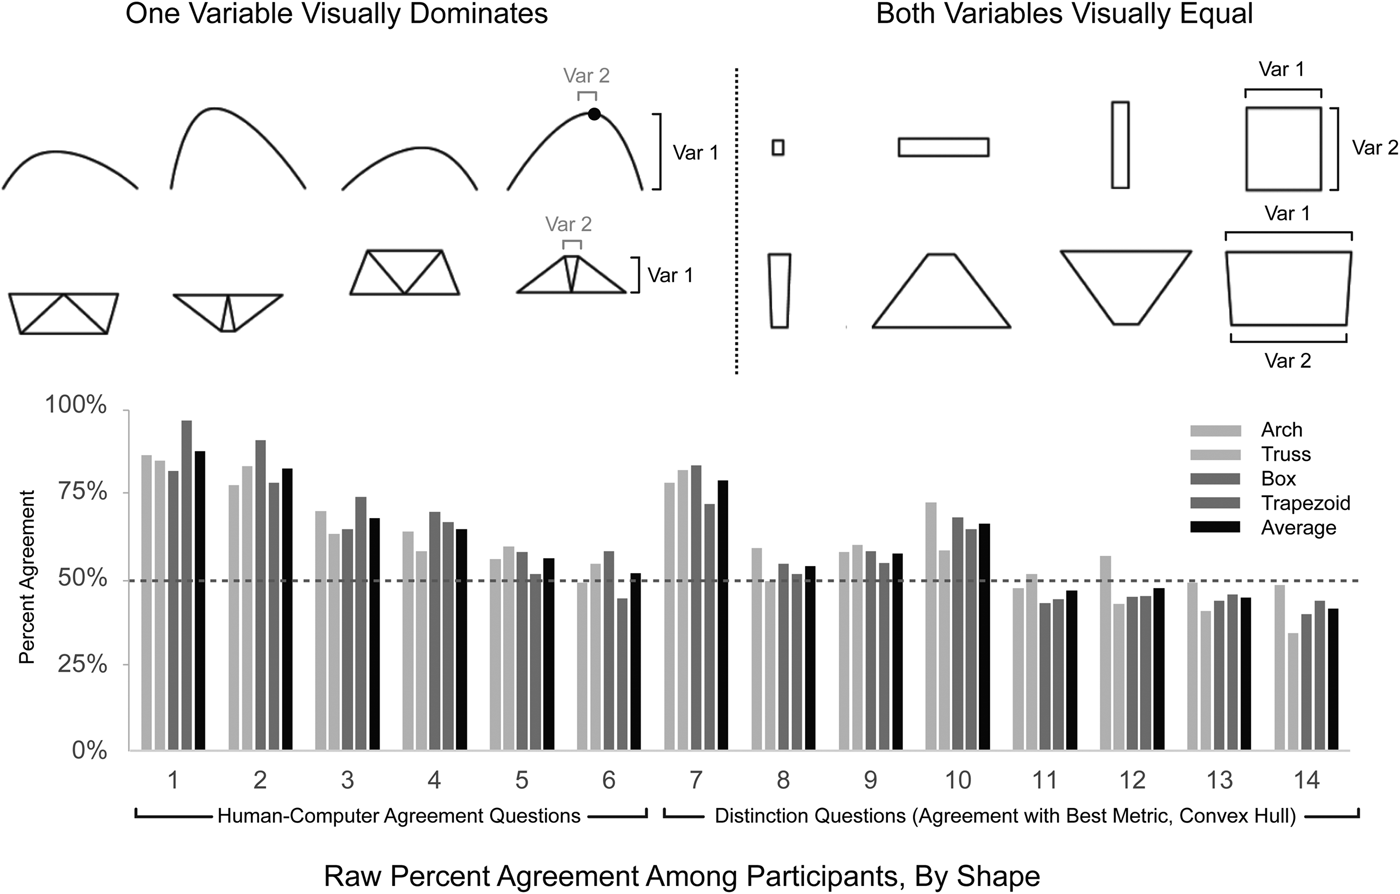
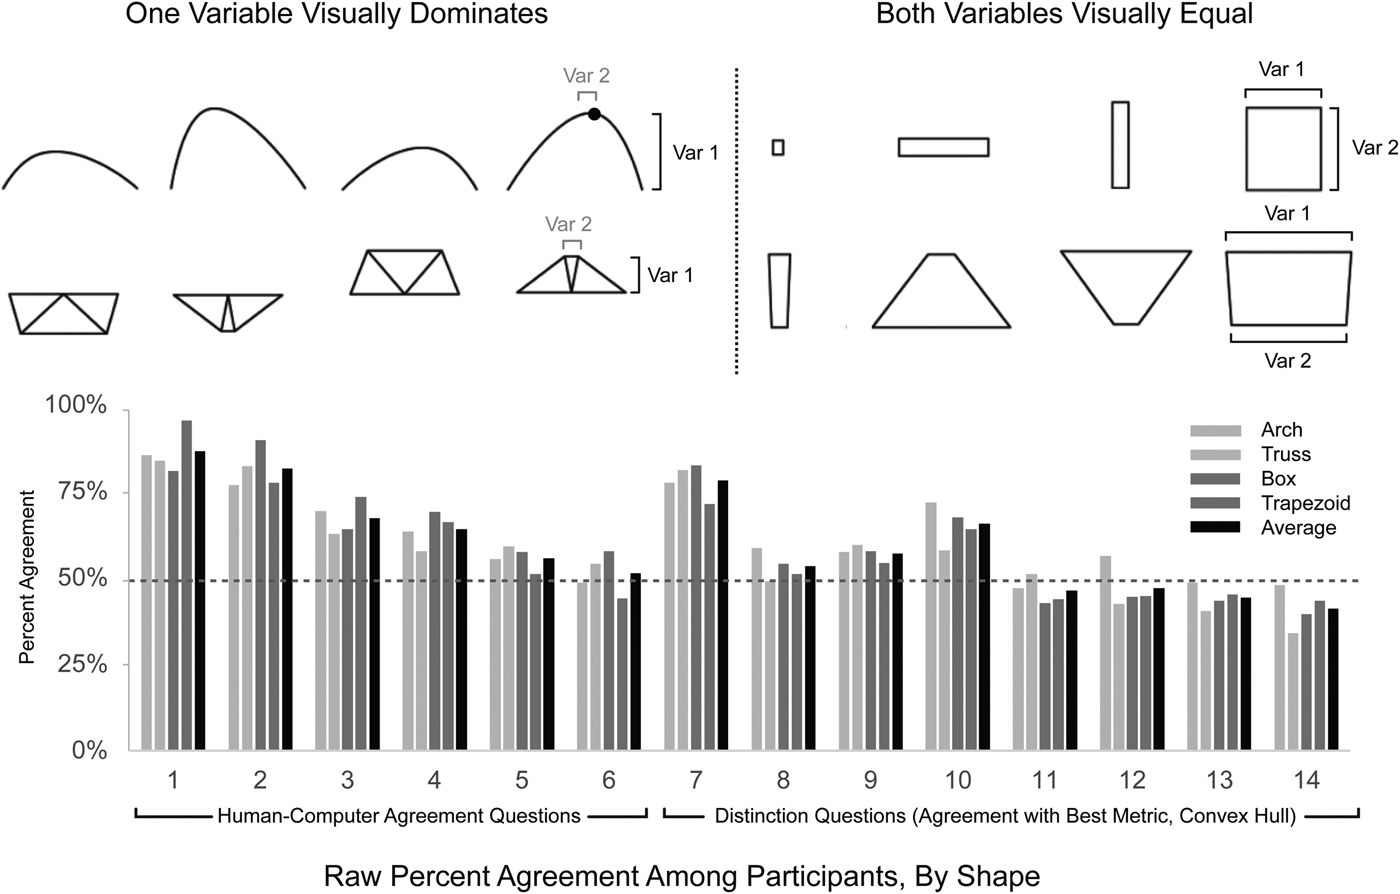
Various factors that are not necessarily related to numerical design vectors can affect human perception of visual diversity. In the case of parametric design, the specific parameterization can determine to a substantial degree which variables are most noticeable when adjusted. Some global variables can have a large visual impact, while some less consequential variables could be barely perceptible. A designer could intelligently correct for these differences by scaling the different variables in the diversity calculation. However, for this study, the variables are weighted equality. The four parameterizations developed were designed such that two had one visually dominant variable (the height of the arch vs. its skew, and the depth of the truss vs. its outer chord width), while the other two had equally notable variable changes due to symmetry (the dimensions of the boxes and trapezoids). It was theorized that the survey results might be different for these two categories, as participants being shown arches or trusses might neglect the second variable when considering diversity. To test this conjecture, the raw question responses for the survey are presented in Figure 8, separated by shape. As can be observed by comparing each shape's response to the overall average, the study did not uncover any systematic effect between the two different types of parameterizations.
A visual description of the different parameterizations for one-variable dominant and regular shapes, along with the shape-separated raw question results, showing no distinct pattern. A value above 50% in the distinction questions indicates agreement with the convex hull metric.
Individual preference strengths for each metric
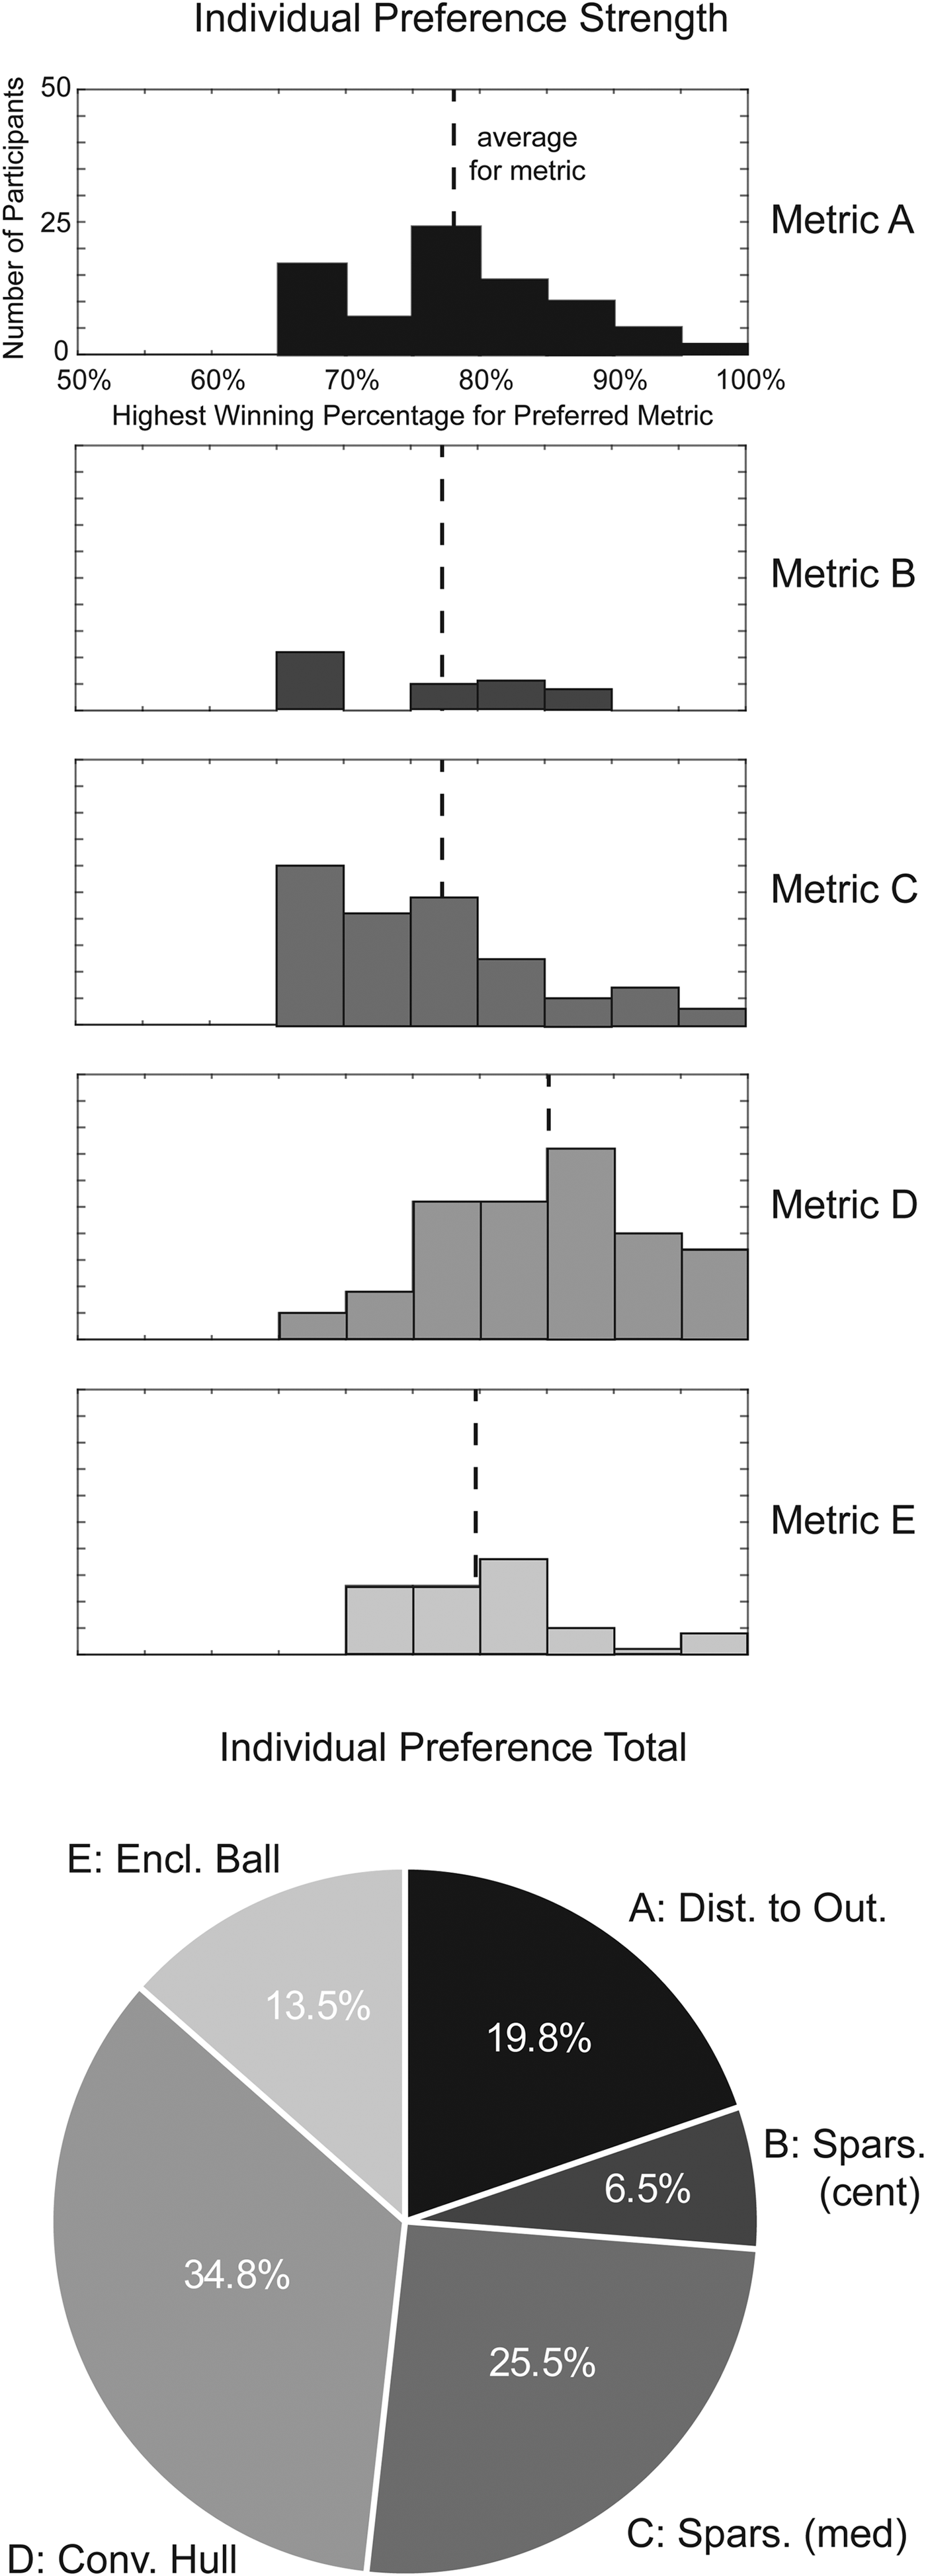
Although the average and Colley matrix winning percentages yield the most useful summary of the relative performance between different metrics, these averages could hide strong individual preferences for different types of people. During the study, a participant might have developed a rule, such as finding the biggest visual outlier or punishing designs that appear to be duplicated, which may have led to a noticeable preference for a particular metric. Both the strength of these preferences, as well as the total number of people who preferred a particular metric, are potentially useful results. Figure 9 presents histograms of the top overall raw winning percentage for each individual participant, as well as a breakdown of proposed metrics. A high overall winning percentage shows that a participant agreed with a specific metric on most distinction questions, while a lower score indicates no strong preference. Thus, a histogram with many participants showing strong preferences, indicated by high bars closer to 100%, would show that a metric is both popular and strongly preferred. In addition to having the best overall winning percentage, the convex hull metric was also the most popular preference, at just over a third of the participants, and had higher preference strengths in general.
The strength and totals for individual preferences of participants in the study, as indicated by their overall best winning percentages.

Limitations
It is worth noting potential limitations to the study. First, the participants were not expert designers but were rather part of the general population. It is possible that experts would be more perceptive of visual diversity. These design spaces are also of a low complexity, both in terms of a limited number of variables as well as their simple representation. This simplicity has advantages, since all of the metrics can be easily visualized and understood, and the designs can be evaluated quickly. As mentioned in section “Methods for measuring diversity in parametric modeling”, there is some research to suggest that with higher numbers of choices or more subtle differences, the effect of higher diversity on design decision-making might even be negative. Nevertheless, a disadvantage of the study is some doubt about how these concepts can translate to more complicated designs, even if they are demonstrably useful for very early-stage design exploration. The order within the sets was also ignored during the study, although the order of the sets themselves, the questions, and the shapes were all randomized. Finally, in order for the metrics to disagree in the distinction section, the diversity of the sets had to be fairly close, in the range that the human–computer agreement questions generally showed to be difficult for humans to accurately and repeatedly distinguish. Yet when taken as a whole, these results still provide insight into different methods for quantifying diversity in a computational design setting.
Discussion and summary of contributions
Qualitative comparison of metrics
In addition to the results of the study, there are clear advantages and disadvantages to some of the diversity metrics. For example, duplicates do not affect the geometric bounding techniques in the same way that they influence the metrics that measure distance for each point individually. Each metric is sensitive to extreme outliers in the set, although some may be affected more than others. Geometric measurements such as the convex hull and enclosing ball are dependent on the specific algorithm used to approach the problem, and may be less accurate or more computationally intensive, especially compared with the sparseness measurements. Of the tested metrics, the convex hull calculation also requires a minimum number of unique points, which can be problematic for design spaces of higher dimensions, a problem that is highlighted in the example shown in the next section. Especially in these situations, the convex hull volume can also yield results on different orders of magnitude, which may require its own special normalization. The methods tested in this paper are deterministic, but for other methods that include randomness, such as categorization by clustering, accuracy and reproducibility may be an issue. Each of these properties may be worth considering when selecting a diversity metric for measurement depending on its specific use.
Example application
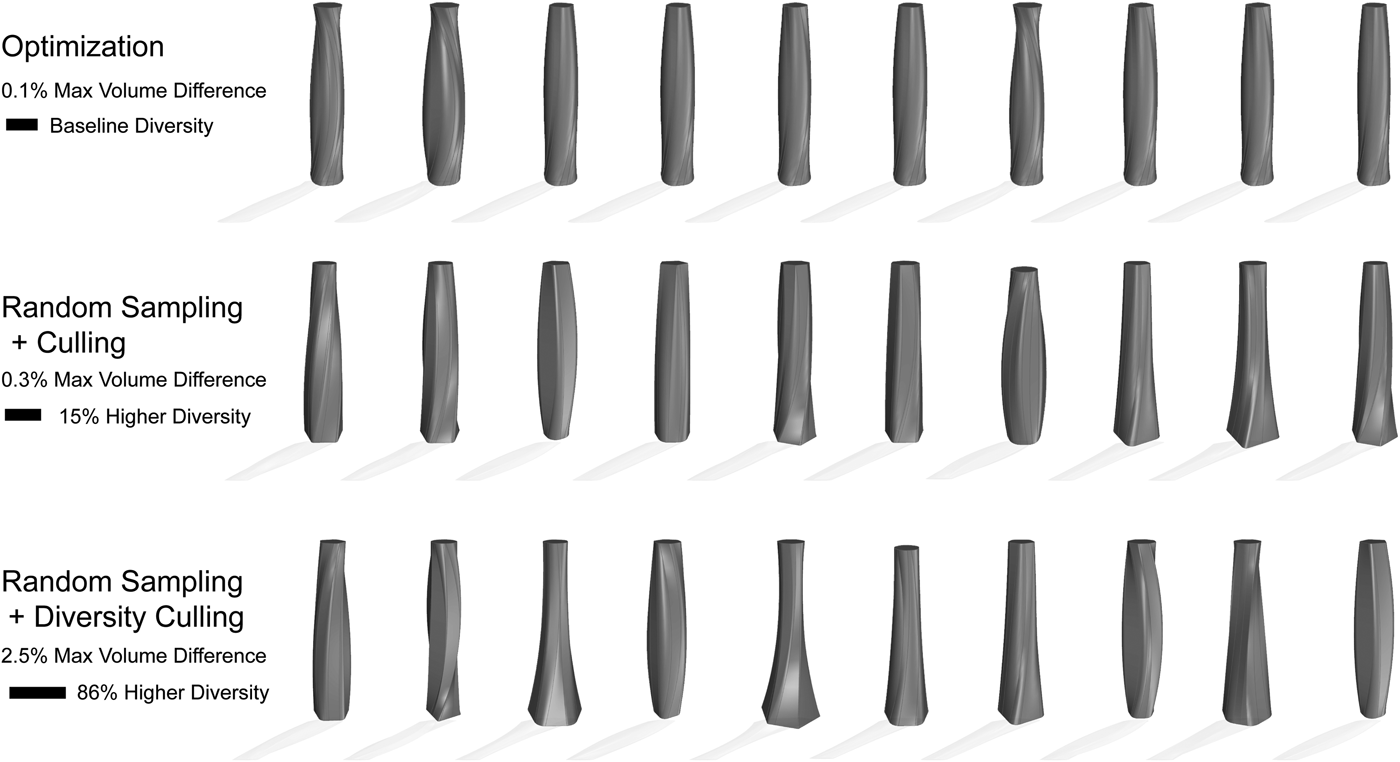
To demonstrate potential applications of this research, diversity metrics were applied to a tower study, illustrated in Figure 10, that is more complex than the 2D shapes but is still of relatively low dimension. The parametric definition of the high-rise tower contains ten variables related to the floorplate shape, size, and twist of the building. For this example, it is assumed that the designers and developers have a target building volume, roughly corresponding to available square footage, but desire a signature, atypical geometric architectural solution for their site. First, an evolutionary solver was applied to the parametric design space to find a set of ten potential designs that are near to the desired volume. The entire design space was then randomly sampled at a resolution of 1000 designs, and the ten designs closest to the target volume were chosen as possibilities. Finally, the 50 designs closest to the target volume were attempted in ten different combinations. The diversity of these sets was measured using each metric in this paper except the convex hull, which requires more points to run for a problem of this dimension. The process then returned the most diverse set returned during the exercise. This crude diversity forcing technique does not require any additional performance evaluations from the sampling approach, but only a bit of extra computation for the diversity calculations. As can be observed visually, the process driven by diversity metrics sacrifices some in terms of performance, but exhibits considerably more variety and expressiveness than optimization or random sampling alone. Although this example is a rough approximation of more sophisticated algorithms, it nevertheless demonstrates the creative potential of diversity-based computational design workflows.
The results of an example parametric tower study, showing the novelty of a design set generated using a process based on diversity metrics in this paper.

Contributions toward diversity metrics for human-centric design
In summary, this paper has consolidated literature from different areas and extracted techniques that could be useful for designers in architecture, engineering, and related fields looking to consider performance and visual appearance simultaneously. It has demonstrated agreement between visual perception and digital calculation of diversity for sets of simple geometries that are often considered during conceptual design, although this agreement becomes unreliable when differences in diversity are not large enough. It also offers both a quantitative and qualitative comparison of five different metrics, which have various strengths and weaknesses, but all appear to be acceptable at the magnitudes in relative diversity that concern human designers. Finally, this paper has provided ideas and examples for researchers looking to integrate considerations of visual diversity and novelty into interactive, computational design processes.
Future work and concluding remarks
Further research into the topic of quantifying diversity could take a number of paths. First, the concepts in this paper could be tested on more complicated designs, which could also make some metrics mentioned but not explored in this paper more relevant. Yet it is again worth noting the general difficulty in using distance-based metrics in higher dimensions (Aggarwal et al., Reference Aggarwal, Hinneburg and Keim2001). As such, these metrics are mostly applicable to problems with a small amount of variables (<15 to 20, often even smaller). However, problems of this size are very common in the conceptual design of buildings and other structures, where variables control global parameters such as building massing (Marks, Reference Marks1997; Caldas & Norford, Reference Caldas and Norford2003), envelope properties (Coley & Schukat, Reference Coley and Schukat2002), and structural geometry (Mueller & Ochsendorf, Reference Mueller and Ochsendorf2015). Thus, architects and engineers working on such problems can use the diversity metrics presented here immediately.
The diversity metrics in this paper are also restricted to parametric design, which may be the most common computational approach, but it is not the only one. Although it is difficult to translate pure geometrical measurement metrics to rule-based or other methods of defining and generating design options, future research could be made into diversity measurements that are more suitable to design definitions that do not contain numerical design vectors. In general, many digital design processes focused on diversity and performance are also limited by problems associated with data visualization for higher dimension design spaces, and/or complex designs. Additional research into new, interactive modes of data visualization could influence how designers understand and interact with diversity, visual or otherwise.
Beyond quantification of parametric design diversity, though, lies the question of how designers actually interact with design processes that are based on computational measurements of diversity. Future studies should consider how designers engage with diversity-based conceptual design, and how this affects design outcomes. These design studies would involve specific architectural problems, of relatively low dimension, that are common during early exploration. Such studies may reveal nuances in how expert designers most effectively use computational brainstorming assistants. Nevertheless, design studies of this nature require a starting point for understanding and measuring computational diversity, so that it can be implemented in various algorithms or workflows, which can subsequently be tested. A combination of the metrics proposed in this paper is adequate for such design studies, as demonstrated by the ability of computers to increasingly match human perception of visual diversity at the magnitude of design differences that are noticeable for humans. Current designers can also begin integrating diversity-based techniques based on these metrics right away, and explore what value these approaches bring to their practice. As such, this paper provides researchers and designers interested in creative, novel design with an initial basis for measuring diversity in a computational setting.
Acknowledgments
The authors are grateful to Eric Wong for his assistance in creating the survey used for this research. They would also like to thank Tomás Méndez Echenagucia (ETH) and Aurimas Bukauskas (University of Bath) for helpful discussions about the topic of diversity measurement.
Nathan C. Brown is a PhD student in Building Technology at the Massachusetts Institute of Technology, where he earned an SMBT degree in 2016. His research seeks to understand how structural considerations interact with other architectural performance criteria in conceptual design. Nathan earned a BSE in Civil and Environmental Engineering at Princeton University, where he studied both architecture and structural engineering and has worked on building energy retrofit projects for Elevate Energy in Chicago. He was the recipient of the 2016 Structural Engineering Travel Fellowship from the Skidmore, Owings & Merrill Foundation.
Caitlin T. Mueller works at the intersection of architecture and structural engineering. She is currently an Assistant Professor at the Massachusetts Institute of Technology's Department of Architecture and Department of Civil and Environmental Engineering, in the Building Technology Program, where she leads the Digital Structures research group. Professor Mueller earned a PhD in Building Technology from MIT, an SM in Computation for Design and Optimization from MIT, an MS in Structural Engineering from Stanford University, and a BS in Architecture from MIT, and has practiced at several architecture and engineering firms, most recently at Simpson Gumpertz & Heger in Boston.