


Introduction
Knowledge of the sensitivity of ice streams and outlet glaciers to changes in the ice shelves into which they drain is of importance for estimating the effects of climate change on ice-sheet behaviour (Reference BentleyBentley, 1998). Frictional drag along the sides and at local grounded parts of an ice shelf creates back pressure which plays a role for the outflow of grounded ice (Reference ThomasThomas,1973). The importance of this back pressure for the stability of grounded ice is, however, a matter of debate (Reference BindschadlerBindschadler, 1993; Reference BentleyBentley, 1998).
The region of northern Larsen Ice Shelf, Antarctic Peninsula, offers the opportunity to study the response of grounded ice after rapid disintegration of parts of the ice shelf. Three sections of the ice shelf disintegrated completely in a few years, following a period of retreat since the 1940s which accelerated after 1975 (Reference Rott, Skvarca and NaglerRott and others, 1996) (Fig. 1). The main part of the ice shelf in Larsen Inlet broke away between March 1986 and November 1989 (Reference SkvarcaSkvarca, 1993, Reference Skvarca1994). The ice shelf in Prince Gustav Channel, and the ice shelf between Seal Nunataks and Sobral Peninsula, called Larsen A Ice Shelf, disappeared almost completely in early 1995 (Reference Rott, Skvarca and NaglerRott and others, 1996). The ice shelf between Jason Peninsula and Seal Nunataks (Larsen B Ice Shelf) was subject to a major calving event in January 1995 and showed significant further retreat after that event (Reference Skvarca, Rackand and RottSkvarca and others, 1999; Reference RackRack and others, 2000). Under the present climatic conditions this retreat seems to be irreversible (Reference Doake, Corr, Rott, Skvarca and YoungDoake and others, 1998; Reference Scambos, Hulbe, Fahnestock and BohlanderScambos and others, 2000).
ERS SARimage composite of northern Larsen Ice Shelf, 6 October 2000. Previous ice-front positions: 1. 26 August 1993; 2. 30 January 1995;3. 25 April 1998; 4.18 November 1998;5. 5 August 1999. D-B-E, Dinsmoor–Bombardier–Edgeworth Glaciers; P-G, Prince Gustav Channel; R, Röhss Bay; S-B, SjÖgren–Boydell Glaciers; S-N, Seal Nunataks. Boxes show location of Figures 2 and 3. ERS SARdataßEuropean Space Agency (ESA) (2000).
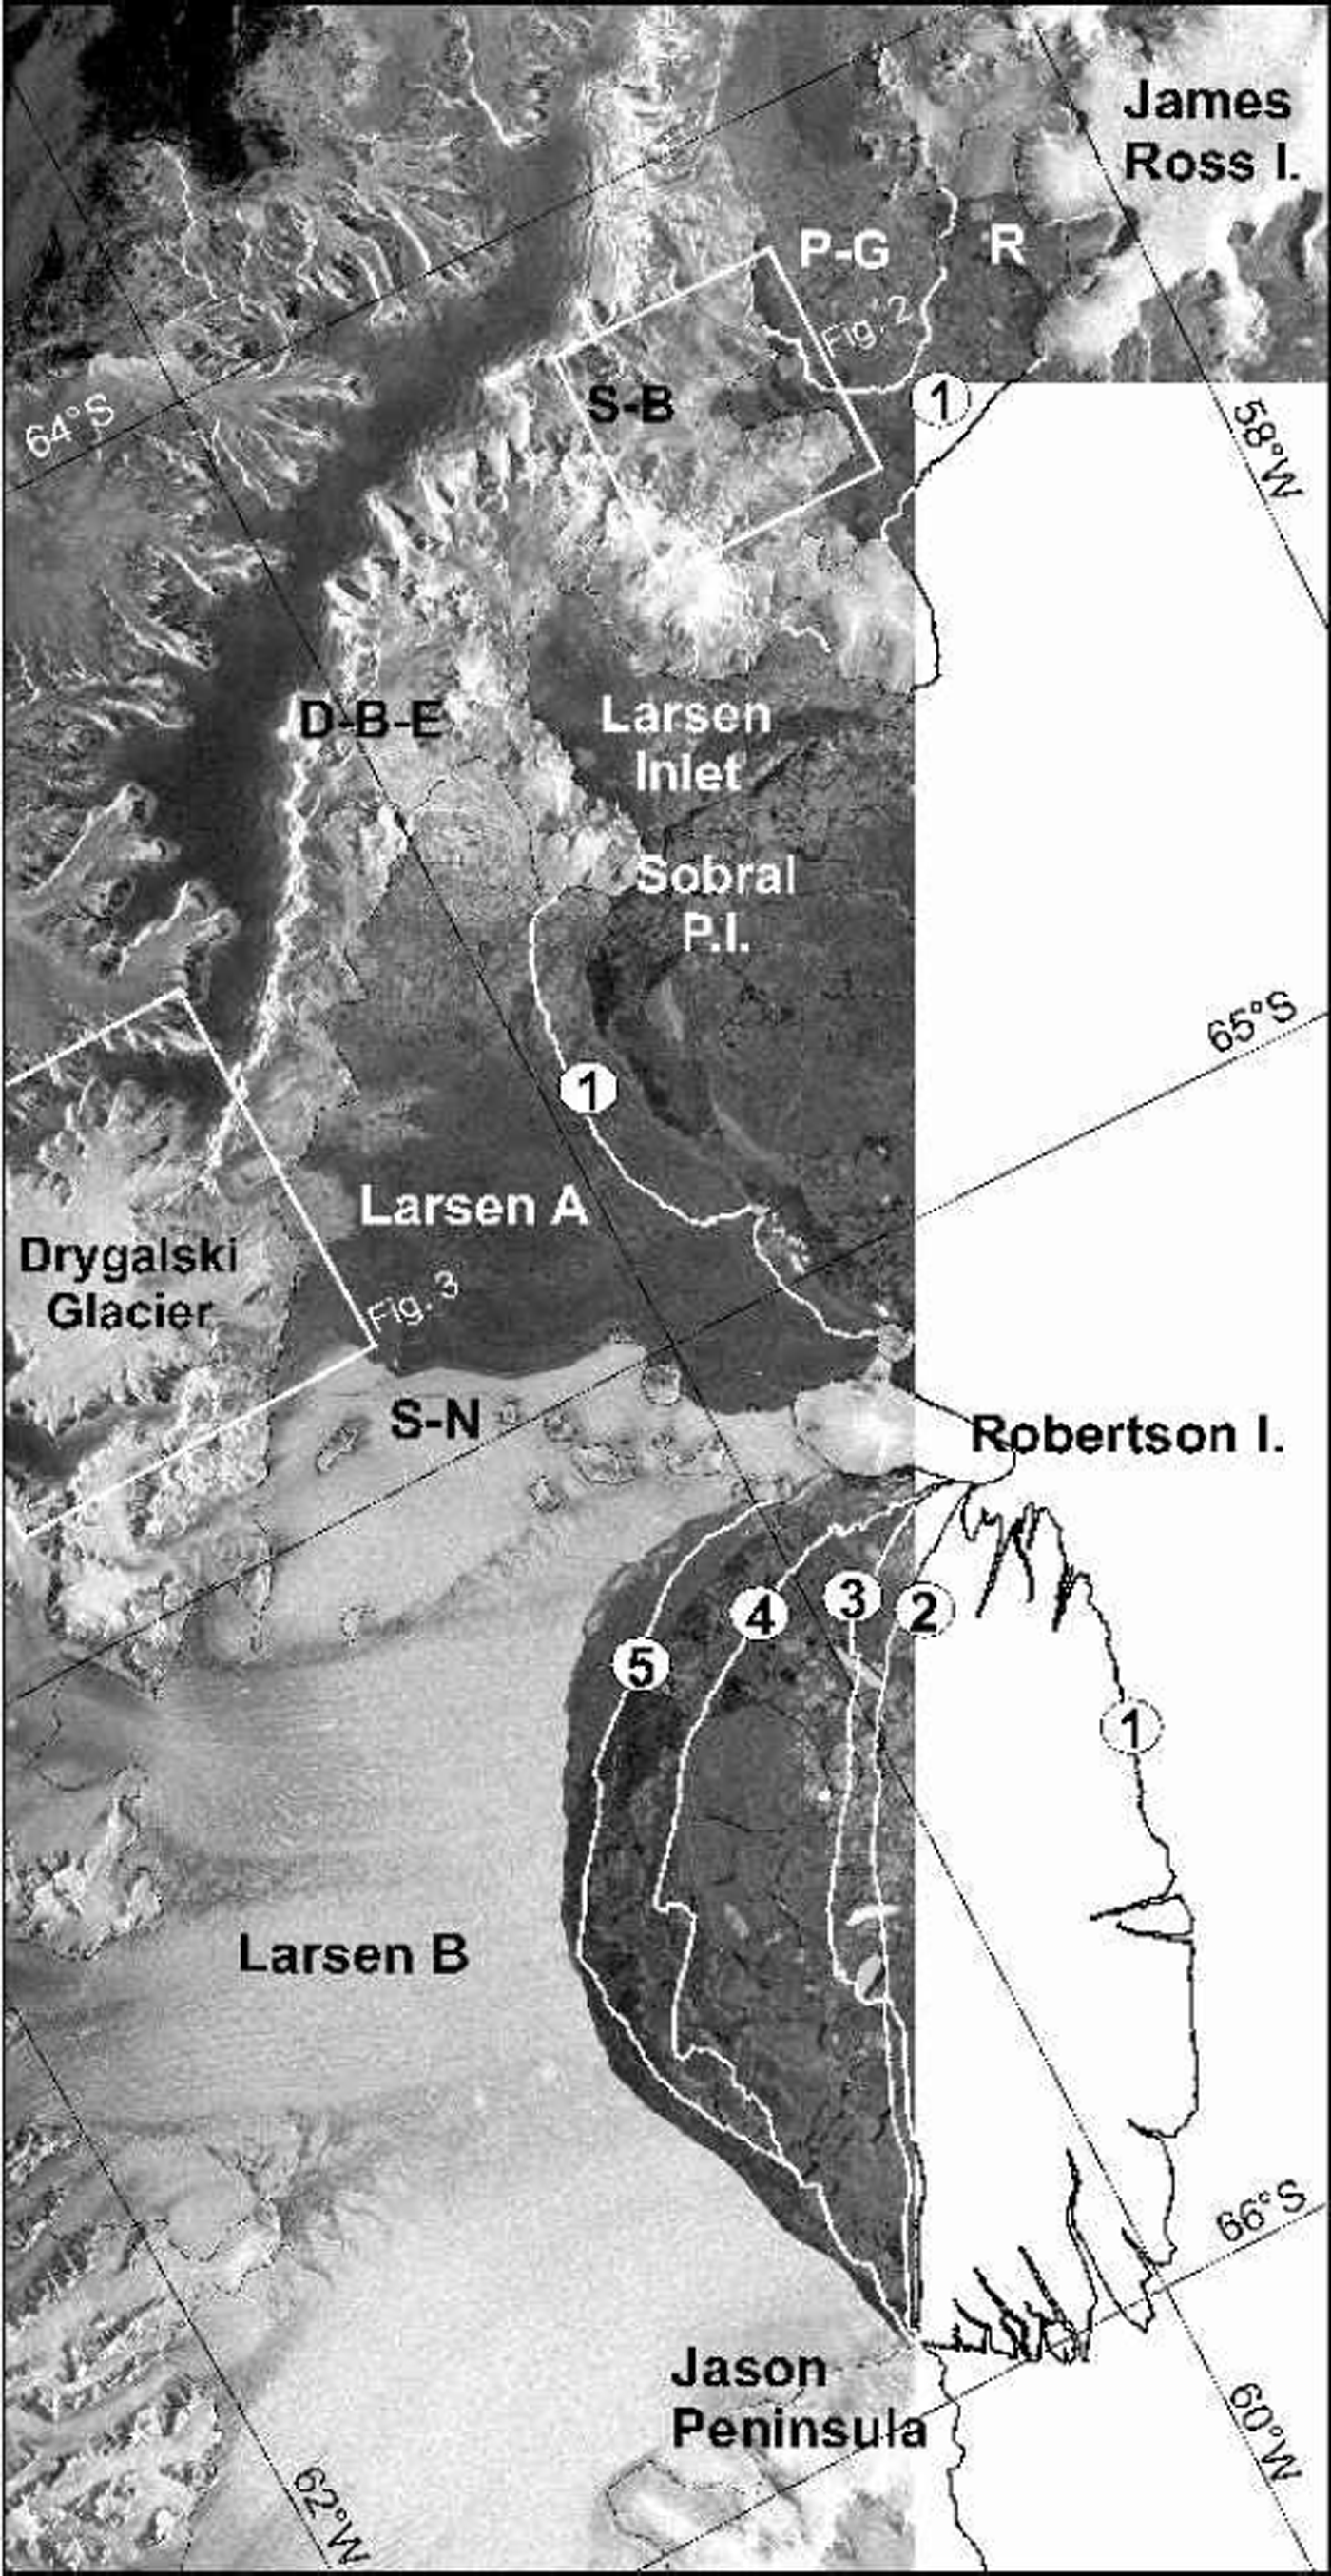
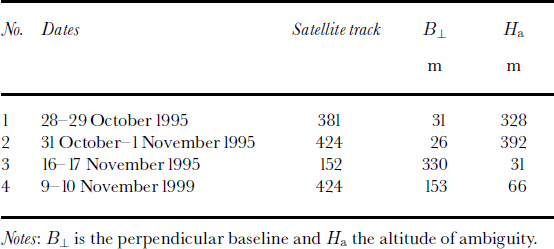
In this study we focus on the retreat of grounded glaciers and possible impacts of ice-shelf disintegration, and provide updated information on the ice-shelf extent up to 6 October 2000 based on synthetic aperture radar (SAR) amplitude images. Interferometric pairs of SAR images from the European Remote-sensing Satellite (ERS) from 1995 and 1999 (Table 1) provided the basis for investigating temporal changes of ice-flow behaviour and for mapping the position of the grounding line. Interferometry for satellite-borne SAR has been widely applied for mapping motion of ice sheets and glaciers, enabling measurements of surface displacement between repeat-pass SAR images at millimetric accuracy (Reference RosenRosen and others, 2000). We used ERS-1/-2 SAR tandem pairs, acquired at 1day time difference, and applied the assumption of surface-parallel flow for calculating the velocities (Reference Joughin, Kwok and FahnestockJoughin and others, 1998). For velocity mapping it is necessary to subtract the topographic phase in the inter-ferograms (Reference Joughin, Winebrenner, Fahnestock, Kwok and KrabillJoughin and others, 1996).
ERS-1/-2 interferograms used in the study (frames 4941 and 4923)
Because the velocities were subject to temporal changes, the topographic phase could not be derived from the inter-ferograms by means of differential methods, but synthetic topographic interferograms were generated using the digital elevation model (DEM) of Ohio State University with 200m pixel spacing (Reference Liu, K.C. and LiLiu and others, 1999). Possible errors of the DEM and deviations from the surface-parallel flow assumption would cause errors in velocity of the main ice streams of a few per cent maximum because their surface slope is small. In addition, rock outcrops surrounding the glaciers provide perfect control as reference for zero velocity. A quantitative error estimate is presented later in this paper for a profile on Drygalski Glacier. The grounding line was mapped by using interferograms, assuming that it is located near the line where the vertical displacement due to tides in the transition zone from the shelf to grounded ice becomes zero (Reference RackRack, 2000). This paper focuses on the analysis of motion on grounded ice, where tidal effects are negligible. The motion field on the ice shelves and the methods for tidal corrections were described in a previous paper, in which the interferometric analysis is compared with field data and model calculations (Reference Rack, Doake, Rott, Siegel and SkvarcaRack and others, 2000).
Changes In Prince Gustav Channel And Larsen Inlet
The ice shelf in Prince Gustav Channel was separated from the main ice shelf in the late 1940s (Reference CooperCooper, 1997). The retreat and disintegration between July 1992 and March 1997 was documented by a series of ERS SAR images (Reference Rott, Rack, Nagler and SkvarcaRott and others, 1998). The main inflow to the ice shelf came from Sjøgren and Boydell Glaciers which originate on Detroit Plateau on the Antarctic Peninsula, with a total grounded catchment area of 704 km2. At the grounding zone this outlet glacier was 6 km wide (Fig. 2). From interferogram No. 1 (28–29 October 1995) a value of 1.5md–1 was derived for the magnitude of the velocity vector,  in the centre of the glacier at the grounding line. The orientation of the flowline, which deviates only a few degrees from the ground range, was taken into account for calculating The velocity on the ice shelf previous to the break-up was determined by means of image cross-correlation using Landsat Thematic Mapper (TM) images (Rack and others, 1999). From the TM image pair of 29 February 1988 and 5 November 1989 420ma–1 (1.15md–1) was derived at the ice shelf 10 km downstream of the grounding line. This lower velocity in comparison to the velocity at the grounding line in 1995 can be at least partly explained by the wider cross-section at the ice shelf. The velocities at the grounding zone could not be determined from the Landsat images because no stable features were found in this area.
ERS-2 SAR image of the terminus of Sjøgren (S) and Boydell (B) Glaciers acquired on 6 October 2000. Positions of the ice front from SAR images: 1. 26 August 1993; 2. 30 January 1995; 3. 8 March 1995; 4. 10 February 1996; 5. 30 January 1998; 6. 31 January 1999; 7. 6 October 2000. P-G, Prince Gustav Channel. The black line between positions 3 and 4 corresponds to the grounding line in October 1995. ERS SAR data © ESA (2000).
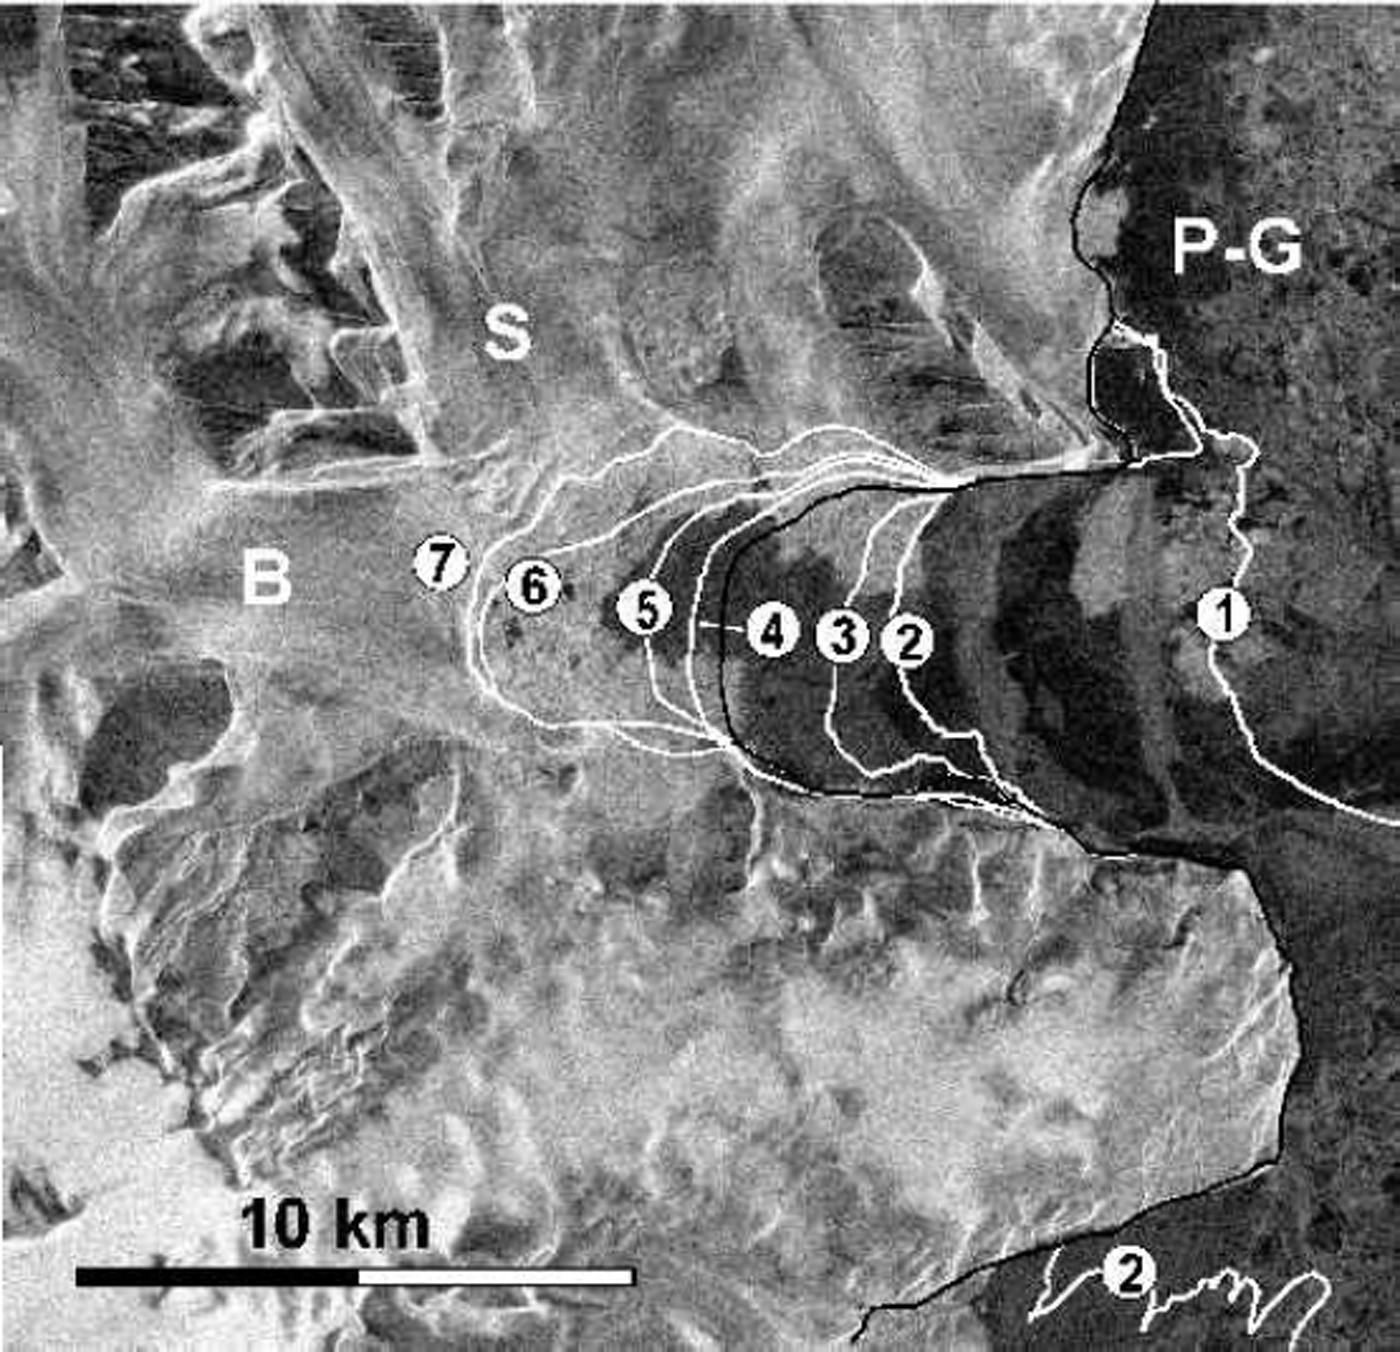
Figure 2 shows the retreat of the Sjøgren–Boydell outlet glacier between 26 August 1993 and 6 October 2000. The position of the grounding line was inferred from the tidal motion apparent in interferogram No. 1. A large part of the ice shelf broke away in summer 1992/93. The main disintegration took place in January 1995 (Reference Rott, Skvarca and NaglerRott and others, 1996), leaving only 3km of floating ice in front of the glacier. The retreat of grounded ice started in summer 1995/96, amounting to 4.5 km in distance and 24 km2 in area to October 2000. In the image of 6 October 2000 the ice front is as close as 1500m to the mountain ridge between Sjøgren and Boydell Glaciers, which suggests that the two glaciers will soon be separated.
The ice retreat coincided with an acceleration of the ice flow. In the available interferometric pair No. 4 from 1999 the ice front is outside the image swath, which covers only the upper part of the glacier. Comparison of the velocities between 1995 (interferogram No. 2) and 1999 (interferogram No. 4) shows strong acceleration of the glacier. For example, 9 km above the 1999 front the velocity accelerated by a factor of 2 (from 0.4md–1 to 0.8md–1) at the central flowline of Sjøgren Glacier.
After the collapse in 1995, a small ice shelf was left in Röhss Bay on the west coast of James Ross Island, with an area of 159 km2 (Reference Rott, Rack, Nagler and SkvarcaRott and others, 1998). In this part of the ice shelf the flow velocities were much lower than in the part which was nourished from the Antarctic Peninsula (Reference Rack, Rott, Siegel and SkvarcaRack and others, 1999). The area of the ice shelf in Röhss Bay, analyzed in a sequence of SAR images, showed a gradual decrease since 1995, the remnant amounting to an area of 47 km2 on 6 October 2000. At this side of Prince Gustav Channel, so far no grounded ice has been affected by the retreat.
The ice shelf at Larsen Inlet, a bay about 25 km long and 15 km wide, covered an area of 407 km2 in 1986, including the bay and a small area east of it. The ice shelf disappeared almost completely by 1989 (Reference SkvarcaSkvarca, 1993). The retreat of the outlet glacier during recent years has been less pronounced than for the other main glaciers in this region, possibly due to the steeper topography. By 6 October 2000 the small remnant floating part disappeared and the ice front retreated 0.5 km beyond the original grounding line. The main outlet glacier to Larsen Inlet drains a grounded area of 450 km2. At the centre of the glacier in the grounding zone a velocity = 1.8 m d-1 was derived from interferogram No. 2 (31 October–1 November 1995), assuming surface-parallel motion and accounting for the angle between the ice-flow direction and radar illumination. Considering the size of the glacier and the width of the terminus, the magnitude of the velocity seems to be rather high, which might indicate acceleration in previous years, related to the disintegration of the ice shelf. However, no velocity data are available before 1995.
Retreat And Acceleration Of Dinsmoor–Bombardier–Edgeworthglaciers And Dry-Galski Glacier
The main ice inflow to Larsen A was through Drygalski Glacier, which in 1995 covered a grounded drainage basin of 984 km2, and Dinsmoor–Bombardier–Edgeworth (D-B-E) Glaciers with a grounded basin of 681km2 (Fig.1). The section between these two outlet glaciers includes a number of smaller and steeper glaciers, with a grounded area of 622 km2.The outlet glaciers D-B-E and Drygalski Glacier are characterized by comparatively high velocities. From interferogram No. 2 (October 1995) the velocity, in the centre of the 6 km wide front of D-B-E glaciers was 2.9 md–1. This high velocity suggests that there may already have been an increase after the collapse of Larsen A.
Until 6 October 2000 about 34 km2 of grounded ice were lost at D-B-E glaciers, and the distance of the front from the original grounding line was 6.5 km. Whereas interferometric pair No. 2 from 1995 shows high coherence all over the glacier, in pair No.4 from 1999 good coherence is observed only on the upper parts of the glacier. The comparison shows clear acceleration of the ice flow from 1995 to 1999, decreasing in magnitude with increasing distance from the ice front. On the lower terminus the coherence is poor in the 1999 interferogram, probably due to heavy crevassing related to the retreat. On this part of the glacier the motion could be analyzed by means of speckle tracking (Reference Gray, Mattar and ShortGray and others, 2000). At the central flowline 2 km above the 1999 ice front the velocity, │V│ accelerated from 1.5md–1 in 1995 to 6 md–1 in 1999.
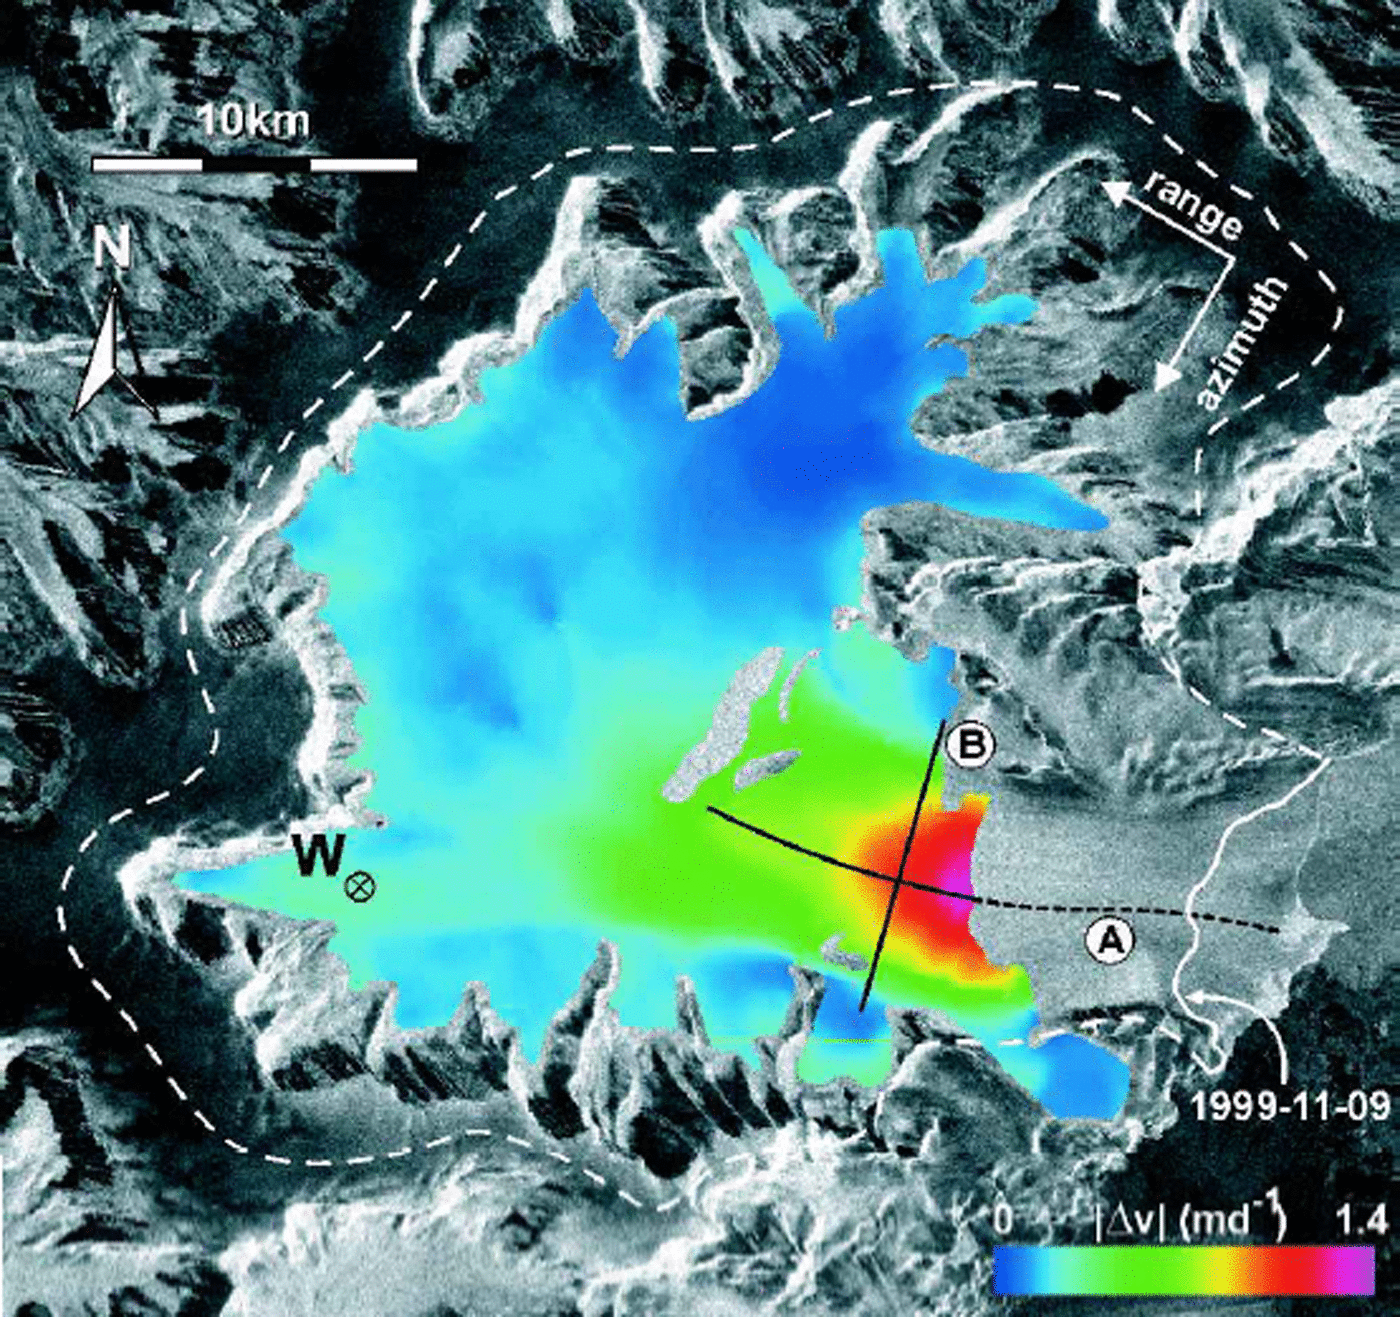
For Drygalski Glacier the changes of the velocity field between 1995 and 1999 are shown in detail. By October 1995 the floating ice had disappeared, and the front had retreated up to 5 km into grounded ice by 6 October 2000, with a decrease of grounded area of 24 km2. Drygalski Glacier can be separated into different zones (Fig. 3). The narrow ice plateau above the escarpment, which surrounds the main part of the glacier below the ice cliffs in a semicircle, amounts to about 25% of the glacier area. The radar reflectivity of the ice plateau is relatively low and stable through the whole year, indicating permanently dry snow. The parts of the glacier below the escarpment belong to the percolation zone, as evidenced by the high reflectivity which is characteristic for refrozen firn (Reference Rott, Sturm and MillerRott and others, 1993). The main part of the glacier extends across a broad basin with smooth topography below the cliffs. The ice from this basin is routed through an outlet glacier that is about 20 km long and 10 km wide. The
Image of velocity difference (in colours) of Drygalski Glacier. Velocity component (in across-track direction at the surface) of interferograms No. 4 (9–10 November 1999) minus No. 2 (31 October–1 November 1995). Background: ERS SAR amplitude image of 1 November 1995. A, B, position of velocity profiles shown in Figure 4. W, mentioned in the text. Dashed line is approximate ice divide.
direction of ice flow in the basin varies by 490˚ which makes interpretation of the interferograms difficult. The main tributary from the north, for example, flows almost parallel to the satellite path. Motion in this direction cannot be detected by means of across-track interferometry. The flow direction at the terminus, on the other hand, is almost perpendicular to the satellite path, providing good sensitivity for interferometric motion analysis.
The main results are based on the interferograms of 31 October–1 November 1995 (No. 2) and 9–10 November 1999 (No. 4). In order to derive the motion, the topographic phase was subtracted by means of a synthetic interferogram calculated from a DEM as explained in the introduction. In order to estimate the impact of DEM errors on the motion analysis, we calculated the velocities at profile A (Fig.3) with the given DEM and with an increased topographic gradient corresponding to a total elevation difference of 50m along the profile which is 18 km long and covers a total height range of 450 m. In this case the gradient of the velocity along the whole profile would decrease by 1cmd–1 for interferogram No. 2 and 6 cmd–1 for interferogram No. 4, which is only about 0.4% and 2.3%, respectively, of the velocity difference in 1995 (3.3md–1 at the front, decreasing to 0.7 md–1 at the top of the profile). In interferogram No. 2, possible errors of the DEM play a smaller role because of the short interferometric baseline, corresponding to an elevation difference of 392 mper 2π phase cycle (Table1). In particular on the outlet glacier, where the surface is relatively flat and the velocities are high, possible errors of the DEM would result in velocity errors which are about two orders of magnitude below the observed values in any of the available interferograms.
After subtraction of the topographic phase and phase unwrapping, motion images were compiled for the velocity component in ground range. The comparison reveals a clear increase of velocity between 1995 and 1999 for the glacier below the escarpment. The individual motion maps, as well as Figure 3, showing the difference of velocity in ground range between 1995 and 1999, confirm that the acceleration of the ice mass was initialized at the front. The SAR image pair of November 1999 decorrelates on the lowest 6 km of the terminus, probably because of the high velocity and shear related to the acceleration of the glacier. The SAR images as well as observations from airplanes reveal a significant increase of crevasses in that area since 1995.
A detailed plot is presented in Figure 4, showing magnitudes of the velocity vector along the central flowline of the terminus, starting 17 km upstream of the ice front in 1995 (profile A), and along a transverse profile (profile B). Above the starting point of profile A the ice flow comes from many different directions, which complicates interpretation of the interferogram. The interferogram in 1995 allows determination of the velocity down to the ice front where a maximum velocity of 3.3 md–1 is observed. Four kilometres upstream of the front, near the narrowest part of the outlet glacier (about 7 km wide), is a secondary maximum below which the glaciers widens. About 1km downstream of this maximum is a local minimum. The increase of velocity downstream of this secondary minimum in the profile for October 1995 suggests that there may already have been some acceleration in response to the loss of the ice shelf in front of the glacier 9 months previously. A strong velocity gradient is observed for the lowest 7 km of the profile, which might indicate the onset of stream-flow with increasing basal sliding in the channelized part of the glacier.
Magnitude of the velocity vector along profiles on Drygalski Glacier (position shown in Fig. 3) derived from ERS interferometric pairs of 31 October–1 November 1995 and 9–10 November 1999. A, longitudinal profile (west–east); B, transverse profile (north–south).

At the first point where the velocity analysis is possible in profile A in the 1999 interferogram, the velocity of November 1999 exceeds that of October 1995 by a factor of 2.9. At the upstream end of profile A this factor is 2.6 (Fig. 4). Further upstream the increase is also clearly pronounced, as for example at point W (Fig. 3) on the western tributary, where the velocity was 0.31md–1 in 1995 and 0.52md–1 in 1999. No information can be derived for the northern tributary because the flow direction is almost in the along-track direction of the satellite.
A crude estimation of the actual ice transport across the front is possible by extrapolating the bathymetric datawhich were measured near the front in May 2000 (Reference DomackDomack and others, 2001). Assuming a mean ice thickness of 500m from the bathymetric data, and the mean velocity at the front amounting to 80% of the maximum velocity under the assumption of full basal sliding, the transport through the 8.5 km wide frontal cross-section would be 11.26106 m3 d–1 (4.10×10⁹ m3 a–1) in October 1995. For an ice density of 910 kgm–3 a mean annual net accumulation of 3781 kgm–2 a–1 over the entire drainage basin would be needed to achieve a balanced mass budget.
There are no accumulation measurements available at Drygalski Glacier. The closest measurements were made at various stakes 30 km to the south on Larsen Ice Shelf, near Pedersen Nunatak. The total net accumulation of the 10 year period 1978–88 was 260 cm of firn which was partly transformed to ice. In recent years the surface mass balance in this area was negative. However, these data cannot be considered representative for the Drygalski catchment basin. According to the mean accumulation data for the Antarctic Peninsula, compiled from a sparse dataset (Reference Peel and MorrisPeel, 1992), the accumulation rate at an elevation of 970 m, the mean elevation of the catchment, is 840 kgm–2 a–1. This value should be a reasonable estimate for the mean net accumulation of Drygalski Glacier, because on the one hand the accumulation on the east coast is clearly lower than the average, and on the other hand the glacier is located in the northern part of the Antarctic Peninsula where accumulation is above the average. Even taking into account significant uncertainty of the accumulation, the export at the glacier front is much larger than the accumulation estimate, suggesting that the glacier was strongly out of balance in October 1995, and even more in 1999.
Changes Of Larsen B
The retreat of Larsen B, which is now the northernmost part of Larsen Ice Shelf, has been documented up to 1998 using SAR data (Reference Rott, Rack, Nagler and SkvarcaRott and others, 1998; Reference Skvarca, Rackand and RottSkvarca and others, 1999) and until March 2000 using U.S. National Oceanic and Atmospheric Administration (NOAA) Advanced Very High Resolution Radiometer (AVHRR) data (Reference Scambos, Hulbe, Fahnestock and BohlanderScambos and others, 2000). We analyzed further SAR data up to October 2000 and studied also the velocities on the ice shelf and on the outlet glaciers by means of interferometry and field data. After the calving event in 1995, an increase of ice velocity on the shelf by several per cent was observed, which was more pronounced close to the front due to the opening of rifts (Reference RackRack, 2000). So far we cannot detect any significant changes of velocity on the outlet glaciers.
Recent values for the ice-shelf area are listed in Table 2 together with selected previous data. Compared to a previous analysis the values up to 25 April 1998 are smaller by 320 km2, because the re-analysis of the grounding line using interferograms indicated a slightly different position in some parts of the ice shelf than the previous analysis which had been based on optical images (Reference RackRack, 2000). Whereas the slowly moving part of the ice shelf around Seal Nunataks, which is separated from Larsen B by a zone of strong shear and rifts (Reference SkvarcaSkvarca, 1994; Reference Rack, Rott, Siegel and SkvarcaRack and others, 1999, Reference Rack, Doake, Rott, Siegel and Skvarca2000), shows little change, the main part of Larsen B has decreased by 40 %since January 1995.
Area of Larsen B south of Seal Nunataks, derived from selected SAR images
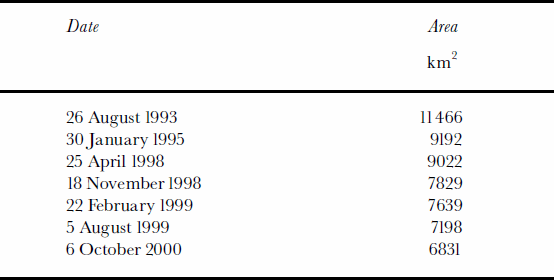
The retreat between 30 January 1995 and 25 April 1998 was not very significant and affected mainly the northern part of the ice front. In the image of 25 April 1998, several long rifts are visible parallel to the front (Reference Skvarca, Rackand and RottSkvarca and others, 1999). A major calving event took place in November 1998, which resulted in significant retreat all along the ice front between Robertson Island andJason Peninsula. The comparison of the front with model calculations of stability of Larsen B indicates that in this position the ice shelf may already have been in a phase of irreversible retreat (Reference Doake, Corr, Rott, Skvarca and YoungDoake and others, 1998). Between November 1998 and October 2000 the area decreased by another 1000 km2, with the main loss on the northern half of the ice shelf. This retreat coincides with a temperature rise which continued up to 2000. The mean annual temperature in 1999 was the warmest of the 48 year record for Esperanza and of the 30 year record for Marambio. The 1999/2000 mean summer temperature for Esperanza was the highest of the record, and for Marambio it was also clearly above average.
Conclusion
The analysis of satellite data shows significant changes of the outlet glaciers which prior to 1995 nourished the sections of Larsen Ice Shelf north of Seal Nunataks. The ice front of most of the glaciers retreated inland of the former grounding lines. The velocity of the largest outlet glaciers in this region (Drygalski Glacier, D-B-E glaciers, Sjøgren and Boydell Glaciers) increased significantly after the ice shelf in front broke away. Also most of the smaller glaciers show clear signs of break-up. Due to the chaotic nature of their surface, the main parts of the small glaciers are incoherent in the 1999 interferometric data, so that surface motion cannot be derived. In the SAR amplitude images, many more crevasses are apparent in 1999 than in 1995.
The rapid retreat of Larsen B, currently the northernmost part of Larsen Ice Shelf, continued to 2000. This confirms that the present ice-front configuration is no longer stable. The trend of regional climatic warming at the northeastern part of the Antarctic Peninsula and probably also the greater proximity to the ocean after the collapse of the ice shelf north of Seal Nunataks, causing changes of the ice/ocean/air energy transfer, favoured the retreat. So far no significant acceleration has been observed on the glaciers flowing into Larsen B. The observations on Larsen A suggest that glaciers accelerate if the ice shelf in front disappears more or less completely. If the retreat of Larsen B continues, there will be opportunity to verify this hypothesis.
Comparing Landsat images of 1974 and 1989, Reference VaughanVaughan (1993) did not observe any significant changes in the flow behaviour of the various outlet glaciers from the Antarctic Peninsula during the break-up of Wordie Ice Shelf, but in 1989 remnants of the ice shelf still filled the bays in front of the main ice streams. Our observations suggest significant sensitivity of glacier flux to ice-shelf back pressure at the Larsen A and Prince Gustav Channel ice shelves. Rapid acceleration and retreat of the outlet glaciers after complete removal of the ice shelves seem to be the rule in this region, suggesting that the removal of ice shelves could lead to an effect on eustatic sea level through the impact on the grounded outlet glaciers.
Acknowledgements
This work is a contribution to the Austrian Science Fund (FWF) Project No. 12923 GEO and the Larsen Ice Shelf Project of Instituto Antártico Argentino, Dirección Nacional del Antártico. The ERS SAR data were kindly made available by ESA for the experiment AO3.A108 (VECTRA). We are grateful for the careful review by D. Vaughan and M. Frezzotti, and the useful suggestions of the scientific editor, N. Young, which helped to improve the manuscript.



