

Introduction
Corporations in OECD countries hold large debts that have led to some serious concerns about financial stability and potential impact on macroeconomic indicators. As shown in Figure 1, financial and non-financial corporations in OECD countries raised capital through debt five times more often than corporate equity during the last two decades. As a result, European economies faced severe tax distortions and experienced shrinking government revenue.Reference De Mooij1–Reference Radulescu and Stimmelmayr6 However, despite the awareness in terms of macroeconomic repercussions of corporate leverage, there is no empirical evidence on how debt-oriented capital structure impacts economic growth. This is the motivation for this paper, which aims to explore the relationship between capital structure and economic growth for selected OECD countries, based on the availability of data.
GDP per capita growth and corporate leverage in the OECD countries.

The literature, particularly the neoclassical framework, is limited to accumulation of capital and labor.Reference Solow7–Reference Swan9 However, the endogenous framework does allow for a variety of sources, such as entrepreneurial activity, R&D (Research and Development) and recently taxes.Reference Beck, Levine and Loayza10–Reference Schumpeter14 For instance, investment in educating the labour force, improvement in technology, and tax structure, which help entrepreneurial activity, increase economic growth.
Likewise, a corporate financial position for or against entrepreneurial activity can have a positive or negative impact on economic growth. This is because corporations that choose high corporate debt levels as compared to corporations with low debt levels face different taxes, capital costs and risks, which also affect entrepreneurial activity differently. For example, Strebulaev and Yang examined US public nonfinancial corporations and concluded that zero or low-leverage corporations are more profitable compared with high-leveraged corporations.Reference Strebulaev and Yang15
Thus, in order to examine the effect of corporate debt levels on economic growth, this paper contributes empirically in exploring the impact of debt-oriented capital structure on the economic growth for a sample of 16 OECD countries in the period 1995–2014, based on the availability of data. The panel unit root test results indicate the data is a mixture of stationary and first-difference stationary series, therefore, the panel ARDL estimation technique is applied to explore the impact of high corporate debt levels on economic growth. Furthermore, the relationship is estimated using three specifications, such as mean-group (MG), pooled-mean group (PMG) and the dynamic-Fixed effect (DFE) specifications. The results reveal that a 1% increase of growth in the leverage of non-financial and financial corporations decreases economic growth by 0.1% and 0.02% respectively.
The rest of the paper is organized as follows. The next section discusses the reasons for high corporate leverage and the linkage between corporate leverage and economic growth. The third section describes data and outlines the methodology. The fourth section discusses the estimation results. Finally, the fifth section provides a conclusion.
Debt-oriented Capital Structure and Economic Growth
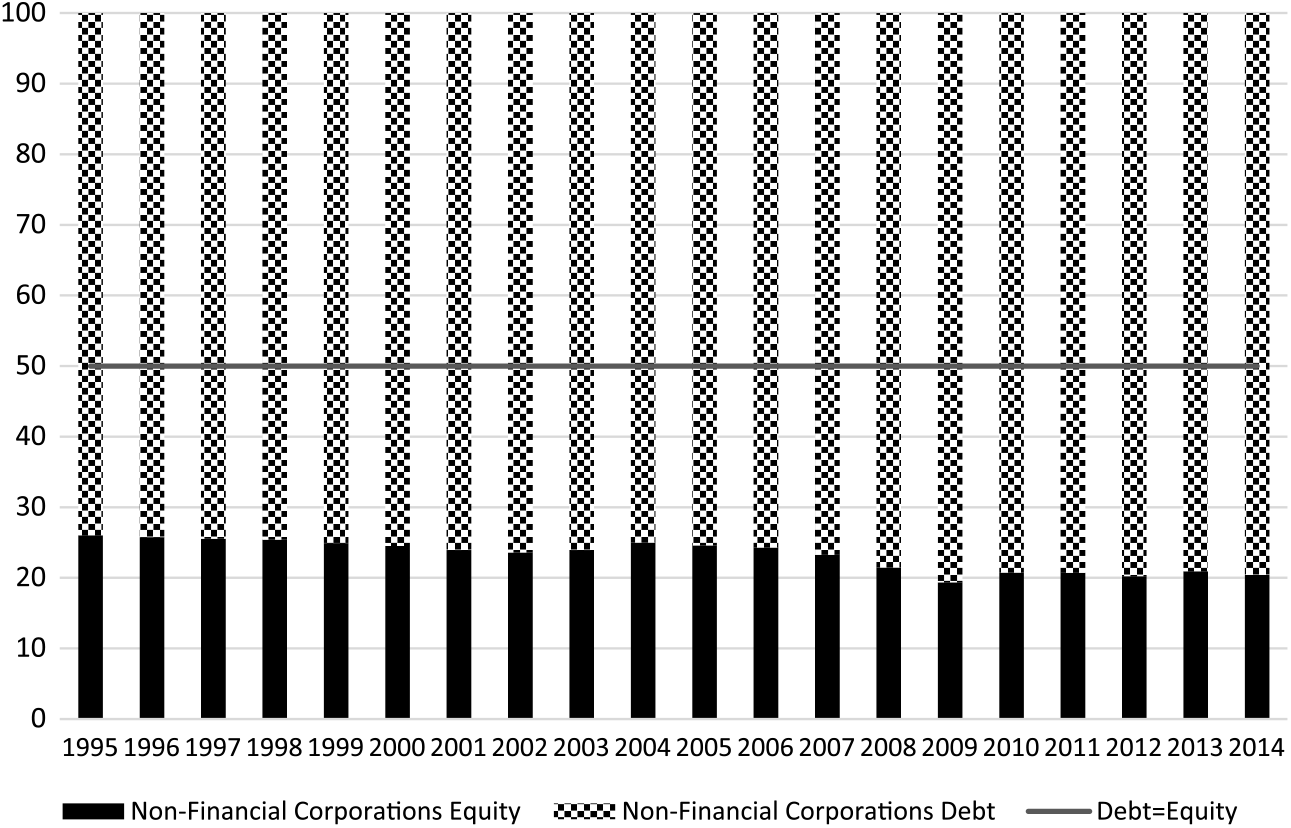
According to the irrelevance theorem of Modigliani–Miller, the value of a corporation should be independent of the fact of whether the corporation chooses debt or equity. However, due to debt-bias corporate tax regulations, corporations save taxes by preferring debt to equity and therefore increase the value of the corporation.Reference De Mooij1, Reference Fatica, Hemmelgarn and Nicodème4 As shown in Figures 2 and 3, the capital structure of financial and non-financial corporations in OECD countries is highly debt-oriented. Yet, there is almost a consensus that high corporate debt levels are a threat to financial stability.16, 17 Moreover, the highly debt-oriented capital structure shrinks government revenue. The high risk associated with debt not only threatens financial stability but also affects entrepreneurial activity.
Capital structure composition in OECD non-financial corporations.

Capital structure composition in OECD financial corporations.

Debt-oriented capital structure affects economic growth in both pre- and post-realization of capital structure. In the pre-realization scenario, each dollar that a corporation intends to raise as debt, reduces the corporation’s access to funds due to credit rationing.Reference Stiglitz18, Reference Stiglitz19 According to Gale and Hellwig, and Townsend, the investment level in debt-financing is always lower than in equity-financing due to agency problems.Reference Gale and Hellwig20, Reference Townsend21 This is because, in the presence of asymmetric information and moral hazard, lenders or banks stop lending to corporations even if corporations are willing to pay high returns to bondholders. Thus, debt-financing decreases investment level and thereby economic growth.
In the case of post-realization of capital structure, according to Myers, debt-oriented capital structure affects the corporation’s investment behaviour adversely, which ultimately affects economic growth.Reference Myers22 For instance, if debt matures after growth opportunities are observed, bondholders expect high returns in future investments with the shareholders. In order to safeguard the shareholders, corporations fail to utilize investment opportunities, which obviously affects economic growth.
Moreover, according to Diamond, borrowers are either good, and hence can be relied upon, or bad, in which case lenders try to avoid them.Reference Diamond23 The risk on debt decelerates economic growth because good borrowers that have the ability to execute high yield projects forego the opportunities, as they do not want to compromise their reputation. Bad borrowers, on the contrary, affect economic growth by choosing projects that promise high yields but that are more likely to fail.
Data and Methodology
This research employs panel data for 16 OECD countries – Austria, Belgium, the Czech Republic, Denmark, Estonia, Finland, France, Germany, Greece, Italy, the Netherlands, Norway, Spain, Sweden, the United Kingdom and the United States – for the period 1995–2014. The selection of countries is based on the availability of data, particularly the key variable of debt–equity ratio in financial and non-financial corporations. The data for debt–equity ratio in financial and non-financial corporations, exchange rates, and fiscal variables such as government expenditures and revenues, are obtained from the OECD online library.24 The data for capital stocks, average depreciation rates, population growth, average hours worked by persons employed, and employment are from the Penn World Tables.Reference Feenstra, Inklaar and Timmer25 Finally, the data for inflation, education, and savings are obtained from the World Development Indicators.26 The summary statistics of the variables are given as Appendices.
Financial corporations include all the private and public corporations that are engaged in financial activities, i.e. central banks, monetary financial institutions, and other financial intermediaries, except insurance and pension funds. Non-financial corporations include all private and public enterprises that produce goods and/or provide non-financial services to the market. The debt-to-equity ratio of financial corporations refers to the ratio of financial assets and debt equity ratio. A debt-equity ratio of 5 implies that debt is five times larger than equity.
Stylized Fact
As shown in Figures 4 and 5, per capita GDP growth is negatively correlated with debt-equity ratio in financial and non-financial corporations. According to preliminary investigations based on an OLS fitted line, the coefficients of non-financial and financial corporations’ debt–equity ratio are –1.120 and –0.23. These values are obviously overestimated in the absence of control variables.
Average leverage in non-financial corporations and per capita GDP growth.

Average leverage in OECD financial corporations and per capita GDP growth.

Baseline Model
In modern economic growth theories, economic growth is considered as the outcome of various endogenous factors that vary, from the behaviour of rational optimizing agents to technology, and macroeconomic policies.Reference Turnovsky27 For instance, the role of entrepreneurs, investments in research and development, fiscal policy, tax structure and stable government revenues affect economic growth. As high corporate debt levels are due to debt-biased corporate tax systems, corporate debt levels are supposed to affect economic growth endogenously.
For this purpose, without loss of generality, the Cobb-Douglas production function can be written as:
 $$Y\left( t \right) = A\left( t \right)K\left( t \right)^\alpha H\left( t \right)^{1 - \alpha } $$
(1)
where Y is the output, K is the capital, A is the technological advancement, H is the labour and α and 1 − α are the capital and labor productivities respectively. Following Lee and Gordon, the production function in equation (1) can be modified for the growth in the economy’s output as:Reference Lee and Gordon28
 $${{\dot y} \over y} = \dot a + \alpha \left( {{\dot k} \over k} \right) + \left( {1 - \alpha } \right)\left( {{\dot h} \over h} \right) + \dot \eta $$
(2)
where
 $\dot y/y$
is the growth rate per unit of time in the output; mathematically,
 ${{\dot y} \over y} = {\rm{}}{{{\rm{d}}Y\left( t \right)/{\rm{d}}t} \over {Y\left( t \right)}}$
. Likewise,
 ${{\dot k} \over k} = {\rm{}}{{{\rm{d}}K\left( t \right)/{\rm{d}}t} \over {K\left( t \right)}}$
and
 ${{\dot h} \over h} = {\rm{}}{{{\rm{d}}H\left( t \right)/{\rm{d}}t} \over {H\left( t \right)}}$
are the growth rate per unit of time in capital and labor respectively,
 $\dot a = {\rm{}}{{{\rm{d}}A\left( t \right)} \over {{\rm{d}}t}}$
is the change in technology over time, and
 $\dot \eta $
is the residual term.
Lee and Gordon state that any positive spillovers of productivity on economic growth would appear in the term ȧ.Reference Lee and Gordon28 Likewise, any spillovers of debt-bias corporate tax systems should appear through ȧ. For instance, any change in the tax system that affects the corporation’s financing choice affects economic growth. This is because any level of the debt–equity ratio or capital structure is associated not only with the tax benefits but also with the government revenue and investment level. Equation (2) requires to be controlled for capital stock, savings, education, and average hours worked by the labour force.Reference Beck, Levine and Loayza10, Reference Lee and Gordon28 In addition, government budget deficits are added in equation (2) for capturing the potential impact of fiscal variables. With the above-mentioned outline, the specification for a panel data analysis of economic growth can be written as:
 $$Growth_{it} = {\rm{}}\beta _{it} Leverage + \gamma _{it} Deficits + \delta _{it} X_{it} + \mu _i + e_t + \varepsilon _{it} $$
(3)
where Growthit refers to growth in GDP Per Capita, leverage is corporate debt levels or debt equity ratio. Deficits represents government deficits with and without interest payments, Xit is the set of all the macroeconomic factors, μi is the country-specific effects, et represents the time-specific effects, εit is the error term that varies with time, and finally, i and t denote the country and year, respectively.
The government budget deficits are important for two reasons, first, because the effect of budget deficits on economic growth is an inevitable factor in tax policy. Second, consistent with the objective of this study, a decrease in government tax revenue due to high corporate debt levels increases government budget deficits. The cash deficit/surplus ratio is added in order to capture the government size. The cash deficit/surplus ratios both with interest payments and without interest payments in the model not only account for the government size but also incorporate the government’s decisions, which are taken to keep the debt levels sustainable. Moreover, the government cash deficit/surplus ratio determines the fiscal sustainability, which is important for economic growth.Reference Barro29 The model is controlled for factors such as inflation, education, average hours worked by the labour force, net capital stock growth, savings, and population growth.
Finally, for the robustness of results, multiple models with various sets of variables are estimated. This is because owing to the small N (number of countries) and T (number of years), the data could not be divided into two or more periods nor could the countries be divided with respect to income or other characteristics. We use multiple models with various sets of variables including population growth, savings, net capital stock growth, government deficits, labour force education, inflation, and working hours for the robustness of the results.
Preliminary Tests
The preliminary step in estimating equity (equation (3)) is to test for the unit root. The panel unit root tests play an important role not only in avoiding spurious regression due to the existence of a unit root in the series but also in devising an appropriate technique for the problem at hand. We selected panel unit root tests of the Breitung testReference Breitung30 based on their highest power as well as the size that is close to normal size,Reference Hlouskova and Wagner31 whereas, according to Maddala and Wu,Reference Maddala and Wu32 for balanced panels, the Im-Pesaran-Shin test (IPS)Reference Im, Pesaran and Shin33 is appropriate.
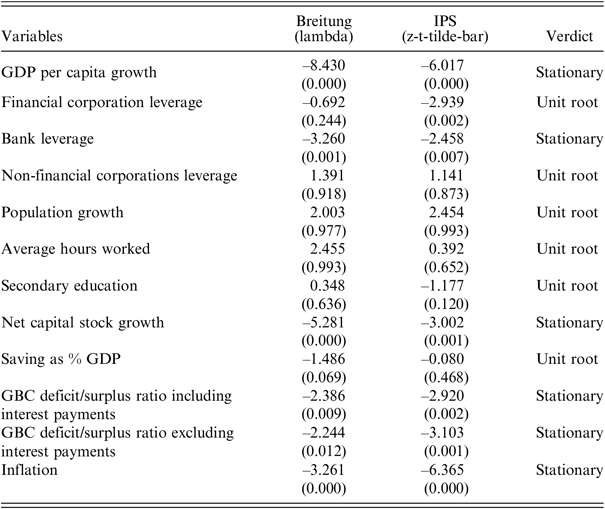
Table 1 provides the Breitung and IPS tests results. The results for the Breitung test in column 2 show that all series are stationary except for the financial corporation leverage, non-financial corporation leverage, population growth, average hours worked by the labour force, and secondary education. The IPS tests in column 3 reveal that all series are stationary in levels, except for non-financial corporation leverage, population growth, average hours worked in the labour force, secondary education and savings. This indicates that the unit root tests might have different results.
Panel unit root test results.

() parenthesis contain p-values, IPS represents Im-Pesaran-Shin panel unit root test.
As can be observed in column 4, the data are a mixture of stationary I(0) and first-differenced stationary I(1) variables. For instance, GDP per capita growth, bank debt-equity ratio, net capital stock growth, deficit/surplus ratio including interest payment, deficit/surplus ratio excluding interest payments and inflation are stationary in level. The rest of the variables, including financial corporation leverage, non-financial corporations leverage, population growth, average hours worked, secondary education and saving as a percentage of GDP are non-stationary in levels. The panel ARDL estimation technique is appropriate for data that contain stationary and first-difference stationary series.Reference Im, Pesaran and Shin33, Reference Im, Pesaran and Shin34 The panel ARDL cannot be applied to second-difference series I(2). As shown in Table 1, all the series are either stationary at level or stationary at first difference. The two tests of Breitung and IPS were applied to all the series that were non-stationary at level, which confirmed that the series are stationary at first difference. To save space, the results of the panel unit root tests applied at first difference are omitted.
Model Specification
Without loss of generality, following Blackburne and Frank, an ARDL (p, q1, …, qk) dynamic panel specification can be written in the following formReference Blackburne and Frank35:
 $$y_{it} = \mathop \sum \limits_{j = 1}^p \lambda _{ij} y_{i,t - j} + \mathop \sum \limits_{j = 0}^q \delta _{ij}^{\prime} X_{i,t - j} + \mu_i + \epsilon_{it} $$
(4)
where i is the number of countries, t is the number years, Xi, t is the k × 1 vector of explanatory variables,
 $\delta _{ij}^{\prime} $
is the k × 1 vector of coefficients, λij are the scalars, and μi is the country specific effect, p and q are the lags of dependent and independent variables respectively. To incorporate short-run disequilibrium, the specification in equation (4) can be reparametrized into an error correction equation as:
 $$\Delta y_{it} = \phi _i \left( {y_{i,t - 1} - \theta _i^{\prime} X_{it} } \right) + \mathop \sum \limits_{j = 1}^{p - 1} \lambda _{ij}^{\rm{*}} \Delta y_{i,t - j} + \mathop \sum \limits_{j = 0}^q \delta _{ij}^{{\prime*}} \Delta X_{i,t - j} + \mu_i + \epsilon_{it} $$
(5)
where,
 $ \phi _i = \bigg(1 - \mathop \sum \limits_{j = 1}^p \lambda _{ij} \bigg),\,\theta _i = {{\mathop \sum \nolimits_{j = 0}^q \delta _{ij} } \over {\big(1 - \mathop \sum \nolimits_k \lambda _{ik} \big)}},{\rm{}}\lambda _{ij}^{\rm{*}} = \, - \,\mathop \sum \limits_{m = j + 1}^p \lambda _{im} ,\,j = 1,2, \ldots ,p - 1$
 $$\delta _{ij}^{{\prime*}} = \mathop \sum \limits_{m = j + 1}^p \delta _{im} ,\,j = 1,2, \ldots , q - 1$$.
In the above error correction model, the parameter of interest is Φ. If Φ = 0, it implies that there is no long-run relationship. If the value for Φ is negative, statistically significant and less than 1 in absolute terms, it implies that there exists a relationship between economic growth and corporate debt levels. However,
 $\left| \phi \right| \ge \left| { - 1} \right|$
implies that there is overcorrection, which is meaningless. The models given in equation (4) or equation (5) can be estimated either as Pooled Mean Group (PMG), Mean-Grouped (MG), and Dynamic Fixed Effects (DFE) models. The mean-group (MG) estimates the model for each country separately and then simply calculates an arithmetic average of the coefficients.Reference Pesaran and Smith
36
As the model is estimated for each country separately, the intercepts, slope coefficients, and error variances are allowed to differ across countries. The dynamic fixed effect approach on the other hand pools the data and only allows the intercept to vary across countries by introducing dummies for each country. Finally, the pooled mean group rests somewhere in between the MG and DFE because it combines the pooling of DFE and averaging of MG.Reference Im, Pesaran and Shin
33
,
Reference Im, Pesaran and Shin
34
PMG allows the intercept, short-run coefficients, and error variances to differ across the groups by mimicking the MG and restricts the long-run coefficients to remain constant across countries, as in the case of DFE.
The PMG estimator is efficient and consistent because it restricts long-run elasticities to be the same across countries; however, it is prone to a problem of heterogeneous slope parameters across countries. In this case, PMG becomes inconsistent whereas MG remains consistent whether the slope parameter is heterogeneous or otherwise. The consistency of PMG regarding homogeneity can be checked by the Hausman test.Reference Hausman 37 The null hypothesis of the Hausman test states that both MG and PMG are consistent but only one of them is efficient. Given that PMG is consistent and efficient provided that the slope parameters for countries are homogeneous, the acceptance of a null hypothesis implies that PMG is consistent and efficient. DFE, on the other hand, is prone to simultaneous equation bias or endogeneity problems. Again, using the Hausman test, the extent of endogeneity problems can be checked. If the endogeneity problem is nominal, DFE is preferred over MG for its efficiency.
Results and Discussion
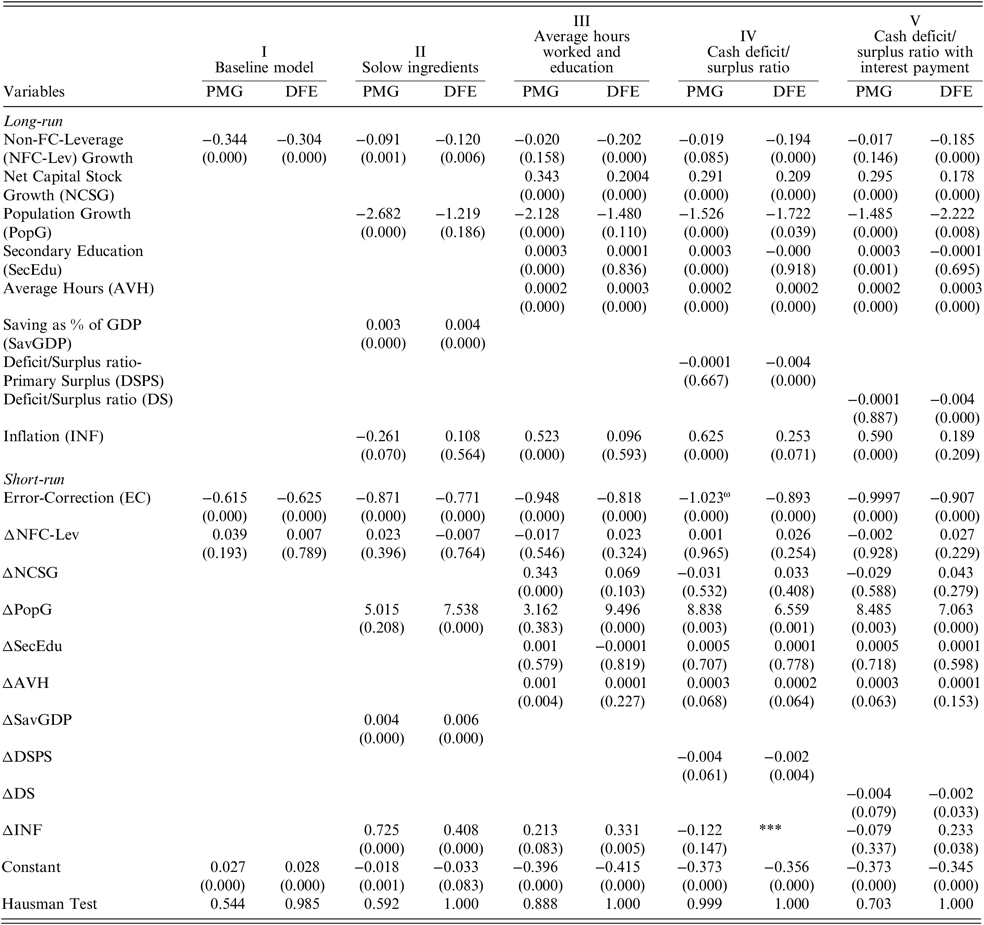
Table 2 shows the results for the relationship between financial corporation leverage and economic growth. Column I presents the effect of corporate leverage in non-financial corporations on economic growth estimated by PMG and DFE. The models are estimated by PMG, DFE and MG. Furthermore, the Hausman model specification tests are applied that compare MG with both PMG and DFE.Reference Hausman 37 In order to save space, only the Hausman test preferred specification is reported. The Hausman test consistently prefers PMG to MG, i.e. countries are considered as of homogeneous characteristics. The results are rational because countries in the OECD not only have common economic characteristics but they are also obliged to help each other in times of trouble. For instance, a common currency such as the euro lowers trade costs, and enhances free mobility of labour and capital. Fiscal and monetary stability help is available to countries that face problems. For instance, Greece was helped by other OECD countries during fiscal problems; otherwise it might have faced severe problems.Reference Athanassiou 38
Non-financial corporations’ debt levels and economic growth.

Model (I): GDP per capita growth = β 0 + β 1 Non-Financial Corporation leverage. Non-Financial Corporation leverage is the debt-equity ratio in the OECD Banks, PMG stands for Pooled Mean Group, DFE is Dynamic Fixed Estimation. Model (II): GDP per capital growth = β 0 + β 1 Non-Financial Corporation leverage + β 2 Population Growth + β 3 Savings + β 4 Inflation. Model (III): GDP per capital growth = β 0 + β 1 Non-Financial Corporation leverage + β 2 Net Capital Stock + β 3 Population Growth + β 4 Secondary Education + β 5 Average Hours + β 6 Inflation. Model (IV): GDP per capital growth = β 0 + β 1 Non-Financial Corporation leverage + β 2 Net Capital Stock + β 3 Population Growth + β 4 Secondary Education + β 5 Average Hours + β 6 Deficit/Surplus Ratio + β 7 Inflation. Model (V): GDP per capital growth = β 0 + β 1 Non-Financial Corporation leverage + β 2 Net Capital Stock + β 3 Population Growth + β 4 Secondary Education + β 5 Average Hours + β 6 Deficit/Surplus Ratio* + β 7 Inflation, the Deficit/Surplus Ratio is without primary surplus.
The results in column I for PMG and DFE further show that an increase of 1% in non-financial corporation leverage decreases economic growth by 0.34% and 0.30% according to PMG and DFE specifications respectively. The error correction parameters for PMG and DFE in column 2 and 3 of –0.615 and –0.625 are negative and significant, which implies that there exists a relationship between non-financial corporate leverage and economic growth.
In column II, the model includes the Solow growth model ingredients, which are population growth and savings. Again, the results of PMG and DFE specifications in the first row indicate that a 1% increase in financial corporation’ leverage decreases economic growth by 0.09% and 0.12% respectively. Population growth affects economic growth negatively (i.e. –2.682 and –1.219) in Column II, whereas the opposite results for savings (i.e. 0.003 and 0.004) are observed, as predicted.
In column III, the model includes the secondary education and the average hours worked. Moreover, instead of savings, the net capital stock growth is added for the sake of robustness, although the results in terms of directions remain the same, with saving in the model. The results again indicate that the leverage in non-financial corporations affects economic growth negatively, i.e. –0.020 and –0.202.
Finally, columns IV and V contain the models with government deficit/surplus cash ratio with and without interest payments. The results are the same as reported in columns I, II and III, which is to say that the leverage in non-financial corporations affects economic growth negatively. Column IV shows that for PMG, the error-correction parameter is encountered to be less than –1 (–1.023), which implies a senseless relationship. However, the error-correction parameter for DFE is significant, negative and greater than –1 (–0.893), which indicates the presence of a relationship between non-financial corporate leverage and economic growth.
In summary, all five models show that population growth, savings, net capital stock growth, average hours worked in the labour force and levels of education affect economic growth, as was to be expected. Thus, the increase in corporate debt levels in non-financial corporations reduces economic growth. As shown in Table 2, inflation is inconclusive in all models. In a few cases, inflation seems to be affecting economic growth positively but again the contradiction prevails between the specification PMG and DFE, and in the majority of the cases inflation is insignificant. In support of this finding, Bruno and Easterly surveyed the literature from the 1960 s to the 1980 s and concluded that there exists controversy regarding the relationship between inflation and economic growth.Reference Bruno and Easterly 39
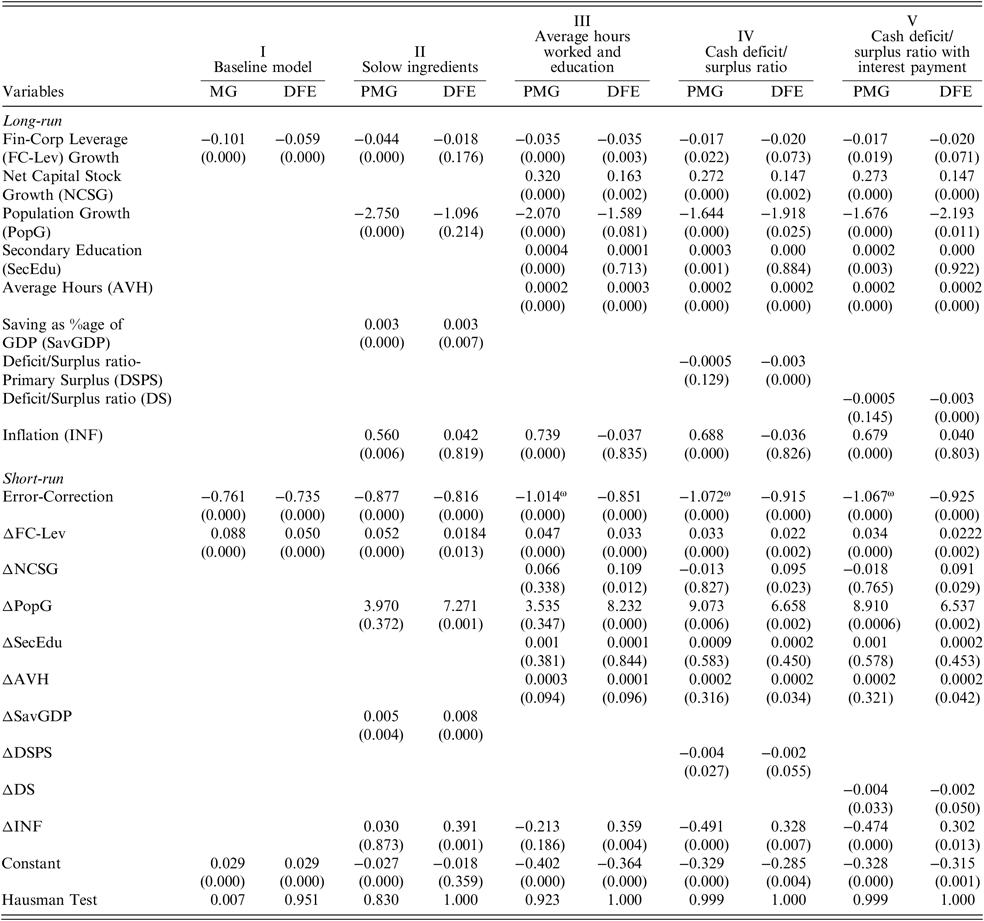
Table 3 shows the result of the effect of corporate leverage in financial corporations on economic growth. Again, the coefficients for corporate leverage as shown in the first row for all the models are statistically significant and affect economic growth negatively. The magnitude for the leverage in a financial corporation is, however, less than that of the non-financial corporations in Table 2, which might be due to the larger volume of non-financial corporations as well as the direct effect of non-financial corporations on economic growth. A problem of over-correction was encountered when the error correction parameter is less than –1, which is duly identified by the ω. The over-correction is encountered in PMG only while the DFE is free of this problem. Therefore, although an overcorrection is identified in PMG, the DFE still validates the results to be meaningful.
Financial corporations’ debt levels and economic growth.

Model (I): GDP per capita growth = β 0 + β 1 Financial Corporation leverage. Financial Corporation leverage is the debt–equity ratio in the OECD Banks, PMG stands for Pooled Mean Group, DFE is Dynamic Fixed Estimation. Model (II): GDP per capital growth = β 0 + β 1 Financial Corporation leverage + β 2 Population Growth + β 3 Savings + β 4 Inflation. Model (III): GDP per capital growth = β 0 + β 1 Financial Corporation leverage + β 2 Net Capital Stock + β 3 Population Growth + β 4 Secondary Education + β 5 Average Hours + β 6 Inflation. Model (IV): GDP per capital growth = β 0 + β 1 Financial Corporation leverage + β2 Net Capital Stock + β 3 Population Growth + β 4 Secondary Education + β 5 Average Hours + β 6 Deficit/Surplus Ratio + β 7 Inflation. Model (V): GDP per capital growth = β 0 + β 1 Financial Corporation leverage + β 2 Net Capital Stock + β 3 Population Growth + β 4 Secondary Education + β 5 Average Hours + β 6 Deficit/Surplus Ratio* + β 7 Inflation, the Deficit/Surplus Ratio is without primary surplus, z1: edusec 2.29e-06 (0.993), z2: 3.67e-06 (0.987)
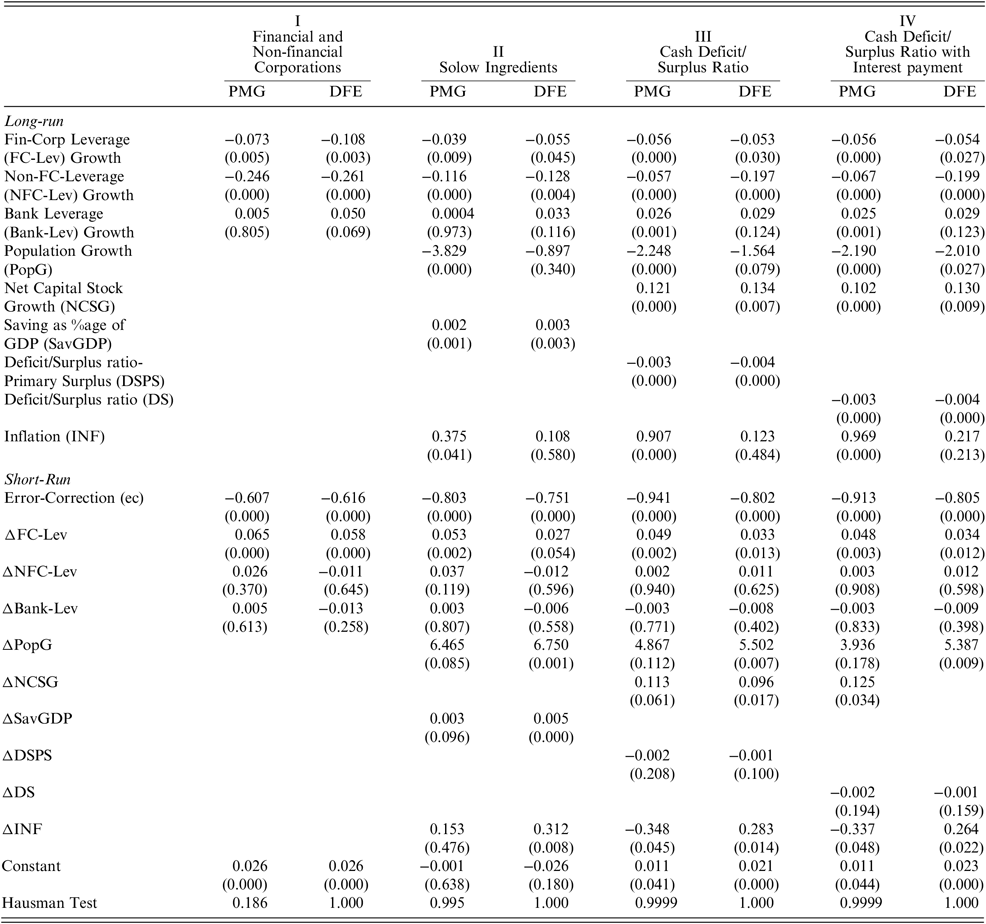
Finally, Table 4 presents the effect of corporate leverage in financial corporations and non-financial corporations on economic growth by estimating four models. Column I presents the model with the three sectors of financial corporations, non-financial corporations, and banks. Column II contains the results for the three sectors along with the Solow ingredients of population growth and savings. Finally, Columns III and IV add the government deficit/surplus ratio without and with interest payments respectively. The results suggest that leverage in non-financial and financial corporations affects economic growth negatively as shown in the first and second rows for all four models. As discussed, the impact of financial corporations is lower than that of non-financial corporations. This is because the financial corporations hold higher equity than non-financial corporations, as shown in the figures in the Appendices. Population growth, and government deficit/surplus ratio (with and without interest payments) affect economic growth negatively, savings and net capital stock growth affect economic growth positively, which is consistent with the results presented in Tables 2 and 3. The error correction parameter is statistically significant, negative and greater than –1, which implies there exists a relationship between corporate leverage in financial and non-financial corporations and economic growth.
Non-financial and financial corporations’ debt levels and economic growth.

Model (I): GDP per capita growth = β 0 + β 1 Financial Corporation leverage + β 2 Non-Financial Corporation Leverage + β 3 Bank Leverage. PMG stands for Pooled Mean Group, DFE is Dynamic Fixed Estimation. Model (II): GDP per capita growth = β 0 + β 1 Financial Corporation leverage + β 2 Non-Financial Corporation Leverage + β 3 Bank Leverage + β 4 Population Growth + β 5 Savings + β 6 Inflation. Model (III): GDP per capita growth = β 0 + β 1 Financial Corporation leverage + β 2 Non-Financial Corporation Leverage + β 3 Bank Leverage + β 4 Population Growth + β 5 Net Capital Stock Growth + β 6 Deficit/Surplus Ratio including interest payments + β 7 Inflation. Model (IV): GDP per capita growth = β 0 + β 1 Financial Corporation leverage + β 2 Non-Financial Corporation Leverage + β 3 Bank Leverage + β 4 Population Growth + β 5 Net Capital Stock Growth + β 6 Deficit/Surplus Ratio excluding interest payments + β 7 Inflation, the Deficit/Surplus Ratio is without primary surplus
Conclusion
This paper explores an overlooked relationship between debt-oriented capital structure and economic growth for OECD financial and non-financial corporations by using the panel ARDL technique. Using the OECD library dataset, we find that over the period 1995–2014, on average, a 1% increase in non-financial and financial corporation leverage decelerates economic growth by 0.1 and 0.02 percentage points respectively. The impact of non-financial corporations on economic growth is higher than that of financial corporations. This is due to two reasons. First, financial corporations hold higher equity and, second, non-financial corporations from the real sector have a direct relationship with economic growth.
The results are alarming and are an addition to the ongoing financial stability debate. The results suggest rigorous policy reforms that include an equal treatment of debt and equity. This can help in lowering the macroeconomic repercussion of corporate leverage.
Acknowledgement
Abdul-Majid and Syed Munawar Shah appreciate the research support from Universiti Kebangsaan Malaysia Grant GUP/2016/002.
Appendices

Share of Equity and Debt in the OECD Financial and Non-Financial Corporations


About the Authors
Syed Munawar Shah is an Associate Professor and faculty coordinator (i.e. Deputy Dean) in the Balochistan University of Information Technology, Engineering and Management Sciences (BUITEMS), Quetta. He is reviewer for several journals and his main research interests focus on financial economics, fiscal policy, corporate tax structure, and contract theory.
Mariani Abdul-Majid is an Associate Professor in the National University of Malaysia (Universiti Kebangsaan Malaysia, UKM), where she is the Head of the Statistics and Econometrics Program. Her interests focus on debt contraction and the efficiency of the banking sector, particularly in Malaysia. She heads a research project sponsored by the National University of Malaysia (UKM) for the analysis of debt and equity contracting through social lab experiments. She has successfully completed research projects on banking and efficiency.
Zulkefly Abdul Karim is an Associate Professor in the National University of Malaysia (Universiti Kebangsaan Malaysia, UKM). His research focuses on monetary policy, fiscal policy, financial economics, applied econometrics, International Finance, and economic growth. He organized The Malaysia National Economic Conference (PERKEM) in the Faculty of Economics and Management at UKM.