Introduction
Although schizophrenia (SZ) and bipolar disorder (BD) have long been viewed as etiologically distinct from each other, recent genetic epidemiologic and association studies support a substantial degree of genetic overlap between them (Lichtenstein et al. Reference Lichtenstein, Yip, Pawitan, Cannon, Sullivan and Hultman2009). Major depressive disorder (MDD) also shares substantial genetic variance with BD, but to a lesser degree than the latter does with SZ (McGuffin et al. Reference McGuffin, Rijsdijk, Andrew, Sham, Katz and Cardno2003). As the vast majority of common and rare genetic variants for these psychiatric phenotypes remain to be discovered, one approach to delineating their etiologic overlap/non-overlap is by examining potential endophenotypic traits that may be shared among them. Endophenotypes are ‘risk traits’ that lie on the pathways between genetic predisposition and psychiatric syndromes (Gottesman & Gould, Reference Gottesman and Gould2003). A critical feature of endophenotypes is that they are expected to be deviant to some degree among non-affected first-degree relatives of individuals affected with the syndromal phenotypes (Cannon & Keller, Reference Cannon and Keller2006). An endophenotypic trait shared between two disorders due to shared genetic mechanisms would be expected to be deviant in the first-degree relatives of probands with each disorder; alternatively, the trait could be shared among individuals affected with clinical diagnoses but not among those at genetic risk, indicating an area of phenotypic, rather than endophenotypic, overlap.
Impulsivity is a complex multidimensional trait, components of which have been shown to be stable and trait-like (e.g. Congdon & Canli, Reference Congdon and Canli2008), heritable (e.g. Pedersen et al. Reference Pedersen, Plomin, McClearn and Friberg1988), associated with real-world negative outcomes such as poor decision-making, suicide, and aggression (e.g. Moeller et al. Reference Moeller, Barratt, Dougherty, Schmitz and Swann2001) and to varying degrees characteristic of patients with BD, SZ, and MDD. Though the architecture of impulsivity has been construed in several ways, distinct dimensions frequently measured include attentional, motor, and non-planning impulsiveness (Patton & Stanford, Reference Patton and Stanford1995), and sensation seeking (Whiteside & Lynam, Reference Whiteside and Lynam2001), which may be considered separate as it has a different developmental trajectory from other forms of impulsivity (Galvan et al. Reference Galvan, Hare, Parra, Penn, Voss, Glover and Casey2006; Steinberg et al. Reference Steinberg, Albert, Cauffman, Banich, Graham and Woolard2008) and different associated neural pathways (Dawe et al. Reference Dawe, Gullo and Loxton2004). Motor response inhibition tasks are considered behavioral measures of impulsivity (Logan et al. Reference Logan, Cowan and Davis1984).
Elevated self-reported impulsivity and impaired response inhibition have been associated with SZ (e.g. Enticott et al. Reference Enticott, Ogloff and Bradshaw2008), although some studies have not found this elevation in self-reported impulsivity (e.g. Reddy et al. Reference Reddy, Lee, Davis, Altshuler, Glahn, Miklowitz and Green2014). Impulsivity has also been associated with BD and MDD. It has been shown to be elevated compared with healthy controls (HCs) both during and between manic episodes (Moeller et al. Reference Moeller, Barratt, Dougherty, Schmitz and Swann2001), as well as in depressed BD, euthymic BD, and MDD unipolar patients (Peluso et al. Reference Peluso, Hatch, Glahn, Monkul, Sanches, Najt, Bowden, Barratt and Soares2007). No published study includes a test of whether self-reported impulsivity is elevated in family members of individuals with SZ, but cognitive abilities primarily dependent on prefrontal cortical regions are impaired in co-twins of SZ patients (Cannon et al. Reference Cannon, Huttunen, Lonnqvist, Tuulio-Henriksson, Pirkola, Glahn, Finkelstein, Hietanen, Kaprio and Koskenvuo2000), and response inhibition has been found to be impaired in first-degree biological relatives of these patients, although the deficit was accounted for by a generalized cognitive deficit (Ethridge et al. Reference Ethridge, Soilleux, Nakonezny, Reilly, Hill, Keefe, Gershon, Pearlson, Tamminga and Keshavan2014). Response inhibition and executive functioning tasks have been shown in some studies to be impaired in relatives of individuals with BD relative to HCs (Bora et al. Reference Bora, Yucel and Pantelis2009), although Ethridge et al. (Reference Ethridge, Soilleux, Nakonezny, Reilly, Hill, Keefe, Gershon, Pearlson, Tamminga and Keshavan2014) found no response inhibition deficit in first-degree relatives. Self-reported impulsivity is also elevated in siblings of BD probands (Lombardo et al. Reference Lombardo, Bearden, Barrett, Brumbaugh, Pittman, Frangou and Glahn2012). Impulsive aggression has also been named a potential endophenotype for suicidal behavior (Mann et al. Reference Mann, Arango, Avenevoli, Brent, Champagne, Clayton, Currier, Dougherty, Haghighi and Hodge2009; McGirr et al. Reference McGirr, Alda, Séguin, Cabot, Lesage and Turecki2009), but impulsivity has not been considered an endophenotype for MDD more broadly.
The term ‘impulsivity’ has ultimately come to comprise several behavioral tendencies. All of these behaviors share that they are more satisfying or easy to do in the present moment than helpful for future goals, but this does not indicate that they all share mechanisms. In fact, correlations among them and developmental trajectories suggest that they are in some cases unrelated to each other mechanistically or in other cases moderately related but best considered as distinct dimensions (Gerbing et al. Reference Gerbing, Ahadi and Patton1987; Whiteside & Lynam, Reference Whiteside and Lynam2001; Steinberg et al. Reference Steinberg, Albert, Cauffman, Banich, Graham and Woolard2008). The viability of impulsivity as an endophenotype of BD, SZ, or MDD has not yet been examined systematically across discrete dimensions of the impulsivity construct. Though these disorders are all related to elevated impulsivity broadly, the specific dimensions associated with each disorder may differ, and phenotypically shared dimensions may or may not reflect shared mechanisms across disorders.
The purpose of the present investigation was to determine whether specific dimensions of impulsivity are endophenotypic traits that can help to clarify genetic overlap across SZ, BP, and MDD. At the phenotypic level, we examine correlations among different facets of impulsivity as well as deviance on each facet among probands with these disorders. To test whether each facet may share genetic mechanisms with one or more disorders, we test the heritability of each facet and deviance on these facets in non-affected co-twins of probands with these disorders.
Method and materials
Subjects
Subjects were identified on a nationwide basis through the Sweden Twin Registry, managed by the Karolinska Institutet. Full recruitment procedures for the registry are described by Lichtenstein et al. (Reference Lichtenstein, Sullivan, Cnattingius, Gatz, Johansson, Carlstrom, Bjork, Svartengren, Wolk and Klareskog2006). For this study, twin pairs were eligible for inclusion if they were same sex, between the ages of 25 and 65 years, and born in Sweden between 1940 and 1985 (inclusive). The age range was intended to exclude individuals who were young enough that they had not yet developed an emerging disorder or old enough that they had already developed signs of cognitive decline or dementia. Other exclusion criteria were presence of a neurological disorder, history of significant head injury with loss of consciousness, mental retardation, history of substance dependence within 6 months of the screening interview, or inability to read or comprehend spoken and written Swedish.
To ascertain twin pairs with psychopathology, this set of twins was screened using hospital admission and discharge diagnosis information from the Swedish National Patient Registry. Screening for pairs comprising at least one twin with a diagnosis of SZ or BD yielded 562 potential probands (257 male, 305 female). Monozygotic (MZ) and dizygotic (DZ) pairs were recruited from all counties in Sweden and invited to Karolinska Institutet for diagnostic assessments and evaluation. Zygosity was determined for twin pairs using either DNA testing or a well-validated screening measure administered to parents and twins (Lichtenstein et al. Reference Lichtenstein, Sullivan, Cnattingius, Gatz, Johansson, Carlstrom, Bjork, Svartengren, Wolk and Klareskog2006), yielding 177 complete twin pairs with genetics and impulsivity data, of whom 77 were MZ, 97 were DZ, and three had undetermined zygosity. Sixty-two participants were prescribed antipsychotic medication at the time of participation, 44 were prescribed mood-stabilizing medication, and 71 were prescribed antidepressant medication. HC pairs were recruited to match proband pairs on age, sex, and zygosity. HCs were excluded if they had a family history of SZ or BD according to medical records or self-report.
Diagnostic interviewing was used in conjunction with hospital records to determine diagnosis for each individual, and twin pairs were then classified as controls, concordant, or discordant for SZ or BD, regardless of the initial recruitment classification. Individuals with schizoaffective disorder were included in the SZ group. Discordant co-twins of probands were also included regardless of a history of depression or other non-psychotic psychopathology. Individuals recruited as controls were also included regardless of history of depression, creating for our purposes another diagnostic group of participants with MDD, without a twin affected by SZ or BD.
Tests of sample representativeness
The studied probands were comparable to the remainder of the twin proband population in terms of sex (χ 2 1 = 0.10, p = 0.92), age at first hospital admission (t 211 = 0.38, p = 0.70), and number of hospital admissions (t 216 = 0.31, p = 0.75). However, we detected age effects in our sample and characterized these differences. Studied probands were younger than the remainder of the twin proband population (t 241 = 3.33, p = 0.001) by a mean difference of 4 years [proband participants (mean ± s.d.): 49.24 ± 10.44; proband non-participants: 53.65 ± 10.22], indicating that the probands who declined participation were older on average than the probands who agreed to participate.
Clinical evaluation
Final diagnostic status was determined by consensus using both clinical interviews and register data, which included diagnostic information dated from 1973 until the time of evaluation. Full medical records were requested from treating hospital in case of uncertainty and need for additional information. A clinical psychiatrist interviewed each participant using the Structured Clinical Interview for DSM-IV Axis I Disorders (SCID; First et al. Reference First, Spitzer, Gibbon and Williams1997b ) and the Structured Clinical Interview for DSM-IV Axis II Personality Disorders (SCID-II; First et al. Reference First, Gibbon, Spitzer, Williams and Benjamin1997a ). Current symptoms were also rated using the Hamilton Depression Rating Scale (HAMD; Hamilton, Reference Hamilton1960), Young Mania Rating Scale (YMRS; Young et al. Reference Young, Biggs, Ziegler and Meyer1978), Scale for Assessment of Negative Symptoms (SANS; Andreasen, Reference Andreasen1983), and Scale for Assessment of Positive Symptoms (SAPS; Andreasen, Reference Andreasen1984). Consensus diagnosis was determined by the clinical evaluation team at the Karolinska Institutet. All participants were clinically stable at the time of evaluation. No changes to medication regimen were made in relation to participation in the study.
Zygosity
Zygosity was determined for twin pairs using either DNA testing (n = 324) or a well-validated screening measure (n = 87) administered to parents and twins (Lichtenstein et al. Reference Lichtenstein, Sullivan, Cnattingius, Gatz, Johansson, Carlstrom, Bjork, Svartengren, Wolk and Klareskog2006), predominantly in cases where only one twin participated. Incomplete pairs were not included in heritability analyses. DNA zygosity test procedure modeled Hannelius et al. (Reference Hannelius, Gherman, Mäkelä, Lindstedt, Zucchelli, Lagerberg, Tybring, Kere and Lindgren2007) and used a highly multiplexed 47 single nucleotide polymorphism (SNP) panel, including a sex-specific marker. Likelihood of zygosity for each pair was calculated assuming a 1% genotyping error rate (false positives). These results were confirmed in genome-wide assays of over one million SNP-based identity-by-descent calculations (IBD; PIHAT in PLINK; Purcell et al. Reference Purcell, Neale, Todd-Brown, Thomas, Ferreira, Bender, Maller, Sklar, De Bakker and Daly2007).
Impulsivity measures
Barratt impulsiveness scale, version 11 (BIS-11; Patton & Stanford, Reference Patton and Stanford1995)
The BIS is a well-validated 30-item measure that assesses three sub-factors of impulsivity, derived through principal components analysis. The three factors are termed attentional, motor, and non-planning impulsiveness. Items were scored on a 4-point scale from 0 to 3, and possible total scores range from 0 to 90. Higher scores indicate higher levels of trait impulsivity. Twenty-two participants missed items included in the BIS attentional subscale, 30 in the BIS motor subscale, and 43 in the BIS non-planning subscale. These participants were excluded from analyses of the measures for which they missed items.
Zuckerman sensation-seeking scale, form II (SSS; Zuckerman, Reference Zuckerman and Izard1979a )
The SSS is a 34-item scale measure of the drive to seek experiences and feelings that are thrilling or adventurous, novel or complex, or potentially risky or disinhibited. Higher scores indicated higher levels of trait sensation-seeking propensity. The questions are formatted as forced choices between options that are sensation seeking and options that are more traditional, safe, boring, or mundane. Form II, which was employed in this study, is extremely similar to a more current version of the SSS (Zuckerman, Reference Zuckerman1979b ; Arnaut, Reference Arnaut2006). Fifty-four participants missed items included in the SSS. These participants were excluded from analyses of the SSS.
Stop signal task (SST; Logan, Reference Logan, Dagenbach and Carr1994)
The SST measures the ability to inhibit a response that has already been initiated. In this task, subjects perform a go task – pressing the left or right key – in response to a stimulus – a left- or right-pointing arrow. In 25% of the trials, a stop signal – a tone – follows the go signal, and participants are asked to stop the action they have initiated. The stop signal sounds after a variable stop signal delay (SSD), sampled from one of four staircases. The SST used was based on a version developed by Aron & Poldrack (Reference Aron and Poldrack2006). Longer time taken to stop a response is used to index reduced inhibitory control (Logan et al. Reference Logan, Schachar and Tannock1997). In total, 258 participants completed the SST, which included five blocks of 64 trials each.
Statistical analyses
Pearson bivariate correlations were used to test for the relationship among facets of impulsivity. Linear mixed model analyses were used to test for group differences (HC, SZ, BD, MDD and all co-twin groups) in impulsivity measures, using the Statistical Package for the Social Sciences (SPSS, 2010). This method was used because it allows for correlations and/or unequal variances between within-group error terms. To control for the correlations between co-twins, twin pair number was entered as a random variable in all analyses. Age and sex were entered in the model as covariates. Because we tested the overall main effects of five phenotypes, Bonferroni correction for multiple testing was used to set a p value threshold of 0.01 (0.05/5). When a group main effect was significant, we examined pairwise between-group comparisons. Possible group differences in mean age were examined using the same model as that used for the impulsivity phenotypes, and possible group differences in sex distribution were examined using a χ 2 test.
To ensure that our pattern of results would not be altered by the inclusion of participants who missed items, we performed multiple imputation using the Amelia package [Honaker et al. Reference Honaker, King and Blackwell2011 in R (R Core Team, 2015)] for all subjects who had missed no more than 10% of the items on each measure (resulting in nine individuals excluded for the BIS and 15 for the SSS). For missed items on a given measure, we included all additional items on the same measure in the imputation model. All scale items had at least one missing data point, but none had more than 5% missing data, so no items were excluded. We used Amelia's default setting to perform five imputations for each set of variables. We did not impute stop signal reaction times, as values were missing only for those who did not complete any portion of the SST. Unless otherwise indicated, imputing missing values did not change our pattern of results.
Heritability
Individual variation in impulsivity may arise as a product of genetic differences, environmental differences, or a combination of both. Comparing MZ twins, who share 100% of their genetic code, to DZ twins, who share on average 50%, as would any two siblings, makes it possible to partition variance of a trait into components attributed to genetics (the trait's ‘heritability’) and environment (Plomin et al. Reference Plomin, DeFries, Knopik and Neiderhiser2013). The heritable component of a trait could be further subdivided into that attributable to additive genetic influences and that attributable to non-additive or dominance genetic influences. Additive genetic variance emerges from the sum of allelic effects across multiple genes. Non-additive genetic variance emerges in the presence of interactions between alleles, either at the same locus (dominance effects) or different loci (epistatic effects). Non-genetic, or environmental, influences can be further subdivided into shared, or common, environmental influences and individual-specific, or unique, environmental influences. Common environmental influences include factors such as socioeconomic status and geographic location that hold for all members of a family (and equally so for members of twin pairs, whether MZ or DZ; Plomin, Reference Plomin2011). Unique influences are those that affect only one twin in a pair or affect twins differently from each other. Structural equation modeling techniques use covariance matrices from twin pairs as well as these expected ratios of correlations to determine the relative effects of additive genetics (A), dominant genetics (D), common environment (C), and unique environment (E). To test these models, we employed the matrix algebra program Mx (Neale et al. Reference Neale, Boker, Xie and Maes2003), which uses maximum likelihood estimation to fit models to covariance matrices.
We tested model fit using the χ 2 statistic, the root mean square error of approximation (RMSEA) and Akaike's Information Criterion (AIC). The AIC is a relative measure of fit (Akaike, Reference Akaike1987). Lower values indicate a better fit, and the score penalizes additional parameters and therefore favors parsimonious models (Kline, Reference Kline2011). Standardized maximum likelihood estimates were squared to yield proportions of phenotypic variance accounted for by each term.
Ethical standards
The authors assert that all procedures contributing to this work comply with the ethical standards of the relevant national and institutional committees on human experimentation and with the Helsinki Declaration of 1975, as revised in 2008. All measures were approved by the Regional Ethics Review Board, Stockholm, Sweden, as well as the Institutional Review Board of the University of California, Los Angeles.
Results
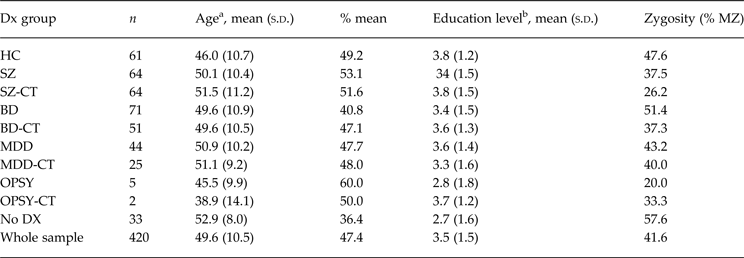
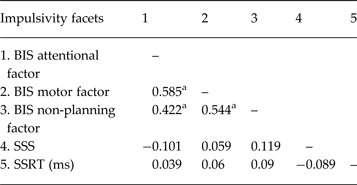
Demographic characteristics and mean impulsivity scores for all subfacets are listed in Table 1. Standardized means (adjusted for covariates) are used to display group differences in Fig. 1. Diagnostic groups did not differ significantly in mean age or sex distribution. Pearson correlations among included facets of impulsivity are reported in Table 2. BIS attentional, motor, and non-planning impulsivity were all significantly correlated with each other, with motor and attentional facets having the greatest correlation. Sensation seeking and SSRT were not correlated significantly with each other or with any of the BIS impulsivity factors.
Impulsivity dimensions by group (standardized means ± standard error).

Demographic characteristics and group means

MZ, Monozygotic; HC, healthy controls; SZ, schizophrenia; SZ-CT, schizophrenia co-twins; BD, bipolar disorder; BD-CT, bipolar disorder co-twins; MDD, major depressive disorder; MDD-CT, major depressive disorder co-twins; OSPY, other psychotic disorder; OSPY-CT, other psychotic disorder co-twins; No DX, no consensus diagnosis.
a Age at time of testing.
b Ranges from 0 = no schooling to 5 = university. Four people had missing data and 15 indicated ‘other’.
Pearson correlations among measures of impulsivity in entire sample

BIS, Barratt impulsiveness scale; SSS, Sensation-seeking scale; SSRT, stop signal reaction time.
a Correlation is significant at the 0.01 level (two-tailed).
Group differences
Linear mixed modeling with Bonferonni correction (controlling for the number of phenotypes examined) yielded a significant overall effect of diagnostic category on each facet of impulsivity measured. Subsequent analyses of simple effects revealed somewhat different patterns of group differences across facets.
BIS attentional
There was a main effect of group on attentional impulsivity (F 6,273.46 = 6.43, p < 0.001). HCs scored significantly lower than SZ (p < 0.001, d = 0.89), BD (p < 0.001, d = 1.05), and MDD (p = 0.001, d = 0.87) probands. Proband groups did not differ significantly from each other. Attentional impulsivity also showed significant familial association in SZ and MDD, and marginally in BD. SZ probands scored higher than for their co-twins (p = 0.009, d = 0.43), and co-twins scored higher than HCs (p = 0.018, d = 0.57). Scores did not differ between MDD probands and their co-twins, who scored higher than HCs (p = 0.022, d = 0.68). BD probands scored higher than their co-twins (p = 0.005, d = 0.60), who scored marginally higher than HCs (p = 0.063, d = 0.47).
BIS motor
There were significant main effects of group (F 6,273.57 = 5.68, p < 0.001), and age (p < 0.001), on motor impulsivity. HCs scored significantly lower than SZ (p < 0.001, d = 0.96), BD (p < 0.001, d = 0.94), and MDD (p < 0.001, d = 0.86) probands. Proband groups did not differ significantly from each other. Motor impulsivity showed familial association in BD and in MDD, and marginally in SZ. Scores did not differ between BD or MDD probands and their co-twins. In our imputed data, BPD probands differed significantly from their co-twins (p = 0.047). BD co-twins scored higher than HCs (p = 0.007, d = 0.65), as did MDD co-twins (p = 0.019, d = 0.71). SZ probands scored significantly higher than their co-twins (p = 0.002, d = 0.54), who scored marginally higher than HCs (p = 0.064, d = 0.46). The familial association was stronger in our imputed dataset, such that SZ co-twins scored significantly higher than HCs (p = 0.031). Motor impulsivity decreased with age.
BIS non-planning
There was a significant main effect of group on non-planning impulsivity (F 6,264.24 = 4.53, p < 0.001). HCs differed significantly from SZ (p < 0.001, d = 0.82), BD (p = 0.013, d = 0.84), and MDD (p < 0.001, d = 0.86) probands. Proband groups did not differ significantly from each other. Non-planning impulsivity showed familial association in all three disorders. Scores did not differ between SZ or MDD probands and their co-twins. SZ co-twins scored higher than HCs (p = 0.013, d = 0.54), as did MDD co-twins (p = 0.004, d = 0.82). BD probands scored higher than their co-twins (p = 0.049, d = 0.33), who scored higher than HCs (p = 0.011, d = 0.82).
Sensation seeking scale
There were significant main effects of group (F 6,232.17 = 4.23, p < 0.001), sex (p = 0.001, d = 0.45), and age (F 1,192.51 = 5.73, p = 0.018), on sensation seeking. SZ probands were significantly lower on sensation seeking than HCs (p = 0.001, d = 0.68), and than BD probands (p = 0.016, d = 0.46), and marginally lower than MDD probands (p = 0.102, d = 0.37). In our imputed data, MDD probands scored significantly lower than HCs (p = 0.047). BD and MDD probands did not differ significantly from HCs. Sensation seeking did not show familial association in any diagnostic group; no co-twins differed significantly from HCs. Males scored higher on sensation seeking than females, and sensation seeking decreased with age.
Stop signal reaction time
There were significant main effects of group (F 6,193.066 = 4.23, p = 0.004), mostly accounted for by longer SSRTs in SZ and BD probands, as well as age age (F 1,156.16 = 13.76, p < 0.001), on SSRT. SZ probands had significantly longer SSRTs than HCs (p = 0.010, d = 0.78), their co-twins (p = 0.004, d = 0.46), and MDD probands (p = 0.023, d = 0.55). Similarly, BD probands had significantly longer SSRTs than HCs (p = 0.014, d = 0.69), their co-twins (p = 0.005, d = 0.69), and MDD probands (p = 0.033, d = 0.51). BD and SZ probands did not differ from each other, and no co-twin subgroup differed from HCs. SSRT increased with age.
Heritability
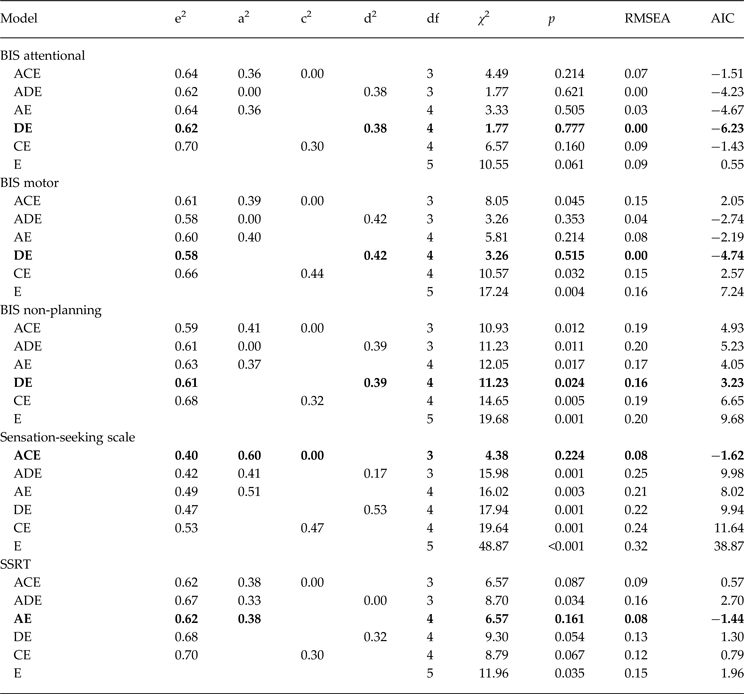
Estimates of proportions of variance accounted for by additive and non-additive genetic and shared and non-shared environmental effects, along with goodness-of-fit statistics for each model for each model tested, are presented in Table 3. The best-fitting models indicate a range of 38–60% of variance accounted for by genetic factors on these measures of impulsivity.
Heritability estimates and model fit statistics for dimensions of impulsivity

BIS, Barratt impulsiveness scale; SSRT, stop signal reaction time; A, additive genetics; D, dominant genetics; C, common environment; E, unique environment.
Best-fitting models (shown in boldface) were selected using Akaike's Information Criterion (AIC) and root-mean-square error of approximation (RMSEA). χ 2 difference tests were not used to test the addition of terms in nested models because the AIC and RMSEA penalize for complexity and allow comparison across both nested and non-nested models.
For BIS total scores and for scores on each BIS sub-scale, the best-fitting models according to AIC included dominance genetic effects, reflecting that the observed correlations between MZ twins were more than twice those of DZ twins. χ 2 difference tests indicated that DE provided satisfactory fit without addition of an A term. In BIS attentional, motor, and non-planning scores, dominance genetic effects accounted for 38%, 42%, and 39% of the variance, respectively.
For scores on the SSS, the best-fitting model according to the AIC was the ACE model. χ 2 difference tests revealed that the addition of both A and C terms significantly improved model fit, despite the negligible variance accounted for by common environment. Additive genetic effects accounted for 60% of observed variance. For SSRT, the best-fitting model according to the AIC was the AE model, with additive genetic effects accounting for 62% of the variance. χ 2 difference tests indicated that the addition of the A term significantly improved model fit.
Discussion
In this study all three impulsivity factors of the BIS – attentional, motor, and non-planning – were moderately heritable and patterned as endophenotypes for SZ, BD, and MDD, potentially emerging from shared genetic variance for these three disorders. Conversely, self-reported sensation seeking (SSS) and a behavioral measure of motor inhibition (SSRT), while showing disease-related effects and evidence of heritability, showed no genetic relationship with any of these disorders.
Correlations among impulsivity facets
Evaluation of the phenotypic level correlations between BIS subscales, sensation seeking, and SSRT supported their treatment as separable dimensions of impulsivity. Although the three BIS subscales were moderately inter-correlated, neither sensation seeking nor SSRT correlated with the other types of impulsivity measured. Though sensation seeking is often used interchangeably with impulsivity, recent work has demonstrated that impulsivity as measured by the BIS and sensation seeking scales have different developmental trajectories (Steinberg et al. Reference Steinberg, Albert, Cauffman, Banich, Graham and Woolard2008) and different associated neural substrates (Dawe et al. Reference Dawe, Gullo and Loxton2004). Given that sensation seeking was measured by a separate scale with a different response format from the BIS, method variance may account for a portion of this dissociation, but the scales were administered together in the same sitting. That SSRT also did not correlate with any of the other measures included is consistent with some previous findings that self-reported and behavioral response-inhibition measures of impulsivity seem to tap into distinct and independent constructs (e.g. Gerbing et al. Reference Gerbing, Ahadi and Patton1987).
Variance components
Consistent with prior studies (Congdon & Canli, Reference Congdon and Canli2008) BIS factors were moderately heritable, though unique environment constituted the largest proportion of variance to all three subfacets. Modeling attributed the heritable component of the BIS dimensions to dominance genetic effects, which reflects that the MZ correlations on these measures were more than twice the DZ correlations. Whether the genetic component of BIS impulsivity is truly non-additive, or reflects unrepresentatively low correlations among the DZ twins sampled in this study, is unclear. The same modeling approach applied to the same sample detected only additive genetic contributions to the SSS and SSRT. It is important to note that our sample size was relatively small, and for this reason, heritability modeling was performed in the entire sample rather than in index and control pairs separately, factors that may limit the generalizability of the findings. In particular, heritability may be underestimated if individuals with psychopathology show larger differences from their co-twins generally, due to phenotypic effects of disorders on impulsivity measures.
Implications
Three broad conclusions are supported by these results. First, impulsivity is multi-factorial, as reflected in the different underlying genetic architectures of the subfacets. In particular, sensation seeking and motor inhibition seem genetically distinct from attentional, motor, and non-planning types of impulsivity. The former dimensions also seem to be more sensitive to clinical state than the latter.
Second, these results extend the impulsivity endophenotype from BD to SZ and MDD, which are not traditionally considered impulse-control disorders or associated with extreme and risky impulsive actions, but are known to show genetic overlap with BD. Given this pattern, impulsivity in psychopathology need not specifically manifest in risky or dangerous behavior, but may be characterized by reliance on a lower-order system that can favor low effortful control in the context of risk-taking, lack of persistence, or any set of behaviors requiring the least cognitive control and effort (Carver et al. Reference Carver, Johnson and Joormann2008).
Third, endophenotype candidates need not meet the ‘specificity’ criterion originally included in the endophenotype construct (Tsuang et al. Reference Tsuang, Faraone and Lyons1993) and are better served by the criterion offered by Cannon & Keller (Reference Cannon and Keller2006) that genetically related disorders should be probed for shared endophenotypes. Here, the pattern of results indicates that three dimensions of impulsivity show familial association for all three disorders, although in two cases the difference between co-twins and HCs only reached marginal significance. Given the effect sizes of these differences, however, it is likely that this is due to lack of power.
This set of analyses only begins to uncover the complex pattern of various dimensions of impulsivity and how they emerge in the context of psychopathology. Although the observed differences between the probands' co-twins and control twins provided evidence in favor of shared genetic influences on impulsivity phenotypes among BD, SZ, and MDD, a stronger basis for inferring that this overlap is due to shared genetic influences would be afforded by multivariate genetic modeling, for which larger sample sizes than those available in this study would be required. This study only included four self-reported dimensions and one behavioral measure associated with impulsivity. This three-factor structure of the BIS has also been called into question, as exploratory analyses have found alternative structures in several samples (Fossati et al. Reference Fossati, Di Ceglie, Acquarini and Barratt2001; Li & Chen, Reference Li and Chen2007; Güleç et al. Reference Güleç, Tamam, Güleç, Turhan, Karakuş, Zengin and Stanford2008), and it has shown poor-to-moderate fit in several samples (Ireland & Archer, Reference Ireland and Archer2008; Reise et al. Reference Reise, Moore, Sabb, Brown and London2013), although it has also shown adequate fit in other samples (Someya et al. Reference Someya, Sakado, Seki, Kojima, Reist, Tang and Takahashi2001; Orozco-Cabal et al. Reference Orozco-Cabal, Rodríguez, Herin, Gempeler and Uribe2010; Lu et al. Reference Lu, Jia, Xu, Dai and Qin2013). Our behavioral measure of impulsivity measured motor response inhibition of prepotent responses, which may function differently from other forms of inhibition (Nigg, Reference Nigg2000; Friedman & Miyake, Reference Friedman and Miyake2004), such as cognitive inhibition, which were not measured in this study. Importantly, only three diagnostic groups were included, so we cannot infer information about impulsivity across more disorders, despite its association with many. This wide range of associations with various forms and measures of psychopathology may indicate mechanisms truly shared across disorders or may reflect a relationship with an unmeasured variable associated with impulsivity and with broad risk for psychopathology. Additionally, the MDD group in this study was created post-hoc and was not specifically recruited. The diagnostic procedure was, however, very complete with SCID interview, lifetime diagnostic registry information, and local hospital information if needed, and the quality of the data was high.
Despite these limitations, our results demonstrate that facets of impulsivity assessed by the BIS may be shared endophenotypes for three disorders with known genetic overlap: SZ, BD, and MDD. A recent funding initiative from the NIMH (Insel et al. Reference Insel, Cuthbert, Garvey, Heinssen, Pine, Quinn, Sanislow and Wang2010) calls for research on dimensions of behavior and neurobiology that cut across disorders and can be measured across levels of analysis. Impulsivity is a prime candidate, as it is implied in numerous disorders and associated with adverse outcomes in the general population, and it has begun to be linked to neural systems and to genetic pathways (Congdon & Canli, Reference Congdon and Canli2005, Reference Congdon and Canli2008). Our findings suggest that impulsivity may be such a transdiagnostic endophenotype. Also, in line with previous work, our pattern of results indicates that phenotypes viewed as related to impulsivity may in fact represent entirely disparate constructs. Sensation seeking appears to be distinct from impulsivity, as does motoric response inhibition. This suggests that understanding of impulsivity from a research domain criteria perspective may involve treating these phenotypes as separate. Future work may use alternative measures of impulsivity and molecular genetic data to probe more directly for evidence of shared genetics among dimensions of impulsivity.
Acknowledgements
We thank the study participants, research staff members, and the Swedish National Patient Registry. We also thank the National Institute of Mental Health for financial support (ROI MH052857, Principal Investigator: T.D.C.).
Declaration of Interest
None.