Introduction
Inorganic wide band gap materials, such as zinc oxide (ZnO), in the form of one-dimensional nanostructures have attracted a lot of attention due to their captivating electrical, magnetic and optical properties. A very significant advantage of these materials is their capability to sustain lattice excitons at room temperatures when photons are absorbed.[Reference Hsu and Chang1] As synthesized, ZnO contains an excess of electrons because of the donor nature of its intrinsic point defects. Finding a reliable way to fabricate p-type ZnO is crucial for future optoelectronic devices. Cation doping is a common technique to reach this goal. Among all cations, sodium (Na) is one of the suitable candidates in the group I elements as a dopant to achieve stable p-type ZnO nanorods. This is because Na impurities become shallow acceptors, which can provide a large population of holes across the host lattice.[Reference Shaban and El Sayed2] In theory, Na+ can incorporate into the ZnO lattice interstitially in combination with neighboring oxygen vacancies, and increase the overall number of acceptor centers in it.[Reference Lee and Chang3]
The other significant advantage of Na doping is the improvement of photovoltaic properties of ZnO nanorods.[Reference Polat4] This enhancement has been attributed to fewer inherent defects in Na-doped samples in comparison to pristine ZnO. Lee et al.[Reference Lee, Canciani, Alwhshe and Chen5] reported an improved photoelectrochemical water-splitting photocurrent for ZnO doped with Na+. Moreover, Na+ doping can increase the photocatalytic performance of ZnO for decomposing organic pollutants in water.[Reference Wu and Huang6] It has also been shown that the hydrophilic character of ZnO thin films can be adjusted by Na+ addition.[Reference Lü, Huang, Chen, Zhu, Meng, Song and Sun7] Thus, Na-doped ZnO thin films can be potentially used in the production of antifogging materials, microfluidic devices, or self-cleaning coatings.
In addition, optical properties of ZnO such as the band gap can be tuned by Na doping.[Reference Hassanpour, Guo, Shen and Bianucci8] We aim to find the optimum Na dopant concentration to obtain the maximum shift in the band gap of ZnO. The solution-based preparation of Na-doped ZnO is more favorable, as compared with other techniques, due to its low cost and simplicity.[Reference Lee, Canciani, Alwhshe and Chen5] Hydrothermal growth of Na-doped ZnO nanorods has been recently reported by Yue et al.[Reference Yue, Zhang, Ma and Zhang9] They used NaCl as the dopant precursor, where Na+ addition significantly affected the aspect ratio of nanorods. In this report, for the first time, we present a hydrothermal synthesis of arrays of Na-doped ZnO nanorods, without a catalyst, by using different concentrations of NaNO3 at low temperatures (60 °C). Low synthesis temperature allows us to use a variety of substrates that cannot be used in the case of high-temperature fabrication conditions. To better understand the growth processes, we study the chemical routes that cations take in the presence of the Na+ based on a software simulation. Furthermore, we discuss the effect of different concentrations of Na+ cations on the morphology, crystal lattice parameters, surface chemical composition, and photoluminescence (PL) of the ZnO nanorods.
Experimental section
The procedure for substrate preparation is given in the Supplementary Material 1. The details of the growth method of the pristine ZnO nanorods were given in our previous report.[Reference Hassanpour, Guo, Shen and Bianucci8] For growing the doped nanorods, NaNO3 was dissolved separately in deionized water with different concentrations: 0.1, 0.25, 0.5, and 1 M. The Na precursor solution was added to the growth bottle, as the molarity of the zinc nitrate and hexamethylenetetramine (HMTA) solutions was kept constant at 25 mM. The bottle containing the Zn and Na precursors and HMTA in the presence of the pre-treated substrate was then kept in a furnace for ~20 h to maintain the temperature at 60 °C. The crystal structural and optical properties as well as the morphology of samples were investigated by using different techniques, and the details are given in Supplementary Material 2.
Results and discussion
Theoretical simulation of the growth
In solution-based methods, in general, the preparation conditions, as well as the growth chemical ambience, govern various properties of ZnO nanostructures such as their band gap and morphology.[Reference Jayanthi, Chawla, Joshi, Khan and Kotnala10] Thus, understanding the formation of different ionic complexes during the growth could help to control the resulting ZnO properties to some extent. A basic medium is critical for the hydrothermal growth since divalent metal ions do not readily hydrolyze in acidic media.[Reference Yamabi and Imai11] Initially, heating up the growth solution shifts the pH toward the more acidic region. That is the reason for adding HMTA to the growth solution, which already contains zinc salts dissolved in distilled water. Gradual decomposition of HMTA increases the pH locally to above ~9 at the surface of nucleation sites, and zinc hydroxide species form at the crystal surface due to the higher local pH.[Reference Greene, Yuhas, Law, Zitoun and Yang12] It has been suggested that dehydration of these hydroxide groups, or other hydroxide complexes, eventually leads to one-dimensional ZnO heteronucleation. Since dehydration of these intermediate complexes controls the growth of ZnO, the slow release of OH− groups has a significant effect on the kinetics of the reaction.[Reference Greene, Yuhas, Law, Zitoun and Yang12]
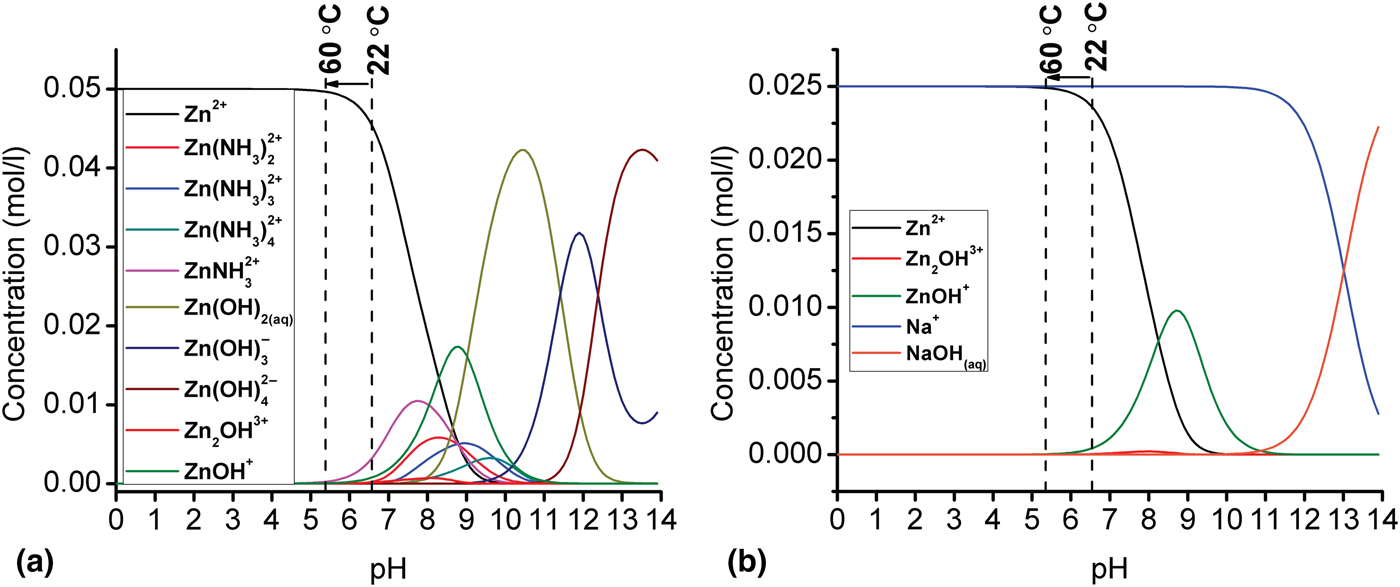
The pH was measured to be in the 5.5–6.7 range at the early states of growth (the behavior of the pH during the whole growth period is shown in the Supplementary Material). To better understand the growth, the chemical route which ions take to maintain the ZnO nucleation was simulated by using Visual MINTEQ 3.1 software and the results are shown in Fig. 1(a). The details of our simulation were discussed in our previous work.[Reference Hassanpour, Guo, Shen and Bianucci8] During the growth—pH range 5.5–6.7—Zn precursors can be found either in the form of cations (Zn2+) or hydroxide complexes. By gradual decomposition of HMTA, the pH shifts toward the basic range and, by following the zinc speciation diagram, it can be seen that this shift can lead to an increase in the number of zinc hydroxide species. Thus, the zinc hydroxide groups are the most important intermediates to maintain the ZnO nanorods synthesis. The simulation results aligned well with the proposed series of reactions leading to the nanorods growth given in our previous work.[Reference Hassanpour, Guo, Shen and Bianucci8]
Speciation diagrams of (a) Zn and (b) Na at 60 °C with a concentration of 25 mM as a function of pH ranging from 0 to 14 as computed with Visual MINTEQ software.
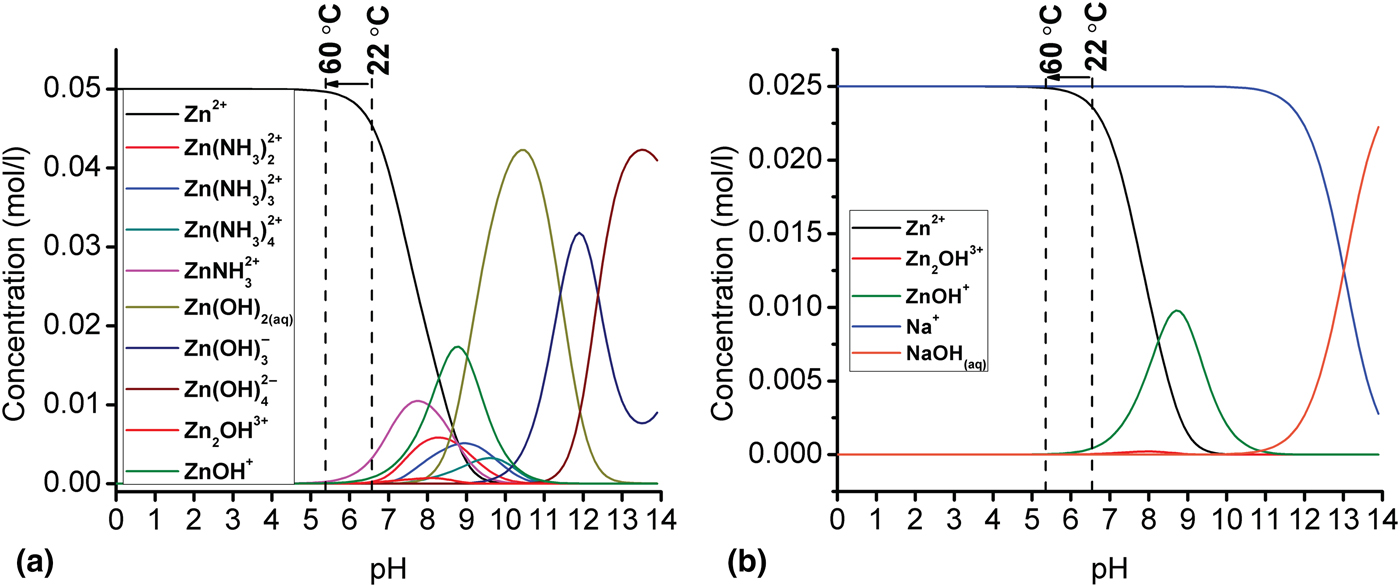
We have shown that metals which possess comparable cationic properties to Zn and can be found in the form of cations in the mentioned pH range, could be doped (with low concentration) in ZnO by using the low-temperature solution-based method.[Reference Hassanpour, Guo, Shen and Bianucci8] To verify this idea, the speciation diagram of Na+ with a concentration of 25 mM was simulated and the result is shown in Fig. 1(b). At the initial stage of the growth, Na+ is the dominant cation species in comparison with the other hydroxide complexes such as NaOH. Based on the simulation results, a higher concentration of Na precursors (>25 mM) can be introduced to the growth bottle with no concerns about the formation of cation complexes. In fact, further simulation diagrams (not shown here) showed that adding larger amounts of Na precursors will lead to the shift of the cation curve (for instance, the blue line for Na+) toward the lower pH range. In this case, Na+ are still the dominant cations in comparison with other cation species such as (NaOHaq).
Morphological analysis
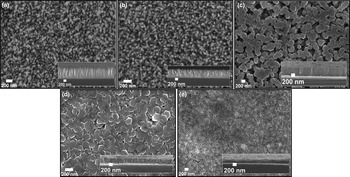
The scanning electron microscopy (SEM) images of the undoped and Na-doped ZnO nanorods with different concentrations are shown in Figs. 2(a)–2(e). The hexagonal shape of the ZnO nanorods was not changed by the addition of low concentration of Na+, while the sizes were affected. The diameter of nanorods gradually increased proportional to the Na+ concentration in the growth solution. The trend of growing diameter slows down for high Na+ concentrations, and in the case of 1 M Na+ doping concentration, nanorods disappeared and a thin film of Na-doped ZnO was formed instead [the full evolution of height and diameter of ZnO nanorods as a function of NaNO3 concentration can be seen in Fig. S2(A) in the Supplementary Material]. We believe that by increasing the dopant concentration, the possibility of coalescence of nanorods rises due to the larger diameters. This process continues until the nanorods lose their hexagonal shape and a thin film of Na-doped ZnO is formed as shown in Fig. 2(e).
SEM images of the top and cross-section of (a) undoped ZnO nanorods (b) 0.1 M, (c) 0.25 M, (d) 0.50 M, (e) 1 M Na-doped ZnO nanorods grown at 60 °C on silicon substrates.

The height of the nanorods decreased gradually by Na+ addition. A similar trend of an increase in diameter and decrease in height as a function of NaCl doping concentration was reported before.[Reference Polat4, Reference Yue, Zhang, Ma and Zhang9] An average diameter reduction of ZnO nanorods by NaNO3 addition was also reported before by Ko et al.[Reference Ko, Lee, Baek and Hong13] Lee et al.[Reference Lee, Canciani, Alwhshe and Chen5] have also observed a similar trend and they have explained this effect based on the mass conservation rule. According to this rule, the longer the nanorods grow, the smaller diameter will become and vice versa. The proposed model matches our results for lower doping concentrations, in the sense that longer nanorods gained smaller diameters.
The aspect ratio variation of Na-doped ZnO nanorods was calculated based on their SEM image data, showing a decline in the aspect ratio of the Na-doped nanorods as a function of the dopant concentration [full results are shown in Fig. S2(B) in the Supplementary Material]. In fact, Na+ ions that are released in the growth solution can effectively adhere to the (001) planes, inhibiting the nanorod growth along the [001] direction.[Reference Lee, Canciani, Alwhshe and Chen5] Therefore, the aspect ratio of the nanorods reduces as relatively large amounts of NaNO3 were introduced to the growth solution. Based on our SEM images shown in Fig. 2, it can be concluded that low level of incorporation of Na+ into ZnO host lattice has almost no effect on the hexagonal form of the nanorods; whereas at higher concentration, the morphology of the nanorods is strongly affected by the addition of the Na+ cations.
Crystallographic characterization
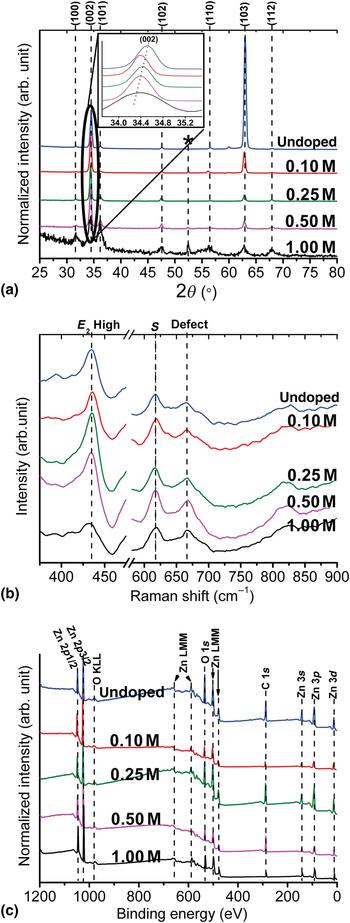
X-ray diffraction (XRD) was used to investigate the effect of Na doping on the crystal phase of the ZnO nanorods. The XRD patterns, which are shown in Fig. 3(a), confirm that the hexagonal wurtzite is the dominant crystal structure in all our samples. An extra peak (assigned with an asterisk) was detected at ~52°. This peak is related to a cubic phase of ZnO2 according to the PDF card 13-0311. The conversion of ZnO nanorods into a thin film at higher dopant concentration can be explained by the formation of this new phase. The disappearance of the * peak of the 0.25 M sample in Fig. 3(a) is due to the major incorporation of Na+ cations into the interstitial centers across the ZnO host lattice. Incorporation of Na+ into the ZnO crystal could change the atomic medium in the host lattice, resulting in a change in the intensities of peaks along different crystal planes. Our XRD results suggest that nanorods grow more effectively along their A and B axes with Na+ addition, in agreement with our SEM images shown in Fig. 2 where thicker nanorods were obtained by Na+ addition. A measure for the crystal orientation of nanorods with their main axis perpendicular to the substrate has been suggested before as following[Reference Gu, Zhang, Li, Zhu, Wei, Li, Shu, Wang, Wang, Shen, Kang and Wu14]:
 $$i_{(002)} = \displaystyle{{I_{(002)}} \over {I_{(100)} + I_{(002)} + I_{(101)}}}, $$
where I (100), I (002), and I (101) are the intensities of the corresponding crystal plane peaks in XRD patterns. Comparing the results to the undoped ZnO indicates that the degree of alignment of nanorods remained almost unchanged for 0.1 M sample and it has been reduced by the addition of high concentration of Na+ except for 0.25 M sample, which went through a different doping mechanism as explained before.
(a) XRD patterns, (b) micro-Raman, and (c) XPS spectra of undoped and Na-doped ZnO nanorods with different concentrations grown at 60 °C on silicon substrates. Inset (a): high-resolution (002) peak position. (Traces were shifted vertically for visibility.)
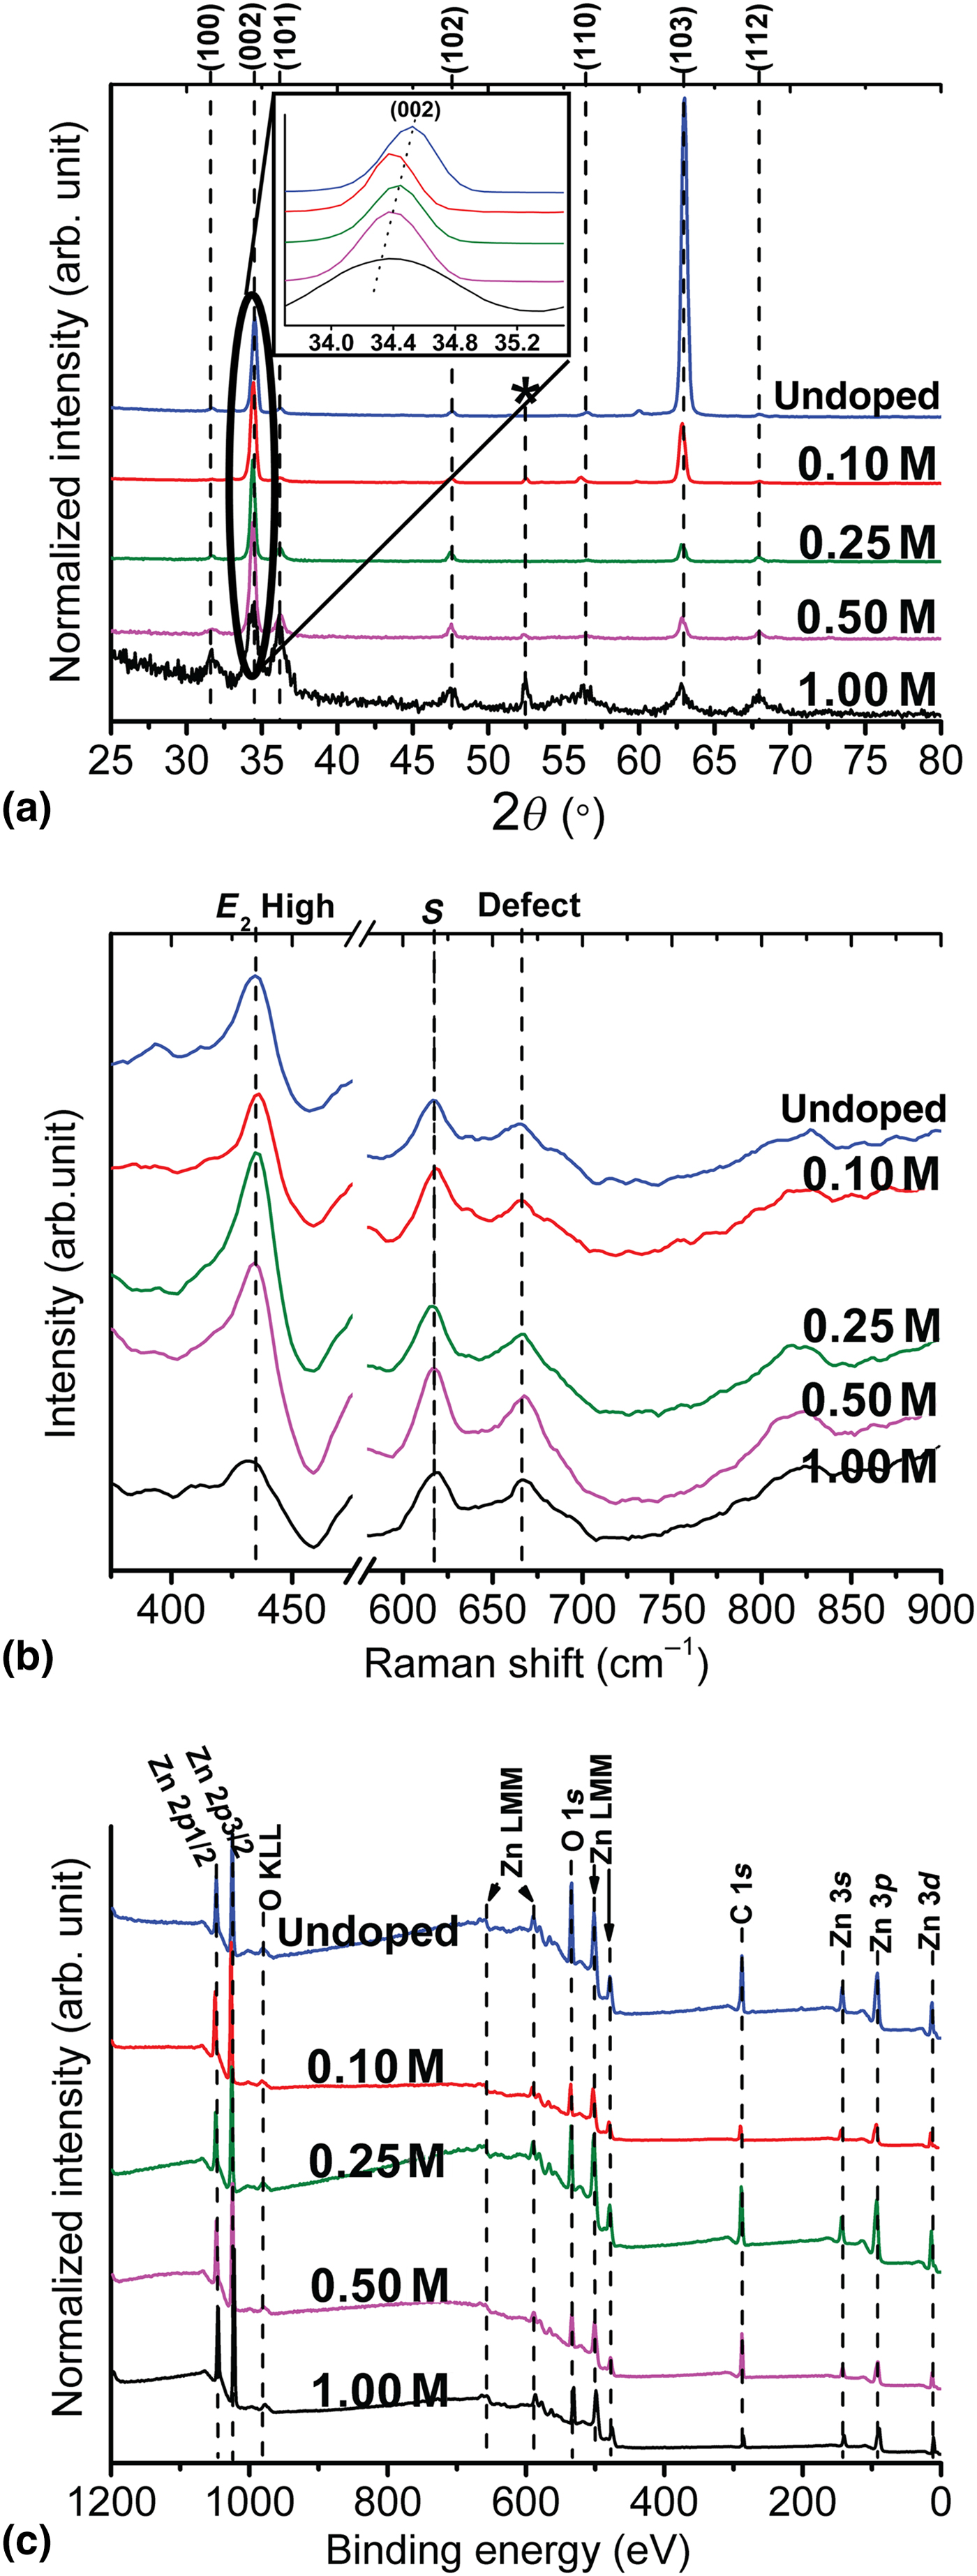
The inset of Fig. 3(a) depicts the comparison of the (002) peak position of our doped and pristine samples. Lattice distortion can be the main reason for the slight shift of (002) peak toward the lower 2ϴ angles. Higher lattice constants and a larger crystal plane spacing were measured based on the (002) peak shift for the Na-doped nanorods. The plane spacing data are illustrated in Fig. S3 in the Supplementary Material. Similar results were reported before and the lattice parameter enhancement was attributed to the substitution of smaller Zn2+ (0.74 Å) ions with larger Na+ (0.95 Å) ions.[Reference Shaban and El Sayed2, Reference Wang, Wu, Tian, Li, Fang, Kong and Zhou15, Reference Ye, Wang, Wu, Ji and Zhang16] The relative drop in the lattice constant of the 0.25 M sample can be related to the stress release of nanorods as a result of occupancy of interstitial centers by Na+ cations at higher doping concentration.[Reference Ye, Wang, Wu, Ji and Zhang16, Reference Wang, Luo, Tseng, Ao, Li, Xing, Bao, Suzukiis, Ding and Li17] A summary of crystal lattice data of our samples is given in Table SI in the Supplementary Material. The full-width at half-maximum (FWHM) of the (002) peaks is gradually increased by the addition of high concentration of Na+.
Micro-Raman scattering
Micro-Raman spectroscopy is a technique which we can use for investigating the local crystal structure in nanomaterials. Room temperature micro-Raman spectra of our samples are shown in Fig. 3(b). The peaks in our Raman spectra are indexed as wurtzite ZnO with the dominant E 2(H) peak[Reference Chien, Wu, Chen, Yang, Wu, Su, Lin and Chen18] emphasizing a strong wurtzite crystal structure in both Na-doped and pristine samples, in accordance with our XRD results. The strong E 2(H) peak also implies that the majority of nanorods are perpendicular to the substrate. According to Fig. 3(b), the E 2(H) peak of the 1 M Na-doped sample has broadened and slightly shifted to the lower frequencies. Similar results for the E 2(H) peak was reported before for Na-doped ZnO at high doping concentrations.[Reference Tabib, Bouslama, Sieber, Addad, Elhouichet, Férid and Boukherroub19, Reference Kumar and Thangavel20] The shift of the E 2(H) mode to the lower frequency was attributed to the formation of doping-induced tensile stress along the ZnO crystal c-axis.[Reference Kumar and Thangavel20] The S peak approximately centered at 616 cm−1 is assigned to the silicon substrate. The small peak at 665 cm−1 has been related to oxygen vacancies or zinc interstitials defect centers in the crystal lattice.[Reference Zhang, Wei, Li and Dong21]
Surface chemical characterization
The chemical composition of the doped and pristine samples was investigated by the x-ray photoelectron spectroscopy (XPS) and the results are shown in Fig. 3(c). We used the C 1s peak (which is present due to contamination) as the reference for data calibration. The ZnLMM and OKLL peaks in the spectra are due to the Auger effect. The presence of O2− ions in wurtzite hexagonal ZnO is indicated by an asymmetric peak at ~530 eV,[Reference Boqian, Peterxian, Ashok, Katiyar and Marc22] and the existence of Zn2+ ions appears as a Zn 2p 3/2 peak at 1021.7 eV in the XPS spectra.[Reference Yang, Miao, Xu, Xu, Xu and Liu23] The spin–orbit interactions split the Zn 2p peak, and the Zn 2p 1/2 peak was detected at 1044.8 eV. Significant information about the effect of dopant on the chemical composition of ZnO nanorods can be derived by the analysis and comparison of the Zn 2p and O 1s peaks. The XPS data comparison shows that the overall surface chemistry of the ZnO nanorods remained unchanged after addition of the Na dopants. No significant changes were detected in the intensity and peak position of the Zn 3d, Zn 3p, and Zn 3s peaks by Na+ addition. However, a precise measurement of the Zn 2p peak position shows a slight shift toward lower energies in the spectra of Na-doped samples. No clear correlation was detected between the dopant concentration and the Zn 2p shift. The slight shift can be related to the lower surface energy of Na-doped nanorods as compared with the pristine samples.[Reference Chu, Peng, Dasari, Palai and Feng24] The spin-orbit interaction energy remained almost unchanged by Na+ addition and the FWHM of the Zn 2p peaks was smaller for the Na-doped nanorods in comparison with the undoped one, except for the 0.50 M sample. For reference, the XPS data of all the samples is summarized in Table SII in the Supplementary Material.
Analysis of the O 1s peaks started with the deconvolution of these peaks into two sub-peaks at 530.2 and 531.6 eV (high-resolution plots of these peaks can be found in Fig. S4, in the Supplementary Material). The lower energy peak is assigned to O2− ions (OL) in stoichiometric Zn–O–Zn regions, whereas the higher binding energy peak is attributed to O2− ions (OH) in an oxygen-deficient ZnOx region or to the hydroxyl groups resulting from chemisorbed water.[Reference Lupan, Chow, Ono, Cuenya, Chai, Khallaf, Park and Schulte25] Based on the area beneath the O 1s peak, the surface OH percentage decreases by Na+ addition, which can be an evidence of more stoichiometrically oxidized surrounding of doped nanorods and/or a smaller number of hydroxyl groups positioned on their surface in comparison with the undoped ZnO. Therefore, a smaller number of oxygen vacancies is expected in the Na-doped samples as compared with the undoped ZnO nanorods. This idea will be confirmed by the PL measurements. The full results of the qualitative analysis of the O 1s peak of the doped and undoped samples are given in Table SII in the Supplementary Material. The O 1s/Zn 2p peak area ratio was decreased by Na+ addition, indicating a smaller number of oxygen atoms versus zinc in the doped nanorods. The drop in O 1s/Zn 2p ratio is small for the 0.25 M sample as compared with the other Na-doped samples. This can be due to the fact that for the 0.25 M sample, the majority of Na+ cations incorporated into the interstitial centers across the ZnO host lattice consistently with our XRD analysis. The detection of Na atoms was not successful due to the XPS detection limit, but their presence was confirmed by energy-dispersive x-ray spectroscopy (EDS). EDS measurements from different positions across the sample showed different contents of Na. This implies that the dopant is not uniformly distributed across the host ZnO lattice (Fig. S5 in the Supplementary Material shows a typical EDS spectrum).
Room temperature PL spectra
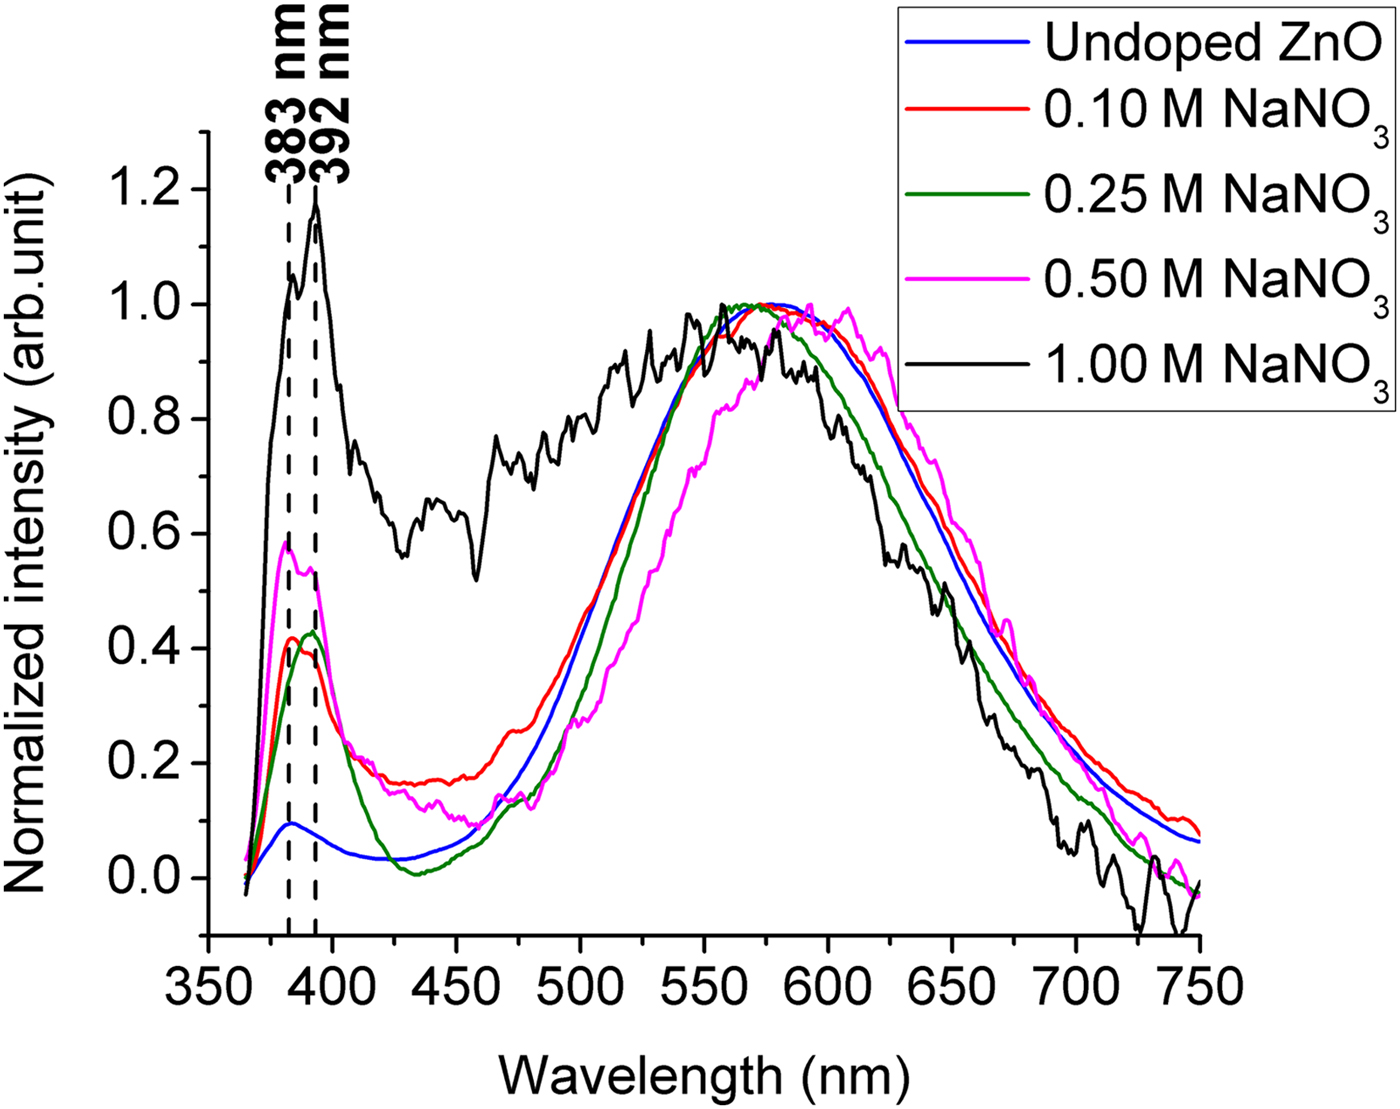
Typical PL emission of wurtzite ZnO nanomaterials contains a narrow peak in the ultraviolet (UV) region and a broad peak in the visible range.[Reference Zhang, Yin, Wang and Guo26] The former peak is commonly called near band edge (NBE) emission, and it is mainly referred to electron–hole recombination, while the latter one is associated with defects.[Reference Kong, Yu, Zhang, Fang and Feng27] Room temperature PL spectra of our samples are shown in Fig. 4, illustrating the strong wurtzite crystal structure of the undoped and Na-doped ZnO, in agreement with our XRD and Raman results. The relative NBE peak intensity of Na-doped samples increased as a function of Na concentration in comparison to undoped ZnO. Similar results were reported before for low level of Na doping.[Reference Polat4, Reference Wang, Wu, Tian, Li, Fang, Kong and Zhou15] The sharp NBE peak of the Na-doped sample can be due to less chemisorbed water on their surface.[Reference Xie, Sekiguchi, Ishigaki, Ohashi, Li, Yang, Liu and Bando28] The weaker OH peak shown in the XPS signal also supports this assumption. A smaller number of non-radiative centers in Na-doped samples can be another reason for the NBE enhancement. As can be seen in Fig. 4, the UV peak started to split into two subspectral peaks by Na+ addition. The first peak, located at ~383 nm is representative of NBE of the undoped ZnO nanorods. The second peak at ~392 nm evidences the band gap shrinkage of ZnO nanorods due to the Na+ doping. The only exception is the 0.25 M Na-doped sample, which shows only one narrow peak at 392 nm. The anomalous behavior of the NBE peak of samples doped with different Na dopant concentration is related to the different doping paths that Na+ cations take during the growth.
Room temperature PL spectra of undoped and Na-doped ZnO nanorods with different concentrations grown at 60 °C on silicon substrates.
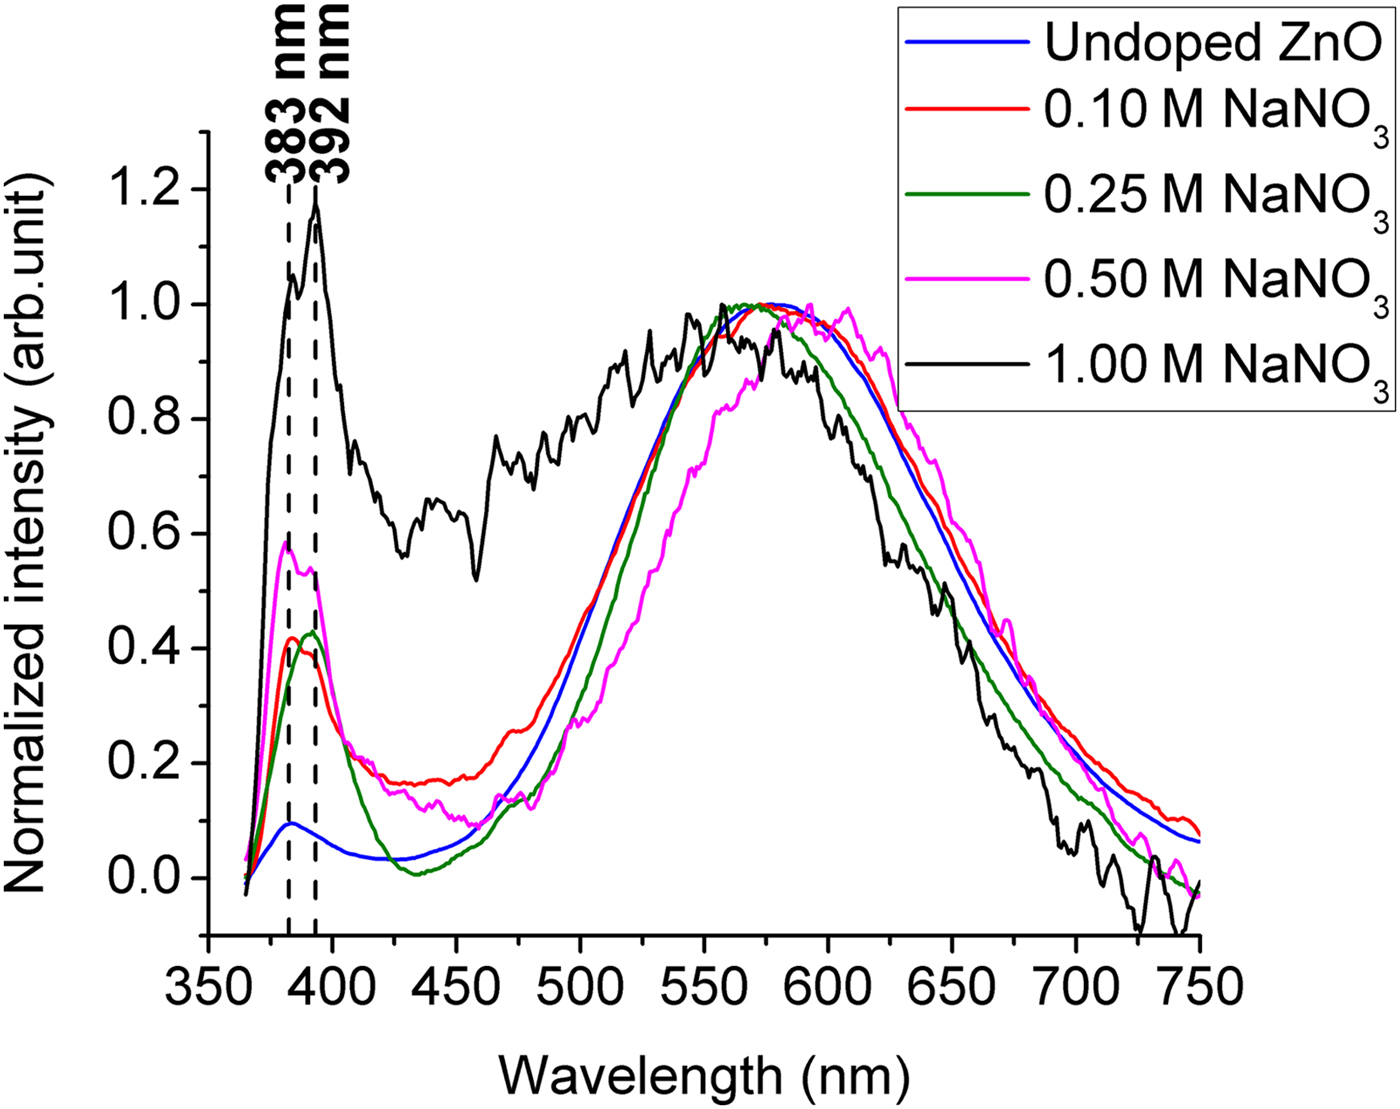
ZnO prepared by the hydrothermal method inherently suffers from the presence of zinc interstitials and oxygen vacancies as defect centers across its host lattice. Our results support the idea that the NBE shift is due to the Na+ incorporation at those interstitial sites. It was suggested that at lower Na doping concentration, the majority of the dopants are tended to substitute the zinc atoms rather than occupying the interstitials.[Reference Ye, Wang, Wu, Ji and Zhang16, Reference Wang, Luo, Tseng, Ao, Li, Xing, Bao, Suzukiis, Ding and Li17] Thus, for the 0.1 M sample, the small secondary peak at 392 nm started to grow indicating the start of the interstitial process. By further increase of the concentration to 0.25 M, the interstitial occupancy process was enhanced leading to the release of stress along the doped nanorods c-axis. The single peak at 392 nm for 0.25 M sample indicates that all the nanorods are uniformly doped with Na+ at the concentration where zinc to Na ratio is 1:10. Moreover, the absence of a secondary phase peak in the XRD patterns, as well as a smaller lattice constant of 0.25 M sample in comparison with the other samples, is evidence of dominant interstitial occupancy process, in accordance with the XPS results. At higher concentration, the NBE peak was split again. However, the peak at 392 nm for 1 M doped sample is stronger than the peak at 383 nm in comparison with the samples doped with lower concentration. The higher intensity detected for the Na-doped samples in the region between 400 and 480 nm can be due to the existence of Na–O–Zn compounds which were previously observed in our XRD patterns. This peak has been attributed to zinc vacancy defect points in a couple of previous reports.[Reference Polat4, Reference Wang, Wu, Tian, Li, Fang, Kong and Zhou15] They were also connected to the emergence of a large number of grain boundaries along the Na-doped ZnO crystal.[Reference Jin, Im and Lee29] Therefore, the extra peak around 450 nm can be due to the formation of Na compounds, zinc vacancies or larger number of grain boundaries in the samples grown with higher Na+ concentrations. The broad peak in the visible region is commonly attributed to defect centers such as oxygen vacancies and interstitial centers in the ZnO crystal lattice.[Reference Ong and Du30] From Fig. 4, it can be seen that the NBE/defect emission ratio was increased for the Na-doped samples in comparison to the undoped one. This can be explained based on the XPS results where a larger number of stoichiometric oxygens were obtained for the Na-doped samples. Therefore, there exists a smaller number of oxygen vacancy centers in Na-doped ZnO as compared with undoped ZnO.
Conclusions
A low-temperature solution-based method (60 °C) was used to synthesize Na-doped ZnO nanorods. The SEM results show that at low doping concentration, ZnO nanorods keep their hexagonal shape, while with the addition of high molarity (1 M) solution of NaNO3, the nanorods lose their shape and convert into a thin film. Based on the morphology analysis, the aspect ratio of the ZnO nanorods decreased proportionally to the Na+ concentration at lower dopant levels. This trend slowed down for concentrations larger than 0.25 M. XRD patterns proved the unchanged hexagonal crystal structure of ZnO nanorods after doping it with Na+. A gradual increase for the lattice constant of Na-doped sample along their c-axis was also calculated based on the XRD data. Room temperature micro-Raman spectra confirm the wurtzite hexagonal structure by depicting a strong E 2(H) peak for undoped and Na-doped samples. The precise analysis and comparison of the O 1s peaks of the XPS spectra implies the presence of a larger number of stoichiometric oxygen atoms in Na-doped samples than in the non-doped ZnO. Thus, a lower number of oxygen vacancy defects is predicted for the Na-doped samples. The NBE/defect emission ratio of the Na-doped nanorods was enhanced as compared with the undoped sample. The PL measurements with the higher dopant showed an extra UV peak for Na-doped samples at 392 nm except for the 0.25 M one. We attributed the additional peak to the NBE of Na-doped sample. In the case of the 0.25 M sample, all nanorods are uniformly doped with Na+, so they only show one single peak at 392 nm as their NBE. The highest degree of texture was also achieved for this concentration ratio, according to the XRD results. Therefore, for the low-temperature hydrothermal doping of ZnO nanorods, the optimum concentration ratio of zinc to Na must be 1:10.
Supplementary material
The supplementary material for this article can be found at https://doi.org/10.1557/mrc.2018.45
Acknowledgments
The authors would like to thank Dr. Lionel Vayssieres for his insightful guidance in this work. The authors also appreciate Penghui Guo and Qiliang Wei for the XPS measurements.
Author Contributions
The manuscript was written through the contributions of all authors. All authors have given approval to the final version of the manuscript. The fabrication of the samples was done by A.H. at IRCRE, Xi'an Jiaotong University, China, and the characterization was done in IRCRE, Concordia University, and INRS-EMT by A.H.
Funding Sources
This work was financially supported by the Mitacs Globalink research award, Fonds de Recherche du Québec––Nature et Technologies (FRQNT), National Science and Engineering Research Council (NSERC), and Concordia University.