I. INTRODUCTION
The search for ideal in vivo luminescent biomarkers is a great challenge because there are stringent criteria to be fulfilled: the biomarkers should (i) be nontoxic and bioinert, (ii) be photostable, i.e., be nonbleaching, (iii) show no intermittency in luminescence, i.e., there should be no blinking, (iv) be small where the critical diameter is close to 6 nm, (v) be producible in large amounts for biological studies. Organic dye molecules are well characterized and can be synthesized in large selection of excitation and emission wavelength range. Dye molecules fulfill criteria (iv)–(v) but they often bleach and are toxic because the visible emission comes from double bonds or aromatic bonds.Reference Brandizzi, Fricker and Hawes1 Recently, small luminescent nanocrystals have been synthesized that are photostable. The most successful candidate out of above is cadmium selenide (CdSe) where the size of the particles could be well controlled. Depending on the size, CdSe nanocrystals emit light of various wavelengths due to quantum confinement of the host electron states, so they are called CdSe quantum dots (QDs).Reference Medintz, Uyeda, Goldman and Mattoussi2 CdSe and other compound semiconductor QDs contain heavy metals that are toxic.Reference Hardman3 While the diameter of these QDs is in the range of 1–5 nm, a protecting shell is needed to avoid toxicity and aggregation and to make these QDs highly stable in aqueous solution. The hydrodynamic size of core/shell QDs is typically larger than 20 nm. In addition, they often blink upon excitation.Reference Medintz, Uyeda, Goldman and Mattoussi2, Reference Hardman3 These QDs fulfill criteria (ii) and (v) but fail the other ones, particularly, criterion (i) which can be the most important one for in vivo studies.
In this article, we investigate silicon carbide QDs that are among the best candidates to fulfill criteria (i)–(v). Bulk silicon carbide (SiC) is a chemically inert wide band-gap indirect semiconductor with excellent hardness and heat resistance. The porous form of SiC has already been successfully applied in bone tissues and dentistry, thus SiC is considered to be a bioinert material.Reference Raya, Maldonado, Rico, Gañan, de Arellano-Lopez and Fernandez4 SiC-based microelectromechanical systems (MEMS) were also studied,Reference Coletti, Jaroszeski, Pallaoro, Hoff, Iannotta and Saddow5 and successfully applied in living systems.Reference Frewin, Jaroszeski, Weeber, Muffly, Kumar, Peters, Oliveros and Saddow6 On the nanoscale, SiC shows a quantum confinement effectReference Wang, Zhang, Wang and Zu7–Reference Wu, Fan, Qiu, Yang, Siu and Chu10 and luminescence properties within the 400–460 nm emission range.Reference Botsoa, Bluet, Lysenko, Marty, Barbier and Guillot11–Reference Fan, Wu, Li, Liu, Siu and Chu13 SiC nanocrystals of the size of 1–6 nm have been studied in living organisms and show effective luminescence without perturbing the living cells.Reference Botsoa, Lysenko, Géloën, Marty, Bluet and Guillot14 They can be produced in sizes smaller than 10 nm and no protective shells are needed for making SiC QDs biocompatible or for stabilizing them in aqueous systems.Reference Fan, Wu, Zhao and Chu15
There are many ways to produce SiC QDs. SiC QDs may be fabricated by embedding SiC particles in Si or SiO2 matrixReference Makkai, Pécz, Bársony, Vida, Pongrácz, Josepovits and Deák16 or by use of sol–gel precursors.Reference Veinot, Henderson and Hessel17 Nevertheless, electrochemical etching of bulk SiC is the most widely used method where porous layers form during etching and these layers are broken down in an ultrasonic bath or by milling, and finally SiC QDs are produced with sizes smaller than 10 nm.Reference Fan, Wu and Chu18 Cubic SiC may be effectively treated by electroless wet chemical etching in a mixture of hydrofluoric acid (HF) and nitric acid (HNO3) at elevated temperature.Reference Zhu, Liu, Wu, Xu, Zhang and Chu19 Recently, we were able to produce luminescent SiC QDs by this inexpensive method where the maximum size of SiC QDs was about 16 nmReference Beke, Szekrényes, Balogh, Veres, Fazakas, Varga, Kamarás, Czigány and Gali20 that did not fulfill criterion (iv). In this article, we report progress in controlling the size of SiC QDs by using a more sophisticated method in the production process and optimizing the parameters of the etching procedure where the produced SiC nanoparticles have come down to the desired size of QDs. We also analyze the surfaces of our prepared SiC QDs that have serious implications and potentialities for biological functionalization.
II. EXPERIMENT
Silicon (Across, 365 mesh) and graphite powder were successfully ground and pressed into a pellet, then heated in an induction chamber to produce SiC microcrystalline (MCs) powder. For cleaning the SiC powder from Si and C residue, the sample was etched in HF (50%) and HNO3(68%) and water mixture with volume ratio of 2:1:5 at ambient temperature, followed by washing with deionized water. Next, the dried sample was annealed at 900 °C for 6 h and the etching and drying step was repeated.
For obtaining the highest yield, about 2.0 g clean SiC powder was placed into a 23 mL Teflon-lined acid digestion bomb (Parr Instrument Company, Moline, IL) and annealed at 120 °C for 2 h. Using this closed reaction chamber, the concentration of the acid mixture does not change because of the different vapor pressures of HF and HNO3, while temperature is controllable in a wider range. The open system was a perfluoroalkoxy (PFA) flask with 5-mm aperture that was connected to a reflux column and heated in a 120 °C oil bath. 2.0 g SiC was etched for 2 h, then in both cases the etching acid was decanted after centrifugation and SiC was washed with distilled water and dried. To produce SiC QDs, the acid-treated samples were sonicated in a chosen solvent for 1 h and centrifuged at 4000 rpm for 1.5 h. The supernatant fluid contains SiC QDs.
For characterizing the etching process, we weighed the sample before and after acid treatment and determined the yield of SiC QDs after the process as well. The size distribution was deduced from several high-resolution transmission electron microscopy (HRTEM) images where the particles were dried on an amorphous carbon (C)-coated TEM grid using a JEOL JEM-3010 HRTEM (Tokyo, Japan; 300 kV; 1.7 Å resolution). Photoluminescence (PL) spectra were recorded in aqueous and ethanol solution using a Horiba Jobin-Yvon Nanolog spectrometer (Horiba Scientific, Edison, NJ). For characterizing the surfaces structure of the SiC QDs, Fourier transform infrared spectroscopy (FTIR) was used [Bruker Tensor 37 spectrometer, Bruker Optik GmbH, Ettlingen, Germany, equipped with an overhead attenuated total reflectance (ATR) unit for liquids].
III. RESULTS AND DISCUSSION
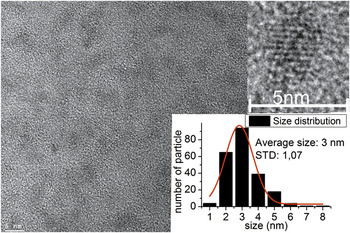
We successfully produced ultrasmall colloid SiC nanocrystals. After 2 h of etching the measured weight loss was 50 mg/g in both cases and the yield of SiC QDs was about 2 mg for the open system and 3.0–3.5 mg when using a digestion bomb for the etching process. Thus, the closed reaction chamber can improve the yield with respect to the open system, which is an important issue. As a consequence, the intensity of photoluminescence also increases (see photoluminescence study below). The HRTEM image revealed that the SiC QDs were nearly spherical with size distribution of 1–8 nm and the average diameter was about 3 nm (see Fig. 1). Neither SiC QDs larger than 8 nm nor aggregated particles were found in any of the samples. This shows that the closed reaction chamber method leads to smaller SiC nanoparticles. This is a crucial improvement with respect to our previous studyReference Beke, Szekrényes, Balogh, Veres, Fazakas, Varga, Kamarás, Czigány and Gali20 where we applied an open vessel system, resulting in a larger average diameter of about 6 nm and nanocrystals larger than 10 nm in the colloid suspension. By applying a closed reaction chamber and elevated temperature for annealing, the average size of SiC QDs could be reduced to 3 nm which fulfilled criterion (iv), and we found only few nanocrystals larger than 6 nm in diameter; their size (7–8 nm) is still close to the desired value. Our methodology is a promising route to ultimately fulfill criterion (iv).
HRTEM image (left and upper right above) and size distribution of SiC QDs (right below). The red line is a fitted Gaussian curve.

Briefly, the two major advantages of the closed reaction system compared with the open vessel system are evident: larger output and narrower size distribution with smaller average diameter of the SiC QDs. In a closed system, neither the acid vapors nor gas phase products can escape during the reaction while high pressure is formed inside the reactor. We use an acid digestion bomb as a reactor and these bombs are validated up to 13 MPa. For getting more insight into the differences between the open and closed-system reaction mechanism, we have to investigate the SiC etching mechanism. Wet etching of SiC has not been studied intensively yet. Krasotkina first reportedReference Krasotkina, Yakovleva, Voronin and Shmitt- Fogelevich21 that hot HF/HNO3 mixture is able to etch the cubic form of SiC,
 $$\eqalignb{{\rm{SiC + 2HNO}}_{\rm{3}} \,{\rm{ + \,6HF }} \to \,{\rm{ H}}_{\rm{2}} {\rm{SiF}}_{\rm{6}} \,{\rm{ + \,2HNO}}_{\rm{2}} \,\cr{\rm{ + \,CO}}_{\rm{2}} \,{\rm{ + \,2H}}_{\rm{2}} .$$
In this reaction two gas phase products are formed, namely, carbon dioxide and hydrogen. Both components have very low solubility in acids even at high temperatureReference Cox and Head22, Reference Ruetschi and Amlie23 and ambient pressure. Thus, they can induce bubble formation on the SiC surface. These bubbles mask the SiC surface and most likely staunch the formed pores. The higher pressure increases the solubility of gasesReference Wiebe and Gaddy24 and the diffusion of the bubbles away from the surface takes place more easily. The generation of relatively small pores during etching is possible in this way, which may lead to a narrower size distribution. Deeper understanding of wet etching of SiC with HF/HNO3 may come from the studies of isotropic etching of silicon using the same mixture. The HF/HNO3 etching system is one of the most widely used isotropic etchant for silicon, but reduction of nitrogen during the reaction shows very complex chemistry. Most of the authors agree that the active agent of silicon etching is not NO3−, but an intermediate nitrogen species in the oxidation state +3.Reference Robbins and Schwartz25–Reference Steinert, Acker, Krause, Oswald and Wetzig28 We suppose that the active agent is similar in the etching of SiC and the accelerated etching could be due to the higher intermediate stability in the closed system. In an open system, the gas phase reaction product of nitrogen reduction can escape and this can shift the equilibrium, which lowers the probability of etching. In a closed system, however, the gaseous products stay in the reaction chamber, and can react with water increasing the active intermediate concentration.
We can see evidence of these theories. In reaction (1) nitrous acid (HNO2) is the final product that is stable only in very dilute and cold conditions. During the reactions, brown nitrogen dioxide gas is formed which is visible in an open system and also when the closed system is opened. The digestion bomb is under ambient pressure when cooled back to room temperature, thus most of the produced nitrogen oxide gases can react with water or can dissolve in it. The strong yellow color of the acid from the digestion bomb instead of light yellow or colorless acid in an open system is a well-known sign for a higher concentration of dissolved nitrogen dioxide.
All in all, the reaction chamber helps the active agent to be present at higher concentration in the solvent, which leads to smaller sized pores, thus smaller sized nanoparticles. In addition, the output of nanosized SiC particles is also increased. Further optimization of parameters is in progress. Next, we turn to the characterization of our samples that are highly important in future bioapplications.
A. Surface IR analysis
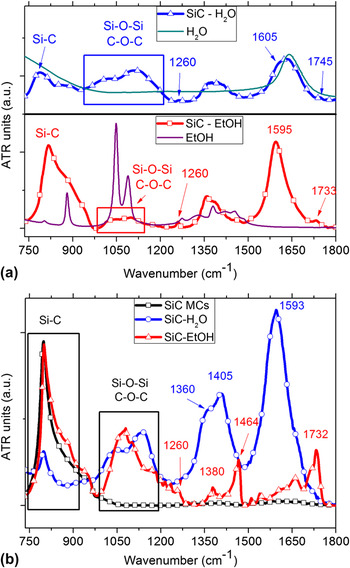
The presence of surface carboxylic groups is crucial for the biofunctionalization of the SiC QDs and the study of the surface of these QDs is of great importance. Attenuated total reflectance (ATR) infrared spectroscopy can be used for the characterization of the surface structure of SiC QDs. ATR measurements were carried out after solvent evaporation from the ATR crystal surface. Figure 2(a) presents the IR spectra of SiC QDs synthesized in an open reaction chamber at ambient pressure. The IR spectra of SiC QDs dried from water and EtOH are shown together with the corresponding IR spectra of the pure solvents. In this way it is possible to distinguish between surface IR bands and solvent IR bands. These results were discussed in detail in our previous articleReference Beke, Szekrényes, Balogh, Veres, Fazakas, Varga, Kamarás, Czigány and Gali20 where the average size of the SiC QDs was larger and also the presence of QDs larger than 10 nm was shown by HRTEM. In comparison, in the present study smaller SiC QDs were synthesized and studied and no QDs above 10 nm were detected. Figure 2(b) shows the dried SiC QDs from water and ethanol (EtOH) in comparison with the spectrum of SiC MCs. Here we discuss just the low-frequency region below 1800 cm−1, because of the presence of characteristic C = O related bands in this region. The high-frequency region above 2700 cm−1 usually contains the C–H and possible O–H or N–H stretching vibrations and was discussed in our previous work.Reference Beke, Szekrényes, Balogh, Veres, Fazakas, Varga, Kamarás, Czigány and Gali20 The Si–C band at ∼800 cm−1 is present for each sample. The IR spectrum of SiC MCs contains only the Si–C band [Fig. 2(b), black curve]. For SiC QDs, due to the higher surface-to-volume ratio, the surface structure is different from SiC MCs and is clearly revealed in Fig. 2(b). Among the surface-related bands we also expect the presence of the IR bands of the remnant pure solvents; however, clear evidence of the SiC QDs surface bands are present in these spectra as already described earlier.Reference Beke, Szekrényes, Balogh, Veres, Fazakas, Varga, Kamarás, Czigány and Gali20 The IR spectrum of pure water contains two strong bands at ∼3400 and ∼1640 cm−1. The band at 1593 cm−1 of the SiC QDs dissolved in water [Fig. 2(b), blue curve] can be assigned to the remnant O–H bending vibrations of the pure solvent, but this is the region where surface C = O stretching vibrations are also expected. The presence of different carbonyl or carboxylate groups on the surface of SiC QDs becomes evident in the case where EtOH is used as solvent [Fig. 2(b), red curve]. Pure EtOH does not show any characteristic band in the region 1500–1800 cm−1. The presence of the band at 1732 cm−1 together with the band at 1260 cm−1 indicates the symmetric and asymmetric COO-stretching vibrations and is in good agreement with theoretical calculations.Reference Vörös, Deák, Frauenheim and Gali29 In the region between 1000 and 1200 cm−1, most likely the Si–O–Si and C–O–C surface vibrations can be seen. Si–H vibrations could not be detected; thus they are not representative of our fabricated SiC QDs. Theory suggests that Si–O–Si bonds are more stable than Si–H bonds on SiC QDs which is in line with our finding.Reference Vörös, Deák, Frauenheim and Gali30 Further surface-related bands are present at ∼1350 and at ∼1400 cm−1 for each colloid. These bands are assigned to the surface related CH and –OH bending vibrations. The clear differences in the IR spectra of the two studies are related to the more evident presence of carboxylate groups on the surface of SiC QDs when dissolved in EtOH and QD-related –OH groups in water.
(a) IR spectra of SiC QDs in water and EtOH in comparison with pure water and EtOH, respectively. SiC QDs were synthesized in an open reaction chamber at ambient pressure. (b) IR spectra of SiC QDs synthesized in a closed reaction chamber at high pressure. The IR spectrum of the starting SiC MCs is shown for comparison. Each spectrum was baseline corrected and scaled to enhance visibility.

B. Photoluminescence study
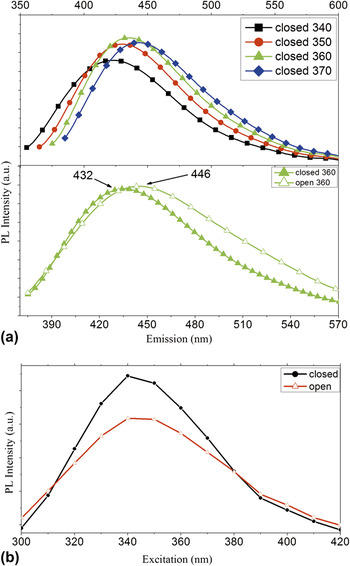
PL spectra of the SiC QDs were taken in water and ethanol solution in the 300–400 nm excitation range. The highest band intensity appears at an excitation of 340–370 nm with the corresponding emission in the range of 430–450 nm [Fig. 3(a) upper panel—for the aqueous colloidal solution]. In comparison with our previous study where an open system was used for synthesizing the SiC QDs,Reference Beke, Szekrényes, Balogh, Veres, Fazakas, Varga, Kamarás, Czigány and Gali20 the PL spectrum of SiC QDs synthesized in a closed system shows two major differences. There is a slight blue shift in the emission maximum and the spectrum is generally less broad for SiC QDs produced in the closed reaction chamber than those in the open container [Fig. 3(a) lower panel]. Both differences confirm narrower size distribution in accordance with the HRTEM micrographs and show a nearly monodisperse distribution range (1–8 nm for the closed system instead of 1–15 nm for the open system) and a lower average size (3 nm instead of 6 nm). To compare the absolute intensities of the PL emission intensities at different excitations for the two systems a new set of experiments was performed where all experimental parameters were kept the same. The result is shown in Fig. 3(b). The PL intensity is about 30% stronger for the closed reaction chamber prepared SiC QDs, which is in line with our findings related to the enhanced yield production.
(a) PL spectra of aqueous SiC QDs prepared in closed high pressure reaction chamber (upper panel) at excitation 340, −350, −360, and 370 nm. PL spectra of the samples prepared by the two methods at excitation with 360 nm. The spectra were scaled for a better visualization (lower panel). (b) Comparison of the PL intensity at different excitation wavelengths for the two methods.

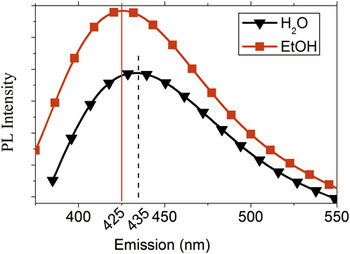
Comparing the PL spectra recorded in water and EtOH solution, a red shift with increasing solvent polarity can be observed (Fig. 4). The concentration and size distribution of the samples was the same, as well as the setup parameters. We mostly attributed this behavior to the change in the dielectric constant of different solvents.Reference Beke, Szekrényes, Balogh, Veres, Fazakas, Varga, Kamarás, Czigány and Gali20
PL spectra of SiC QDs in aqueous and ethanol solution. Straight (dashed) vertical line shows the maximum intensity of H2O (EtOH) solution.

IV. SUMMARY
We developed an inexpensive technology for preparing ultrasmall SiC nanoparticles for in vivo biomarker applications. We found that it is crucial to increase the concentration of the active agent in the solvent for increasing the output of nanoparticles and reduce their size. We were able to achieve this by applying a closed reaction chamber. Photoluminescence studies showed efficient emission in the blue-green visible range upon violet excitation. Surface-sensitive infrared spectroscopy revealed the presence of carboxyl groups at the surface of our SiC nanoparticles that could throw the door open for biofunctionalization. Further work relating to the development of our technology and biological tests are in progress.
ACKNOWLEDGMENTS
The Hungarian National Research Fund (OTKA Grant No. 101819) and Bolyai János Research Scholarship of HAS for Zs.C. are acknowledged.