Implications
Our aggregation model is a contribution to the development of simple and transparent calculations of welfare indices that consider a range of individual welfare measures. Applying such a model, we found an improved welfare index for dairy cows in summer grazing compared with the winter barn situation, which is a contribution to clarifying the effect of grazing on animal welfare for commercially housed dairy cows. The welfare benefit from grazing was higher for herds categorised as having many compared with those categorised as having few daily grazing hours. However, large individual herd differences in welfare indices suggest that grazing is not a guarantee for high welfare, as winter housing did not necessarily lead to welfare problems.
Introduction
Consumers and citizens in European countries and the United States rank ‘natural life’ and ‘outdoor access’ highly in terms of animal welfare (Pricket et al., Reference Pricket, Norwood and Lusk2010; Miele et al., Reference Miele, Veissier, Evans and Botreau2011). Free range and grazing systems are seen as appropriate environments for cows, although no grazing is regarded as unacceptable (Ellis et al., Reference Ellis, Billington, McNeil and McKeegan2009). Previous studies on mortality risk (Thomsen et al., Reference Thomsen, Kjeldsen, Sørensen, Houe and Ersbøll2006; Burow et al., Reference Burow, Thomsen, Sørensen and Rousing2011) indicate a positive effect of grazing for dairy cows. Further studies have shown a beneficial effect of grazing on cows’ integument (Keil et al., Reference Keil, Wiederkehr, Friedli and Wechsler2006; Rutherford et al., Reference Rutherford, Langford, Jack, Sherwood, Lawrence and Haskell2008; Corazzin et al., Reference Corazzin, Piasentier, Dovier and Bovolenta2010) and gait (Rutherford et al., Reference Rutherford, Langford, Jack, Sherwood, Lawrence and Haskell2009; Corazzin et al., Reference Corazzin, Piasentier, Dovier and Bovolenta2010). However, other findings showed either no (hock integument, Haskell et al., Reference Haskell, Rennie, Bowell, Bell and Lawrence2006) or negative (loss in body condition, Boken et al., Reference Boken, Staples, Sollenberger, Jenkins and Thatcher2005; increase of hoof lesions, Baird et al., Reference Baird, O'Connell, McCoy, Keady and Kilpatrick2009) effects of grazing. However, those studies focussed on single welfare measures under different conditions and do not address the question of whether grazing is a benefit for cow welfare ‘as a whole’. To address the multi-criteria character of welfare (Rushen and de Passilé, Reference Rushen and de Passillé1992), assessment systems have been developed aiming to give as comprehensive a welfare ‘picture’ as possible by considering a range of welfare aspects and measures. Some of those systems include mainly resource-based (indirect) measures (e.g. Animal Needs Index, Tiergerechtheitsindex 35L, Bartussek, Reference Bartussek1999), others focus on direct animal observations (i.e. Bristol Welfare Assurance Programme, Main et al., Reference Main, Leeb, Whay and Webster2004; ‘loser cow’ score, Thomsen et al., Reference Thomsen, Østergaard, Sørensen and Houe2007) or others are even a mixture of resource- and animal-based measures (Cow life 100, Freedom Food, Welfare Quality®; Ingemann et al., Reference Ingemann, Sandøe, Enemark and Forkman2009). The Welfare Quality® (2009; WQ®) assessment scheme may be regarded as the most ambitious and up-to-date approach used to date, based primarily on animal-based measures supplemented with resource-based variables (Veissier et al., Reference Veissier, Jensen, Botreau and Sandøe2011) – with access to pasture being one of them. It has been developed in an integrated project between 44 food and agricultural institutes and universities (representing 13 European countries and four Latin American countries) from 2004 to 2009. The scheme considers 34 measures for dairy cow herds referring to the four principle welfare categories good feeding, good housing, good health and appropriate behaviour. Corazzin et al., (Reference Corazzin, Piasentier, Dovier and Bovolenta2010) evaluated the effect of 3 months of alpine summer grazing using a modified version of the WQ® assessment protocol for Italian dairy cows housed in tie stalls during the rest of the year. They did not find any effect of grazing on an aggregated overall welfare outcome, but found reduced prevalences of integument injuries. A former study has shown that tethering increases the risk of integument injuries (Krohn and Munksgaard, Reference Krohn and Munksgaard1993) in cows compared with free-stall housing. The number of tie stalls being replaced by free stalls increases, and the majority of Danish cows are housed in loose-housing systems at present (Kristensen et al., Reference Kristensen, Madsen and Noe2010). It needs to be determined whether the welfare of cows in herds managed in free stalls is improved when grazing is offered, as assessed by a multidimensional welfare assessment protocol like WQ®. The aim of our study was to investigate, on the basis of a WQ®-inspired multidimensional dairy cow welfare assessment protocol, the within-herd effect of summer grazing compared with winter barn housing in Danish dairy herds housing lactating cows in cubicle free-stall systems. Our hypothesis was that cow welfare in dairy herds was better during summer grazing than during full-time winter housing. Furthermore, we expected improved welfare with an increase in daily summer grazing hours.
Material and methods
Assessment protocol
The WQ® assessment protocol constituted the basis of the present study protocol for dairy cows. Modifications and reductions were made to ensure as high a level of validity and robustness as possible, and were further motivated by assessors’ familiarity with WQ® and other measuring methods. Modifications were further made in order to shorten the protocol because of the need to fit observations between the daily grazing periods during summer. The present study protocol addressed three (good feeding, good housing and good health) of the four welfare principles and four (absence of prolonged hunger, absence of prolonged thirst, comfort around resting, and absence of injuries) of the 12 welfare criteria from WQ®. Three WQ® measures were not assessed: water flow because it was not practical to measure, loafing area use as no sampled farms used them and disbudding because this practice is illegal in Denmark. The WQ® disease measures (coughing, nasal discharge, ocular discharge, hampered respiration, diarrhoea, vulvar discharge, milk somatic cell count, mortality, dystocia and downer cows) were excluded because of a lack of validity, feasibility or low prevalence. From the ‘behavioural measures’ that do not belong to the principle ‘appropriate behaviour’, only lying partly or completely outside the lying area was skipped based on its very low prevalence. Furthermore, the WQ® measure regarding access to pasture was excluded as this is confounded with the study question. Our welfare assessment protocol, including 17 measures, is presented in Supplementary Table S1.
Target and study population
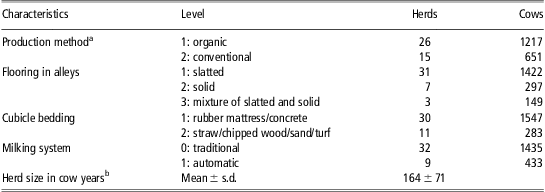
The target population was dairy cows in Danish herds with more than 100 cows, housed in cubicle loose-housing systems to represent the system used by the majority of the present Danish producers. Herds with access to pasture for at least 120 days/year, and in the reference month August with access to 0.1 ha/cow for at least 5 h/daily and with an estimated minimum grass uptake of three feed units (FU, 1 FU = 7.89 MJ NE/FU as described by Bossen et al., Reference Bossen, Weisbjerg, Munksgaard and Højsgaard2009) were selected to guarantee studying herds doing grazing and not only exercising. The selection of studied herds was based on dairy farmer responses from a questionnaire survey on grazing procedures on Danish dairy farms in 2009 sent to a random sample of 812 of the total 2349 Danish dairy herds with more than 100 cows. The response rate was 49.4%. In total, 41 of the 131 grazing herds that answered also met the criteria of target population in the year 2010 (determined via follow-up telephone interview). Further, these farms either used an automatic milking system or two times daily parlour/carrousel milking, grazing lactating and dry cows until at least 2 weeks before expected calving, no substantial changes in management system during the year 2010 and were reachable by car within 250 km from the Research Centre Foulum located in Jutland. Descriptive characteristics of the 41 grazing herds are presented in Table 1. In total, 26 herds followed the Danish rules of organic farming that require cows having access to pasture for a minimum of 6 h during daylight from the 15th of April to the 1st of November. Four of the 15 non-organic grazing herds followed a production concept of the dairy association Arla, labelled ‘Lærkevang’, requiring minimum 6 h on pasture from the 1st of May to the 30th of September. The herds were divided into two groups, day grazing (n = 24) offering 3 to 9 h of daily pasture access (average 6.5 ± 1.7 h) and day–night grazing (n = 17) offering above 9 up to 21 h of daily pasture access (average 14.0 ± 3.9) in the reference period 30 days before the summer farm visit, conducted during each herd's period of maximum daily grazing hours.
Descriptive characteristics of 41 grazing herds (winter situation) included in the data collection during herd visits in 2010
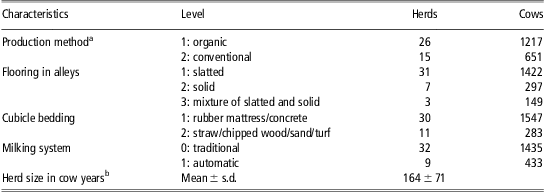
aOriginated from updated registrations at Ministry of Food, Agriculture and Fisheries in 2010.
bSum of feeding days of all cows per herd/365 days.
We chose to draw a random sample of cows per herd for the animal-based measures (except for lying down behaviour, which focussed on a spontaneous sample of cows addressing all barn sections) before the farm visits to minimise possible sampling bias. The sampling was done using sampling intervals (Dohoo et al., Reference Dohoo, Wayne and Stryhn2009) on updated herd record lists of cow identities, ordered by cows’ birth date and obtained from a publicly accessible database from the Danish Ministry of Food, Agriculture and Fisheries before the herd visits. The sample size (S) per herd was based on an estimate of sign prevalence of 0.5%, 10% precision and 95% confidence interval, calculated by the formula S = (96/(95/n + 1)Footnote 1 after Cochran (Reference Cochran1977). For example, in a herd of 100 cows, 49 cows would be sampled. S included a herd representative proportion of lactating and dry cows. Dry cows and also individual cows, observed in both winter (n = 239 and 465) and summer (n = 324 and 412), were excluded from the analysis because of often expanded daily grazing hours for dry cows, leading to deviances in their measurement conditions and to avoid dependence between two observations of the same animal. In total, 1868 lactating cows were studied during winter and 1893 during summer. The clinical examinations on ‘integument’, ‘hygiene’ and ‘claw conformation’ were carried out on only one of the body sides per cow being randomly selected before the farm visit by entering the cow id-numbers on a preset registration sheet with alternating marks for left and right body side.
Observer and time periods of clinical examination
The observations in all 41 herds were carried out by two observers (A and B). Observer A carried out 28 visits and observer B carried out 13 visits in winter. In summer, observer A visited all 41 herds. The observers were trained in the assessment of the welfare measures by three on-farm training sessions and one picture and video session. Observer agreement was tested for each of the clinical and behavioural measures on farm, by pictures or videos with a PABAK (prevalence-adjusted bias-adjusted kappa; Byrt et al., Reference Byrt, Bishop and Carlin J1993) yielding inter-observer agreement from 0.4 to 0.8.
All herd visits were conducted during 2010. The 41 herds were visited twice: first, between 15 March and 5 May at the end of the winter barn period, and second, during the grazing season, between July 28th and September 10th when the cows had been grazing for minimum 50 and maximum 132 days, on average = 103 (s.d. = 19), before they were visited. The order of herd visits was decided on the basis of (a) visiting approximately two to six herds in one geographical region during consecutive days (in one driving trip) and (b) visiting herds in the middle or end of the period of their maximum daily grazing hours determined in repeated consultations of the herd managers during grazing season 2010. The observations were carried out inside the barn around milking and/or feeding time, depending on the individual herd management routines. During winter, the herds were assessed after the morning feeding and/or milking, and during summer when the whole herd was inside (morning or evening).
Assumptions of the aggregation model and panel evaluation
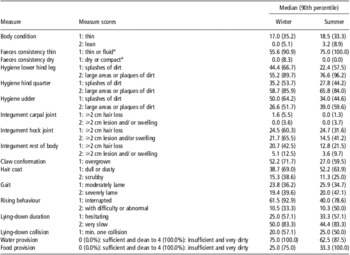
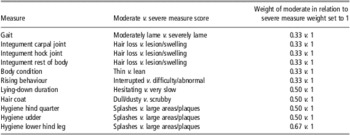
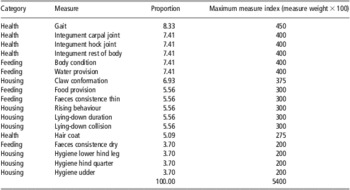
A herd welfare index (WI) was calculated for winter housing and summer grazing based on the 17 welfare measures (Supplementary Table S1; Table 2). The WI was to reflect the ratio of cows per herd with remarks referring to these measures. Out of the 17 measures, 11 were recorded on two severity levels, moderate and severe (scores 1 and 2 in Table 3; graded measures). According to a priori assumptions by the experimenters, a moderate score was evaluated as reflecting a lower impairment than the severe score. Furthermore, four measures (non-graded measures) were scored with presence (score 1) or absence (score 0), where their score 1 was considered reflecting a severe impairment in order to minimise a potentially higher contribution of the graded measures in comparison. ‘Water provision’ and ‘food provision’ were evaluated on a 5-score scale. How much each measure contributed to the model was based on expert opinions concerning the exact weighting of the measures. In total, 32 experts concerning dairy cattle production and welfare were appointed to give opinion on an online questionnaire (a copy is accessible via the corresponding author) during November 2011. A panel of 20 experts, namely, five cattle veterinarians, three researchers, two production consultants, five persons from the cattle federation, one industrial employee, three legislation controllers and one person from an animal protection organisation, responded after at least one reminder 2 weeks after invitation. The panel answered the questionnaire containing (1) semi-open questions on the weighting of severe scores in relation to moderate scores within the 11 graded measures (later, the severe scores were set as 1; moderate score weights) and (2) closed questions on the relative weighting of the 17 measures collected regarding their importance for dairy cow welfare (measure weight). Measure weight was to be ranked on a scale of integers from 1 to 5. The experts’ median moderate score weights and measure weights are presented in Tables 3 and 4. The moderate score weights ranged from 0.33 to 0.67, where the biggest differences between the graded measure scores were evaluated to the measures ‘gait’, ‘integument’, ‘body condition’ and ‘rising behaviour’ with moderate score weights of 0.33. The measure weights, presented as proportions of all 17 measures in Table 4, ranged from 3.70 to 8.33. The highest load was given to integument (median 22.2% of total WI). The experts’ median relative weights of measure scores within-measures and between-measure weight formed the basis of the WI aggregation model.
Prevalence of 17 welfare measures in 41 grazing herds in winter (monitored once in March to May) and summer (monitored once in July to September)

aCategories merged due to low prevalences of cows defecating in several herds.
Weights (identified by expert panel; median among participants) of moderate v. severe measure scores for 11 graded welfare measures of an aggregation model on dairy cow WI

WI = welfare index.
Weights (identified by expert panel; median among participants) of 17 welfare measures of an aggregation model on dairy cow WI

WI = welfare index.
Aggregation model of WI
The WI was modelled based on prevalences of each measure score, moderate score weights and measure weights. To avoid an extreme herd prevalence of single measures from having an unproportionally large impact on the WI, the prevalence corresponding to the 90th percentile among all herd prevalences was set as the maximum to obtain for each measure score. Hence, any herd with a score equal to or greater than the 90th percentile was considered as having the maximum score. Herd prevalences per measure score were transposed according to the herds’ relative prevalence (prevalence per herd/prevalence at 90th percentile among all herd prevalences × 100). The herd level measure scores of 0 to 4 for ‘water provision’ and ‘food provision’ (Supplementary Table S1) were translated to relative prevalence of 0 to 100 (Table 2) for each herd to cover the same possible spectrum as the remaining measures.
With respect to graded measures, the herd's relative prevalence of each moderate measure score was multiplied by the panel median of moderate score weight and added to the herd's relative prevalence of the severe score of this measure. The maximum measure sum was 100. To ensure that herds with a relative prevalence of 100 for the severe measure score would be evaluated as being worst off, cases of a relative prevalence of 100 for moderate and additionally high (but below 100) relative prevalence for the severe score, exceeding a sum of 100, were set to 100. The respective herd's WI was calculated using the formula
 $$ {\rm{WI}}\:{\rm{ = }}\mathop{\sum}\limits_{i\:{\rm{ = }}\:{\rm{1}}}^k {{\rm{(}}{{M}_i}\,M{{W}_i}\,{\rm{ + }}\,S{{\,}_i}{\rm{)}}} {{W}_i}\:{\rm{ + }}\:\mathop{\sum}\limits_{j\:{\rm{ = }}\:{\rm{1}}}^k {{{N}_j}{{W}_j}} $$
where M, S and N were the adjusted herd's relative prevalence of moderate measure scores, severe measure scores and non-graded measure, respectively. MW and W were the expert panel medians of relative moderate score weights and measure weights, i was the individual graded measure, j the individual non-graded measure, k was 11 and l was 6.
The theoretically possible minimum WI (= best possible welfare) was 0 if a herd had a prevalence of 0% for all measures. The theoretically possible maximum WI (= worst possible welfare) is the situation where the herd's relative prevalence is 100 for all measures. In this situation, the individual measures contributed the maximum possible values of 200 to 450, according to the individual measure weights (Table 4). The theoretically possible maximum WI was 5400 (Table 4).
Herd WI for the summer visit and the winter visit was compared. A trend line between WI summer and WI winter was calculated using the formula of the linear function f(x) = mx + b, where m was the slope and b represented the offset. The slope was obtained by the least squares method. WI was split into categories in order to analyse the effect of feeding, housing and health. The grouping of measures into categories was inspired by the grouping into WQ® principles and modified by expert evaluation of four epidemiology researchers at Aarhus University (Supplementary Table S1). Possible effects of summer grazing v. winter barn housing were tested. Means were compared in paired Student's t-test if assumptions of interval and normality distribution were met, otherwise ranks were compared with Wilcoxon's signed-rank test or, according to the distribution, medians were compared with Sign Test using SAS 9.2. Possible differences in WI between the two levels for grazing hours (day grazing, day–night grazing) were evaluated using the non-paired Student's t-test.
Results
Prevalences regarding the 17 assessed welfare measures are presented in Table 2. Prevalence of dirtiness was, in comparison with prevalence of the remaining measures, high in all body areas in winter and summer. The proportion of severe dirtiness was higher in summer than winter. ‘Rising behaviour’, ‘claw conformation’ and ‘water provision’ were scored as ‘bad’, especially in winter, and ‘thin faeces’ were very frequent, especially in summer. ‘Dry faeces’ and alterations of ‘carpal integument’ were generally very rare.
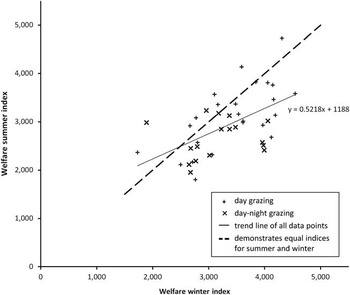
The WI among the 41 dairy herds in winter barn and summer grazing situations ranged from 1727 to 4728. The majority, 32 of the 41 herds, had a lower WI in summer than in winter (herds below the thick line Figure 1). Summer and winter WI (mean 2926, range 1804 to 4728; and mean 3330, range 1727 to 4547) differed significantly in a paired t-test (P = 0.0001). There was a range of differences between summer and winter scores of 3 to 1586 index units. Herds having a better WI in summer (below ‘equal line’ in Figure 1) showed a higher variation of the WI (mean distance to equal line 648 index units, s.d. 426) than herds having a better welfare in winter (above ‘equal line’; mean distance to equal line 464, s.d. 278). Herds with day grazing had mean WIs of 3118 (s.d. 695) in summer and 3435 (s.d. 708) in winter, whereas herds with day–night grazing had a mean of 2654 (s.d. 394) and 3181 (s.d. 597). The mean WIs differed between summer and winter within both day grazing herds (P = 0.0128) and day–night grazing herds (P = 0.0044) in paired t-test. Furthermore, mean summer WIs differed (P = 0.0178) between day grazing and day–night grazing in non-paired t-test, whereas mean winter WIs did not differ (P = 0.2345) between the study groups.
Welfare index (WI) in summer situation against WI in winter situation for 41 Danish dairy herds (17 welfare measures considered).

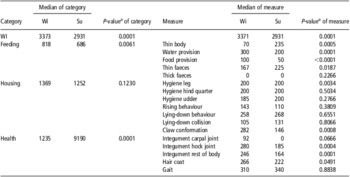
WI, split in three categories, differed for health and feeding but not for housing (Table 5). Furthermore, the health category contributed the most to WI. Within the health category, scores for the measures ‘integument at hock joint’, ‘integument of the rest of the body’ and ‘hair coat’ were all significantly higher, and scores relating to the ‘integument at carpal joint’ tended to be higher in winter than summer. The scores for the WI of the feeding category differed in that the scores for ‘thin body’ and ‘thin faeces’ were higher in summer, whereas WIs concerning water and food provision were higher in winter. When summing up to the overall scores for the feeding category, the situation in summer was evaluated as being significantly more beneficial. Regarding the category housing, only ‘claw conformation’ and ‘cleanliness of hind leg’ showed significant differences, with a positive and a negative aspect in summer, respectively.
Comparison between winter barn housing (Wi) and summer grazing (Su) within 41 herds in terms of welfare indices of measures grouped in welfare categories

WI = welfare index.
aOf paired Student's t-test, Wilcoxon's signed-rank test or sign test, according to fulfillment of assumptions.
Discussion
Welfare protocol and aggregation model
The welfare assessment protocol was created on the basis of the WQ® protocol (WQ®, 2009). However, the protocol was adjusted according to the purpose of studying the possible effect of summer grazing in large Danish dairy herds, which led to differences in measure contents and number of measures. For feasibility and operational reasons, for example, the principle of ‘appropriate behaviour’ was excluded, as well as the criteria ‘absence of disease’ and ‘absence of pain induced by management procedures’. Inclusion of behaviour measures (synchrony, social behaviour; Miller and Wood-Gush, Reference Miller and Wood-Gush1991; Loberg et al., Reference Loberg, Telezhenko, Bergsten and Lidfors2004; Munksgaard and Krohn, Reference Munksgaard and Krohn2004), prevalences of endoparasite infections (Smith et al., Reference Smith, Marion, Swain, White and Hutchings2009; Klewer et al., Reference Klewer, Forbes, Schnieder and Strube2012) and immune response (Webster et al., Reference Webster, Stewart, Rogers and Verkerk2008) may be of further relevance to more fully assess a possible effect of grazing. However, no feasible observation methods for such measures for pasture situations, usable in a cross-sectional observational study, exist yet.
Our purpose was to create an aggregation model as transparent and simple as possible. We chose a summation approach consisting of a one step and single measure aggregation and not, as in WQ® (WQ®, 2009), a hierarchical system, which limits weighting items assessed in numerous measures (Botreau et al., Reference Botreau, Bonde, Butterworth, Perny, Bracke, Capdeville and Veissier2007a). In the present system, each measure could – depending on prevalence and weight – strongly affect the result of the WI in a herd (maximum 450 v. 0 index units; compare Table 4). However, the use of the 90th percentile as maximum prevalence per measure limited the effect of extreme values. Another reason for a one step and single measure aggregation is that measures may be linked to several welfare categories or ‘dimensions’ (Botreau et al., Reference Botreau, Bracke, Perny, Butterworth and Capdeville2007b) as, for example, ‘rising’ to housing and behaviour.
The highest moderate score and measure weights were evaluated by the panel to ‘integument’ alterations being listed with three types. Therefore, ‘integument’ and ‘hygiene’, containing a triple of measures as well, became especially relevant in the aggregation model. One could have merged the three integument types but we did not, as they are based on different kinds of environmental contacts and we wanted to offer each measure an equal opportunity to contribute. Measures not graded were slightly ‘disadvantaged’ in their contribution as in the cases of water provision and claw conformation, as only one relative measure score prevalence was counted for these measures. However, non-graded measures counted, such as severe levels of graded measures and the moderate measure, were downgraded by weights smaller than 1, adding thereby relatively small values to the severe level.
Welfare in summer v. winter
The overall WI and welfare categories, as well as some welfare measures of high impact (Table 5; Figure 1), will be discussed in comparison between winter housing and summer grazing in the following.
The overall WI of grazing herds in summer was lower than in winter (Table 5), suggesting a broad welfare benefit from pasture access for loose-housed cows in Danish grazing conditions. Corazzin et al. (Reference Corazzin, Piasentier, Dovier and Bovolenta2010) compared welfare of tie-stalled dairy cows before and after grazing in the Italian Alps and used an assessment and measure aggregation scheme that were differently modified after WQ® and also derived from a study by Bartussek (Reference Bartussek1999). They did not find any difference. The herd WI showed a high variance during summer and winter, but the majority of herds had a lower (better) WI during summer than winter (Figure 1). This indicates that some herds benefit much from grazing, whereas others benefit less and that some farms have general welfare deficits in their herd management. The WI was lower (better) for day–night grazing than only day grazing dairy herds during summer. This means that herds with the longer daily stay on pasture showed greater improvements during summer than those spending maximal daytime between two milking procedures outdoors. It further suggests that long stays on pasture are able to let the cows (at least partly) recover from deficits, which probably are barn related. It may also be that farms paying more attention to welfare issues decide to all longer pasture access.
With regard to welfare categories, the lower WI during summer than winter originated from feeding and health, showing a significantly improved condition in summer. Corazzin et al. (Reference Corazzin, Piasentier, Dovier and Bovolenta2010) did not find any seasonal differences for their principal categories on housing, physical condition and behaviour. However, their assessment scheme differed from the present, in as much as it included more housing measures and different health and behaviour measures. It can be questioned whether the different results shown for the two studies are based on real differences between the grazing management characteristics in the two countries or whether it is based on different measures and weights applied to the welfare categories. Nevertheless, the categories, measures and aggregation weights applied in this present study indicate that cows in Danish grazing conditions benefit from summer grazing.
The welfare measures, ‘food provision’ and ‘water provision’, ‘integument’, ‘hair condition’ and ‘claw conformation’, showed significant welfare improvement in summer. ‘Hair condition’ and ‘integument’ reflect the direct interaction of the dairy cow with its environment. With regard to ‘integument’, the level of prevalences of any hock alterations was lower in the present study than prevalences of hock damages in British free-stall herds (Rutherford et al., Reference Rutherford, Langford, Jack, Sherwood, Lawrence and Haskell2008), and prevalences of severe alterations were higher than prevalences of scabs and wounds in Swiss tie-stall herds (Keil et al., Reference Keil, Wiederkehr, Friedli and Wechsler2006). Keil et al. (Reference Keil, Wiederkehr, Friedli and Wechsler2006) also found an improvement in the condition of the integument during the summer grazing period, whereas Rutherford et al. (Reference Rutherford, Langford, Jack, Sherwood, Lawrence and Haskell2008) found the effect when taking records after the summer. Furthermore, Corazzin et al. (Reference Corazzin, Piasentier, Dovier and Bovolenta2010) observed cows during and after the alpine grazing period, and improvement was not found until grazing had ended, probably due to a grazing season lasting for only 3 months or to a lower prevalence of integument alterations (e.g. 18.6% cows with a hair loss patch v. 37.5% in the present study). Beyond general effect of summer grazing on integument, the effect of amount of daily summer grazing hours on the integument condition has recently been evaluated for Danish dairy cows (Burow et al., Reference Burow, Thomsen, Rousing and Sørensen2013) showing best hock integument for herds with highest level of pasture access. With regard to ‘claw conformation’, improvement has also been found by Corazzin et al. (Reference Corazzin, Piasentier, Dovier and Bovolenta2010) during and after summer grazing, even though prevalences of poor ‘claw conformation’ were shown in their repeated observations to be only one-third to one-half as high than in the present study. However, we suggest, in accordance with Corazzin et al. (Reference Corazzin, Piasentier, Dovier and Bovolenta2010), that the higher percentage of cows per herd with claws of the correct length in summer compared with winter may be because of the fact that claw trimming is done shortly before turn out. Food provision was based on access, amount and cleanliness and not on quality and content of the food. The loss in body condition during summer grazing, which has also been found in Canada by Hernandez-Mendo et al. (Reference Hernandez-Mendo, von Keyserlingk, Veira and Weary2007) but not in Italy by Corazzin et al. (Reference Corazzin, Piasentier, Dovier and Bovolenta2010), may be based on a lack of balance in the summer food rations, as also suggested by findings of Horan et al. (Reference Horan, Dillon, Faverdin, Delaby, Buckley and Rath2005) and as also the thinner faeces consistency during summer may indicate.
Condition of ‘hair coat’ was better in summer than winter. However, shiny hair coat was given in median to only 36.5% cows per herd during summer compared with 46.0% during winter. The index for hair coat was because of 4% less scrubby coat (and a moderate measure weight of 0.5; Table 4) better during summer. The question, if this is appropriate, leads to the discussion of what is worse, few animals with very poor condition or many with moderate condition. Consulted experts in WQ® (Botreau et al., Reference Botreau, Bracke, Perny, Butterworth and Capdeville2007b) judged concordantly to our evaluation few animals with very poor welfare less positive than all animals in medium condition, also supporting our aggregation system and result.
Conclusion
A WI inspired by WQ® showed better cow welfare within dairy herds for summer grazing compared with full-time winter housing in cubicle loose-housed systems. The integument condition was shown to be one of the welfare measures improving most during summer. Many daily grazing hours turned out to be more beneficial than few daily grazing hours for the welfare of the dairy herds.
Acknowledgements
The authors wish to thank the farmers, who participated in the study. The study was part of the project Afgræsning- også en del af fremtidens kvægbrug and supported by funds from Aarhus University, Stiftelsen Hofmansgave and Mælkeafgiftsfonden.
Supplementary material
For supplementary material referred to in this article, please visit http://dx.doi.org/doi:10.1017/S1751731112002297