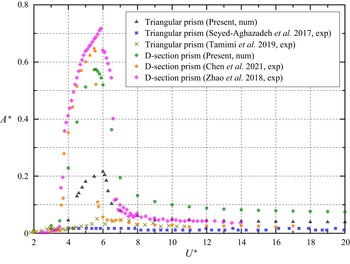
1. Introduction
Flow-induced vibration (FIV) of a bluff body subject to cross-flow is of scientific and engineering significance (Bearman Reference Bearman1984; Blevins Reference Blevins1990; Sarpkaya Reference Sarpkaya2004; Williamson & Govardhan Reference Williamson and Govardhan2004; Bearman Reference Bearman2011; Wu, Ge & Hong Reference Wu, Ge and Hong2012; Alam & Meyer Reference Alam and Meyer2013). It is frequently encountered in many engineering applications, such as marine risers/cables, heat exchanger tubes, offshore platforms, high-rise buildings, chimney stacks, overhead transmission lines and chemical plants.
The FIV of a bluff body is highly sensitive to the cross-sectional shape. According to the different dynamics and flow separation features, Derakhshandeh & Alam (Reference Derakhshandeh and Alam2019) classified the cross-sections of bluff bodies into three categories: the continuous and finite curvature shape, the sharp-edged shape of infinitely large curvature and the combination of both. For these categories, the circular cylinder, the square or triangular prism and the semicircular (D-section) prism are the typical ones, respectively. Cagney & Balabani (Reference Cagney and Balabani2019) found that although the flow separation point of a vibrating circular cylinder oscillates back and forth along a small segment of the cylinder surface, it significantly affects the vibration responses in the lock-in region by modifying the added mass and the vortex shedding frequency. As a result, the vibration frequency of the circular cylinder locks on its real natural frequency (considering the added mass effects) in a wide reduced velocity range, instead of achieving the resonance in a narrow velocity band for a linear dynamic system. The lock-in is defined as the synchronization of the vortex shedding frequency with the cylinder vibration frequency, where they are close to the natural frequency of the cylinder in the case of a high mass ratio (Bishop & Hassan Reference Bishop and Hassan1964; Feng Reference Feng1968) but may not be in the case of a low mass ratio (Khalak & Williamson Reference Khalak and Williamson1999). In the laminar flow regime, Navrose & Mittal (Reference Navrose and Mittal2016) identified the lock-in using the metrics: relatively high amplitude of cylinder oscillation and matching of the cylinder oscillation and vortex shedding frequencies. However, for a non-circular prism, the flow separation point mainly depends on the cross-sectional shape of the bluff body and the angle of attack (AoA;  $\alpha$) of the incoming flow, leading to fundamentally different vibration behaviours.
The vortex-induced vibration (VIV) of a circular cylinder, the most widely applied bluff body, has been extensively and systematically investigated (Sarpkaya Reference Sarpkaya2004; Williamson & Govardhan Reference Williamson and Govardhan2004; Kim et al. Reference Kim, Alam, Sakamoto and Zhou2009; Kim & Alam Reference Kim and Alam2015) while the vibration features and mechanisms of the FIV of a non-circular prism are far from well understood. To provide fundamental knowledge of FIV of a bluff body, we start by reviewing the VIV of a circular cylinder, followed by a brief review of the FIV of rectangular and triangular prisms. Then, a complete literature review of the FIV of a D-section prism is presented.
Based on experimental results, Williamson & Govardhan (Reference Williamson and Govardhan2004) classified the vibration response of a circular cylinder into three branches (initial, upper and lower branches) by changing the reduced velocity, defined as  $U^* = U_\infty /f_nD$, where
 $U_\infty$ is the incoming flow velocity,
 $f_n$ is the natural frequency of the elastically supported cylinder and
 $D$ is the cylinder diameter. The vibration amplitude increases significantly with increasing
 $U^*$ in the initial branch, while decreasing gradually in the lower branch. In the upper branch, typically occurring between the initial and lower branches, the largest amplitude is approximately one diameter for a one-degree-of-freedom cylinder vibrating in the cross-flow direction (Williamson & Govardhan Reference Williamson and Govardhan2004). It is of note that these branches also depend on the combination of the structure–fluid mass ratio (
 $m^*$) and the structural damping ratio (
 $\zeta$), i.e.
 $m^*\zeta$. Here,
 $m^* = m/m_f$ is the mass ratio, with
 $m$ being the cylinder mass and
 $m_f$ being the displaced fluid mass. At a relatively large
 $m^*\zeta$, the upper branch may disappear. However, for a two-degree-of-freedom cylinder vibrating in the cross-flow and in-line directions, the normalized vibration amplitude can be as large as 1.5, forming a super-upper branch, as reported in Williamson & Govardhan (Reference Williamson and Govardhan2004) and Jauvtis & Williamson (Reference Jauvtis and Williamson2004).
The wake flow displays different characteristics at different branches. It has been shown that a 2S mode occurs in the initial branch while a 2P mode emerges in the upper and lower branches (Williamson & Roshko Reference Williamson and Roshko1988; Williamson & Govardhan Reference Williamson and Govardhan2004). In the 2S mode, two vortices are shed from the cylinder in one period of cylinder oscillation, with one from each side of the cylinder. In the 2P mode, two counter-rotating vortices, forming a pair, are shed from each side of the cylinder. In the lock-in region characterized by significant vibration amplitudes, the vortex shedding frequency locks onto the vibration frequency of the cylinder. The vibration amplitude is small outside the lock-in region, and the non-dimensional vortex shedding frequency follows the Strouhal number ( $St$). In addition, the vortex shedding timing, represented by the phase lag between the lift and the transverse displacement, jumps at the transition between the upper and lower branches. Differently, Prasanth & Mittal (Reference Prasanth and Mittal2008) found from the VIV in laminar flow that it is at the middle of the lower branch that the phase changes from
 $0^\circ$ to
 $180^\circ$. The phase jump appears at the intersection of the curves for the natural frequency and the vortex shedding frequency (Bourguet & Lo Jacono Reference Bourguet and Lo Jacono2014; Bourguet Reference Bourguet2020).
For FIV of a rectangular prism, the aspect ratio ( ${\rm AR} = W/L$, where
 $W$ and
 $L$ are the characteristic width and length of the prism, respectively) and the AoA (
 $\alpha$) play a critical role in determining the vibration responses. Zhao (Reference Zhao2015) numerically found that both VIV and galloping can appear in the FIV responses of a rectangular prism. Galloping, driven by motion-induced aerodynamic forces, is characterized by the vibration amplitude increasing monotonically with
 $U^*$ or
 ${\textit {Re}}$. The vibration frequency is much lower than the vortex shedding frequency. With increasing AR from 0.5 to 1.25, the amplitude in the VIV regime decreases, and galloping occurs only when
 $U^*$ is larger than a critical value. Nemes et al. (Reference Nemes, Zhao, Lo Jacono and Sheridan2012) experimentally investigated the effects of
 $\alpha$ on the FIV of a square prism at a low mass ratio of 2.2. They found that the square prism can undergo galloping (
 $\alpha = 0^\circ \text {--}7.5^\circ$), VIV (
 $\alpha = 25^\circ \text {--}45^\circ$) and a mixed mode (
 $\alpha = 10^\circ \text {--}22.5^\circ$) characterized by a larger amplitude and a halved frequency, compared with the VIV upper branch. Similar results were also reported in Zhao et al. (Reference Zhao, Leontini, Lo Jacono and Sheridan2014). Cui et al. (Reference Cui, Zhao, Teng and Cheng2015) numerically studied the FIV of a rectangular prism at
 ${\rm AR} = 0.5$ and 1.0 and
 ${\textit {Re}}/U^* = 385$ with varying
 $\alpha$. At
 ${\rm AR} = 1.0$, galloping arises at
 $\alpha = 0^\circ$ while VIV occurs at
 $\alpha = 22.5^\circ$ and
 $45^\circ$. At
 ${\rm AR} = 0.5$, combined VIV and galloping is observed at
 $\alpha = 0^\circ$ while galloping emerges when
 $U^* > 22.5$ at
 $\alpha = 90^\circ$ and is absent at
 $\alpha = 45^\circ$. Massai et al. (Reference Massai, Zhao, Lo Jacono, Bartoli and Sheridan2018) experimentally investigated the effects of
 $\alpha$ on the FIV of a rectangular prism at a low
 $m^* = 2.24$. They found that even a slight variation in
 $\alpha$ can significantly alter the prism's afterbody – the part downstream of the separation points of the shear layers – and thus leads to distinct vibration responses. Zhao, Cheng & Zhou (Reference Zhao, Cheng and Zhou2013) found that
 $\alpha$ shows significant influences on the vibration amplitude of a square prism and the
 $U^*$ range of the lock-in at
 ${\textit {Re}} = 100$ and
 $m^* = 3.0$. At
 $\alpha = 0^\circ$, the FIV responses have the smallest vibration amplitude and the narrowest lock-in range, with the 2S wake mode dominating. At
 $\alpha = 45^\circ$, a bi-stable vibration is observed and the
 ${\rm P}+{\rm S}$ (a single vortex and a vortex pair are shed from the prism in one period) and 2P modes occur alternately. At
 $\alpha = 22.5^\circ$, two lock-in ranges are present, with the 2S and 2P modes appearing in the first and second ranges, respectively.
Similar features were observed in the FIV of a triangular prism. Seyed-Aghazadeh, Carlson & Modarres-Sadeghi (Reference Seyed-Aghazadeh, Carlson and Modarres-Sadeghi2017) experimentally studied the FIV of an equilateral triangular prism at  ${\textit {Re}} = 490\text {--}2700$, with a mass ratio of 9.24. They found no vibration for
 $\alpha < 25^\circ$, combined VIV and galloping in the range of
 $\alpha = 30^\circ \text {--}35^\circ$ and galloping for
 $\alpha > 35^\circ$. Here,
 $\alpha = 0^\circ$ corresponds to the case with one vertex facing upstream. Moreover, in the galloping regime, the number of vortices shed from the prism increases rapidly with amplitude, while in the combined VIV and galloping regime, 2S,
 ${\rm P}+{\rm S}$ and 2P modes emerge. Similar results were reported by Ding et al. (Reference Ding, Zhang, Wu, Mao and Jiang2015), Zhang et al. (Reference Zhang, Xu, Liu, Lian and Yan2016) and Tamimi et al. (Reference Tamimi, Naeeni, Zeinoddini, Seif and Dolatshahi Pirooz2019). Lian et al. (Reference Lian, Yan, Liu, Zhang, Ren and Yang2017) observed that both soft and hard galloping could occur in the vibration of an equilateral triangular prism, depending on the damping ratio. In soft galloping, the galloping is self-excited, i.e. no external excitation is needed. On the other hand, hard galloping needs external excitation to be initiated. Wang et al. (Reference Wang, Zhao, Yang and Yu2015) numerically studied the FIV of a triangular prism in laminar flow at
 ${\textit {Re}} = 100$. At
 $\alpha = 0^\circ$ and
 $30^\circ$, VIV occurs with a small vibration amplitude, showing figure-of-eight-shaped and single-‘o’-shaped trajectories, respectively; while galloping occurs at
 $\alpha = 60^\circ$. Recently, Chen et al. (Reference Chen, Ji, Xu, Zhang and Wei2020b) numerically studied the FIV of an equilateral triangular prism at
 ${\textit {Re}} = 200$ and stated that the Reynolds number is insignificant for the FIV of sharp-edged bluff bodies by comparing their low-
 $Re$ results with the high-
 $Re$ results of Seyed-Aghazadeh et al. (Reference Seyed-Aghazadeh, Carlson and Modarres-Sadeghi2017).
Since a D-section prism consists of a flat surface and a curved surface with sharp corners, its vibration responses are different from those of a circular cylinder and a sharp-edged prism. The first investigation on the FIV of a D-section prism can be traced back to over a century ago. Lanchester (Reference Lanchester1907) reported that galloping dominates the vibration responses when the flat surface of the prism faces upstream. Since then, several experiments have been carried out on the free vibrations of a D-section prism. Brooks (Reference Brooks1960) experimentally studied the responses of a D-section prism subjected to wind flows at  ${\textit {Re}} = 4\times 10^3\text {--}7\times 10^4$. It was found that when the flat surface faces upstream, VIV appears, and galloping can be excited only when an initial disturbance is imposed. However, when the flat surface faces downstream (a reversed D-section prism), vibration disappears. A generally accepted explanation is that the interaction of shear layer/vortex and structure ceases to exist for a reversed D-section prism due to the lack of an afterbody. Parkinson (Reference Parkinson1963) reported similar findings in an experimental study. Feng (Reference Feng1968), in wind tunnel experiments, found that in the lock-in region, the vibration frequency of a D-section prism is lower than its natural frequency, and the maximum amplitude appears at the end of the lock-in region. Novak & Tanaka (Reference Novak and Tanaka1974) experimentally studied the influence of the turbulence intensity of incoming flows on the galloping of a D-section prism. They found that the turbulence significantly increases the tendency to galloping instability of the prism. Weaver & Veljkovic (Reference Weaver and Veljkovic2005) stated that there is a very narrow range of
 $U^*$ for a D-section prism where a pure VIV resonance appears, and galloping can be initiated only when a significant disturbance is exerted.
All the above experimental studies on a D-section prism were carried out in wind tunnels. Therefore, it is unavoidable that the prism has a large  $m^*$ which is approximately two orders of magnitude larger than that in water. Given the effects of
 $m^*$ and
 $\zeta$ on the VIV of a circular cylinder, the responses of a D-section prism in water can be markedly different from those in air. For the first time, Zhao, Hourigan & Thompson (Reference Zhao, Hourigan and Thompson2018) experimentally investigated the VIV of a D-section prism in a water flume at
 $m^* = 6.0$,
 $U^* = 2.3\text {--}20$ and
 ${\textit {Re}} = 1080\text {--}9000$. It was found that when the flat surface faces upstream, galloping occurs without initial disturbances. When the flat surface faces downstream, the VIV response is similar to that of an isolated circular cylinder. This contradicts the widely accepted theory that the presence of an afterbody is essential for vortex-excited motions. From this point, the mechanisms of FIV of a D-section prism and the roles of an afterbody in wake–structure interaction are not well understood. More recently, Chen et al. (Reference Chen, Zhao, Ji, Srinil and Song2021) experimentally investigated the responses of a transversely oscillating D-section prism for a complete range of
 $\alpha = 0^\circ \text {--}180^\circ$ with a minimum increment of
 $\Delta \alpha = 5^\circ$. Six types of vibration response, i.e. typical VIV, small-amplitude VIV, transition response I and II, combined VIV and galloping, and pure galloping, were highlighted. Kumar, Singh & Sen (Reference Kumar, Singh and Sen2018) numerically studied the VIV of a truncated circular cylinder that closely approximates a D-section prism at
 ${\textit {Re}} = 60\text {--}150$ and found that although the amplitudes are slightly smaller than those of a circular cylinder, the response of the truncated cylinder shows branches similar to those of the circular cylinder. However, as the truncated part enlarges, the vibration amplitudes deviate from those of the circular cylinder significantly (Esmaeili, Rabiee & Bayandor Reference Esmaeili, Rabiee and Bayandor2020).
The FIV of a D-section prism in low- $Re$ laminar flow has not been investigated, and the dynamic responses and wake behaviours are not clear yet. To bridge the gap, the FIV of a D-section prism is numerically studied at
 ${\textit {Re}} = 100$ in this paper. We aim at clarifying several critical issues. (i) What are the responses and wake characteristics of a D-section prism in the low-
 $Re$ flow at various
 $U^*$ and
 $\alpha$? (ii) Can galloping happen in the low-
 $Re$ cases? If yes, what is the
 $\alpha$ range for galloping? (iii) Is an afterbody essential for the vibration of a D-section prism in low-
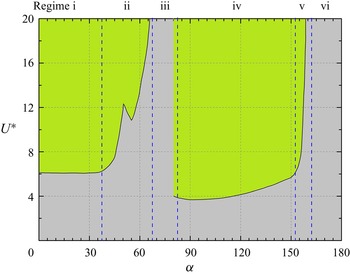
 $Re$ flow? (iv) What are the roles of the separation points in determining the vortex shedding frequency? To answer these questions, a systematic two-dimensional numerical study is reported in this work. The remainder of the paper is structured as follows. In § 2, details of the numerical methodology and simulation parameters are presented. The vibration responses of the prism are discussed based on the variations of the vibration amplitudes and frequencies as elucidated in § 3. In §§ 4 and 5, flow physics of the wake, statistics and spectral features of fluid forces and phase lags between lift and displacement for different types of response are discussed in detail. A quasi-steady analysis is performed to determine the possible AoA range for the galloping in § 6. In § 7, we discuss the effects of
 $m^*$ and
 ${\textit {Re}}$, the roles of the afterbody and the separation point. In § 8, the main conclusions of this paper are summarized.
2. Numerical methodology and validation cases
2.1. Numerical methodology
The fluid–structure interaction is simulated using the immersed boundary (IB) method which was first introduced by Peskin (Reference Peskin1972) to simulate the blood flow around the flexible leaflet of a human heart. In the framework of the IB method (see Appendix A), the flow governing equations are discretized on a fixed Cartesian grid, which generally does not conform to the geometry of moving solids. As a result, the boundary conditions on the fluid–cylinder interface, manifesting the interaction between the fluid and the structure, cannot be imposed directly. Instead, an extra body force is added to the momentum equation using interpolation and distribution functions to take such interaction into account. Compared with conventional numerical methods, the IB method has significant advantages, particularly in fluid–structure interaction simulations with topological changes. Another merit of the IB method lies in its parameterized and fast implementation for a large number of simulations with different geometric configurations compared with conventional methods using body-conformal grids.
The dynamics of the elastically supported D-section prism is simplified as a mass–damper–spring system. In this study, the prism is free to oscillate only in the transverse direction and the governing equation of prism motion is as follows:
 \begin{equation} m \ddot{y}+c \dot{y}+k y=F_{y}, \end{equation}
where  $m$ is the prism mass,
 $c$ is the structural damping,
 $k$ is the stiffness coefficient,
 $y$ is the transverse displacement and
 $F_y$ is the transverse fluid force. The non-dimensional form of the governing equation is as follows:
 \begin{equation} \ddot{Y}+4 {\rm \pi}F_{n}\zeta \dot{Y}+\left(2 {\rm \pi}F_{n}\right)^{2} Y=\frac{4 C_{y}}{{\rm \pi} m^{*}}, \end{equation}
where  $m^*$ is the mass ratio,
 $\zeta$ is the structural damping ratio,
 $F_n = f_nD/U_\infty$ is the reduced natural frequency of the prism,
 $Y = y/D$ is the normalized transverse displacement and
 $C_y = 2F_{y} / \rho U_{\infty }^{2}D$ is the dimensionless transverse fluid force. The governing equation of prism motion is based on Newton's second law and is solved by applying the standard Newmark-
 $\beta$ method – a method of numerical integration used to solve differential equations and widely used in numerical evaluation of the dynamic response of structures. Details of the methodology can be found in our previous works (Ji, Munjiza & Williams Reference Ji, Munjiza and Williams2012; Chen et al. Reference Chen, Ji, Xu, Liu and Campbell2015; Chen, Ji & Xu Reference Chen, Ji and Xu2019a).
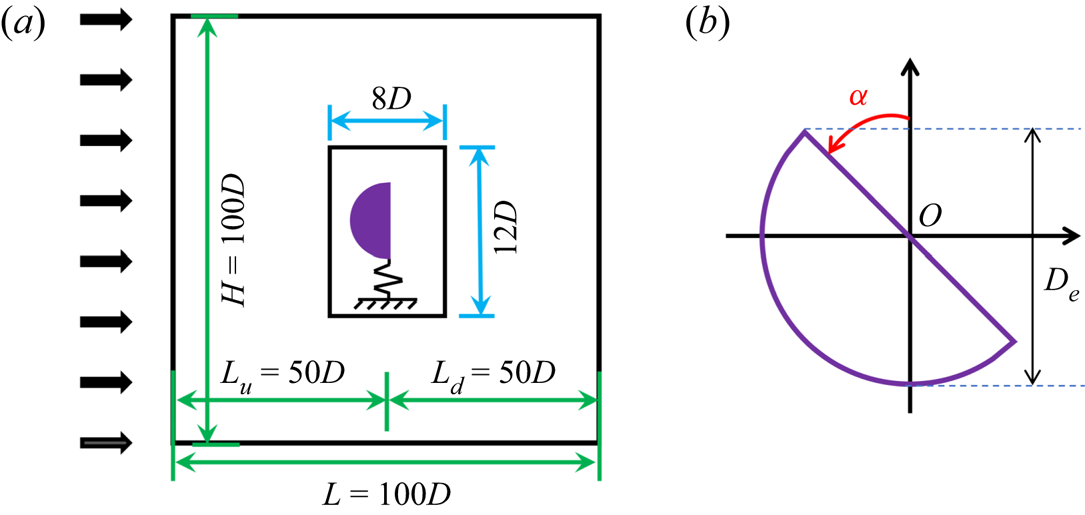
In the present two-dimensional simulations, the streamwise length  $L$ (
 $= L_u+L_d$) and transverse length
 $H$ of the computational domain are both 100
 $D$, as shown in figure 1(a), with
 $L_u$ and
 $L_d$ denoting the distances of the prism's centre to the inlet and outlet boundaries, respectively. The domain is discretized by a non-uniform Cartesian grid with a resolution of
 $768\times 1024$. To improve the accuracy of numerical results, a rectangular region of
 $8D\times 12D$, covering possible motions of the prism, is discretized by using a uniform mesh with a non-dimensional grid spacing of
 $1/64$ in both directions. A stretched mesh is adopted out of the region to keep the total grid number within an affordable range. This mesh configuration was applied in our previous simulations (Chen et al. Reference Chen, Ji, Xu, Liu and Campbell2015, Reference Chen, Ji, Williams, Xu, Yang and Cui2018, Reference Chen, Ji, Alam, Williams and Xu2020a), demonstrating high accuracy and fidelity. As for boundary conditions, a Dirichlet-type boundary is adopted at the inflow whereas a Neumann-type boundary is employed at the outflow. The top and bottom boundaries are set as free-slip boundaries. The number of IB points for the prism is selected as
 $506$ to ensure at least one IB point is allocated in each grid cell. The simulations start with a uniform flow velocity and zero pressure.
(a) The computation domain for the FIV of a D-section prism at  ${\textit {Re}} = 100$ and (b) a sketch for the AoA (
 $\alpha$).

In the present simulations, the D-section prism is allowed to vibrate only in the transverse direction and  $\alpha$ varies in the range
 $0^\circ \text {--}180^\circ$, with
 $\alpha = 0^\circ$ (
 $180^\circ$) corresponding to the configuration with the flat surface facing downstream (upstream); see figure 1(b). The reduced velocity normalized by the prism diameter is
 $U^* = 2.0$–
 $20.0$, the mass ratio is
 $m^* = 2.0$ and the structural damping ratio (
 $\zeta$) is set to zero to excite larger vibrations. In this paper, we aim to explore the effects of
 $\alpha$ and
 $U^*$ on the responses of the D-section prism. The Reynolds number, based on the effective diameter
 $D_e$, is fixed at
 ${\textit {Re}} = U_\infty D_e/\nu = 100$, where
 $D_e=0.5(1+|\cos \alpha |) D$, varying from
 $0.5D$ to
 $D$, and
 $\nu$ is the fluid kinematic viscosity. In addition, parameter intervals as small as
 $\Delta \alpha =5^{\circ }$ and
 $\Delta U^{*}=0.1$ are applied, leading to more than
 $1000$ simulation cases.
The drag and lift coefficients are defined as  $C_{D}=2 F_{D} / \rho U_{\infty }^{2} D$ and
 $C_{L}=2 F_{L} / \rho U_{\infty }^{2} D$, respectively. Forces
 $F_D$ and
 $F_L$ are the drag and lift, respectively. Parameters
 $\bar {C}_{D}$ or
 $\bar {C}_{L}$ and
 $C_{D}^{\prime }$ or
 $C_{L}^{\prime }$ are the time-mean and root-mean-square (r.m.s.) values for the corresponding coefficients, respectively. The non-dimensional vibration amplitude is defined as
 $A^{*}=\sqrt {2} y_{rms} / D$, where
 $y_{r m s}$ is the r.m.s. value of the displacement in the transverse direction. The lift, drag and vibration frequencies are obtained through the fast Fourier transform, and the phase lag between the lift and displacement is obtained through the Hilbert transform.
2.2. Convergence analysis and validation
The convergence of the grid spacing for FIV of a D-section prism is given in table 1. The difference in the results between the grid spacings of 1/64 and 1/128 is insignificant, with the largest value being  $1.3\,\%$ for
 $C_{L}^{\prime }$. Thus, it can be concluded that the grid spacing of 1/64 is acceptable for the simulations. Further, the computational domain sizes and non-dimensional time step
 $(\Delta t U_{\infty }/ D)$ are also checked. Five cases are adopted, with Case 3 being the reference case. As shown in table 2, with
 $L_d = 50D$ to
 $100D$ (Case 1), with
 $L_u = 50D$ to
 $100D$ (Case 2) and with
 $H = 100D$ to
 $200D$ (Case 4), the results show a negligible difference from those in Case 3, with the most significant difference being
 $1.9\,\%$ for
 $C_{L}^{\prime }$. In addition, when decreasing
 $\Delta t U_{\infty } / D=0.005$ to
 $0.0025$ (Case 5), the difference is acceptable, with the largest value being
 $5.1\,\%$ for
 $C_{L}^{\prime }$. Thus, in subsequent simulations,
 $L_u = 50D$,
 $L_d = 50D$,
 $H = 100D$ and
 $\Delta t U_{\infty } / D=0.005$ are adopted.
Results of FIV of a D-section prism at  ${\textit {Re}} = 100$,
 $m^* = 2.0$,
 $\zeta = 0$,
 $\alpha = 180^\circ$ and
 $U^* = 8.0$ with different grid spacings. The values in parentheses represent the difference from those of the grid spacing of
 $1/128$.

Results of FIV of a D-section prism at  ${\textit {Re}} = 100$,
 $m^* = 2.0$,
 $\zeta = 0$,
 $\alpha = 180^\circ$ and
 $U^* = 8.0$ with varying computational domain sizes and non-dimensional time step.

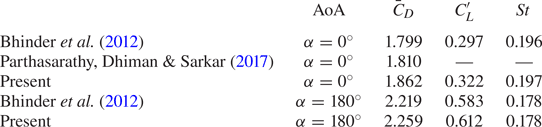
The validation is conducted with VIV results of a circular cylinder and flow past a stationary D-section prism at  ${\textit {Re}} = 100$. As shown in table 3, the present results are consistent with published data, which suggests the present method has high fidelity and accuracy. Besides, as shown in table 4, the present results agree well with published data, further validating the reasonably high accuracy of the present method. Note that the same computational domain as that of Bhinder, Sarkar & Dalal (Reference Bhinder, Sarkar and Dalal2012) was adopted for the flow past the D-section prism.
Comparison of results of VIV of a circular cylinder at  ${\textit {Re}} = 100$,
 $U^* = 4.46$,
 $m^* = 1.59$ and
 $\zeta = 0$. The cylinder is constrained to vibrate only in the transverse direction. Note that
 $y_{max}$ denotes the maximum value of the transverse displacement.

Comparison of present results with published data for flow past a D-section prism at  ${\textit {Re}} = 100$. The same computational domain as Bhinder et al. (Reference Bhinder, Sarkar and Dalal2012) is applied, i.e.
 $L_u = 8D$,
 $L_d = 26D$ and
 $H = 16D$.

3. Structural responses
In this section, the vibration responses of a freely vibrating D-section prism are examined in the range  $\alpha = 0^\circ \text {--}180^\circ$ and
 $U^* = 2.0\text {--}20.0$, with parameter increments of
 $\Delta \alpha = 5^\circ$ and
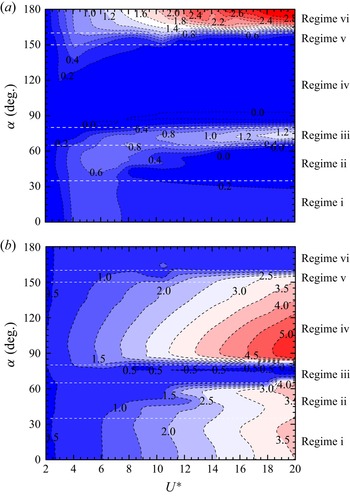
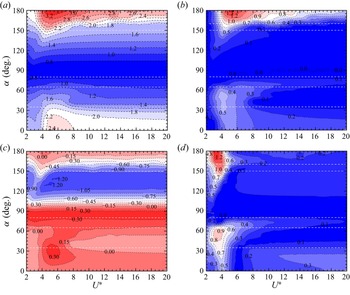
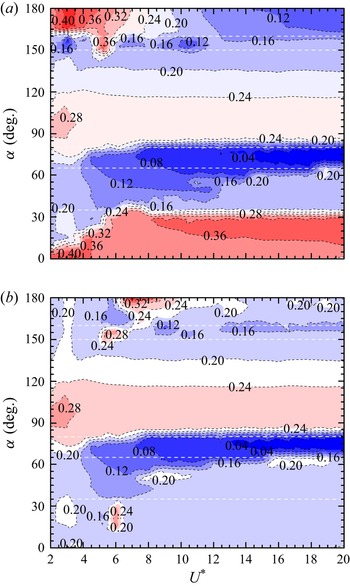
 $\Delta {U}^* = 0.1$ (the smallest increment). Six different types of response are classified according to the vibration amplitude (
 $A^*$) and frequency ratio (
 $f_v/f_n$) in figures 2 and 3. Both
 $A^*$ and
 $f_v/f_n$ are presented in the parameter space of
 $U^*$ and
 $\alpha$. The vibration frequency (
 $f_v$) is obtained through the displacement's fast Fourier transform, while the vibration amplitude is non-dimensionalized by the prism diameter.
Non-dimensional vibration amplitudes  $A^*$ (a) and frequencies
 $f_v/f_n$ (b) versus
 $U^*$ (
 $= 2\text {--}20$) at different
 $\alpha$ (
 $= 0^\circ \text {--}180^\circ$). Different types of responses are divided by the dashed horizontal lines. Regimes (i)–(vi) denote the typical VIV, extended VIV, combined VIV and galloping, narrowed VIV, transition response and pure galloping, respectively.

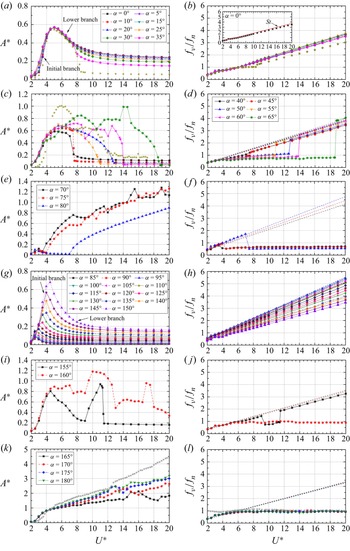
Dependence of non-dimensional vibration amplitudes  $A^*$ (a,c,e,g,i,k) and frequencies
 $f_v/f_n$ (b,d,f,h,j,l) on reduced velocity
 $U^*$ (
 $= 2\text {--}20$) and attack angle
 $\alpha$ (
 $= 0^\circ \text {--}180^\circ$). In (a,b), the stars indicate the VIV amplitudes and frequencies of an isolated circular cylinder, respectively. In (c), the stars denote the VIV amplitudes of a single circular cylinder reported in Zhao et al. (Reference Zhao, Leontini, Lo Jacono and Sheridan2014). In (k,l), the stars represent the galloping amplitudes and frequencies of a D-section prism at
 $\alpha = 180^\circ$ reported in Zhao et al. (Reference Zhao, Hourigan and Thompson2018), respectively. The inclined dashed lines in (b,d,f,h,j,l) represent the
 $St$ lines.

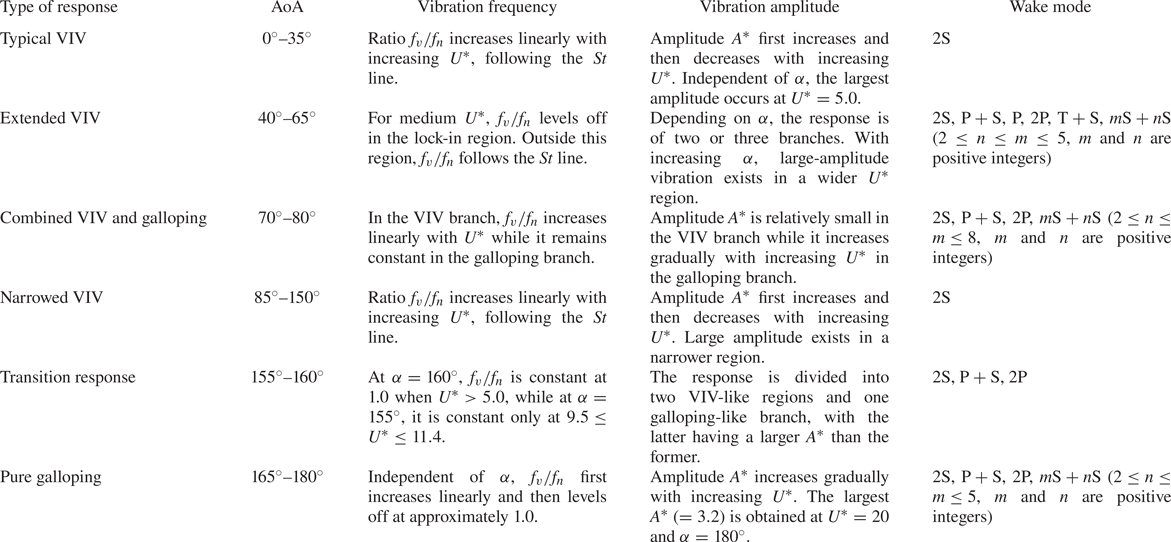
The six classified regimes are: (i) typical VIV at  $\alpha = 0^\circ \text {--}35^\circ$; (ii) extended VIV at
 $\alpha = 40^\circ \text {--}65^\circ$; (iii) combined VIV and galloping at
 $\alpha = 70^\circ \text {--}80^\circ$; (iv) narrowed VIV at
 $\alpha = 85^\circ \text {--}150^\circ$; (v) transitional response, from narrowed VIV to pure galloping, at
 $\alpha = 155^\circ \text {--}160^\circ$; and (vi) pure galloping at
 $\alpha = 165^\circ \text {--}180^\circ$. The classification criteria for these regimes are:
(i) Typical VIV regime at
 $\alpha = 0^\circ \text {--}35^\circ$: the vibration is almost independent of $\alpha$ with the same maximum vibration amplitude (close to that of the VIV of a circular cylinder in laminar flows) being achieved at the same $U^*$. Here $f_v/f_n$ linearly increases with increasing $U^*$ and closely follows the $St$ line, even when the vibrations are significant.
(ii) Extended VIV regime at
$\alpha = 40^\circ \text {--}65^\circ$: the vibration frequency is close to the natural frequency in a wider $U^*$ range at a larger $\alpha$, and $A^*$ is larger than that in typical VIV.(iii) Combined VIV and galloping regime at
$\alpha = 70^\circ \text {--}80^\circ$: in the VIV region, the amplitude is small and $f_v/f_n$ linearly increases with increasing $U^*$; while in the galloping region, $A^*$ primarily increases with increasing $U^*$ and $f_v/f_n$ largely stays around 0.5.(iv) Narrowed VIV regime at
$\alpha = 85^\circ \text {--}150^\circ$: the maximum vibration amplitude significantly decreases and the lock-in region shrinks with decreasing $\alpha$. Similar to the typical VIV regime, $f_v/f_n$ linearly increases with increasing $U^*$ and closely follows the $St$ line.(v) Transitional regime at
$\alpha = 155^\circ \text {--}160^\circ$: both the spectral features of VIV and galloping responses are observed in different branches, with no divergent increase in $A^*$ with increasing $U^*$.(vi) Galloping regime at
$\alpha = 165^\circ \text {--}180^\circ$: $A^*$ monotonically increases with increasing $U^*$ and $f_v/f_n$ is lower than the vortex shedding frequency.


The characteristics of the responses of these types are further checked in the following subsections.
3.1. Regime i: typical VIV
As shown in figure 3(a), in the typical VIV regime,  $A^*$ increases significantly with increasing
 $U^*$ (
 $= 2.0\text {--}5.0)$. The maximum
 $A^* = 0.57$ is obtained at
 $U^* = 5.0$, independent of
 $\alpha$. This peak
 $A^*$ is very close to that of the VIV of a circular cylinder at the same set of parameters (
 ${\textit {Re}}$ = 100,
 $m^*$ = 2.0), as indicated by the stars in figure 3(a). Beyond
 $U^*$ = 5.0,
 $A^*$ decreases gradually with increasing
 $U^*$. The amplitude difference becomes obvious when
 $U^* > 8.0$, i.e.
 $A^*$ is slightly decreased for a higher
 $\alpha$ but is larger than that of a circular cylinder. However, we can see that if only the behaviour of the amplitudes with
 $U^*$ is considered, it is not easy to differentiate response branches because of the smooth transitions. Instead, the normalized vibration frequency (
 $f_v/f_n$) should be a better choice to identify the response branches and transitions (Kumar et al. Reference Kumar, Singh and Sen2018). As shown in the inset of figure 3(b), according to the
 $f_v/f_n$ variation with
 $U^*$, two branches, following the terminology in the VIV of an isolated circular cylinder (Williamson & Govardhan Reference Williamson and Govardhan2004), are identified. At
 $U^* < 3.5$, the vibration amplitude is minimal and
 $f_v/f_n$ closely follows the
 $St$ line for
 $\alpha = 0^\circ$, suggesting the desynchronization regime. While at
 $3.5 \le U^* < 5.0$,
 $f_v/f_n$ deviates from the
 $St$ line and becomes constant at a value smaller than 1.0 – a feature of the initial branch of the VIV of a circular cylinder (Singh & Mittal Reference Singh and Mittal2005). It is thus named as the initial branch, followed by the lower branch when
 $U^* \ge 5.0$. However, different from the VIV of a circular cylinder, there is no demarcation via an amplitude/frequency jump between the lower branch and the desynchronization regime for the D-section prism. Moreover, the normalized vibration frequency shows a linear increment with increasing
 $U^*$ and significantly deviates from the natural frequency, even when the vibration amplitude is significant. This is distinct from the frequency variation of a circular cylinder undergoing VIV at the same mass ratio
 $m^* =$ 2.0, that is, the vibration frequency is close to its natural frequency in the lower branch (see the stars in figure 3b). It is worth noting that the excitation of large-amplitude vibration is not necessarily accompanied by the match of the vibration frequency and the natural frequency of a body in vacuum due to the added mass effects (Alam Reference Alam2022). Williamson & Govardhan (Reference Williamson and Govardhan2004) stated that light bodies can conceivably vibrate with large amplitudes at hundreds of times the natural frequency. Also, the VIV response of a very low-
 $m^*$ circular cylinder in the laminar flow regime (Navrose & Mittal Reference Navrose and Mittal2016) shows that the frequency ratio
 $f_v/f_n$ linearly increases in the lock-in region characterized by the large-amplitude vibration when
 $m^* =$ 0.5. However, it is argued that the linearly increasing trend in
 $f_v/f_n$ for the D-section prism is not a fallout of the mass ratio because the adopted
 $m^*$ in this study is significantly larger than those in Navrose & Mittal (Reference Navrose and Mittal2016). Instead, we attribute this phenomenon to the stationary flow separation from the prism and the lacking afterbody. Detailed discussion is presented in § 7.
The significant vibration amplitude of the D-section prism at a small  $\alpha$ is unexpected, considering the absence of the afterbody. It is conventionally believed that the vibration of a D-section prism at
 $\alpha = 0^\circ$ is very weak, or even ceases to exist, due to the lack of the vortex–afterbody interaction. The early wind-tunnel tests proved this at a high mass ratio
 $m^* \sim$ O(
 $10^2$), including Brooks (Reference Brooks1960) and Parkinson (Reference Parkinson1963). However, in the present simulations with
 $m^* = 2.0$, the amplitude of the D-section prism closely follows that of an isolated circular cylinder at
 $4.0 < U^* < 7.0$ (indicated by the star markers in figure 3a). Similar results were also reported in the experimental study of Zhao et al. (Reference Zhao, Hourigan and Thompson2018) at
 $m^* = 6.0$. The above difference indicates the significant influence of
 $m^*$ on the response of the D-section prism, which is discussed in § 7.
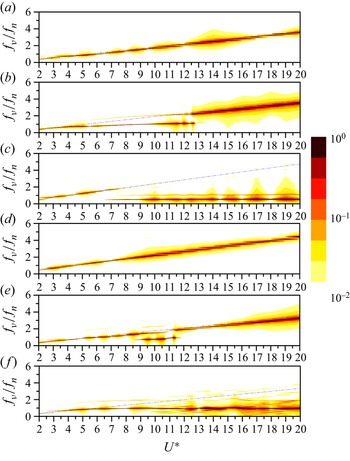
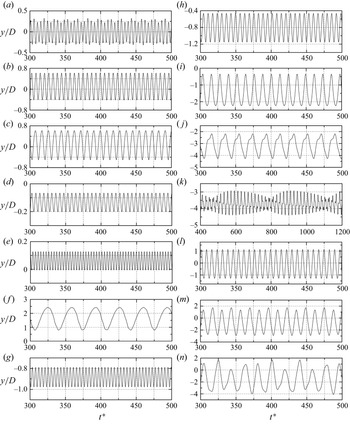
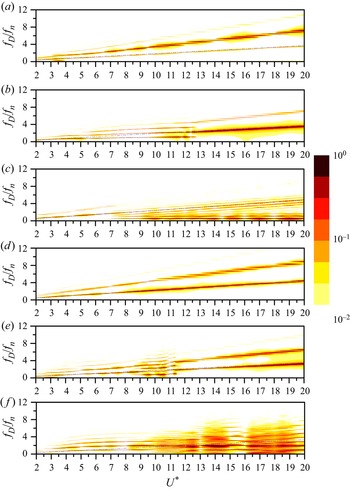
The spectral features of the displacement shown in figure 4(a) indicate that the vibration of the D-section prism in the typical VIV regime is dominated by one frequency, with an exception at  $U^* = 3.5$ where a secondary frequency appears, resulting in a beating-like displacement (figure 5a). Moreover, the spectral regularity suggests that the vortex shedding frequency at each
 $U^*$ equals the vibration frequency. The time history of the displacement in figure 5(b) clearly shows a perfect periodicity.
Power spectral density of the displacement of prism for  $U^* = 2$–
 $20$. (a) Typical VIV at
 $\alpha = 10^\circ$, (b) extended VIV at
 $\alpha = 50^\circ$, (c) combined VIV and galloping at
 $\alpha = 80^\circ$, (d) narrowed VIV at
 $\alpha = 125^\circ$, (e) transition response at
 $\alpha = 155^\circ$ and ( f) pure galloping at
 $\alpha = 170^\circ$, representing the six types of responses marked in figure 2. The power spectral contours are logarithmically scaled. The dash-dotted line in each panel denotes the vortex shedding frequency (
 $St$) of a stationary D-section prism at the same AoA.

Time histories of the normalized displacements at different  $U^*$ and
 $\alpha$ values: (a)
 $U^* = 3.5$ and
 $\alpha = 10^\circ$, (b)
 $U^* = 6.0$ and
 $\alpha = 10^\circ$, (c)
 $U^* = 9.0$ and
 $\alpha = 50^\circ$, (d)
 $U^* = 17.0$ and
 $\alpha = 50^\circ$, (e)
 $U^* = 3.0$ and
 $\alpha = 80^\circ$, ( f)
 $U^* = 18.0$ and
 $\alpha = 80^\circ$, (g)
 $U^* = 7.0$ and
 $\alpha = 125^\circ$, (h)
 $U^* = 7.5$ and
 $\alpha = 155^\circ$, (i)
 $U^* = 11.0$ and
 $\alpha = 155^\circ$, (j)
 $U^* = 17.0$ and
 $\alpha = 160^\circ$, (k)
 $U^* = 18.0$ and
 $\alpha = 160^\circ$, (l)
 $U^* = 7.0$ and
 $\alpha = 170^\circ$, (m)
 $U^* = 13.0$ and
 $\alpha = 170^\circ$ and (n)
 $U^* = 18.0$ and
 $\alpha = 170^\circ$. (a,b) Typical VIV, (c,d) extended VIV, (e,f) combined VIV and galloping, (g) narrowed VIV, (h–k) transition response and (l–n) pure galloping.

3.2. Regime ii: extended VIV
As shown in figure 3(c), in the extended VIV regime ( $\alpha = 40^\circ \text {--}65^\circ$), the large-amplitude vibration region, following the definition in Bourguet & Lo Jacono (Reference Bourguet and Lo Jacono2014), becomes wider with increasing
 $\alpha$. Depending on
 $\alpha$, the response of the prism consists of two or three branches. As shown in figure 3(d), at
 $\alpha = 40^\circ \text {--}45^\circ$, two branches are observed, with the initial branch at
 $3.0 < U^* \le 4.0$ and the lower branch at
 $4.0 < U^* < 7.5$. A desynchronization region exists at
 $7.5 \le U^* \le 20.0$, characterized by linearly increasing
 $f_v/f_n$ and smaller vibration amplitudes. The jump between the lower branch and the desynchronization region is rather sharp. At
 $\alpha = 50^\circ \text {--}55^\circ$, the lower branch exists in a much wider
 $U^*$ region. However, different from that at
 $\alpha = 40^\circ \text {--}45^\circ$, the amplitude at
 $\alpha = 50^\circ \text {--}55^\circ$ decreases gradually in the lower branch with increasing
 $U^*$. At
 $\alpha = 60^\circ \text {--}65^\circ$, the third branch is observed between the lower branch and the desynchronization region. For the
 $\alpha = 60^\circ$ case, the initial branch is at
 $3.0 < U^* \le 4.0$ and the lower branch is in the range
 $4.0 < U^* \le 9.0$, with the maximum amplitude (
 $A^* = 0.72$) being achieved at
 $U^* = 8.0$. Significant amplitude fluctuations with
 $U^*$ are observed in the third branch with the largest
 $A^* (= 0.67)$ occurring at
 $U^* = 12.5$, indicating the variety of wake–prism interactions. For the
 $\alpha = 65^\circ$ case, the third branch appears in a much wider region, i.e.
 $10.5 < U^* < 18.8$. Similar to the third branch at
 $\alpha = 60^\circ$,
 $A^*$ also varies significantly with increasing
 $U^*$, with the largest amplitude (
 $A^* = 1.0$) appearing at
 $U^* = 14.0$. The desynchronization region appears once
 $U^*$ is larger than a critical value,
 $U^* = 14.0$ and 18.8 for
 $\alpha = 60^\circ$ and
 $65^\circ$, respectively. As shown in figure 3(d), the peak
 $A^*$ of the two-branched VIV of the D-section prism is similar to that of a circular cylinder in low-
 $Re$ flow, while the peak
 $A^*$ of the three-branched VIV is comparable to that of a circular cylinder in high-
 $Re$ flow (Khalak & Williamson Reference Khalak and Williamson1999; Zhao et al. Reference Zhao, Leontini, Lo Jacono and Sheridan2014). Although the largest amplitudes are comparable, the vibration region of the D-section prism is much wider than that of the VIV of a circular cylinder at high-
 $Re$ flow (see the results in figure 3c).
As shown in figure 3(d), with increasing  $\alpha$, the resonance
 $f_v/f_n = 1.0$ appears at a larger
 $U^*$. For
 $\alpha = 45^\circ \text {--}65^\circ$,
 $f_v/f_n$ slightly deviates from the corresponding
 $St$ line, similar to the initial branch in the typical VIV regime. However, in the lock-in region consisting of the lower and third (if existing) branches,
 $f_v/f_n$ significantly deviates from the corresponding
 $St$ line and approaches a constant value (figure 3d). For example, at
 $\alpha = 65^\circ$,
 $f_v/f_n$ remains at 0.75 in the range of
 $U^* = 4.0\text {--}18.6$, suggesting a vast lock-in region compared with that in the VIV of a circular cylinder.
The spectral features of the displacement shown in figure 4(b) indicate that at  $\alpha = 50^\circ$, the prism vibration is dominated by the fundamental frequency at
 $2.0 \le U^* < 13.0$ with the second-harmonic frequency dominating after
 $U^* \ge 13.0$. In the lower branch (
 $5.5 \le U^* \le 13.0$), the two frequencies coexist. However, because of the low amplitude of the second harmonic, the displacements are relatively regular in the whole examined
 $U^*$ range (figure 5c,d).
3.3. Regime iii: combined VIV and galloping
As shown in figure 3(e), the amplitude variation at  $\alpha = 70^\circ \text {--}80^\circ$ consists of two distinct types of response. The first is VIV with a small amplitude. With increasing
 $\alpha$, the width of the VIV region grows significantly. At
 $\alpha = 70^\circ$ and
 $75^\circ$, the VIV region ends at
 $U^* = 3.5$ and
 $4.0$, respectively, while at
 $\alpha = 80^\circ$, VIV terminates at
 $U^* = 7.0$. It is expected that as
 $\alpha$ further increases, VIV will dominate the whole
 $U^*$ range, suggesting the presence of pure VIV (see figure 3g). The second is galloping with a much larger amplitude, occurring at a larger
 $U^*$ (figure 3e). In this region,
 $A^*$ increases significantly with increasing
 $U^*$, despite the significant kinks at
 $\alpha = 70^\circ \text {--}75^\circ$ which are associated with the local occurrences of superharmonic lock-in and wake mode changes. Similar features were reported in the experiments on a square prism by Bearman et al. (Reference Bearman, Gartshore, Maull and Parkinson1987), Nemes et al. (Reference Nemes, Zhao, Lo Jacono and Sheridan2012) and Zhao et al. (Reference Zhao, Leontini, Lo Jacono and Sheridan2014), and in the numerical simulations of a D-section prism by Sharma, Garg & Bhardwaj (Reference Sharma, Garg and Bhardwaj2022). Similar to the vibration response of a square prism in Sen & Mittal (Reference Sen and Mittal2011) and Bhatt & Alam (Reference Bhatt and Alam2018), the response of the D-section prism at
 $\alpha = 70^\circ \text {--}80^\circ$ shows a combined feature of both VIV and galloping and is thus named combined VIV and galloping (Cui et al. Reference Cui, Zhao, Teng and Cheng2015). As shown in figure 3(e), for
 $\alpha = 70^\circ$,
 $A^*$ is larger than that for
 $\alpha = 75^\circ$ when
 $U^* < 9.5$. At a larger
 $U^*$,
 $A^*$ of the two cases becomes comparable. However,
 $A^*$ at
 $\alpha = 80^\circ$ is much smaller than that at
 $\alpha = 70^\circ \text {--}75^\circ$, which is caused by the postponed emergence of the galloping response.
As shown in figure 3( f),  $f_v/f_n$ generally follows the
 $St$ line in the VIV region. In the galloping region,
 $f_v/f_n$ for all three
 $\alpha$ cases is almost constant, having a value lower than
 $1.0$ due to the significant added mass effects when a small
 $m^*$ is adopted. With increasing
 $\alpha$, the constant
 $f_v/f_n$ decreases slightly in the galloping region. However, when
 $m^*$ is large,
 $f_v/f_n$ approaches unity. This feature is also observed in galloping of other non-circular prisms (Zhao et al. Reference Zhao, Leontini, Lo Jacono and Sheridan2014; Seyed-Aghazadeh et al. Reference Seyed-Aghazadeh, Carlson and Modarres-Sadeghi2017).
The spectral features of the displacements shown in figure 4(c) indicate that the frequencies in the VIV and galloping regions are different. The displacement has one dominant frequency in the VIV region, which linearly increases with increasing  $U^*$. While in the galloping region, the dominant frequency is independent of
 $U^*$, with a second harmonic being observed. The amplitude of the second harmonic grows gradually with increasing
 $U^*$. Furthermore, time histories of the displacement in the VIV region are periodic (figure 5e). In contrast, in the galloping region, the vibration is not sinusoidal with the appearance of the second harmonic (figure 5f). The vibration period in the galloping region is much more extended than that in the VIV region.
3.4. Regime iv: narrowed VIV
As shown in figure 3(g), at  $\alpha = 85^\circ \text {--}150^\circ$, the amplitude of the D-section prism with increasing
 $U^*$ shows the same behaviour, i.e. first increasing and then decreasing. Similar to typical VIV, two branches, i.e. the initial and lower branches, can be distinguished based on the variations of
 $f_v/f_n$ and
 $A^*$ while the transition from the lower branch to the desynchronization region is smooth. With increasing
 $\alpha$, the largest amplitude grows and appears at a larger
 $U^*$. At
 $\alpha = 85^\circ \text {--}95^\circ$, where the flat surface is almost parallel to the incoming flow, the peak amplitude is insignificant, i.e.
 $A^* = 0.09$. As shown later, the vortices in this configuration are shed further from the prism and give rise to a more minor stimulation to the vibration. At
 $\alpha = 150^\circ$, the largest amplitude is
 $A^* = 0.68$, which is even more significant than the VIV of an isolated circular cylinder (Prasanth & Mittal Reference Prasanth and Mittal2008; Chen et al. Reference Chen, Ji, Xu, Liu and Campbell2015). However, compared with typical VIV, the lock-in regime appears in a much narrower
 $U^*$ range, especially when
 $\alpha$ is small (see figure 3a,g). As a result, this regime is named narrowed VIV. In the desynchronization region as
 $U^*$ is large, the amplitude for each
 $\alpha$ case is constant while the value increases slightly with increasing
 $\alpha$ (figure 3g).
As shown in figure 3(h),  $f_v/f_n$ for each
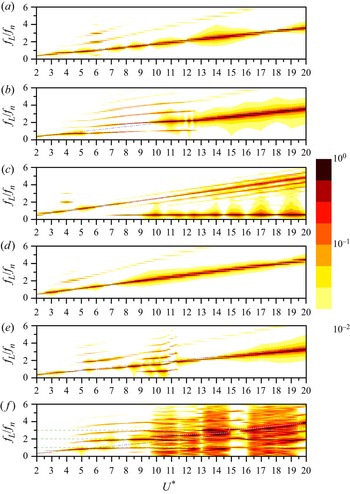
 $\alpha$ case shows a linear increase with increasing
 $U^*$ in the lower branch and the desynchronization regime. Besides, we can see that the
 $f_v/f_n$ slope significantly decreases with increasing
 $\alpha$, which is distinct from the scenario in the typical VIV regime that the
 $f_v/f_n$ lines at different
 $\alpha$ collapse. This can be contributed by the variation of the effective diameter
 $D_e$ with
 $\alpha$ because a smaller prism diameter leads to a higher vortex shedding frequency. Note that, in the narrowed VIV, the
 $f_v/f_n$ lines at different
 $\alpha$ collapse in general if
 $U^*$ is normalized using
 $D_e$ as the reference length scale except at
 $\alpha =85^\circ \text {--}95^\circ$ (results are not shown here). The insufficient scaling with
 $D_e$ indicates that there are other influential factors. For example, it is seen in figure 3(h) that the largest
 $f_v/f_n$ slope is attained at
 $\alpha =95^\circ$, instead of
 $\alpha =90^\circ$ at which
 $D_e$ is the smallest. Moreover, the
 $f_v/f_n$ slope at
 $\alpha =95^\circ$ is slightly larger than that at
 $\alpha =85^\circ$ even though the values of
 $D_e$ are the same in the two cases. It is argued that the flow separation also contributes to the variations in
 $f_v/f_n$, and the
 $f_v/f_n$ slope may depend on the transverse distance between separation points. This is other evidence of the key role played by the flow separation in determining the VIV response of the D-section prism.
As shown in figure 4(d), the spectral features of the displacement in the narrowed VIV are similar to those in the typical VIV, i.e. one dominant frequency which linearly increases with  $U^*$. Furthermore, the time history of the displacement shown in figure 5(g) indicates that the vibration is perfectly periodic, which is also similar to that in the typical VIV regime.
3.5. Regime v: transition response between narrowed VIV and pure galloping
Figure 3(i) shows that the response at  $\alpha = 155^\circ \text {--}160^\circ$ can be divided into regions. At
 $\alpha = 155^\circ$, VIV is observed at
 $2.0 \le U^* \le 9.0$ and
 $11.5 \le U^* \le 20.0$, while the galloping-like response dominates at
 $9.0 < U^* < 11.5$. In the first VIV-like region, consisting of the initial branch (
 $2.0 \le U^* < 4.0$) and the lower branch (
 $4.0 \le U^* \le 9.0$), the amplitude first increases and subsequently decreases with increasing
 $U^*$, peaking (
 $A^* = 0.81$) at
 $U^* = 4.5$. While in the second VIV-like region, the amplitude is constant at a smaller value (
 $A^* \approx 0.18$), signifying the desynchronized response. As shown in figure 3(j),
 $f_v/f_n$ in the VIV-like region linearly increases, following the
 $St$ line, with increasing
 $U^*$. Lying between the two VIV-like regions, the galloping-like region has a contrasting amplitude. The amplitude increases sharply to the largest
 $A^*$ (
 $= 0.94$) and afterwards plummets. In addition,
 $f_v/f_n$ of this region falls back to a value smaller than unity, a frequency feature similar to that in the galloping response. However, we can see that the increasing amplitude cannot persist to a higher
 $U^*$; the galloping is confined. Regarding the
 $\alpha = 160^\circ$ case, the VIV-like region only appears at
 $2.0 \le U^* \le 5.0$ while the galloping-like region dominates the remaining
 $U^*$ range. However, the amplitude does not show a divergent behaviour with increasing
 $U^*$. It is worth noting that for the
 $\alpha = 160^\circ$ case, the amplitudes at
 $U^* = 17.0\text {--}17.5$ are much larger than those of the neighbouring
 $U^*$, a similar behaviour occurring at
 $\alpha = 60^\circ \text {--}65^\circ$ (see figure 3c,i). This is caused by the variations of the separation points. As shown in figure 5(j,k), at
 $U^* = 17.0$, the vibration of the prism is periodic, suggesting a stable vortex–prism interaction, while at
 $U^* = 18.0$, the vibration amplitude changes between small and large values, corresponding a beating response.
The above suggests that the prism response at  $\alpha = 155^\circ \text {--}160^\circ$ has combined VIV and galloping characteristics. However, the amplitude with
 $U^*$ significantly deviates from the typical galloping response. Therefore, the response at
 $\alpha = 155^\circ \text {--}160^\circ$ can be taken as a transition response from narrowed VIV to pure galloping.
The spectral features of the displacement shown in figure 4(e) suggest that the vibration in the VIV-like regions has only one frequency. In contrast, in the galloping-like region several frequencies are observed, with the lowest being dominant. Furthermore, the time history of the displacement shown in figure 5(h,i) indicates that the displacements are regular, especially in the VIV-like region.
3.6. Regime vi: pure galloping
As shown in figure 3(k), at  $\alpha = 165^\circ \text {--}180^\circ$,
 $A^*$ almost monotonically increases with increasing
 $U^*$. This type of response is referred to as pure galloping. Besides, we can see that the vibration for all the
 $\alpha$ cases begins at the examined smallest
 $U^*$ (
 $= 2.0$). The amplitudes of the four
 $\alpha$ cases are almost identical with
 $U^* < 6.0$, and afterwards, the amplitude with a larger
 $\alpha$ is slightly larger (figure 3k). Furthermore, kinks are observed for all the four
 $\alpha$ cases, caused by the lock-in on higher-harmonic frequencies (Bearman et al. Reference Bearman, Gartshore, Maull and Parkinson1987; Nemes et al. Reference Nemes, Zhao, Lo Jacono and Sheridan2012; Zhao et al. Reference Zhao, Leontini, Lo Jacono and Sheridan2014; Sharma et al. Reference Sharma, Garg and Bhardwaj2022). In figure 3(k), the galloping response of a D-section prism at
 ${\textit {Re}} = 1080\text {--}9000$ reported in the experimental study of Zhao et al. (Reference Zhao, Hourigan and Thompson2018) is superimposed. We can see that the amplitudes obtained from the present investigation and those of Zhao et al. (Reference Zhao, Hourigan and Thompson2018) are close to each other when
 $U^* \le 12.5$, which indicates that for the galloping response the Reynolds number has insignificant effects if the reduced velocity is small. After
 $U^* > 12.5$, the amplitude deviation between the present study and that of Zhao et al. (Reference Zhao, Hourigan and Thompson2018) becomes obvious and enlarges with increasing
 $U^*$.
As shown in figure 3(l),  $f_v/f_n$ of the galloping response is close to unity after
 $U^* > 5.5$ while following the
 $St$ line for
 $U^* \le 5.5$. In addition, we can see that
 $f_v/f_n$ in Zhao et al. (Reference Zhao, Hourigan and Thompson2018) is closer to 1.0 as a consequence of a higher
 $m^*$ (
 $= 6.0$) adopted. When compared with the galloping branch at
 $\alpha = 70^\circ \text {--}80^\circ$,
 $f_v/f_n$ is much closer to unity, which is mainly related to the variation of the added mass with the change in the cross-sectional shape with respect to the incoming flow (Sarpkaya Reference Sarpkaya2004).
The spectral features of the displacement shown in figure 4( f) indicate that the galloping response has several frequencies, suggesting complex vortex–prism interactions. At small  $U^*$ (
 $= 2.0\text {--}9.5$), the displacement of each
 $U^*$ has one or two frequencies. At
 $U^*> 9.5$ the displacement spectrum of each
 $U^*$ can be irregular, dominated by several frequencies, or chaotic, such as that for
 $U^* = 17.0\text {--}19.0$. As discussed later, the multiple frequencies are related to the multiple vortices shed from the prism in each vibration period.
4. Flow physics
This section aims to (i) provide the flow physics and shed some light on vortex–prism interactions by showing a map of the wake mode and time evolutions of the displacement, lift and vortex structures and (ii) explore the dependence of the wake modes on the vibration amplitude ( $A^*$) and frequency ratio (
 $\,f_v/f_n$).
4.1. An overview of the wake modes
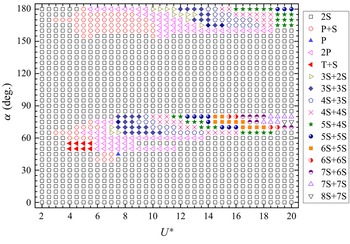
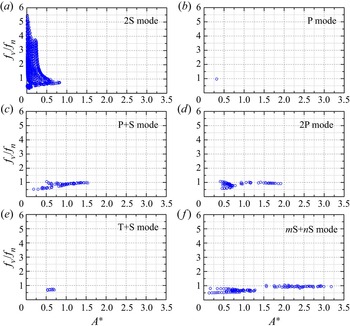
Figure 6 shows the partition of the wake modes in the  $U^*$–
 $\alpha$ parametric plane. We can see that the 2S mode dominates the typical and narrowed VIVs where the vibration amplitude is relatively small. Leontini, Thompson & Hourigan (Reference Leontini, Thompson and Hourigan2006b) found that the wake mode is closely related to the cylinder amplitude, and when the amplitude is smaller than
 $0.85$, the
 $2$S mode dominates, which is consistent with the present results. In the extended VIV, the wake shows the 2S mode when the amplitude is low but displays the
 ${\rm P}+{\rm S}$ mode or the 2P mode when the amplitude is high. There is also another mode,
 ${\rm T}+{\rm S}$, observed only at
 $\alpha = 50^\circ \text {--}55^\circ$. Four vortices are shed from the prism in one vibration period, with three vortices forming a triplet shed at one side of the prism while the remaining one is at the other side. The P mode – two vortices shed from the prism and immediately pair up, generating an inclined trace – exists at
 $\alpha = 45^\circ$ and
 $U^* = 7.5$. The paired vortices distinguish P mode from 2S mode with separated vortices. The wake modes with more than four vortices shed in a vibration cycle are only observed in the galloping regime, suggesting that a large amplitude is required to trigger the multi-vortex mode – the
 $m{\rm S}+n{\rm S}$ mode, where
 $m$ and
 $n$ are integers. That is, when the prism moves in one direction,
 $m$ vortices alternately shed from the prism; when the prism moves the other way,
 $n$ vortices alternately shed from the prism. The vortices arrange in a V-shaped pattern and the vortex number on each wing increases with increasing
 $U^*$ owing to the amplified vibration amplitude. For example, at
 $\alpha = 75^\circ$ and
 $U^* =20$, fifteen vortices shed from the prism in a vibration cycle. Although the amplitude is higher at
 $\alpha = 165^\circ \text {--}180^\circ$, fewer vortices shed from the prism in each vibration cycle. This can be attributed to the higher vibration frequency at
 $\alpha = 165^\circ \text {--}180^\circ$ than at
 $\alpha = 75^\circ$; see figure 3( f,l). However, it should be pointed out here that, in some
 $U^*$ cases, the galloping responses are not regular, and the displacement can vary from one period to another, thus leading to the varying number of vortices shed from the prism. Although
 $m$ and
 $n$ reflect the wake mode, they may change from period to period. In the transition response, the 2S mode dominates the
 $\alpha = 155^\circ$ case, while both
 ${\rm P}+{\rm S}$ and 2P modes dominate the
 $\alpha = 160^\circ$ case, with the latter appearing at higher
 $U^*$.
Wake modes in the ( $U^*$,
 $\alpha$) parameter plane for the FIV of a D-section prism at
 ${\textit {Re}} = 100$ and
 $m^* = 2.0$.

4.2. Excitation/inhibition mechanisms of the prism vibration
In this section, the time evolutions of the wake modes are explored with the aid of time-dependent displacement  $y$ and lift coefficient
 $C_L$, with a view to elucidating the underlying excitation/inhibition mechanisms of the prism vibration. As the transverse vibration of the prism is sustained by the lift force, special attention is paid to the lift coefficient in phase with the prism velocity, which signifies the energy transfer between the fluid and prism. However, it should be pointed out here that the time-averaged lift
 $\bar {C}_{L}$ is induced by the asymmetry of the prism to the incoming flow, which results in the non-zero time-averaged position
 $\bar {y}$ at
 $0^\circ < \alpha < 180^\circ$. The prism oscillation with respect to the time-averaged position, i.e.
 $y^{\prime }$ (
 $=y-\bar {y}$), depends on the energy exchange between the flow and the prism. Following Bourguet & Lo Jacono (Reference Bourguet and Lo Jacono2014), the lift coefficient in phase with the prism velocity is defined as
 $C_{L, V}=({\sqrt {2}(C_{L}-\bar {C}_{L}) V})/{\sqrt {\overline {V^{2}}}}$, with
 $V=\dot {y}$ being the prism velocity. Positive
 $C_{L,V}$ indicates the flow excites the oscillation while negative
 $C_{L,V}$ means the oscillation is damped by the fluid. Therefore, flow physics for the excitation/inhibition caused by the fluid flow can be analysed through the variations of the vorticity contours and the lift component in phase with the prism velocity.
For a stably vibrating cylinder undergoing VIV, it is generally recognized that the net energy transfer over a vibration cycle is zero when  $\zeta = 0$. Specifically, in the initial branch where the total lift force
 $C_L$ is in phase with the vibration displacement, energy is transferred from the cylinder to the fluid flow when the cylinder moves from the top/bottom to the balanced position, leading to a negative
 $C_{L,V}$. On the other hand, the same amount of energy is transferred back to the cylinder when it moves from the balanced position to the top/bottom. The opposite scenario happens when the total lift is in anti-phase with the displacement in the lower branch (Ji et al. Reference Ji, Xiao, Wang and Wang2011). This simple mechanism also applies to the VIV of the D-section prism at
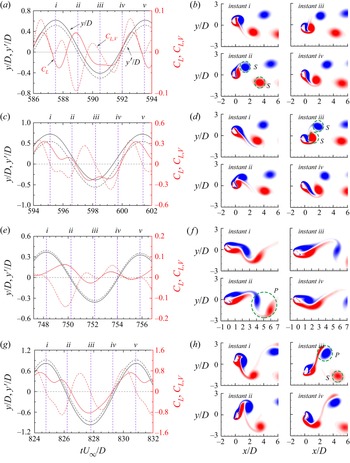
 $\alpha = 0^\circ$, as is shown in § 7. However, when the D-section prism is asymmetric to the incoming flow, the energy-in and -out mechanisms are fundamentally changed. As shown in figure 7(a,b), the wake at (
 $\alpha$,
 $U^*$) = (
 $10^\circ$, 6.0) is in the 2S mode with two vortices alternately shed from the prism in one period. The
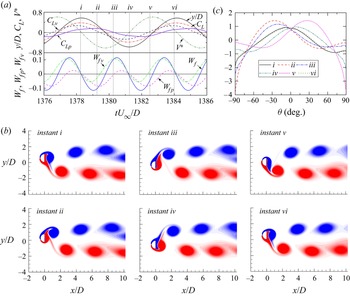
 $C_L$ is dominated by the second-harmonic frequency due to the asymmetric prism configuration. Now, let us focus on half a vibration cycle (instant
 $i$
 $\rightarrow$
 $v$) where the prism moves from the top to the bottom. When the prism is at the top (instant
 $i$), the lower side shear layer of the prism grows and rolls closer to the prism base than the other side shear layer, which leads to a negative
 $C_L$. With the downward moving of the prism, the negative
 $C_L$ inputs energy into the vibration system and accelerates the prism, as indicated by the positive
 ${C}_{L,V}$. Further downward motion of the prism alters
 $C_L$ from negative to positive, and correspondingly,
 $C_{L,V}$ changes from positive to negative, indicating that the vibration of the prism is damped. The largest
 $C_{L,V}$ (negative) is achieved near the balanced position, followed by a small positive peak before the bottom position. Now, we can see that there are two separated power-in regions near the top and bottom positions in this half-cycle. Between them, there exists a power-out region where the prism has a large velocity. As stated in Qin, Alam & Zhou (Reference Qin, Alam and Zhou2017), the dimension of a vortex is proportional to the amount of energy transferred into the wake. From figure 7(b), it is observed that at instant
 $ii$, the anticlockwise vortex (red) rapidly develops in size and strength when the prism passes the balanced position, extracting energy from the vibrating prism. The power-out process terminates and the vortex starts to shed before the prism reaches the bottom at instant
 $iii$.
Time histories of the lift coefficient ( $C_L$ and
 $C_{L,V}$), the displacement (
 $y/D$ and
 $y^\prime /D$) and vorticity contours. (a,b) The 2S mode at (
 $\alpha$,
 $U^*$) = (
 $10^\circ$, 6.0), (c,d) 2S mode at (
 $\alpha$,
 $U^*$) = (
 $35^\circ$, 5.5), (e,f) P mode at (
 $\alpha$,
 $U^*$) = (
 $45^\circ$, 7.5) and (g,h)
 ${\rm P}+{\rm S}$ mode at (
 $\alpha$,
 $U^*$) = (
 $160^\circ$, 5.0). The normalized Z-vorticity is in the range [
 $-$1, 1] with an increment of 0.2. Here,
 $C_L$ is the total lift coefficient,
 $C_{L,V}$ is the lift coefficient in phase with the prism velocity,
 $y/D$ is the displacement and
 $y^\prime /D$ is the displacement with non-zero time-averaged position removed.

However, when the prism moves upward in the second half-cycle (instant  $iii$
 $\rightarrow$
 $v$), there exists only one power-out (bottom
 $\rightarrow$ balanced position) region and one power-in (balanced position
 $\rightarrow$ top) region. This is similar to the power-in and -out mechanisms of the circular cylinder and the D-section prism at
 $\alpha =0^\circ$. However, there is a discrepancy in that the amounts of energy transferred in and out are unequal, resulting in a positive net energy input into the vibrating prism at a non-zero
 $\alpha$.
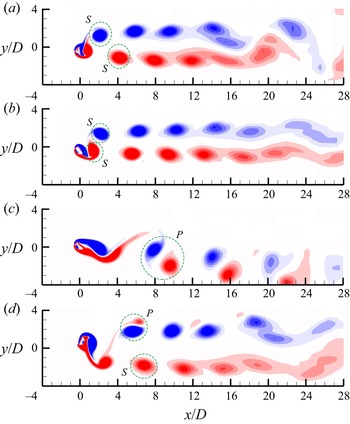
From the aspect of the entire vibration cycle, it is observed that the net energy transferred into the vibrating prism is negative in the first half-cycle while positive in the second one. As a result, the vortices (red) shed from the lower side in the first half-cycle are larger and stronger than those shed from the upper side, leading to a slightly asymmetric vortex shedding pattern in the wake (see figure 8a).
Instantaneous vorticity contours. (a) The 2S mode at ( $\alpha$,
 $U^*$) = (
 $10^\circ$, 6.0), (b) 2S mode at (
 $\alpha$,
 $U^*$) = (
 $35^\circ$, 5.5), (c) P mode at (
 $\alpha$,
 $U^*$) = (
 $45^\circ$, 7.5) and (d)
 ${\rm P}+{\rm S}$ mode at (
 $\alpha$,
 $U^*$) = (
 $160^\circ$, 5.0). The normalized Z-vorticity is in the range [
 $-$1, 1] with an increment of 0.2.

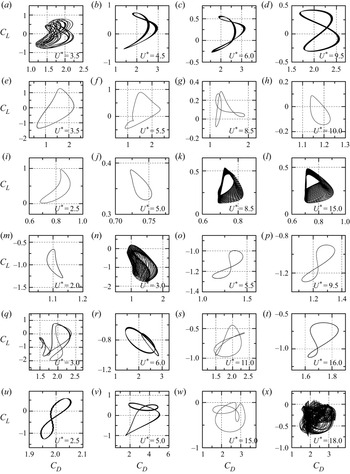
At  $\alpha =25^\circ \text {--}35^\circ$, as shown in figure 7(c), the variation of
 $C_{L,V}$ indicates that the energy is transferred from the prism to the fluid flow when the prism moves from the top/bottom to the balanced position, and vice versa. This is similar to the scenario for the VIV of a circular cylinder and the D-section prism at
 $\alpha =0^\circ$, except that there exist significant fluctuations in the variations of
 $C_L$ and
 $C_{L,V}$. The vortices can be nearly parallel in the wake because the top separation point appears upstream of the bottom one (figure 7d). Figure 8(b) shows the wake mode in a wider view. In the wake, the vortices of the same row coalesce at
 $x/D > 16$ because of the formation of the secondary vortex street (Cimbala, Nagib & Roshko Reference Cimbala, Nagib and Roshko1988; Inoue & Yamazaki Reference Inoue and Yamazaki1999; Kumar & Mittal Reference Kumar and Mittal2012; Thompson et al. Reference Thompson, Radi, Rao, Sheridan and Hourigan2014; Jiang & Cheng Reference Jiang and Cheng2019; Zheng & Alam Reference Zheng and Alam2019; Shi, Alam & Bai Reference Shi, Alam and Bai2020). With the variations of
 $U^*$ and
 $\alpha$, the secondary wake appears at different positions. It should be mentioned here that the secondary street exists much closer to the prism than that (
 $x/D > 100$) in the wake of a circular cylinder (Kumar & Mittal Reference Kumar and Mittal2012; Jiang & Cheng Reference Jiang and Cheng2019). This indicates that the D-section shape may increase the wake instability.
As shown in figure 7( f), at  $\alpha =45^\circ$ and
 $U^*=7.5$, the vortices shed from the prism are paired in a biased wake due to the AoA of the prism (see the wide view in figure 8c). This is named the P mode, with P denoting vortex pairing. This unique and asymmetric wake pattern can be explained by the significant difference in the variation of
 $C_{L,V}$ in each half vibration cycle. As shown in figure 7(e), the energy is mainly transferred from the prism to the fluid when the prism moves from the top towards the bottom (instant
 $i$
 $\rightarrow$
 $iii$) where the vortex pair right behind the prism develops fast in dimension and strength. In the second half (instant
 $iii$
 $\rightarrow$
 $v$), a smaller amount of energy is transferred towards the vibrating prism, compared with that transferred towards the fluid in the first half, and the vortex pair begins to shed at instant
 $iv$. It seems that the vortices from both sides develop in a half cycle and shed in the other one, which results in the asymmetric vortex shedding pattern. Over the entire vibration cycle, the net energy transfer is negative, leading to the reduced vibration amplitude at instant
 $v$.
As shown in figure 7(h), in the  ${\rm P}+{\rm S}$ mode, a vortex pair sheds from the upper side while only a single vortex sheds from the lower side of the prism. The counter-rotating vortex pair have different intensities, with the counterclockwise (red) vortex being much weaker. Besides, the secondary vortex street is also observed in the wake owing to the vortex coalescence (see figure 8d). As shown in figure 7(g), the variation of
 $C_{L,V}$ in one vibration period is similar to that of the 2S mode at
 $\alpha =35^\circ$ and
 $U^*=5.5$, i.e. negative
 $\rightarrow$ positive
 $C_{L,V}$ when the prism moves from one side to the other, suggesting a similar role of the vortices in the prism vibration.
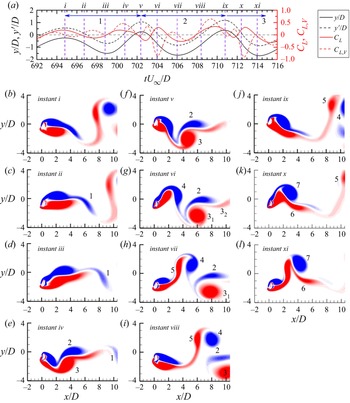
A hybrid mode where the constituent patterns appear is observed in the transition response. Figure 9 shows the time histories of the lift coefficient ( $C_L$ and
 $C_{L,V}$), the displacement (
 $y/D$ and
 $y^\prime /D$) and vorticity contours at different instants with
 $\alpha =160^\circ$ and
 $U^*=9.0$. We can see that when the prism moves from the top to the bottom (instant
 $i$
 $\rightarrow$
 $iii$), because of the cutoff effects of the lower side shear layer, one small vortex (vortex 1) is shed from the upper side of the prism (figure 9b–d). Positive net energy is transferred from the fluid to the prism (figure 9a), resulting in the augmented vibration amplitude at instant
 $iii$. However, when the prism moves back from the bottom to the top (figure 9d–f), two vortices (vortices 2 and 3), one from the upper side and the other from the lower side of the prism, are formed at
 $x/D \approx 5.0$. As the vortices move downstream, the vortex from the lower side separates into two parts (vortices
 $3_1$ and
 $3_2$) with different intensities. Thus, in this period, the wake is
 ${\rm P}+{\rm S}$ mode in the near wake but changes to
 ${\rm T}+{\rm S}$ mode farther downstream. From instant
 $iii$ to
 $v$, the prism continuously extracts energy from the fluid, and the vibration amplitude is further increased.
Time histories of the lift coefficient ( $C_L$ and
 $C_{L,V}$), the displacement (
 $y/D$ and
 $y^\prime /D$) and vorticity contours at different instants marked in (a) for the hybrid mode (P + S/P) at (
 $\alpha$,
 $U^*$) = (
 $160^\circ$, 9.0). The normalized Z-vorticity is in the range [
 $-$1, 1] with an increment of 0.1.

In the following period, the vortex shedding becomes different. When the prism moves from the top to the bottom (figure 9f–h), two vortices (vortices 4 and 5), one from the top and the other from the bottom, are shed from the prism, resulting in a vortex pair in the wake. When the prism moves back from the bottom to the top (figure 9h–j), no vortex sheds. Therefore, the P mode appears. In this period (instant  $v$
 $\rightarrow$
 $ix$), the variation of
 $C_{L,V}$ in the first half-cycle (instant
 $v \rightarrow vii$) is different from that in the second half-cycle, which is consistent with different shapes and intensities of the vortices. In the first half-cycle, the energy is positive around the top and bottom while negative near the balanced position. However, in the second half-cycle, the energy is approximately negative when the prism is below the balanced position while positive when the prism is above. This is similar to the energy-in and -out mechanisms of the D-section prism at (
 $\alpha$,
 $U^*$) = (
 $10^\circ$, 6.0) where the total lift has a frequency twice the displacement, as happened from instant
 $v$ to
 $ix$. However, the vortex shedding pattern is distinct owing to the varying vibration amplitude and the vortex shedding history. When the prism moves from the top to the bottom in the subsequent period (figure 9j–l), another vortex pair forms (vortices 6 and 7). The energy transfer within the time span
 $ix \rightarrow xi$ is similar to that within the time span
 $v \rightarrow vii$, despite that the second positive
 $C_{L,V}$ peak is tiny.
Now, we see that the difference of the vortex shedding modes (instant  $i \rightarrow xi$) is attributed to the amplitude variation. In the first period, due to a smaller amplitude, the
 ${\rm P}+{\rm S}$ mode exists from instant
 $i$ to
 $v$. In the following period, the amplitude increases, and the P mode dominates.
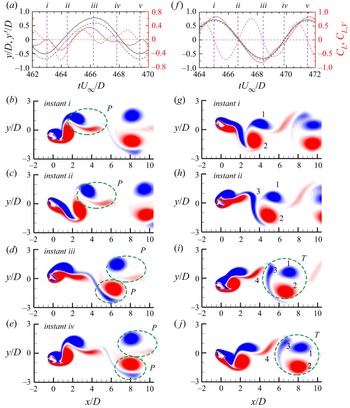
Figure 10 shows the time evolution of the 2P mode at ( $\alpha, U^*$) = (
 $50^\circ, 7.0$) and the
 ${\rm T}+{\rm S}$ mode at (
 $\alpha, U^*$) = (
 $55^\circ, 5.5$). Figure 10(a–e) shows that when the prism moves upward from the bottom, a paired vortex is shed from the lower and upper sides, respectively. Similarly, when the prism moves downward from the top, another vortex pair forms in the wake. In each vortex pair, the strength of one vortex is weaker than that of the other. In addition, because of the asymmetric shape of the D-section prism, the 2P mode also becomes asymmetric to the incoming flow. Interestingly, the 2P mode changes to the
 ${\rm T}+{\rm S}$ mode if
 $\alpha$ and
 $U^*$ are slightly altered. As shown in figure 10( f–j), in the
 ${\rm T}+{\rm S}$ mode, a vortex triplet (vortices 1, 2 and 3) and a single vortex (vortex 4) are shed from each side of the prism when the prism moves upward and downward, respectively. This is caused by the altered vortex shedding timing when
 $\alpha$ and
 $U^*$ are changed, resulting in different vortex pairings. Of note is that although the vibration amplitudes corresponding to the two modes are smaller than the critical value for the 2P mode of a circular cylinder (Williamson & Roshko Reference Williamson and Roshko1988; Williamson & Govardhan Reference Williamson and Govardhan2004), two vortices are shed from each side of the prism. This is mainly caused by the difference in the cross-sectional shape. Comparing figures 10(a) and 10( f), we can see that although four vortices are shed in one vibration period, the variations of
 $C_{L,V}$ are significantly different in the two cases. In the 2P mode, because of the appearance of higher harmonics, the
 $C_{L,V}$ variation is rather irregular while in the
 ${\rm T}+{\rm S}$ mode the
 $C_{L,V}$ variation is approximately sinusoidal.
Time histories of the lift coefficient ( $C_L$ and
 $C_{L,V}$), the displacement (
 $y/D$ and
 $y^\prime /D$) and vorticity contours at different instants for (a–e) the 2P mode at (
 $\alpha$,
 $U^*$) = (
 $50^\circ$, 7.0) and ( f–j) the
 ${\rm T}+{\rm S}$ mode at (
 $\alpha$,
 $U^*$) = (
 $55^\circ$, 5.5). The normalized Z-vorticity is in the range [
 $-$1, 1] with an increment of 0.1.

For elucidating the flow physics of the  $m{\rm S}+n{\rm S}$ mode (
 $m + n \ge 5$,
 $m$ and
 $n$ are integers) that appears in the galloping region, the
 $4{\rm S}+4{\rm S}$ vortex evolutions at
 $\alpha = 175^\circ$ and
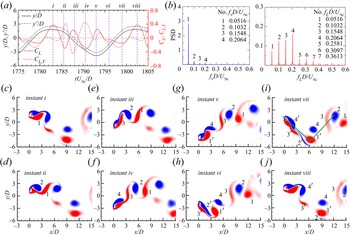
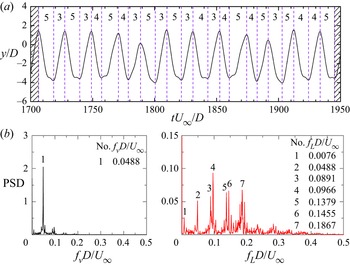
 $U^* = 18.0$ are explored. As shown in figure 11(a), the displacement of the prism has a much longer period than the lift, indicating that galloping response and wake unsteadiness are not synchronized. Upon closer inspection, we can see that the displacement is not symmetric with respect to the mean position, and at the same time, the descending half-cycle has a longer period than the ascending half. Figure 11(b) shows that although there are four frequencies in the displacement spectrum, the dominant one, i.e.
 $f_vD/U_\infty = 0.0516$, has a much larger amplitude than the others. In the lift spectrum, the dominant lift frequency is
 $f_LD/U_\infty = 0.2064$, which is four times larger than the dominant vibration frequency.
(a) Time histories of the lift coefficient ( $C_L$ and
 $C_{L,V}$) and the displacement (
 $y/D$ and
 $y^\prime /D$), (b) the lift and displacement spectra (PSD, power spectral density) and (c–j) vorticity contours of different instants for the
 $4{\rm S}+4{\rm S}$ mode at (
 $\alpha$,
 $U^*$) = (
 $175^\circ$, 18.0). The normalized Z-vorticity is in the range [
 $-$1, 1] with an increment of 0.1. The green lines in (
 $i$) indicate the V-like arrangement of the vortices.

As shown in figure 11(c–j), when the prism moves from the top to the bottom, four vortices (vortices 1, 2, 3 and 4), with two from each side, are shed from the prism in the first half (instant  $i \rightarrow v$). Similarly, when the prism moves upward, another four vortices (vortices
 $1'$,
 $2'$,
 $3'$ and
 $4'$) are shed in the wake (figure 11g–j). Associated with the vortex shedding,
 $C_{L,V}$ varies between positive and negative values alternately. As shown in figure 11(a), the energy is transferred towards the prism when the vortices develop at the lower side of the prism (instants
 $ii$ and
 $iv$) as the prism moves from the top to the bottom, and vice versa (instant
 $iii$). This suggests that the prism vibration is maintained by the pressure difference caused by the attached vortex/shear layer. That is, as the prism moves downward, the development of the lower side vortex leads to a lower pressure at the lower side, promoting the prism vibration. However, when the upper side vortex saturates, the pressure on the upper side becomes lower than that on the lower side, thus dampening the prism vibration. As the prism moves from the bottom to the top, less significant fluctuations are found in
 $C_L$ and
 $C_{L,V}$.
The vortices shed in a vibration period are arranged in a ‘V’ shape (see figure 11i). According to the number of vortices shed from the prism in one vibration period, this mode is named the  $4{\rm S}+4{\rm S}$ mode. Note that the terminology adopted for the galloping wake mode differs from that in Seyed-Aghazadeh et al. (Reference Seyed-Aghazadeh, Carlson and Modarres-Sadeghi2017). In the present study, the number of vortices in each half-period are collected as
 $m$ and
 $n$, while in Seyed-Aghazadeh et al. (Reference Seyed-Aghazadeh, Carlson and Modarres-Sadeghi2017),
 $m$ and
 $n$ are defined as the numbers of vortices shed from each side of the prism in one period. It is of note that when the prism passes through the mean position, the vortices (vortices 3, 4,
 $3'$ and
 $4'$) shed from the prism are weaker than those (vortices 1, 2,
 $1'$ and
 $2'$) shed at the highest/lowest position. When the prism passes through the mean position, the prism motion is faster, and the time for vortex development is thus shorter. Moreover, compared with the four vortices shed in the descending half-cycle, the four vortices shed in the ascending half are slightly smaller and have lower intensities, which is consistent with the shorter period of the ascending motion and the lower
 $C_L$ and
 $C_{L,V}$ amplitude in the ascending half-period (figure 11a).
For the  $U^*$ cases where the vibration is aperiodic, the number of the vortices shed from the prism in each half-period may vary from period to period. To elucidate this, the case of
 $\alpha = 170^\circ$ and
 $U^* = 19.0$ is selected for further investigation. As shown in figure 12(a), the number of vortices in each half-period varies. Generally, we can see that the number in the descending half-period is larger than that in the ascending half-period as a consequence of the longer descending half-period. Furthermore, from the displacement and lift spectra shown in figure 12(b), there is only one dominant vibration frequency, i.e.
 $f_vD/U_\infty = 0.0488$, corresponding to the natural frequency (
 $f_n$) of the prism, while multiple lift frequencies appear, with the smallest peak (
 $f_LD/U_\infty = 0.0076$) being a beating frequency (
 $f_b$) generated due to nonlinear interaction. Other lift frequencies are the linear superpositions of the two frequencies (
 $f_n = 0.0488$ and
 $f_b = 0.0076$), such as
 $0.0891 \approx 2f_n-f_b$,
 $0.0966 \approx 2f_n$,
 $0.1379 \approx 3f_n-f_b$,
 $0.1455 \approx 3f_n$ and
 $0.1866 \approx 4f_n-f_b$. The combination of these incommensurate spectral frequencies is closely related to the irregular vortex structures (Bourguet Reference Bourguet2020).
(a) Time histories of the prism displacement and (b) the displacement and lift spectra (PSD, power spectral density) at ( $\alpha$,
 $U^*$) = (
 $170^\circ$, 19.0). The number of vortices shed in a half-period is given in (a).

4.3. Dependence of wake modes on $A^*$ and $f_v/f_n$


It is generally believed that the vortex shedding pattern strongly depends on the vibration amplitude. Leontini et al. (Reference Leontini, Stewart, Thompson and Hourigan2006a) stated that the 2S mode dominates when  $A^*$ is smaller than 0.85. Beyond that,
 ${\rm P}+{\rm S}$ and 2P modes appear. However, from the above discussions, we can see that the wake mode is also closely related to the vibration frequency
 $f_v$. For example, more vortices are shed from the prism in a vibration cycle at (
 $\alpha$,
 $U^*$)
 $=$ (
 $75^\circ$, 20) with a smaller
 $A^*$ and a lower
 $f_v$ than at (
 $\alpha$,
 $U^*$)
 $=$ (
 $180^\circ$, 20) with a larger
 $A^*$ and a higher
 $f_v$. In this section, the dependence of the wake modes on
 $A^*$ and
 $f_v/f_n$ is further explored.
As shown in figure 13(a), the 2S mode appears when  $A^* < 0.85$, which is consistent with the observation in Leontini et al. (Reference Leontini, Stewart, Thompson and Hourigan2006a). The variation of the envelope generally follows the
 $U^*$–
 $A^*$ curves in the typical and narrowed VIV regimes with the maximum
 $A^*$ at
 $f_v/f_n = 0.8$. The P mode is observed at
 $f_v/f_n \approx 1.0$ with a small
 $A^*$ (
 $= 0.30$), as shown in figure 13(b). Actually, the P mode occurring at (
 $\alpha$,
 $U^*$) = (
 $45^\circ$, 7.5) can be taken as a highly deformed 2S mode due to the asymmetric configuration of the prism. As shown in figure 13(c), the
 ${\rm P}+{\rm S}$ mode is distributed along two
 $f_v/f_n$ lines:
 $A^*$ increases from 0.2 to 0.6 at
 $f_v/f_n \approx 0.5$ while from 0.5 to 1.6 at
 $f_v/f_n \approx 1.0$, which indicates the significant effects of the vibration frequency in determining the vortex shedding pattern. Moreover, it is considered that the
 ${\rm P}+{\rm S}$ mode cannot be provoked at a vibration amplitude as low as
 $A^* = 0.2$ for the VIV of a circular cylinder. However, due to the asymmetric vibration of the prism, the vortex shedding timing can be markedly changed which results in the
 ${\rm P}+{\rm S}$ mode. Compared with the
 ${\rm P}+{\rm S}$ mode, the 2P mode appears at a larger
 $A^*$, as shown in figure 13(d). When
 $A^* < 0.9$, the 2P mode generally appears at two lines, approaching each other with increasing
 $A^*$. However, beyond
 $A^* = 0.9$, the 2P mode occurs only around
 $f_v/f_n \approx 1.0$ with the largest
 $A^* = 1.85$. A further increase in the vibration amplitude will change the 2P mode into the
 $m{\rm S} + n{\rm S}$ mode, with more vortices shed in a period. This is consistent with the experimental results of Jauvtis & Williamson (Reference Jauvtis and Williamson2004) that the 2T mode (defined as the
 $3{\rm S}+3{\rm S}$ mode in this study) was found in the super-upper branch (
 $A^* \sim 1.5$) for a two-degree-of-freedom circular cylinder. Note that there exists an overlapped region (
 $1.55 < A^* < 1.85$) between the 2P and
 $m{\rm S} + n{\rm S}$ modes, corresponding to the critical
 $A^*$ for the mode transition. Obviously, the critical
 $A^*$ shows apparent dependency on
 $\alpha$. Apart from the linear region at
 $f_v/f_n \approx 1.0$, the
 $m{\rm S} + n{\rm S}$ mode is also found at
 $f_v/f_n \approx 0.6$ with a smaller
 $A^*$. This further demonstrated the key roles of the vibration frequency. As shown in figure 13(e),
 ${\rm T}+{\rm S}$ mode is observed at
 $A^* \approx 0.52\text {--}0.7$ and
 $f_v/f_n \approx 0.7$, and it can be taken as a deformed 2P mode due to the asymmetric configuration.
Dependence of the wake modes on  $A^*$ and
 $f_v/f_n$. Here,
 $m{\rm S}+n{\rm S}$ mode (
 $m$ +
 $n$
 $\ge$ 5,
 $m$ and
 $n$ are integers) represents the wake mode where
 $m$ and
 $n$ vortices are shed from the prism in each half-period.

5. Fluid forces
In this section, the variations of fluid forces with  $\alpha$ and
 $U^*$ are discussed in detail. The statistics of fluid forces are given in § 5.1 and spectral analyses of the lift and drag coefficients are presented in § 5.2. The phase lags between the lift and displacement are discussed in § 5.3.
5.1. The statistics of fluid forces
The statistics of fluid forces varying with  $\alpha$ and
 $U^*$ are shown in figure 14. Generally speaking, the time-mean drag (
 $\bar {C}_{D}$) and lift (
 $\bar {C}_{L}$) coefficients are significantly affected by
 $\alpha$ but less by
 $U^*$, judging from the horizontal contour lines in the plots. However, two regions at a similar
 $U^*$ range (
 $\approx 4.0\text {--}8.0$) but with different
 $\alpha$ values show apparent dependency with the reduced velocity. The one with a lower
 $\alpha$ (
 $\approx 0^\circ \text {--}35^\circ$) is mainly within the typical VIV region while the other with a higher
 $\alpha$ (
 $\approx 150^\circ \text {--}180^\circ$) extends over the transition and galloping regions and even part of the narrowed VIV region for
 $\bar {C}_{L}$. The smallest
 $\bar {C}_{D}$
 $(\approx 0.7)$ exists within a horizontal stripe near
 $\alpha = 90^\circ$, owing to the smallest projection width of the prism. Moreover, the variation of
 $\bar {C}_{D}$ in this stripe is negligible, which coincides with the very small vibration amplitudes near
 $\alpha = 90^\circ$ (figure 3g). The mean drag coefficient achieves a local peak
 $\bar {C}_{D} \approx 2.4$ at
 $U^* = 5.5$ and
 $\alpha = 0^\circ$, due to the drag amplification effects of the enlarged vibration amplitude in the typical VIV regime (figure 3a). However, the local peak
 $\bar {C}_{D} \approx 3.2$ at
 $U^* = 5.0$ and
 $\alpha = 180^\circ$ suggests that other factors influence the mean drag in the galloping regime. The distribution of
 $\bar {C}_{L}$ shows two regions, i.e. the positive
 $\bar {C}_{L}$ region at
 $\alpha \le 95^\circ$ and the negative region at
 $\alpha > 95^\circ$, with a sharp transition in the middle. The sign of
 $\bar {C}_{L}$ is mainly determined by the AoA of the prism. That is, when
 $\alpha \le 95^\circ$ the shear layer separating at the upstream corner imposes an upward lift to the prism. Also, the pressure on the upstream part of the curved surface pushes the prism in the positive
 $y$ direction. However, when
 $\alpha > 95^\circ$ the shear layer separates at the downstream corner and the pressure on the flat surface generates a large force in the negative
 $y$ direction. The non-vanishing
 $\bar {C}_{L}$ is clearly reflected by the asymmetric wake modes, such as the P mode and the
 ${\rm P}+{\rm S}$ mode, which introduce unbalanced lift through biased vortex shedding (see figure 8c) or non-identical vortex strengths at the two sides of the prism (see figure 8d). The largest negative
 $\bar {C}_{L}$ is obtained at
 $\alpha \approx 120^\circ \text {--}150^\circ$, while the largest positive
 $\bar {C}_{L}$ exists in two regions, one at
 $\alpha \approx 80^\circ \text {--}90^\circ$ and the other at
 $U^* = 5.5$ and
 $\alpha = 30^\circ$. Comparing the absolute values of
 $\bar {C}_{L}$ in the parametric plane, we found that the largest negative
 $\bar {C}_{L}$ is much larger (approximately four times) than the largest positive one.
Dependence of force coefficients on  $U^*$ (
 $= 2\text {--}20$) and
 $\alpha$ (
 $= 0^\circ \text {--}180^\circ$): (a)
 $\bar {C}_{D}$, (b)
 $C_{D}^{\prime }$, (c)
 $\bar {C}_{L}$ and (d)
 $C_{L}^{\prime }$. The same as in figure 2, different regimes are divided by the dashed (horizontal) lines.

The distributions of the r.m.s. drag ( $C_{D}^{\prime }$) and lift (
 $C_{L}^{\prime }$) coefficients show a clear dependency on both
 $\alpha$ and
 $U^*$. Small values are observed in the majority of the parametric plane while large values are found in two separated regions for both
 $C_{D}^{\prime }$ and
 $C_{L}^{\prime }$. These two regions match well with those where the vibration amplitude of the prism shows an ascending trend in figure 2(a). However, where the vibration amplitude shows a descending trend or keeps invariant, the values of
 $C_{D}^{\prime }$ and
 $C_{L}^{\prime }$ are small. For example, in the narrowed VIV regime, the vibration amplitude peaks at
 $U^*$ (
 $\approx 2.5\text {--}4.25$), which linearly increases with increasing
 $\alpha$, as shown in figure 3(g). Similarly, the distribution of
 $C_{D}^{\prime }$ and
 $C_{L}^{\prime }$ shows a linear ridge in the region, as shown in figure 14(b,d). The largest
 $C_{D}^{\prime }$
 $(\approx 1.3)$ is achieved at
 $U^* = 5.0$ and
 $\alpha = 180^\circ$ while the largest
 $C_{L}^{\prime }$ is achieved at
 $U^* = 3.4$ and
 $\alpha = 180^\circ$.
5.2. The spectral analysis of fluid forces
The dominant drag and lift frequencies at each  $\alpha$ and
 $U^*$ case are shown in figure 15. Clearly, in the typical and narrowed VIV regimes, the normalized lift frequency (
 $f_LD/U_\infty$) is approximately identical to the non-dimensional vortex shedding frequency (
 $St$) of the stationary prism but shows less dependency on
 $U^*$. It is of note that the normalized lift frequency is higher in the narrowed VIV regime than in the typical VIV regime, and gradually decreases with increasing
 $\alpha$ in the range
 $90^\circ < \alpha < 150^\circ$, because the frequencies are normalized using the diameter
 $D$ instead of the effective diameter
 $D_e$. Similar to the vibration frequencies, the lift frequencies for the VIV-like regimes at different
 $\alpha$ collapse in general if
 $D_e$ is taken as the reference length scale. However, the corresponding results are not shown for the sake of the conciseness of the discussion. In the majority of the typical VIV regime, the normalized drag frequency is two times the normalized lift frequency, as in the VIV of an isolated circular cylinder. However, in the narrowed VIV regime, the normalized drag frequency equals the normalized lift frequency. This is because in the narrowed VIV regime, the asymmetry of the prism to the incoming flow is more obvious, and the resultant asymmetric vortex shedding strength leads to the dominant drag frequency being halved (Chen et al. Reference Chen, Ji, Xu and Williams2019b, Reference Chen, Ji, Alam, Xu and ZHANG2022). For the extended VIV, combined VIV and galloping, and pure galloping regimes, the normalized force frequencies are dependent on
 $U^*$. In the lock-in
 $U^*$ range of the extended VIV, the normalized force frequencies decrease with increasing
 $U^*$ and jump back to
 $St$ out of the lock-in region. The normalized drag and lift frequencies are virtually identical due to the reason discussed above. In the combined VIV and galloping regime, the normalized frequencies are smaller than those in the pure galloping regime due to the adopted reference length scale; while in the transition regime, the variations of the normalized drag and lift frequencies are irregular due to the occurrence of multiple frequency components.
Dependence of (a) drag ( $f_{D} D / U_{\infty }$) and (b) lift (
 $f_{L} D / U_{\infty }$) frequencies on
 $U^*$ (
 $= 2\text {--}20$) and
 $\alpha$ (
 $= 0^\circ \text {--}180^\circ$). The same as in figure 2, different regimes are divided by the dashed (horizontal) lines.

Figures 16 and 17 show the drag and lift spectra for each regime at selected  $\alpha$ values. In the typical VIV regime, for most
 $U^*$ cases at
 $\alpha = 10^\circ$, the drag has three dominant frequencies, i.e. the fundamental frequency and its second and third harmonics, with the second harmonic having a larger amplitude than the fundamental (figure 16a). At
 $U^* = 3.5$, three comparable but incommensurate frequencies are observed, consistent with the presence of a beating-type vibration, as shown in figure 5(a). For the lift spectra, except for
 $U^* = 3.5$ and 6.0, one conspicuous frequency emerges (figure 17a). Upon closer inspection, the second and third harmonics coexist at
 $U^* = 6.0$, with the amplitude of the former being larger than that of the fundamental frequency. The dominance of the higher harmonic contributes to the phase between the lift and displacement jumping from
 $0^\circ$ to
 $180^\circ$ (Prasanth & Mittal Reference Prasanth and Mittal2008; Chen et al. Reference Chen, Ji, Xu and Williams2019b). Comparing figures 16(a) and 17(a), the dominant drag frequency doubles the dominant lift frequency, except at
 $U^* = 3.5$ and 6.0. The figure-of-eight phase portrait of the drag and lift coefficients shown in figure 18(a–d) sustains this spectral feature.
The drag spectra of FIV of a D-section prism. (a) Typical VIV at  $\alpha = 10^\circ$, (b) extended VIV at
 $\alpha = 50^\circ$, (c) combined VIV and galloping at
 $\alpha = 80^\circ$, (d) narrowed VIV at
 $\alpha = 125^\circ$, (e) transition response at
 $\alpha = 155^\circ$ and ( f) pure galloping at
 $\alpha = 170^\circ$, representing the six types of response. The dash-dotted line in each panel denotes the vortex shedding frequency (
 $St$) of a stationary D-section prism at the same AoA.

The lift spectra of FIV of a D-section prism. (a) Typical VIV at  $\alpha = 10^\circ$, (b) extended VIV at
 $\alpha = 50^\circ$, (c) combined VIV and galloping at
 $\alpha = 80^\circ$, (d) narrowed VIV at
 $\alpha = 125^\circ$, (e) transition response at
 $\alpha = 155^\circ$ and ( f) pure galloping at
 $\alpha = 170^\circ$, representing the six types of response. The dash-dotted line in each panel denotes the vortex shedding frequency (
 $St$) of a stationary D-section prism at the same AoA. In ( f), the horizontal dashed lines indicate the fundamental lift frequency and its second and third harmonics, respectively, while the broken dashed line indicates the vortex shedding frequency.

The phase portraits of the drag and lift coefficients. (a–d) Typical VIV at  $\alpha = 10^\circ$, (e–h) extended VIV at
 $\alpha = 50^\circ$, (i–l) combined VIV and galloping at
 $\alpha = 80^\circ$, (m–p) narrowed VIV at
 $\alpha = 125^\circ$, (q–t) transition response at
 $\alpha = 155^\circ$ and (u–x) pure galloping at
 $\alpha = 170^\circ$, representing the six types of response.

In the extended VIV regime, the drag coefficient has multiple frequencies at  $\alpha = 50^\circ$; see figure 16(b). Generally, with increasing
 $U^*$, the second and the third harmonics are intensified compared to the fundamental one. When
 $U^* > 11.0$, the second harmonic becomes dominant, while the fundamental and third harmonic disappear gradually with increasing
 $U^*$. Similar to the drag coefficient, the lift coefficient also consists of multiple components, with the fundamental one dominating until
 $U^* > 7.5$ (figure 17b). Consistent with the identical dominant drag and lift frequencies, periodic ‘o’-shaped or like-‘o’-shaped trajectories appear for most
 $U^*$ cases (figure 18e,f,h); an intersected shape is observed at
 $U^* = 8.5$ due to the dominance of the second harmonic in the drag and the fundamental one in the lift (figure 18g).
In the combined VIV and galloping regime, the drag coefficient at  $\alpha = 80^\circ$ is dominated by the fundamental frequency at
 $U^* \le 7.0$ and by a much lower frequency once
 $U^* > 7.0$ (see figure 16c), corresponding to the VIV and galloping branches, respectively. With increasing
 $U^*$, the dominant galloping frequency decreases slightly due to the amplified vibration amplitude, while the VIV frequency remains invariant. As shown in figure 17(c), the lift spectra show similar features to the drag spectra. The phase portrait is ‘o’-shaped in the VIV branch (figure 18i,j) while more like a knitted fabric in the galloping branch owing to multiple frequencies in the drag and lift (figure 18k,l).
In the narrowed VIV regime, the drag spectra show two significant frequencies in most  $U^*$ cases at
 $\alpha = 125^\circ$, with the fundamental frequency having a larger amplitude than the second harmonic. In contrast, the lift spectra only show the fundamental frequency (figures 16d and 17d). The phase portrait shows a slanted figure-of-eight shape (figure 18o,p). At
 $U^* = 3.0$, a very low frequency dominates the drag and the phase portrait is not closed (figure 18n); at
 $U^* = 2.0\text {--}2.5$, the second harmonic becomes insignificant and the ‘o’-shaped trajectory emerges (figure 18m).
In the transition response regime, the features of the drag and lift spectra are different in the VIV and galloping-like branches. As shown in figures 16(e) and 17(e), in the first VIV branch ( $2.0 \le U^* \le 9.0$), both the drag and lift have multiple frequencies, while in the second VIV branch (
 $11.5 \le U^* \le 20.0$), the drag has two frequencies and the lift has one. The trajectory in the first VIV branch is complex but periodic (figure 18q,r), while being figure-of-eight-shaped in the second VIV branch (figure 18t). In the galloping branch (
 $9.0 < U^* < 11.5$), because of the dominance of a low frequency in both the drag and lift, the trajectory becomes complex (figure 18s).
In the pure galloping regime, the drag has multiple frequencies, with the second harmonic being dominant at  $U^* = 2.0$–
 $9.5$ (figure 16f). However, the lift is dominated by the fundamental frequency at
 $U^* = 2.0\text {--}6.0$ but by the second harmonic at
 $U^* = 6.5\text {--}9.5$ (figure 17f). After
 $U^* > 9.5$, the drag and lift spectra become rather irregular. As shown in figure 3(k), the vibration amplitude at
 $\alpha = 170^\circ$ shows a large kink at
 $U^* = 14.5\text {--}16.0$, which may be associated with the local occurrences of lock-in with harmonics (Bearman et al. Reference Bearman, Gartshore, Maull and Parkinson1987; Nemes et al. Reference Nemes, Zhao, Lo Jacono and Sheridan2012; Zhao et al. Reference Zhao, Leontini, Lo Jacono and Sheridan2014; Sharma et al. Reference Sharma, Garg and Bhardwaj2022). To clarify this, the fundamental lift or vibration frequency, and its second and third harmonics are shown by the horizontal dashed lines in figure 17( f). The broken dashed line in figure 17( f) indicates the vortex shedding frequency. It is seen that the vortex shedding frequency overlaps the third harmonic of the vibration frequency within the
 $U^*$ range where the kink exists. This suggests lock-in of vortex shedding with the third-harmonic frequency. As shown in figure 18(u–x), a figure-of-eight-shaped trajectory occurs at small
 $U^*$ and becomes complex but still periodic at intermediate
 $U^*$; at large
 $U^*$, the trajectory becomes chaotic.
5.3. The phase lag between lift and displacement
The phase lag between lift and displacement indicates vortex shedding timing relative to cylinder motion. Bourguet & Lo Jacono (Reference Bourguet and Lo Jacono2014) observed that the phase lag jumps from  $0^\circ$ to
 $180^\circ$ when resonance (
 $f_v = f_n$) happens. In some situations, the phase jump divides vibration branches, such as the upper and lower branches of VIV of a circular cylinder in high-
 $Re$ flows (Williamson & Roshko Reference Williamson and Roshko1988; Williamson & Govardhan Reference Williamson and Govardhan2004). However, in low-
 $Re$ VIV, the vibration branch exhibits a continuous variation as the vibration frequency crosses the natural frequency, as reported in Leontini et al. (Reference Leontini, Thompson and Hourigan2006b) and Prasanth & Mittal (Reference Prasanth and Mittal2008). The phase jump does not happen for pure galloping because the vibration frequency is always smaller than the natural frequency.
Shown in figure 19 is the phase lag between the lift and the transverse displacement in the studied parametric space. It should be mentioned that in the cases with multiple frequencies in the lift, the phase lags are calculated using the lift component with the same displacement frequency. The phase lag can be either  $0^\circ$ or
 $180^\circ$ depending on the combination of
 $\alpha$ and
 $U^*$, and a sharp transition from
 $0^\circ$ to
 $180^\circ$, matching
 $f_v = f_n$, happens. We can see that in the typical VIV regime, the phase jump occurs at a constant reduced velocity
 $U^* = 6.1$ approximately, while in the narrowed VIV regime, a mild increment from
 $U^* = 4.0$ to 6.0 is observed. The critical reduced velocity is close to the value of
 $1/St = 6.0$, with
 $St = 0.167$ being the non-dimensional vortex shedding frequency of a stationary circular cylinder at
 ${\textit {Re}} = 100$. The discrepancy, especially in the narrowed VIV regime, is related to the varying AoA, which alters the transverse width of the D-section prism. The insignificant variation of the critical
 $U^*$ with
 $\alpha$ is in accordance with the linearly increasing vibration frequency in the typical VIV and narrowed VIV regimes. However, in the extended VIV regime, the critical
 $U^*$ significantly increases from 4.5 to 18.6 with increasing
 $\alpha$, signifying that the vortex shedding of a vibrating D-section prism synchronizes to the vibration responses. Of note is that the phase jump at
 $\alpha = 55^\circ$ is slightly earlier than that at
 $\alpha = 50^\circ$, resulting in a small fluctuation in the curve of critical
 $U^*$. In the combined VIV and galloping regime, the phase lag remains at
 $0^\circ$ until
 $U^* = 20$, indicating that the lift is always in phase with the displacement in galloping. This is also true in the pure galloping regime where
 $f_v$ is always smaller than
 $f_n$. In the transition regime, the critical
 $U^*$ for the phase jump shows a sharp increase and after
 $\alpha \ge 160^\circ$, the phase jump disappears.
Phase lags between lift and displacement in the FIV of a D-section prism at different  $U^*$ and
 $\alpha$. The grey and lime regions denote that the phase lag is
 $0^\circ$ and
 $180^\circ$, respectively. Different types of responses are divided by the dashed lines. Regimes (i)–(vi) denote typical VIV, extended VIV, combined VIV and galloping, narrowed VIV, transition response and pure galloping, respectively.

6. Prediction of the galloping instabilities using the quasi-steady analysis
This section applies the quasi-steady approach to explore the precise AoA range for galloping of a D-section prism at  ${\textit {Re}} = 100$. This quasi-steady approach assumes that the fluid force is in phase with the body velocity and the instantaneous driving force acting on the moving body is nearly equal to the static force obtained at the instantaneous angle of flow incidence (Naudascher & Rockwell Reference Naudascher and Rockwell2005). In this approach, the Reynolds number is maintained at
 ${\textit {Re}} = 100$ and the force coefficients, i.e.
 $C_D$ and
 $C_L$, are computed for a stationary D-section prism orientated at different
 $\alpha$ values, thus independent of mass ratio and structural damping.
For a D-section prism with only transverse oscillation, the motion equation is as follows:
 \begin{equation} m \ddot{y}+c \dot{y}+k y= \frac{1}{2} \rho U_{\infty}^{2} D C_{F_{y}}. \end{equation}
Here,  $C_{F_y}$ is the non-dimensional force in the transverse direction. According to the quasi-steady theory developed by Parkinson & Smith (Reference Parkinson and Smith1964), the normalized driving force can be expressed as
 \begin{equation} C_{F_y}=\left.C_{F_{y}}\right|_{\alpha^{\prime}=0}+\left[\left.\left(\partial C_{F_{y}} / \partial \alpha^{\prime}\right)\right|_{\alpha^{\prime}=0}\right] \alpha^{\prime}+\cdots, \end{equation}
where  $\alpha ^{\prime }= \dot {y}/U_{\infty }$ is the AoA caused by the transverse vibration. For motions about the static equilibrium position, the component
 $C_{F_{y}}|_{\alpha ^{\prime }=0}$ can be ignored and we can rewrite (6.1) as
 \begin{equation} m \ddot{y}+\left[c-\frac{1}{2} \rho U_{\infty} D\left(\partial C_{F_y} / \partial \alpha^{\prime}\right)\right] \dot{y}+k y=0. \end{equation}
Considering  $c= 2m\zeta \omega _n$ and
 $k/m=\omega _{n}^{2}$, (6.3) can be expressed as
 \begin{equation} \ddot{y}+2 \omega_{n}\left[\zeta-\frac{\rho U_{\infty} D}{4m \omega_{n}} \frac{\partial C_{F_y}}{\partial \alpha^{\prime}}\right] \dot{y}+\omega_{n}^{2} y=0. \end{equation}
As stated in Paıdoussis, Price & De Langre (Reference Païdoussis, Price and De Langre2010), the threshold of galloping occurs when the quantity in the square brackets equals zero, and therefore the critical inflow velocity is  $U_{c r}=4m \omega _{n} \zeta /[\rho D(\partial C_{F_y} / \partial \alpha ^{\prime })]$. This can be written in a non-dimensional form as
 \begin{equation} \frac{U_{c r}}{f_{n} D}=\frac{8 {\rm \pi}}{\partial C_{F_y} / \partial \alpha^{\prime}} \frac{m \zeta}{\rho D^{2}}. \end{equation}
This dimensionless form is the critical reduced velocity, and therefore the galloping begins when  $U^*$ is larger than
 $U_{cr}^{*}$. In the present simulations, the damping ratio (
 $\zeta$) is zero. As a result, when the galloping presents, it begins at
 $U^* = 0.0$. This is ture for the vibration feature at
 $\alpha = 180^\circ$ that galloping occurs from low
 $U^*$ as indicated by figure 3(k). For significantly asymmetric cases (
 $\alpha = 70^\circ \text {--}80^\circ$), the galloping appears after a critical reduced velocity, for example,
 $U_{c r}{ }^{*} = 4.0$ at
 $\alpha = 75^\circ$, as shown in figure 3(e). This may be attributed to the separated shear layer reattachment on the D-section prism at
 $\alpha = 70^\circ \text {--}80^\circ$ which provides a pressure loading on the afterbody that opposes small transverse disturbances. As stated in Païdoussis et al. (Reference Païdoussis, Price and De Langre2010), such reattachment plays a central role in the characteristics of galloping, which is not considered in the quasi-steady analysis.
The transverse force coefficient can be further decomposed as
 \begin{equation} C_{F_y}={-}C_{L} \cos a^{\prime}-C_{D} \sin a^{\prime}. \end{equation}
Then, we have
 \begin{equation} \frac{\partial C_{F_y}}{\partial \alpha^{\prime}}=\left(C_{L}-\frac{\partial C_{D}}{\partial \alpha^{\prime}}\right) \sin a^{\prime}+\left(-\frac{\partial C_{L}}{\partial \alpha^{\prime}}-C_{D}\right) \cos a^{\prime}. \end{equation}
For small enough  $\dot {y}$, hence small enough
 $\alpha ^{\prime }$, we have
 $\sin \alpha ^{\prime } \approx 0$ and
 $\cos \alpha ^{\prime } \approx 1$. Taking these into (6.7), we have
 \begin{equation} \frac{\partial C_{F_y}}{\partial \alpha^{\prime}}={-}\frac{\partial C_{L}}{\partial \alpha^{\prime}}-C_{D}. \end{equation}
According to the criterion of transverse galloping given in Païdoussis et al. (Reference Païdoussis, Price and De Langre2010), a system is potentially unstable if the quantity in the square brackets of (6.4) is negative. Considering (6.8) and zero structural damping ratio ( $\zeta =0$), the criterion reads
 \begin{equation} \frac{\partial C_{F_y}}{\partial \alpha^{\prime}}={-}\frac{\partial C_{L}}{\partial \alpha^{\prime}}-C_{D}=\beta>0. \end{equation}
Figure 20 shows the variations of  $\beta$ as a function of the AoA (
 $\alpha = \alpha _0 + \alpha ^\prime$), with initial AoA of
 $\alpha _0 = 0^\circ$. As indicated in figure 20,
 $\beta$ slowly increases with
 $\alpha$ and peaks at
 $\alpha = 81^\circ$. After that,
 $\beta$ decreases sharply with
 $\alpha$ and reaches the lowest at
 $\alpha = 94^\circ$. Afterwards,
 $\beta$ increases gradually, and becomes positive when
 $\alpha \ge 160^\circ$. From figure 20, we observe that the galloping occurs at
 $70^\circ \le \alpha \le 85^\circ$ and
 $160^\circ \le \alpha \le 180^\circ$. However, from the simulated results in figure 2, the galloping is only observed in the range
 $70^\circ \le \alpha \le 80^\circ$ and
 $165^\circ \le \alpha \le 180^\circ$. On the one hand, this can be attributed to the larger increment
 $\Delta \alpha = 5^\circ$ in the simulations. However, on the other hand, the discrepancy at
 $\alpha = 85^\circ$ and
 $\alpha = 160^\circ$ suggests that the quasi-steady analysis can only reasonably predict the galloping response, especially for the marginal cases. This is not surprising when considering that this analysis neglects the vortex dynamics caused by the prism vibration (Païdoussis et al. Reference Païdoussis, Price and De Langre2010). Combining the predicted and simulated results, we state that the galloping range for the D-section prism at
 ${\textit {Re}} = 100$ is
 $70^\circ \le \alpha < 85^\circ$ and
 $160^\circ < \alpha \le 180^\circ$, with the upper limit for the first range and lower for the second being approximate values.
The variation of  $\beta$ as a function of the AoA (
 $\alpha$) for the cases with an initial AoA of
 $\alpha _0 = 0^\circ$.

As discussed in § 1,  $m^*$ significantly influences the galloping phenomenon of a non-circular prism. To this end, two representative galloping cases at
 $\alpha = 80^\circ$ and
 $170^\circ$ are selected to explore the effects of
 $m^*$ on the galloping responses of a D-section prism. As shown in figure 21, although the galloping initiates at a higher
 $U^*$ with
 $m^*$ increasing from 2.0 to 20.0, it emerges in all cases, indicating that
 $m^*$ is not a determining factor for the presence of the galloping.
Vibration amplitude of a D-section prism with varying  $m^*$
 $(= 2.0\text {--}20.0)$ at (a)
 $\alpha = 80^\circ$ and (b)
 $\alpha = 170^\circ$.

7. Discussion
7.1. The role of the afterbody
The afterbody plays an important role in exciting vibration responses, as demonstrated in Païdoussis et al. (Reference Païdoussis, Price and De Langre2010). It has been shown that significant vibrations can be excited by the interactions of shear layer/vortex and afterbody, and thus lacking an afterbody may result in no vibration (Bearman & Davies Reference Bearman and Davies1977; Bearman Reference Bearman1984; Naudascher & Rockwell Reference Naudascher and Rockwell2005). The role of an afterbody was first observed by Bearman (Reference Bearman1984). For a D-section prism with the curved surface facing downstream ( $\alpha = 180^\circ$), the boundary layer separates at the intersection points of the curved and flat surfaces, and galloping is excited. However, for a D-section prism with the curved surface facing upstream (
 $\alpha = 0^\circ$), no vibration occurs in the experimental study of Brooks (Reference Brooks1960). Parkinson (Reference Parkinson1989) suggested, for the first time, that an afterbody is required for energizing vibrations. This conclusion was supported by the experimental studies of several researchers (Meneghini et al. Reference Meneghini, Saltara, Fregonesi and Yamamoto2005; Naudascher & Rockwell Reference Naudascher and Rockwell2005).
Therefore, it is widely considered that no significant vibration is excited for a D-section prism with the curved surface facing upstream due to the lack of an afterbody. However, in the recent experiments of Zhao et al. (Reference Zhao, Hourigan and Thompson2018), large-amplitude VIV dominates the responses at  $\alpha = 0^\circ$. They suggested that an afterbody is not essential for exciting significant vibrations, which contradicts the widely accepted conclusion. In our opinion, this discrepancy can be attributed to the mass ratio of the prism adopted in the experimental studies. In the study of Zhao et al. (Reference Zhao, Hourigan and Thompson2018), the experiments were carried out in a water flume, while all the other studies were performed in wind tunnels. This means the mass ratio in the water flume tests is approximately two orders of magnitude smaller than that in the wind tunnel tests. Moreover, in the low-
 $Re$ flow (present study), the typical VIV is initiated at
 $\alpha = 0^\circ$. Now, we can see that the role of the afterbody in exciting significant vibrations is still not fully understood, especially for cases with low
 $m^*$ and low
 ${\textit {Re}}$.
This section discusses the issue: is an afterbody really essential for exciting significant vibrations of a D-section prism? In the experiments of Zhao et al. (Reference Zhao, Hourigan and Thompson2018), the VIV, similar to that of an isolated circular cylinder in high- $Re$ flow, occurs for the D-section prism at
 $\alpha = 0^\circ$. They argued that as the boundary layer separates from the intersection points of the flat and curved surfaces, there is no afterbody. They suggested an afterbody may not be essential for large-amplitude vibrations. This is plausible. According to the investigation of Jiang (Reference Jiang2020), the separation point moves to the front side of a circular cylinder when
 ${\textit {Re}} > 1700$, with the separation angle being smaller than
 $90^\circ$. So, we suspect that in the experiments of Zhao et al., the shear layer separates from the D-section prism at a location upstream of the intersection points. Correspondingly, there does exist a small afterbody that stimulates the vibration response through its interactions with the shear layers, and the afterbody is even larger considering the transverse velocity of the prism and the resultant AoA. However, for the D-section prism with a high
 $m^*$, even though there exists a small afterbody in the high-
 $Re$ experimental tests of Brooks (Reference Brooks1960), Feng (Reference Feng1968), Novak & Tanaka (Reference Novak and Tanaka1974) and Weaver & Veljkovic (Reference Weaver and Veljkovic2005), the vibration remains almost zero as a consequence of a considerable amount of energy input required. From this aspect, the VIV of the D-section prism (
 $\alpha = 0^\circ$) in high-
 $Re$ flow originates from the interaction of shear layer/vortex and afterbody, and it is considered that an afterbody is still necessary for exciting significant vibrations in high-
 $Re$ flow.
In the low- $Re$ case, significant vibrations are observed for the D-section prism at
 $\alpha = 0^\circ$, as shown in figure 3. Due to the low
 ${\textit {Re}}$, the separation point appears at the adjoint points of the D-section prism, and vortices are also shed from these points with no afterbody present, as proved in § 7.2. Therefore, the large-amplitude vibrations of the D-section prism in low-
 $Re$ flow are not related to the interaction of shear layer/vortex and afterbody. A natural question is: what maintains the large vibrations of the D-section prism in low-
 $Re$ flow when the interaction of shear layer/vortex and afterbody is absent? To answer this, time histories of the normalized transverse displacement and velocity of the prism, and the total, potential and vortex-flow lift coefficients (Lighthill Reference Lighthill1986; Govardhan & Williamson Reference Govardhan and Williamson2000; Williamson & Govardhan Reference Williamson and Govardhan2004), together with the corresponding power, are depicted in figure 22(a). Following Govardhan & Williamson (Reference Govardhan and Williamson2000), the potential lift force is the added mass-related force, defined as
 $F_{L p}=-m_{d} \cdot \ddot {y}$, where
 $m_d$ is the displaced fluid mass, and the vortex-flow lift force is due only to the dynamics of the vortex shedding, defined as
 $F_{L v}=F_{L}-F_{L p}$, where
 $F_L$ is the total lift on the prism. Coefficients
 $C_L$,
 $C_{Lp}$ and
 $C_{Lv}$ are the corresponding non-dimensional force coefficients. The instantaneous work done (
 $W_f$) by the fluid in each non-dimensional time step is calculated as
 $W_f = C_L \times d(y/D)$ (Qin et al. Reference Qin, Alam and Zhou2017; Menon & Mittal Reference Menon and Mittal2021). It is seen in figure 21(a) that the phase of the vortex-flow lift coefficient
 $C_{Lv}$, caused by vorticity and viscous effects, leads that of the total lift coefficient
 $C_L$, while the phase of the potential lift coefficient
 $C_{Lp}$, caused by inertial (or added-mass) effects, lags. From figure 22(c), it is observed that at instant
 $ii$ when the maximum positive
 $C_{Lp}$ is achieved, the pressure distribution on the curved surface shows a sharp negative peak at
 $\theta = -90^\circ$ (top corner of the prism). The opposite scenario happens at instant
 $v$ when the maximum negative
 $C_{Lp}$ is achieved. This indicates that the potential lift is a pressure-induced force. Note that the pressure on the flat surface does not contribute to the lift. As shown in figure 22(a), the work done in a vibration cycle by
 $C_{Lv}$ and
 $C_{Lp}$ is non-zero, while the total work done by
 $C_L$ is virtually zero. Specifically, in a vibration period, the work done by
 $C_{Lv}$ is positive, while that done by
 $C_{Lp}$ is negative. This indicates that the vortex-flow lift on the prism surface energizes the VIV of the D-section prism. On the other hand, the potential lift extracts energy from the vibrating prism and dampens the vibration, preventing a further increasing amplitude.
(a) Time histories of the normalized transverse displacement ( $y/D$), the normalized transverse velocity (
 $V^* = V/U_\infty$), the total lift coefficient (
 $C_L$), the potential lift coefficient (
 $C_{Lp}$), the vortex-flow lift coefficient (
 $C_{Lv}$) and the corresponding power (
 $W_f$,
 $W_{fp}$,
 $W_{fv}$) in the case with
 $\alpha = 0^\circ$ and
 $U^* = 5.0$. (b) The normalized Z-vorticity contours at six representative time instants marked by
 $i$–
 $vi$ in (a). The normalized Z-vorticity is from
 $-1$ to 1 with an increment of 0.1. (c) The pressure coefficient distribution along the curved surface.

It is known that the potential force is a pressure-induced force while the vortex-flow force consists of pressure-related and viscous-shearing-related components. To make the excitation mechanism more clear, we decompose the lift in phase with the prism velocity, which energizes the VIV of the D-section prism, into the pressure and viscous components, defined as
 \begin{equation} C_{L, V}^{press}=\frac{\sqrt{2} \tilde{C}_{L}^{press} V}{\sqrt{\overline{V^{2}}}}\quad {\rm and} \quad C_{L, V}^{visc}=\frac{\sqrt{2} \tilde{C}_{L}^{visc} V}{\sqrt{\overline{V^{2}}}}, \end{equation}
respectively (Bourguet & Lo Jacono Reference Bourguet and Lo Jacono2014). Same as  $C_{L,V}$, when the two components are positive, the energy is transferred from the fluid to the prism, and vice versa. As shown in figure 23, in each cycle, the viscous component promotes while the pressure component dampens the prism vibration. This further indicates that the sustenance of the prism vibration comes from the viscous lift – the integration of the viscous shear stress on the prism surface induced by the vortical flow.
Time histories of normalized transverse displacement ( $y/D$), the total lift coefficient (
 $C_L$) and the lift coefficients in phase with the prism velocity
 $(C_{L,V}$,
 $C_{L, V}^{{press}}$ and
 $C_{L, V}^{{visc}})$ in the case with
 $\alpha = 0^\circ$ and
 $U^* = 5.0$. Here,
 $C_{L,V}$ is the total lift coefficient in phase with the prism velocity while
 $C_{L, V}^{{press}}$ and
 $C_{L, V}^{{visc}}$ are the pressure and viscous components of
 $C_{L,V}$, respectively.

It is thus considered that compared with the interaction of shear layer/vortex and afterbody, the viscous lift on the forebody is equally significant in exciting marked vibrations of a D-section prism in low- $Re$ flow. This is consistent with the statements of Menon & Mittal (Reference Menon and Mittal2021) that the vibration for a single cylinder is sustained by the vorticity associated with the boundary layer over the surface. That is, even without an afterbody, the vibration can persist once it is initiated in low-
 $Re$ flow.
To further prove the above theory, we present the VIV amplitude of an elastically supported triangular prism at  $\alpha = 0^\circ$, as shown in figure 24. For a triangular prism at
 $\alpha = 0^\circ$, no afterbody exists, whether it is in high-
 $Re$ flow or low-
 $Re$ flow; the boundary layer separates from the downstream corners of the prism (Derakhshandeh & Alam Reference Derakhshandeh and Alam2019). As a result, the vibration amplitude is negligible in the whole
 $U^*$ range in the high-
 $Re$ experimental tests of Seyed-Aghazadeh et al. (Reference Seyed-Aghazadeh, Carlson and Modarres-Sadeghi2017) (medium
 $m^*$) and Tamimi et al. (Reference Tamimi, Naeeni, Zeinoddini, Seif and Dolatshahi Pirooz2019) (low
 $m^*$), due to the lack of vortex–afterbody interaction. However, in our low-
 $Re$ simulations (
 ${\textit {Re}} = 100$,
 $m^* = 9.24$ and
 $\zeta = 0.0057$), significant vibrations are excited by the viscous lift on the forebody.
The vibration amplitude of freely vibrating triangular and D-section prisms versus  $U^*$. For the VIV of a triangular prism,
 $m^* = 2.7$ and
 $\zeta = 0.0559$ in the water tunnel experiment of Tamimi et al. (Reference Tamimi, Naeeni, Zeinoddini, Seif and Dolatshahi Pirooz2019),
 $m^* = 9.24$ and
 $\zeta = 0.0057$ in Seyed-Aghazadeh et al. (Reference Seyed-Aghazadeh, Carlson and Modarres-Sadeghi2017) and
 $m^* = 9.24$,
 $\zeta = 0.0057$ and
 ${\textit {Re}} = 100$ in the present simulations. For the VIV of a D-section prism,
 $m^* = 6.0$ and
 $\zeta = 0.00151$ in the water tunnel experiment of Zhao et al. (Reference Zhao, Hourigan and Thompson2018),
 $m^* = 11.35$ and
 $\zeta = 0.0036$ in the water flume experiment of Chen et al. (Reference Chen, Zhao, Ji, Srinil and Song2021) and
 $m^* = 6.0$,
 $\zeta = 0.00151$ and
 ${\textit {Re}} = 100$ in the present simulations.

Figure 24 also compares the vibration amplitudes of the D-section prism in the high- $Re$ experiments in Zhao et al. (Reference Zhao, Hourigan and Thompson2018) and Chen et al. (Reference Chen, Zhao, Ji, Srinil and Song2021) and our low-
 $Re$ simulations. Although the responses are comparable, they show different spectral features. In Zhao et al. (Reference Zhao, Hourigan and Thompson2018) and Chen et al. (Reference Chen, Zhao, Ji, Srinil and Song2021), a small afterbody exists and the separation points move along the curved surface. The vibration frequency locks on the natural frequency of the prism in the lock-in region. However, in our low-
 $Re$ simulations, the separation points are fixed at the intersection locations of the flat and curved faces, without an afterbody. The vibration frequency follows the Strouhal frequency even when large-amplitude vibrations are excited. This discrepancy is attributed to the different excitation mechanisms in the high-
 $Re$ and low-
 $Re$ cases, i.e. VIV is excited by the vortex–afterbody interaction in the high-
 $Re$ cases but by the viscous shearing on the forebody in the low-
 $Re$ cases.
Figure 25 summarizes the flow–prism dynamics and vibration responses at different AoA in low- $Re$ flow, trying to bridge the gap between the existence of an afterbody, the mobility of separation points and the characteristics of vibration response. At
 $\alpha = 0^\circ$, as depicted in figure 25(a), the boundary layer separates at the two corners and no afterbody presents on either the upper or the lower sides. Significant vibration is sustained due to the viscous lift on the forebody. The vibration frequency approximately follows the
 $St$ line in the typical VIV regime owing to the fixed separation points. At
 $\alpha = 135^\circ$, the separation at the top corner is similar to that in figure 25(a) while the separation of the lower shear layer resembles that of a circular cylinder with an intact afterbody and an oscillating separation point (figure 25c). Even though a one-side afterbody exists, the vibration frequency still follows the
 $St$ line in the narrowed VIV regime. At
 $\alpha = 45^\circ$, a far afterbody exists near the upper corner on the flat surface due to the closer distance between the flat surface and the shed vortex (figure 25b). The extended VIV response emerges and the vibration frequency locks on the natural frequency due to the interaction of vortex and afterbody/far afterbody. At
 $\alpha = 180^\circ$, the galloping is excited, and an intact afterbody exists on both sides (figure 25d). In summary, an afterbody's existence is not essential but important for the vibration of an elastically supported D-section prism in low-
 $Re$ flow. With a varying AoA, the vibration excitation mechanism changes.
Sketches of different types of responses for the D-section prism. (a) Typical VIV at  $\alpha = 0^\circ$, (b) extended VIV at
 $\alpha = 45^\circ$, (c) narrowed VIV at
 $\alpha = 135^\circ$ and (d) pure galloping (G) at
 $\alpha = 180^\circ$. Note that A., F.A. and N.A. denote afterbody, far afterbody and no afterbody, respectively.

7.2. The role of the separation point
From figure 3(b,h), we can see that in the typical VIV and narrowed VIV,  $f_v/f_n$ exhibits a linear increment in the whole examined
 $U^*$ range even when the vibrations are significant. This is different from the VIV of an isolated circular cylinder and can be attributed to the fixed separation point(s) of the boundary layer from the prism surface. Taking the case with
 $\alpha = 0^\circ$ as an example, we first investigate the variations of the separation points in a vibration cycle. Following Schlichting & Gersten (Reference Schlichting and Gersten2017), the position of separation is determined by the condition that the velocity gradient perpendicular to the wall vanishes at the wall, i.e.
 $\partial u_\tau / \partial n =0$, with
 $u_\tau$ and
 $n$ being the tangential flow velocity and the normal direction, respectively. This definition confirms a zero wall shear stress which is proportional to
 $\partial u_\tau / \partial n$. As shown in figure 26, in a vibration period, the velocity gradient
 $\partial u_\tau / \partial n$ (
 $= \partial u / \partial y$) at the upper intersection point of the D-section prism is maintained positive, which suggests that the boundary layer always separates from the prism at the sharp corner. However, for a circular cylinder, the separation points move along the cylinder surface throughout the vortex shedding cycle (Mei & Currie Reference Mei and Currie1969; Jukes & Choi Reference Jukes and Choi2009; Cagney & Balabani Reference Cagney and Balabani2019). Mei & Currie (Reference Mei and Currie1969) stated that for a vibrating circular cylinder, the vortex shedding frequency significantly depends on the angle displacement range
 $\Delta \theta _{sp}$ of the separation points. This is further proved by the recent high-speed particle image velocimetry observations of Cagney & Balabani (Reference Cagney and Balabani2019). It was observed that when the vibration amplitude is low, the separation points show very little variation for a circular cylinder while they are fixed for a triangular prism, and correspondingly, the vortex shedding frequency closely follows the Strouhal frequency. However, when the vibration amplitude of the circular cylinder is high, a significant motion of the separation points occurs with
 $\Delta \theta _{s p} \approx 30^{\circ }$, which leads to the lock-in between the vortex shedding frequency and the natural frequency of the cylinder. They argued that the ability of the separation points to move was a requirement for the various wake modes that are capable of exciting VIV, and that the absence of VIV for the triangular prism was a result of the sharp corners and the fixed nature of the separation points. Although the above conclusion is made for the streamwise VIV by Cagney & Balabani (Reference Cagney and Balabani2019), we believe the same mechanism also applies to the transverse VIV.
Time histories of the displacement and velocity gradient ( $\partial u / \partial y$) at the upper side intersection point of a D-section prism for
 $\alpha = 0^\circ$ and
 $U^* = 5.0$.

Moving separation points can alter the transverse distance between the vortex formation positions at the two sides of a circular cylinder, especially when the cylinder is vibrating. Because the vortex shedding frequency is inversely proportional to the transverse distance (e.g. a smaller cylinder has a higher vortex shedding frequency, and vice versa), it is believed that a cylinder with movable separation points can gain the ability in modulating its vortex shedding frequency. This can be a rational explanation for the different VIV responses in the low- $Re$ regime in that the vortex shedding frequency of a circular cylinder undergoing VIV deviates from the Strouhal frequency and locks on the natural frequency while that of a D-section/triangular prism with fixed separation points closely follows the Strouhal frequency.
Now, let us focus on the vibration responses at other AoA. As reported in Wu et al. (Reference Wu, Wen, Yen, Weng and Wang2004) and Sen, Mittal & Biswas (Reference Sen, Mittal and Biswas2009), for flow around a circular cylinder in the laminar flow regime ( ${\textit {Re}} = 40\text {--}100$), the time-averaged separation angle of the shear layers is approximately
 $117^\circ \text {--}126^\circ$. That is, when the AoA of a D-section prism at
 ${\textit {Re}} = 100$ is small (
 $\alpha \le 35^\circ$), the two shear layers separate from the prism at the intersections of the curved and the flat surfaces, considering the transverse velocity of the vibrating prism. As a result,
 $f_v$ is fixed at the Strouhal frequency and
 $f_v/f_n$ linearly increases with
 $U^*$, due to the decrease of
 $f_n$ with
 $U^*$. As for
 $85^\circ \le \alpha \le 150^\circ$, one separation point is fixed at the upper corner, and the other periodically swings on the curved surface of the prism (figure 25c). It seems that the swinging separation point on the curved surface does not play a significant role in affecting the vortex shedding frequency, and
 $f_v/f_n$ linearly increases with
 $U^*$.
8. Conclusions
In this paper, we numerically studied the physical features of a transversely vibrating D-section prism in laminar cross-flow at AoA  $\alpha = 0^\circ \text {--}180^\circ$ and reduced velocity
 ${U^* = 2.0\text {--}20.0}$. The Reynolds number, based on the effective diameter, is constant at
 ${\textit {Re}} = 100$ and the mass ratio is
 $m^* = 2.0$. The vibration response with the variations of
 $\alpha$ and
 $U^*$ was investigated, and flow physics for the response was elucidated with the aid of time histories of the displacement, the drag and lift coefficients and vorticity contours. Further, the possible
 $\alpha$ range for galloping instability was investigated using quasi-steady analysis. Finally, the effects of mass ratio, Reynolds number, afterbody and separation points on the prism response were further discussed. The principal findings of the present study can be summarized as follows.
Six types of response with variation of  $\alpha$. Based on the variations of the amplitudes and spectral frequencies, the response is categorized into six different types, i.e. typical VIV at
 $\alpha = 0^\circ \text {--}35^\circ$, extended VIV at
 $\alpha = 40^\circ \text {--}65^\circ$, combined VIV and galloping at
 $\alpha = 70^\circ \text {--}80^\circ$, narrowed VIV at
 $\alpha = 85^\circ \text {--}150^\circ$, transition between narrowed VIV and pure galloping at
 $\alpha = 155^\circ \text {--}160^\circ$ and pure galloping at
 $\alpha = 165^\circ \text {--}180^\circ$. The characteristics of the amplitudes, spectral frequencies and wake modes in each regime are summarized in table 5. In the typical and narrowed VIV regimes, the normalized vibration frequency (
 $f_v/f_n$) approximately follows the
 $St$ line, which is closely related to the fixed separation point on one side or both sides of the prism. In the extended VIV regime, depending on
 $\alpha$, the vibration response can be of two or three branches. In the combined VIV and galloping regime, the amplitude in the VIV branch is insignificant while it significantly increases with
 $U^*$ in the galloping branch. In the pure galloping regime, the vibration amplitude increases gradually with increasing
 $U^*$, with the largest amplitude (
 $A^* = 3.2$) being achieved at
 $U^* = 20.0$ and
 $\alpha = 180^\circ$. In the transition response, the response consists of different branches, showing spectral features of VIV and galloping.
Summary of the responses of a transversely vibrating D-section prism at  ${\textit {Re}} = 100$.

Several wake modes with variations of  $\alpha$ and
 $U^*$. A partition of the wake modes in the
 $U^*$–
 $\alpha$ parametric plane is presented with the smallest increments of
 $\Delta \alpha = 5^{\circ }$ and
 $\Delta U^{*}= 0.1$. We found that the 2S mode dominates the typical and narrowed VIV, except at
 $\alpha = 135^\circ$ and
 $U^* = 5.0$ where the
 ${\rm P}+{\rm S}$ mode appears due to a relatively large amplitude. In the extended VIV, the wake is the 2S mode when the amplitude is low but displays the
 ${\rm P}+{\rm S}$ or 2P mode when the amplitude is high. Multi-vortex
 $m{\rm S}+n{\rm S}$ mode where the vortices are arranged in a ‘V’-like shape is observed in the galloping regime. With increasing amplitude, the number of vortices on each wing increases.
Insights into flow physics of the identified response. In the VIV-like regimes, the vibration frequency equals the vortex shedding frequency, which suggests the synchronization of the prism response and wake unsteadiness. This is the same as that in the VIV of a circular cylinder, including rotating and non-rotating configurations (Bourguet & Lo Jacono Reference Bourguet and Lo Jacono2014). However, depending on  $\alpha$ and
 $U^*$, the excitation and inhibition caused by the fluid on the prism vibration may be significantly different. In the galloping regime, multiple vortices are shed in one vibration period, and correspondingly, no synchronization between the response and wake unsteadiness is observed. The excitation and inhibition in the galloping are closely related to the evolution of the shear layers on both sides of the prism.
Statistics and spectral features of fluid forces in each regime. The mean forces are significantly affected by  $\alpha$ but less by
 $U^*$. The sign of the mean lift is mainly determined by
 $\alpha$, i.e. positive at
 $\alpha \le 95^\circ$ and negative at
 $\alpha > 95^\circ$. However, the fluctuating forces are strongly dependent on both
 $\alpha$ and
 $U^*$. In the typical and narrowed VIV, the normalized lift frequency is close to the
 $St$ of a stationary D-section prism, while in the extended VIV, combined VIV and galloping, and pure galloping, the normalized drag and lift frequencies are dependent on
 $U^*$. In the transition response, the variations of the normalized drag and lift frequencies are relatively irregular.
Galloping instability predicted by quasi-steady analysis. The AoA range for galloping at  ${\textit {Re}} = 100$ is carefully determined by carrying out a quasi-steady analysis with the increment
 $\Delta \alpha = 1^\circ$. We found that galloping occurs in two separated
 $\alpha$ ranges, i.e.
 $70^\circ \le \alpha < 85^\circ$ and
 $160^\circ < \alpha \le 180^\circ$, and there is only a minor deviation against the results using direct numerical simulations.
Effects of  $m^*$ and
 $Re$ on the prism response, and roles of afterbody and separation point. We found that
 $m^*$ shows significant effects on the vibration of the D-section prism at
 $\alpha = 0^\circ$. We explained the apparent differences in the responses between previous wind-tunnel and water-flume experiments and our low-
 $Re$ simulation results. For the first time, we found that in low-
 $Re$ flow, the existence of an afterbody is not essential but important for the VIV of a D-section prism, and the large-amplitude vibration is mainly sustained by the viscous lift on the forebody. Moreover, the mobility of the separation points has significant influences on the modulation of the vortex shedding frequency. When the separation points are fixed, the vortex shedding frequency shows limited variations with increasing
 $U^*$, thus leading to the linearly increasing
 $f_v/f_n$ with
 $U^*$ in the typical VIV regime. However, when the separation points are movable, such as those on the circular cylinder, the vortex shedding frequency can match the natural frequency in a wide
 $U^*$ region.
Acknowledgements
The first author would like to thank Dr H. Ping from Shanghai Jiao Tong University for help with numerical simulations.
Funding
This work was financially supported by the National Natural Science Foundation of China (grants nos. 51779172, 51579175 and 51979186) and the Australia Research Council Discovery Grant (project ID: DP200102804). The simulations were performed on the Tianhe-3 prototype at National Supercomputer Centre in Tianjin.
Declaration of interests
The authors report no conflict of interest.
Appendix A. Governing equations
The governing equations for fluid flow are the incompressible Navier–Stokes and continuity equations defined as follows:
 \begin{gather} \frac{\partial \boldsymbol{u}}{\partial t}+\boldsymbol{\nabla} \boldsymbol{\cdot}(\boldsymbol{u u})={-}\frac{1}{\rho}\boldsymbol{\nabla} p+\boldsymbol{\nabla} \boldsymbol{\cdot}\left(v\left(\boldsymbol{\nabla} \boldsymbol{u}+\boldsymbol{\nabla} \boldsymbol{u}^{t}\right)\right), \end{gather}
 \begin{gather} \boldsymbol{\nabla} \boldsymbol{\cdot} \boldsymbol{u}=0, \end{gather}
where  $\boldsymbol {u}$ is the velocity,
 $p$ is the pressure,
 $\boldsymbol {\nabla }$ denotes the gradient operator and
 $v$ is the kinematic viscosity.
The conservative forms of the second-order Adams–Bashforth temporal-discretized governing equations using the IB method are
 \begin{gather} \boldsymbol{u}^{n+1}=\boldsymbol{u}^{n}+\delta t\left(\frac{3}{2} \boldsymbol{h}^{n}-\frac{1}{2} \boldsymbol{h}^{n-1}-\frac{3}{2} \boldsymbol{\nabla} p^{n}+\frac{1}{2} \boldsymbol{\nabla} p^{n-1}\right)+\boldsymbol{f}^{n+\frac{1}{2}} \delta t, \end{gather}
 \begin{gather} \boldsymbol{\nabla} \boldsymbol{\cdot} \boldsymbol{u}^{n+1}=0, \end{gather}
where  $\boldsymbol {h}=\boldsymbol {\nabla } \boldsymbol {\cdot }(-\boldsymbol {u} \boldsymbol {u}+v(\boldsymbol {\nabla } \boldsymbol {u}+\boldsymbol {\nabla } \boldsymbol {u}^{t}))$ comprises the convective and diffusive terms,
 $\delta t$ is the time-step size and superscripts
 $n+1$,
 $n+1/2$,
 $n$,
 $n-1$ indicate the time steps. Force
 $\boldsymbol {f}$ denotes the extra body force on the Cartesian grid and is determined by setting the velocity consistent conditions
 $\boldsymbol {U}^{n+1}=\boldsymbol {V}^{n+1}$ on the fluid–structure interface, where
 $\boldsymbol{U}^{n+1}$ is the interpolated fluid velocity and
 $\boldsymbol{V}^{n+1}$ is the updated structural velocity. Force
 $\boldsymbol {f}$ is formally evaluated at the time step
 $n+1/2$:
 \begin{align} \boldsymbol{f}^{n+1 / 2} \delta t&=D\left(\boldsymbol{F}^{n+1 / 2}\right)\nonumber\\
&=D\left(\boldsymbol{V}^{n+1}-I\left(\boldsymbol{u}^{n}+\delta t\left(\frac{3}{2} \boldsymbol{h}^{n}-\frac{1}{2} \boldsymbol{h}^{n-1}-\frac{3}{2} \boldsymbol{\nabla} p^{n}+\frac{1}{2} \boldsymbol{\nabla} p^{n-1}\right)\right)\right), \end{align}
where  $\boldsymbol {F}$ is the extra body force on the structure. The interpolation and distribution functions,
 $I$ and
 $D$, suggested in Peskin (Reference Peskin1972) were adopted.
The two-step predictor–corrector procedure is adopted for decoupling the temporal-discretized governing equations.
(i) Prediction step. Calculate the intermediate velocity
$\boldsymbol {u}^{*}$:
(A 6)\begin{equation} \boldsymbol{u}^{*}=\boldsymbol{u}^{n}+\delta t\left(\frac{3}{2} \boldsymbol{h}^{n}-\frac{1}{2} \boldsymbol{h}^{n-1}+\frac{1}{2} \boldsymbol{\nabla} p^{n-1}\right). \end{equation}(ii) Calculate the intermediate pressure
$p^{n, k}$ and body force $\boldsymbol {f}^{n+{1}/{2}, k}$ iteratively. Let $p^{n, 0}=p^{n-1}$, $k=1$ and do the following loop.(a) Update body force
$\boldsymbol {f}^{n+{1}/{2}, k}$:
(A 7)\begin{equation} \boldsymbol{f}^{n+\frac{1}{2}, k} \delta t=D\left(\boldsymbol{V}^{n+1}-I\left(\boldsymbol{u}^{*}-\frac{3 \delta t}{2} \boldsymbol{\nabla} p^{n, k-1}\right)\right). \end{equation}(b) Update the intermediate velocity
$\bar {\boldsymbol {u}}^{k}$:
(A 8)\begin{equation} \bar{\boldsymbol{u}}^{k}=\boldsymbol{u}^{*}+\boldsymbol{f}^{n+{1}/{2}, k} \delta t . \end{equation}(c) Update the intermediate pressure
$p^{n, k}$:
(A 9)\begin{equation} \Delta p^{n, k}=\frac{2}{3 \delta t} \boldsymbol{\nabla} \boldsymbol{\cdot} \bar{\boldsymbol{u}}^{k}. \end{equation}(d) Convergence criteria. If the norm of
$I(\boldsymbol {u}^{*}-({3 \delta t}/{2}) \boldsymbol {\nabla } p^{n, k})-I(\boldsymbol {u}^{*}- ({3 \delta t}/{2}) \boldsymbol {\nabla } p^{n, k-1})$ is smaller than a given tolerance, break the loop.(e) Let
$k = k + 1$.
(iii) Correction step:
(A 10)\begin{equation} p^{n}=p^{n, k}, \boldsymbol{u}^{n+1}=\bar{\boldsymbol{u}}^{k}-\frac{3 \delta t}{2} \boldsymbol{\nabla} p^{n}. \end{equation}


The pressure Poisson equation (A 9) is solved using the BiCGSTAB – biconjugate gradient stabilized method (Van der Vorst Reference Van der Vorst1992) – considering the non-uniform Cartesian grid adopted in the simulations.