Introduction
The primary distribution of trace elements in minerals and the subsequent (re)mobilisation of those elements is relevant for understanding rock-forming processes and critical for accurate age determination of ore-forming events. Rapid advances in microbeam techniques provide ever increasing spatial resolution and greater sensitivity (lower minimum limits of detection) allowing unparalleled insights into grain-scale compositional zoning and how primary patterns are reshaped during subsequent events (e.g. for U–(Pb)–W–Sn–Mo hematite; Verdugo-Ihl et al., Reference Verdugo-Ihl, Ciobanu, Cook, Ehrig, Courtney-Davies and Gilbert2017). Pseudomorphic replacement via coupled dissolution replacement reaction (CDRR; Putnis, Reference Putnis, Oelkers and Schott2009 and references therein) are readily recognisable from preserved complex compositional patterns and are a widespread phenomenon responsible for local-scale mineral transformation and trace-element remobilisation in hydrothermal ores (Cook et al., Reference Cook, Ciobanu, Ehrig, Slattery, Verdugo-Ihl, Courtney-Davies and Gao2017, and references therein).
Numerous examples of pseudomorphic mineral replacement during fluid–rock interaction demonstrate the role of the interface at the reaction front in preserving crystallographic information from parent to reprecipitated phase (e.g. Putnis, Reference Putnis, Oelkers and Schott2009). Thus, in order to determine whether the identified replacement takes place via CDDR, or by other mechanisms, a crystallographic assessment of the relationships between the parent and product phases is necessary (e.g. Xia et al., Reference Xia, Brugger, Chen, Ngothai, O'Neill, Putnis and Pring2009; Macmillan et al., Reference Macmillan, Ciobanu, Ehrig, Cook and Pring2016a).
Comparatively few studies have addressed replacement via CDRR in which the product is the same phase as the parent but with grain-scale modification of the trace/minor element endowment, such as in zoned hematite from the Olympic Dam deposit, South Australia (Verdugo-Ihl et al., Reference Verdugo-Ihl, Ciobanu, Cook, Ehrig, Courtney-Davies and Gilbert2017).
Hematite is demonstrated to be a reliable U–Pb geochronometer, in some cases generating analytical precision (0.05%) comparable to conventional mineral geochronometers such as zircon (Courtney-Davies et al., Reference Courtney-Davies, Tapster, Ciobanu, Cook, Verdugo-Ihl, Ehrig, Kennedy, Gilbert, Condon and Wade2019, Reference Courtney-Davies, Ciobanu, Tapster, Cook, Ehrig, Crowley, Verdugo-Ihl, Wade and Condon2020). The U–Pb systematics of this type of hematite, addressed by microbeam techniques and high-precision isotope dilution thermal ionisation mass spectrometry (ID–TIMS) using microsampled material from U-rich domains (Courtney-Davies et al., Reference Courtney-Davies, Tapster, Ciobanu, Cook, Verdugo-Ihl, Ehrig, Kennedy, Gilbert, Condon and Wade2019), show both the closed and open system behaviour of U–Pb isotopes. These phenomena can be linked to replacement processes, as inferred from the modification of primary crystal zoning, and is relevant for U–Pb age determination of hematite by laser-ablation inductively coupled plasma mass spectrometry (LA-ICP-MS) and other techniques.
The incorporation and release of trace elements in and from minerals depends upon the ability of an individual crystal structure to adjust compositional changes via structural modifications of certain periodicity. Despite the simple composition, five crystal structural modifications of Fe2O3 have been defined from nanoscale studies (Lee and Xu, Reference Lee and Xu2016). Moreover, the structural complexity of Fe2O3 has been described as a homologous series of nFeO⋅mFe2O3 compounds based on experiments at high pressure and temperature (Bykova et al., Reference Bykova, Dubrovinsky, Dubrovinskaia, Bykov, McCammon, Ovsyannikov, Liermann, Kupenko, Chumakov, Rüffer, Hanfland and Prakapenka2016). Such homology is underpinned, in particular, by the formation of non-stoichiometric Fe2O3–x phases (x = 0.2, 0.44) involving oxygen release. Transmission electron microscopy (TEM) studies have shown long-range modulation as ordered O vacancies in various hematite superstructures (Chen et al., Reference Chen, Cvelbar, Mozetič, He and Sunkara2008). Metal substitution has also been invoked as an alternative explanation for TEM data that shows the presence of long-range satellite reflections in high-U hematite (up to 2.6 wt.% UO3; Ciobanu et al., Reference Ciobanu, Wade, Cook, Schmidt Mumm and Giles2013). Recently, another model has been proposed based on ab initio molecular dynamic simulations, in which substitution of U6+ for Fe3+ takes place producing a short-range, two-fold superstructure of hematite (McBriarty et al., Reference McBriarty, Kerisit, Bylaska, Shaw, Morris and Ilton2018).
None of these models has, however, been previously assessed by direct visualisation of atoms in the crystal structure. Such supporting evidence is obtainable using the atomic-scale resolution capabilities of contemporary scanning/TEM (STEM) instrumentation with Z-contrast technique imaging such as high-angle annular dark field (HAADF) STEM (e.g. van Tendeloo et al., Reference Van Tendeloo, Bals, Van Aert, Verbeeck and Van Dyck2012; Ciobanu et al., Reference Ciobanu, Cook, Maunders, Wade and Ehrig2016).
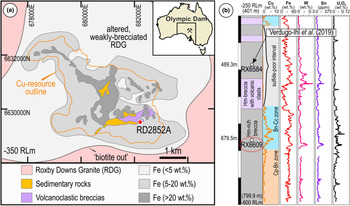
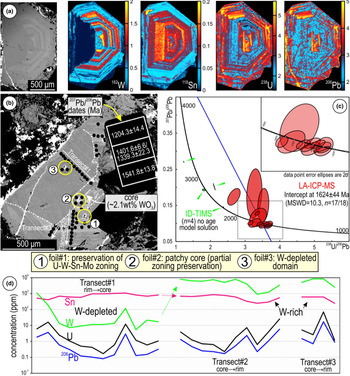
In this study, we employ this technique to assess the incorporation of trace elements into, and their release from, compositionally zoned hematite, in which W (and Sn) is present at higher concentrations than either U or Pb (Verdugo-Ihl et al., Reference Verdugo-Ihl, Ciobanu, Cook, Ehrig, Courtney-Davies and Gilbert2017). The study was carried out on oscillatory-zoned hematite from a bornite–chalcocite-bearing sulfide interval in the SE part of the Olympic Dam deposit (Fig. 1). This sample displays a clear decoupling between W and Sn, whereas U and Pb show relative enrichment in the core and margin but with patchy distribution between them (Fig. 2a; Verdugo-Ihl et al., Reference Verdugo-Ihl, Ciobanu, Cook, Ehrig, Courtney-Davies and Gilbert2017). The ID–TIMS age determination of this grain measured high-common Pb components within analysed volumes, manifest as a non-linear spread of datapoints on a Tera–Wasserburg diagram, where an intercept cannot be formed (Fig. 2b,c; Courtney-Davies et al., Reference Courtney-Davies, Tapster, Ciobanu, Cook, Verdugo-Ihl, Ehrig, Kennedy, Gilbert, Condon and Wade2019).
(a) Sketch of the Olympic Dam deposit outlining the main lithologies and location of sampled drillhole (red dot; RD2852A) projected at the –350 m RL mine grid below surface. Deposit location within Australia shown in inset. (b) Simplified lithology in RD2852A displaying selected element assays. Location of Cu–As-zoned hematite discussed in the text is also shown (sample RX6584). Abbreviations: Bn − bornite; Cc − chalcocite; Cp − chalcopyrite; Hm − hematite.

(a) BSE image and corresponding LA-ICP-MS trace-element maps of the zoned hematite investigated. W and Sn in linear scale (n⋅106); U and Pb are logarithmically scaled (10n). Intensities (counts-per-second, cps) scaled individually to enhance features of interest. (b) BSE image of the same grain re-polished after mapping showing locations of FIB-prepared S/TEM foils. (c) Plot of both LA-ICP-MS and ID-TIMS U–Pb data (modified from Courtney-Davies et al., Reference Courtney-Davies, Tapster, Ciobanu, Cook, Verdugo-Ihl, Ehrig, Kennedy, Gilbert, Condon and Wade2019). LA-ICP-MS age determination of hematite presented on a Tera–Wasserburg diagram (see text for further details), providing a geologically meaningful intercept age, whereas ID-TIMS data from microsampled domains could not form an intercept due to high common Pb content. (d) LA-ICP-MS transects across selected domains as shown in (b).

The high levels of measured common Pb in the ID–TIMS dataset is due to microsampling of material from further below the studied hematite grain, as shown by anomalously high levels of Th/U compared to other zoned-hematite grains, and comparatively low measured proportions of 204Pb in the LA-ICP-MS dataset from the same grain. Therefore, when using the laser ablation method, the smaller analysed volume is a far more representative measurement of true common Pb components in this case. Trace-element remobilisation processes are relevant for understanding the deportment of economically important minor elements but also for modelling ore-forming processes and for interpretation of geochronological data. We have undertaken detailed nanoscale investigations to understand grain-scale heterogeneity, the mechanisms involved, the identity of the reprecipitation products, and how the processes leading to decoupling of parent–daughter isotope pairs took place. The results carry implications for understanding how grain-scale element remobilisation can affect the performance of mineral geochronometers.
Methodology
The sample investigated was re-polished for new micro- and nano-scale analysis after mapping and geochronology (Verdugo-Ihl et al., Reference Verdugo-Ihl, Ciobanu, Cook, Ehrig, Courtney-Davies and Gilbert2017; Courtney-Davies et al., Reference Courtney-Davies, Tapster, Ciobanu, Cook, Verdugo-Ihl, Ehrig, Kennedy, Gilbert, Condon and Wade2019). The new work comprised reflected light optical and scanning electron microscopy using a FEI Quanta 450 instrument in back-scattered electron (BSE) mode to assess the hematite grain in terms of micro-scale textures on the newly polished surface. Several LA-ICP-MS spot analysis transects were conducted to assess quantitatively variation in the concentration of trace elements throughout different grain domains. LA-ICP-MS methodology followed Verdugo-Ihl et al. (Reference Verdugo-Ihl, Ciobanu, Cook, Ehrig and Courtney-Davies2020) using a RESOlution-LR 193 nm ArF excimer laser microprobe coupled to an Agilent 7900cx quadrupole ICP-MS. 57Fe was used as the internal standard element, assuming a stoichiometric Fe content in hematite. External reference materials GSD-1 G and NIST-610 were used for instrument drift correction and trace-element quantification. A laser spot diameter of 43 μm, pulse repetition rate of 5 Hz and fluence of 3.5 J/cm2 were used. Data reduction was performed in Glitter (van Achterbergh et al., Reference van Achterbergh, Ryan, Jackson, Griffin and Sylvester2001). Analysis comprised measurement of 47 isotopes, including four Pb isotopes: 24Mg, 27Al, 28Si, 31P, 43Ca, 45Sc, 49Ti, 51V, 52Cr, 55Mn, 59Co, 60Ni, 63Cu, 66Zn, 69Ga, 75As, 88Sr, 89Y, 90Zr, 93Nb, 95Mo, 118Sn, 121Sb, 137Ba, 139La, 140Ce, 141Pr, 146Nd, 147Sm, 153Eu, 157Gd, 159Tb, 163Dy, 165Ho, 166Er, 169Tm, 172Yb, 175Lu, 178Hf, 181Ta, 182W, 204Pb, 206Pb, 207Pb, 208Pb, 232Th and 238U.
Three thinned foils (~20 μm × ~6 μm × ~100 nm in dimension) were prepared using procedures for dual-beam FIB-SEM methods as outlined in Ciobanu et al. (Reference Ciobanu, Cook, Utsunomiya, Pring and Green2011) using an FEI Helios Nanolab 600 instrument. HAADF STEM imaging and energy-dispersive X-ray (EDX) spectrometry, in both spot analysis and mapping modes, were conducted with an ultra-high resolution, probe-corrected FEI Titan Themis S/TEM operated at 200 kV. This instrument is equipped with an X-FEG Schottky source and Super-X EDX geometry. The Super-X EDX detector provides geometrically symmetric EDX detection with an effective solid angle of 0.8 sr. Probe correction delivered sub-Ångstrom spatial resolution and an inner collection angle greater than >50 mrad was used for HAADF imaging with a Fischione detector.
Indexing of Fast-Fourier-Transform (FFT) patterns was conducted using WinWulff © (version 1.6) and publicly available data from the American Mineralogist Crystal Structure Database (http://rruff.geo.arizona.edu/AMS/amcsd.php). Crystal structure models and the superstructure was built using CrystalMaker® (version 10.2). STEM simulations were obtained using xHREMTM (version 4.1). All instruments are housed at Adelaide Microscopy, The University of Adelaide.
Results
Grain-scale characterisation: textures, FIB sampling and trace-element data for hematite
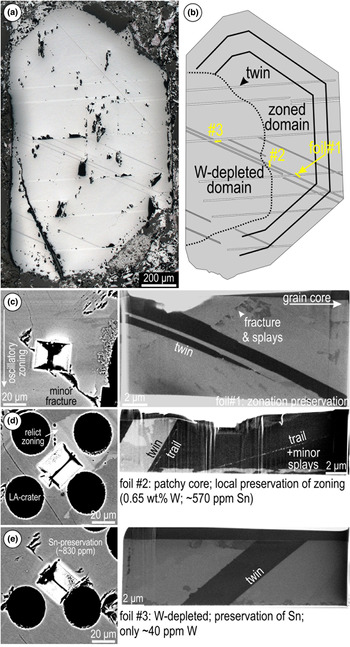
The analysed hematite occurs as a single, euhedral grain and is unusually coarse (millimetre-sized) relative to the fine-grained hematite in the surrounding breccia matrix (Fig. 3a). Two sets of twins are observed, both cross-cutting the boundary with the W-depleted domain, which is, nonetheless, marked by micro-textures such as an abundance of pores/inclusions and fractures. Nanoscale sampling by FIB-SEM targeted the grain-scale textural variation across this boundary: (1) directly across the zoning; (2) addressing partially preserved zoning within the patchy core; and (3) within the W-depleted domain (Fig. 3b). Twin planes with a width of a few micrometres are intersected at depth in each foil (Fig. 3c–e). In the patchy core, trails of sub-micrometre inclusions occur either parallel to the twin plane or dipping towards it (see below).
(a) Reflected light image of hematite after re-polishing and (b) sketch showing distribution of main sets of twins and studied domains. (c–e) BSE images of extracted S/TEM-foil locations and corresponding foils imaged in secondary electron (immersion mode) showing relevant textures in hematite.

Trace-element LA-ICP-MS data (Fig. 2d; Supplementary Material 1, Table S1) show compositional variation between the W-rich and -depleted domains. Transects collected along compositional zoning, as well as individual analyses on the patchy zoning in the core, show distinctly high W, typically >2500 ppm (maximum 8640), and one order of magnitude lower Sn concentrations (≳250 to ~860 ppm); the two elements are positively correlated. Across the W-depleted domain however, the transect shows that Sn remains relatively unaffected, displaying similar concentration ranges (420–1100 ppm) as in the high-W domains whereas W is markedly lower (<100 ppm). A comparison between concentration values obtained along the transects indicates W-depletion by roughly three orders of magnitude (Fig. 2d). Uranium and Pb concentrations do not differ significantly between these two domains, being typically <26 and 6 ppm, respectively, although both appear to be slightly more enriched wherever zoning is preserved.
HAADF STEM imaging and trace-element distributions at the nanoscale
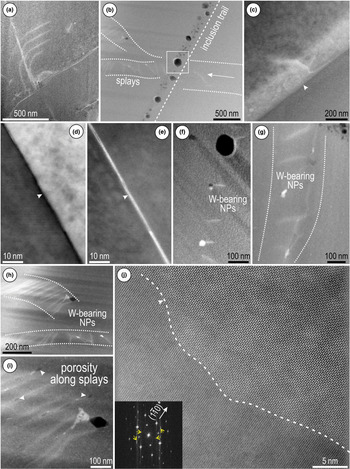
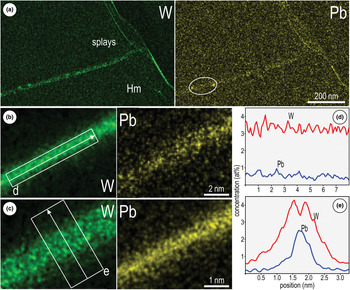
The twin planes are associated with splays (appearing brighter on HAADF STEM images), branching to nm-size fractures or across inclusion trails (Fig. 4a–c). However, relative enrichment in W–Pb (see below) occurs along the twin plane only in the area furthest away from the targeted replacement boundary (foil #1; Fig. 4d,e). The direction or trace of the twin within the plane of view is defined hereafter as the twin crest. Tungsten-bearing nanoparticles (W-NPs) are present associated with splays in both locations outside the W-depleted domain (i.e. the zoned area and the patchy core; foils #1 and #2; Fig. 4f,g). These W-NPs are concentrated along dense, short sets of splays within bands, up to 200–300 nm wide, in the patchy grain core (foil #2; Fig. 4h,i). They are distinct from the coarser inclusions (up to ~100 nm in diameter) along the trails (Fig. 4b), which have different compositions. Unlike in the other locations, twins within the W-depleted domain display locally developed scalloped-shaped crests (Fig. 4j) and lack measurable enrichment in trace elements.
HAADF STEM (a–c, e–j) and BF STEM (d) images of hematite from the three sampled domains. (a) Splays (brighter on image) oblique to minor twin. (b) Inclusion trail showing bimodal size distribution crosscutting splays. (c) Splay at twin plane interface (arrowed) in the W-depleted domain. (d, e) Twin imaged in BS and HAADF STEM modes showing W–Pb-enrichment along the crest (arrowed). (f) W-bearing NPs associated with splays. (g) W-bearing NPs associated with splays along band (dotted line) close to inclusion trail in the patchy grain core (foil #2). (h, i) W-bearing NPs and pores (arrowed) along bands delineating parallel sets of splays. (j) Scalloped boundary at the twin interface (dashed line) in the W-depleted domain. FFT pattern (inset) shows twinning along 〈 $ {1\bar{1}0} $〉 directions (twin reflections marked by yellow arrows) on
 $\lsqb {2\bar{2}1} \rsqb _{{\rm Hm}}$ (orientation for the upper side).

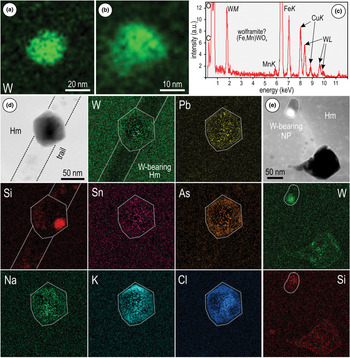
STEM EDX mapping indicates measurable concentrations of W and Pb along both splays and twin crests in the zoned area (foil #1), with higher concentrations of W relative to Pb (Fig. 5a–c). Although both elements are evenly distributed along the twin crests, both Pb and W are preferentially concentrated in the middle and sides of these crests, respectively (Fig. 5d,e). However, the W-NPs occurring along splays adjacent to such twins (Fig. 4f) show no measurable Pb (Fig. 6a–c). Inclusions along the trails (foil #2) display various element associations, including small Si-rich domains within a matrix containing elevated concentrations of Cl, K and Na (Fig. 6d). Tungsten, Pb, Sn, and As concentrations are low and erratic throughout these inclusions. The trails hosting the inclusions are depleted in W relative to the host hematite (Fig. 6d). The W-NPs from splays adjacent to the trails in the same patchy core (foil #2) also show some measurable Si (Fig. 6e), which is not seen in those W-NPs from hematite in which zonation is preserved (foil #1; Fig. 6a–c).
(a) STEM-EDX maps of hematite (Hm) from the area preserving zoning (foil # 1) showing W–Pb-enrichment along splay (a) and twin crest (b, c). (d, e) STEM-EDX profiles obtained along and across the twin-crests in (b) and (c) as marked showing the relative concentrations and distribution of the two elements.

STEM-EDX maps of NPs and inclusions within hematite (Hm) from foil #1 (a, b) and foil # 2 (d, e). (a, b) W-bearing NPs attached to the splays shown in Fig. 4f. (c) EDX spectrum of a W-bearing NP showing Mn as a minor element associated with Fe, suggesting wolframite as a species within the NPs. (d) Euhedral inclusion in hematite (Hm) along the trail shown in Fig. 4b (area marked by rectangle) displaying a complex element association (Na, K, Cl) indicative of fluid inclusions and attached Si-NPs. Note presence of W and Pb within the inclusion but not along the trail. (e) W-bearing NPs attached to a Si-bearing pore typical of splays in hematite from the patchy core. Note Si and W are also mapped within a larger cavity at the end of the splay.

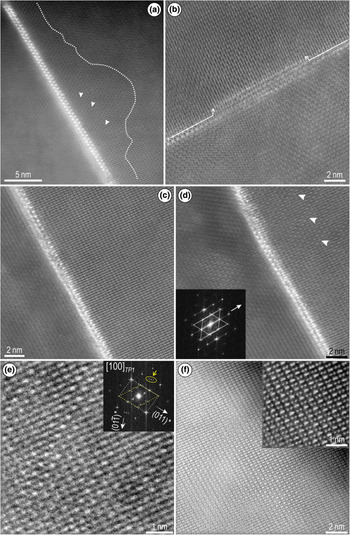
High-resolution imaging of hematite shows a range of defects, including subtle lattice misorientations and localised crystal structural modifications relative to adjacent twin planes (Figs. 7, 8). A direct correlation is observed between the W–Pb-bearing, minor twins and lattice-scale modifications in hematite (Fig. 7). These effects are observed within irregular halos adjacent to the twin crest (Fig. 7a). The width of twin crests varies and locally displays dilation (open space) along its direction, features which are associated with loss of HAADF signal intensity (Fig. 7b,c). Misorientation directions in hematite can also be expressed as sets of ‘shears’ oblique to the twin plane (Fig. 7d). The shears are associated with variation in atom brightness and with satellite reflections displaying long-range modulation on Fast Fourier Transform (FFT) patterns (Fig. 7e and inset). There is however a wider spectrum of lattice modifications within nanodomains along the margins of the twin (Fig. 7f and inset).
HAADF STEM images showing details of W–Pb-enriched twin planes on  $\lsqb {12\bar{1}} \rsqb _{{\rm Hm}}$ undergoing superstructuring to
 $\lsqb {1\bar{1}1} \rsqb_T$ from areas with preserved zonation (foil # 1). (a) Halo (dotted line) imaged on one side of the twin crest displaying defects as darker strips (arrowed) with irregular distribution. Note this is the narrowest twin crest as a tight ‘zip’ between two-bright atoms (W, Pb). (b, c) Local dilation (arrowed) along the twin crests leading to open spaces between the two ‘zipped’ bright atoms. (d) Defects as sets of periodic shears (arrowed) within hematite. FFT pattern (inset) shows disorder along
 $\lpar {\bar{2}10} \rpar $* ≡
 $\lpar {0\bar{1}1} \rpar_T$* associated with such shears. Twin motifs highlighted by dotted lines. (e) Image and FFT pattern (inset) showing details of shear-modulation from hematite in (d). Dashed lines show the basic motif on [100]T in white and superimposed rhombic motif in yellow. Long-range wave-modulation along (011)* shown as groups of satellite reflections arrowed and circled. (f) Twin side displaying superstructuring with domains displaying enhanced intensity variation of alternating Fe atoms dumbbells (inset). See text for additional explanation.

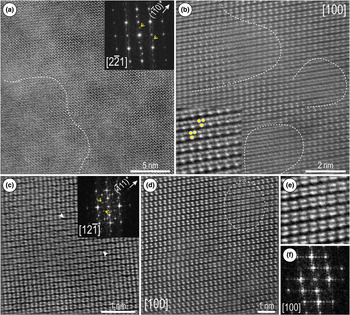
HAADF STEM images of hematite (Hm) from the W-depleted domain on zone axes as marked (using hexagonal axes) and showing lattice-scale defects and partial superstructuring. (a) Domain with superstructuring on  $\lsqb {2\bar{2}1} \rsqb _{{\rm Hm}}$ zone axis (dashed line) showing bands (image) and satellite reflections (arrowed). (b) Defects on [100]Hm within domains marked by a dashed line showing splitting of Fe columns (inset, marked as dots) by screw dislocations. (c) Widening ‘gaps’ between adjacent rows of Fe dumbbells (arrowed) imaged on
 $\lsqb {12\bar{1}} \rsqb _{{\rm Hm}}$ producing satellite reflections with modulation on
 $\lpar {\bar{1}11} \rpar $* imaged (arrowed on FFT, inset). (d, e) Atom-stretching defects (dashed line on (d)) on [100]Hm. (f) FFT pattern corresponding to images in (d) and (e).

In the W-depleted area, lattice distortions and defects are observed on either side of major twin planes (Fig. 8). Misorientation in hematite occurs as domains a few nanometres in size displaying subtle variation in contrast and development of stripes throughout the images (Fig. 8a). In detail, nm-wide defects are recognisable as atom displacements induced by screw dislocations (Fig. 8b and inset). Additionally, gaps of darker contrast occur between the cation arrays (bright dots), depicted as periodic defects by satellite reflections with wave-modulation on FFT patterns (Fig. 8c and inset). In contrast, nm-wide defects displaying atom stretching are identified from images with no effects on FFT patterns (Fig. 8d–f).
Two-fold hematite superstructure with oxygen vacancies
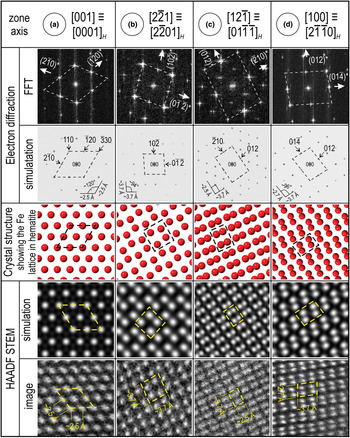
In order to understand whether the observations could be reconciled with crystal structural modifications of hematite, including development of superstructures, the samples were imaged by tilting each specimen on multiple main zone axes. The zone axes used for STEM simulations and crystal structure models were obtained from indexing of FFT patterns, which were in turn assessed against simulated electron diffractions (ED; Fig. 9). HAADF STEM images of least affected hematite show good fits with the simulations and crystal structure models. The latter indicate that the bright dots on all zone axes imaged here correspond to columns of equal number of Fe atoms, thus no intensity variation should be expected on the HAADF STEM images (Fig. 9).
(a–d) Assessment of atomic arrangements on HAADF STEM images obtained from hematite oriented on four main zone axes as marked. For simplicity, indexing of hematite with hexagonal axes (space group  $R\bar{3}c$) is shown with three indices but the corresponding four index hexagonal (H) zone axis is also given. Crystal structure used for models from Maslen et al. (Reference Maslen, Streltsov, Streltsova and Ishizawa1994). The main repeating motif for each zone axis is marked by dashed lines.

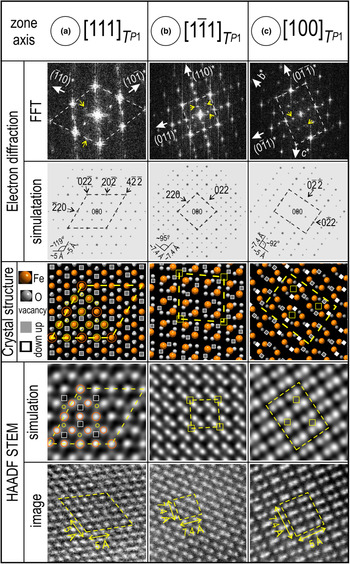
The three zone axes shown in Fig. 9a–c can also display a variation in signal intensity that correlates with the appearance of satellite reflections on FFT patterns (Fig. 10). We observed that in each of these cases, the satellites occur at ½ distance to the main reflections, thus suggesting two-fold superstructures. Because such images were obtained from both W-bearing and -depleted hematite, we assume that vacancies in the oxygen sites could play the main role in the observed changes, rather than metal substitution for Fe. This is especially clear in areas adjacent to the W–Pb-crests shown in Fig. 7.
(a–c) Two-fold superstructure with oxygen vacancies in hematite on zone axes as indicated. The three zone axes shown represent a trigonal primitive cell (T) indexed using rhombohedral axes, defined as: a = b = c = 10.85 Å; α = β = γ = 55.28°. The main repeating motif for each zone axis is marked by dashed lines. Note they represent 2 × wider 2 motifs relative to corresponding zone axes in hematite from Fig. 9a–c. Yellow circles and squares show the ‘phantom’ effects induced on HAADF STEM simulations and images.

For simplicity, we used [001] ≡ [0001]H (space group  $R\bar{3}c$ with hexagonal axes) zone axis which shows alternating Fe–O–O–Fe atoms along 〈100〉, 〈010〉 and 〈
 $ {1\bar{1}0} $〉 vectors (Supplementary Material 2, Fig. S1). After building a two-fold superstructure of hematite as a trigonal primitive cell (T) with rhombohedral axes, defined as: a = b = c = 10.85 Å; α = β = γ = 55.28°, the same metal–oxygen arrays are present on 〈
 $ {1\bar{1}0} $〉 and conjugate directions on the corresponding [111]T zone axis (Supplementary Material 2, Fig. S1a). We create arrays of Fe–O–v–Fe–v–O–Fe by removing corresponding O column clusters from the aforementioned directions within the extended structure (Supplementary Material 2, Fig. S1b). For simplicity, no Fe or O positions were modified. We use the crystallographic information obtained (Supplementary Material 3) representing the two-fold superstructure simulations of ED and STEM patterns (Fig. 10). There is a good fit between the FFT patterns and ED simulations in terms of the distribution of satellite reflections in all three cases selected, thus confirming the choice of the supercell.
The STEM simulations on [111]T show the superstructure as a honeycomb motif in which the six brightest spots (Fe) placed at the vertices of a hexagon are interlocked with six fainter/smaller spots forming the vertices of a second hexagon (Fig. 10a; Supplementary Material 2, Fig. S2). The pattern also features a well-defined darker ring around each Fe atom at the centre of the hexagonal motif. In the corresponding crystal model, the vertices of the fainter hexagon overlap with O atoms between an Fe atom and an O vacancy (Fig. 10a). Such results suggest that removal of O clusters induces three effects on the STEM images: (1) enhanced brightness of the Fe atoms that are not directly adjacent to O vacancies; (2) a ‘darkening’ as an inner ring around each Fe atom within the honeycomb motif; and (3) production of ‘phantom’ spots centred on O atoms between Fe and O vacancies adjacent to the vacancies (Fig. 10a).
The STEM simulation for the two dumbbell patterns show somewhat comparable effects to those of the vacancies (Fig. 10b,c; Supplementary Material 2, Fig. S2). On  $\lsqb {1\bar{1}1} \rsqb _T$ orientation, a 2 × 2-squarish pattern highlighted by dark bands (effect 2) and faint, ‘phantom’ squares (effect 3) occurring between two adjacent vacancies, both expressed on the HAADF STEM images (Fig. 10b). On [100]T zone axis, rows of brighter Fe atoms occur with 2 × 2 periodicity along the 〈
 $ {0\bar{1}1}$〉 and 〈011〉 directions (Fig. 10c). Such variation in intensity relates to a combination of alternating O and vacancy sites along the columns between the Fe-atom pairs (effect 1) with phantom squares (effect 3) between two adjacent vacancies creating a superimposed rhombic pattern (Fig. 10c). The latter is well-expressed by the enhanced intensity of dumbbell pairs along the b and c axes on some of the HAADF STEM images (Fig. 7f and inset).
Intensity variation on HAADF STEM is also expected to be produced by mixed sites and/or Fe positions substituted with heavier atoms (W, Sn, U, Pb), but this not considered in the current model. For example, atom brightening effects were obtained for U-substituted hematite (~10.9 wt.% UO3) using the two-fold superstructure (P1, trigonal) from McBriarty et al. (Reference McBriarty, Kerisit, Bylaska, Shaw, Morris and Ilton2018) (Supplementary Material 2, Fig. S3). Moreover, the scheme of vacancies might vary locally as W and O release is coupled. As more data are acquired, a combination of the two models can be produced.
Discussion
Tracing pseudomorphic replacement reactions from micro to nano scale
Linking observations from micrometre to the nanometre scale, we show how trace-element remobilisation is reflected by crystal-structural order/disorder phenomena at different stages of CDRR.
The fact that a two-fold hematite superstructure is recognised within nanodomains close to the W–Pb-bearing twin crests (Fig. 7) is evidence for the reaction onset, because hematite still retains the W–Sn–U–Pb zonation at the micrometre scale (Figs. 2, 3). Fluid percolation at this stage induces compositional changes at the nanoscale, illustrated by the relative enrichment of W and Pb along the crests of minor twins and conjugated splays (Fig. 5).
As the infiltration rates increase, hematite–fluid interaction is expressed by the appearance of abundant W–Pb-bearing NPs hosted in wider trails and splays, characteristic for the patchy core with relict zoning (Fig. 6d–e). These splays can be associated with dilation and/or strain associated with fluid-percolation and are comparable with fractures or deformed bands in seismically deformed zircon (Kusiak et al., Reference Kusiak, Kovaleva, Wirth, Klötzli, Dunkley, Yi and Lee2019). Each of these displays complex composition and includes non-formula elements introduced by the fluid. The inclusions along the trails are comparable to those interpreted as fluid inclusions in Cu–As-zoned hematite (Verdugo-Ihl et al., Reference Verdugo-Ihl, Ciobanu, Slattery, Cook, Ehrig and Courtney-Davies2019), and represent a further example of how transient porosity, which is intrinsic to CDRR mechanisms, can trap metals and fluid produced during the reaction (Putnis et al., Reference Putnis, Tsukamoto and Nishimura2005). As shown by Verdugo-Ihl et al. (Reference Verdugo-Ihl, Ciobanu, Slattery, Cook, Ehrig and Courtney-Davies2019), the reprecipitated hematite records two-fold superstructuring close to the inclusion trails.
Recognition of the same two-fold hematite superstructure in the W-depleted domain, displaying preferential removal of W but not Sn (Fig. 2a), implies that the reprecipitate transfers the structural identity from earlier stages of replacement. The highest lattice-scale disorder (e.g. screw dislocation defects, or misorientation domains) is nonetheless recorded at this stage when higher rates of infiltration produced lattice strain.
The formation of twins can be constrained as post-dating primary crystal growth as they crosscut initial hematite zoning (Figs 2, 3), but pre-date the replacement reactions. Although the twin planes clearly provide fluid pathways and metal traps, they are not obliterated during progression of CDRR. This effectively means that crystallographic information (including twin orientations) is transmitted from the parent to the new-formed hematite.
Trace-element incorporation into and release from hematite
Although our model for a two-fold hematite superstructure, based on abundant oxygen vacancies (up to x = 0.75 to accentuate the vacancy effect on STEM simulations), may be stable only as nanodomains, it reproduces the HAADF STEM images better than the metal vacancy plus protonated oxygen model (McBriarty et al., Reference McBriarty, Kerisit, Bylaska, Shaw, Morris and Ilton2018), or the earlier O vacancy models that do not consider a trigonal symmetry (e.g. Chen et al., Reference Chen, Cvelbar, Mozetič, He and Sunkara2008). This is nonetheless a simplification of the hematite studied as substitution of several metals (W, Sn, U, Pb) for Fe occurs at varying concentrations throughout both the parent and reprecipitated hematite but has not been considered in the model. HAADF STEM imaging of (Pb, Bi)1–xFe1+xO3–y compounds show perovskite-like blocks separated by crystallographic shear planes at different periodicities (Abakumov et al., Reference Abakumov, Batuk, Hadermann, Rozova, Sheptyakov, Tsirlin, Niermann, Waschkowski, Hemberger, Van Tendeloo and Antipov2011). Such crystallographic shear planes are also typical of wave-modulation in tungsten compounds with anion deficiency, such as WnO3n–x (x = 1, 2) (Abakumov et al., Reference Abakumov, Hadermann, Bals, Nikolaev, Antipov and Van Tendeloo2006, and references therein) and could explain some of the shear-dislocation defects imaged for hematite (Figs. 7d,f, 10).
Fluid–mineral interaction during coupled dissolution–reprecipitation is effective in stripping W from hematite, with concentrations reduced by three orders of magnitude whereas Sn behaves as an immobile element (concentrations remain unchanged). If the formation of O vacancies is associated with near complete W release from hematite (enrichment within the twin crest; Fig. 7), this could explain preferential removal relative to Sn if we consider the stability of the two elements during interaction with a fluid that does not show significant  $f_{{\rm O}_ 2}$ variation (hematite remains stable). At temperatures between 350 and 250°C, W can form two aqueous complexes (H2WO4 and HWO4–) depending upon fluid pH (low or slightly higher, respectively; Wang et al., Reference Wang, Timofeev, Williams-Jones, Shang and Bi2019). At similar temperature conditions, Sn(IV) has a much lower solubility (Brugger et al., Reference Brugger, Liu, Etschmann, Mei, Sherman and Testemale2016, and references therein) and probably remains in the hematite. It is clear from the micro-scale maps (Fig. 2) that U and Pb, are partially remobilised but are not depleted to the same extent as W. Moreover, Pb is observed along the twin crests and splays but not in the W-bearing NPs in the same area (Figs 5, 6a–c), implying it might not be removed from hematite but rather introduced by the fluids. Nonetheless, both elements are observed in the same inclusions along the trails (Fig. 6d), indicating strongly that they partially share the same fate in terms of (re)mobilisation during CDRR.
Trace-element mobility in a mineral geochronometer: implications for U–Pb geochronology
The presence of Pb in hematite can be attributed primarily to decay of U (and Th); thus these elements are coupled on the grain-scale element maps (Fig. 2a). Moreover, LA-ICP-MS data for the U–Pb-rich zones are comparable across the W-rich and -depleted domains, indicating that these elements have not been remobilised substantially. Although total Pb concentrations do not exceed ~5 ppm in the affected areas (Supplementary Material 1, Table S1), they can nevertheless be mapped here at the nanoscale (Fig. 5).
Even if in such small quantities and over distances of 1 μm, grain-scale (re)mobilisation of Pb leads to modification of U–Pb isotopic systematics (Fig. 2b,c) and thus impacts on the accuracy and precision of hematite age determination at different scales of spatial resolution. This interpretation, invoking Pb migration, is drawn from LA-ICP-MS U–Pb age determination along the high W–U-rich zones of the grain, which produces a spread of reversely to normally discordant data clustering along concordia on a Tera–Wasserburg diagram (Fig. 2b,c). Although arguable in terms of potential analytical artefacts generated by the lack of a matrix-matched reference material, the 207Pb/206Pb date obtained (1597 ± 12 Ma) is in agreement with more robust ages from Olympic Dam (Courtney-Davies et al., Reference Courtney-Davies, Tapster, Ciobanu, Cook, Verdugo-Ihl, Ehrig, Kennedy, Gilbert, Condon and Wade2019; Reference Courtney-Davies, Ciobanu, Tapster, Cook, Ehrig, Crowley, Verdugo-Ihl, Wade and Condon2020).
Disturbance of isotope systematics attributed to coupled dissolution–reprecipitation was invoked for compositionally zoned monazite displaying decoupled U–Pb ages (Weinberg et al., Reference Weinberg, Wolfram, Nebel, Hasalová, Závada, Kylander-Clark and Becchio2020). This case differs, however, from that presented here in that Weinberg et al. (Reference Weinberg, Wolfram, Nebel, Hasalová, Závada, Kylander-Clark and Becchio2020) report no obvious link between U–Pb age, composition, and spot analysis position in the case of the monazite they studied. These authors speculate about a behaviour analogous to hematite as previously reported by the present authors (Verdugo-Ihl et al., Reference Verdugo-Ihl, Ciobanu, Cook, Ehrig, Courtney-Davies and Gilbert2017). We endorse such an interpretation while adding that the spatial relationship between domains from which elements have been remobilised and those where the elements have been reprecipitated might only be recognisable at resolutions approaching atomic-scale, i.e. at scales below which accurate age determination can be performed. Mobilisation of radiogenic Pb in zircon is also shown at the micrometre scale for otherwise pristine, oscillatory zoned zircon (Kusiak et al., Reference Kusiak, Whitehouse, Wilde, Wilde, Nemchin and Clark2013). In our case, the clear disturbance of U–Pb ratios is observed in parts of the grain where evidence for the onset of CDDR is preserved. Analogous to the Pb enrichment we have mapped along twin crests 2–3 nm in width, Pb-rich domains some ~50 nm wide were documented from monazite that displayed discordant U–Th–Pb ages (Seydoux-Guillaume et al., Reference Seydoux-Guillaume, Goncalves, Wirth and Deutsch2003).
Atom probe tomography (APT) has been used to demonstrate nm-scale Pb mobility resulting in high 207Pb/206Pb, recognised as isolated nanoclusters enriched in incompatible elements within Hadean zircon (Valley et al., Reference Valley, Cavosie, Ushikubo, Reinhard, Lawrence, Larson, Clifton, Kelly, Wilde, Moser and Spicuzza2014). The authors interpreted this as evidence for intra-grain element mobility without implications for age accuracy at the resolution of a SIMS spot analysis, thus concluding closed rather than open system (U–Pb) behaviour in zircon at the micrometre scale. The presence of Pb as metallic Pb-nanospheres, Pb-oxide NPs, or Pb-bearing clusters, has been documented in zircon and monazite affected by ultra-high temperature (UHT) metamorphism (Kusiak et al., Reference Kusiak, Whitehouse, Wilde, Wilde, Nemchin and Clark2013, Reference Kusiak, Dunkley, Wirth, Whitehouse, Wilde and Marquardt2015, Reference Kusiak, Kovaleva, Wirth, Klötzli, Dunkley, Yi and Lee2019; Whitehouse et al., Reference Whitehouse, Kusiak, Wirth and Ravindra Kumar2017; Seydoux-Guillaume et al., Reference Seydoux-Guillaume, Fougerouse, Laurent, Gardés, Reddy and Saxey2019). The formation of Pb nanospheres at the same time as healing of radiation damage in zircon during the UHT event prohibits Pb loss from zircon, as shown by nanoSIMS age determination, i.e. distinct model ages for metamorphism (nanospheres) and crystallisation of host zircon (Lyon et al., Reference Lyon, Kusiak, Wirth, Whitehouse, Dunkley, Wilde, Schaumlöffel, Malherbe and Moore2019). Likewise, APT age determination of Pb-bearing clusters in monazite (Seydoux-Guillaume et al., Reference Seydoux-Guillaume, Fougerouse, Laurent, Gardés, Reddy and Saxey2019) returned an age interval considered to represent the duration of the UHT event rather than Pb/Th open-system behaviour. However, 208Pb/232Th ages extracted from these analyses were subsequently shown as inaccurate, as previous studies had overestimated systematically the 208Pb/232Th ratio (Fougerouse et al., Reference Fougerouse, Kirkland, Saxey, Seydoux-Guillaume, Rowles, Rickard and Reddy2020).
Previous examples are distinct from the hematite discussed here, in which Pb-bearing twin crests are opened by dilational jogs and pores (Figs. 5 and 7), indicating mineral interaction with fluids derived outside the grain. Overprinting of Pb-bearing sulfides/chalcogenides and U-bearing minerals (hematite, uraninite, etc.), is observed in Olympic Dam ores (Macmillan et al., Reference Macmillan, Ciobanu, Ehrig, Cook and Pring2016a,Reference Macmillan, Ciobanu, Ehrig, Cook and Pringb; Verdugo-Ihl et al., Reference Verdugo-Ihl, Ciobanu, Cook, Ehrig, Courtney-Davies and Gilbert2017; Reference Verdugo-Ihl, Ciobanu, Slattery, Cook, Ehrig and Courtney-Davies2019; Rollog et al., Reference Rollog, Cook, Guagliardo, Ehrig, Ciobanu and Kilburn2019a) and can provide a source of Pb external to the grain. However, whether this hematite grain has lost radiogenic Pb, or gained unsupported Pb, during fluid–mineral interaction is difficult to unequivocally determine without nanoscale age determination or U/Pb ratio measurements of or within the individual domains (nanoSIMS or APT). To constrain conclusively Pb diffusion, or Pb gain within hematite, mapping of fine oscillatory zones by nanoSIMS might resolve differences in U/Pb and Pb/Pb at a much higher spatial resolution than LA-ICP-MS. Therefore, although we show evidence for Pb clusters being trapped along fluid-inclusion trails (Fig. 6d), we cannot fingerprint the pathways of such Pb relative to host hematite.
Implications
This study documents an example of ‘isomineral’ pseudomorphic replacement (W-bearing hematite by hematite) which is traceable by compositional and crystal-structural modifications. We show that hematite will carry crystallographic information from initial dissolution to the final stages of reprecipitation.
The results emphasise the importance of multiple sets of twin planes and their secondary structures (splays) in driving fluid percolation and providing traps for released metals. Twin boundaries were previously discussed as planes of oxidation and element redistribution, e.g. in twinned sphalerite (Šrot et al., Reference Šrot, Rečnik, Scheu, Šturm and Mirtič2003; Ciobanu et al., Reference Ciobanu, Cook, Utsunomiya, Pring and Green2011). Twin-controlled fluid–mineral interaction during sericite alteration is demonstrated in Cu–As-bearing hematite from a location at Olympic Dam, ~200 m above the present sample (Verdugo-Ihl et al., Reference Verdugo-Ihl, Ciobanu, Slattery, Cook, Ehrig and Courtney-Davies2019). It is probable that the primary zoned hematite from this part of the deposit, close to a major fault system, with ~800 m vertical displacement, was affected during fault reactivation as suggested from Fe oxides study in the immediate outer shell (Verdugo-Ihl et al., Reference Verdugo-Ihl, Ciobanu, Cook, Ehrig and Courtney-Davies2020).
Isotope disturbances in radioactive minerals from Olympic Dam have been demonstrated for compositionally zoned uraninite exhibiting lattice distortion (Macmillan et al., Reference Macmillan, Ciobanu, Ehrig, Cook and Pring2016b). Microstructural analysis has shown crystal–plastic deformation of uraninite via formation and migration of defects and dislocations into tilt boundaries with implication for the incorporation and release of daughter radioisotopes. Multi-technique evaluation of hematite U–Pb isotope systematics, has shown the presence of common Pb in domains of oscillatory zoned hematite overprinted by micro-fracturing, indicating open system behaviour of such grains (e.g. sample LCD4; Courtney-Davies et al., Reference Courtney-Davies, Tapster, Ciobanu, Cook, Verdugo-Ihl, Ehrig, Kennedy, Gilbert, Condon and Wade2019). Indeed, open-system behaviour of either hematite or uraninite, can be postulated from the widespread decoupling of daughter radionuclides from parent isotopes that has been documented in various minerals from Olympic Dam (Rollog et al., Reference Rollog, Cook, Guagliardo, Ehrig and Kilburn2019b,Reference Rollog, Cook, Guagliardo, Ehrig and Kilburnc). Regardless, and dependent on fluid parameters and composition of the parent hematite, replacement products of CDRR can be highly variable in terms of the trace-element endowment of the reprecipitate and associated nanomineral inclusions. For example, uraninite rather than Pb-bearing NPs are produced along the interface between a reprecipitated hematite grain core rich in REE–fluorocarbonate inclusions and the U–W–Sn–Mo-zoned margin (Cook et al., Reference Cook, Ciobanu, Ehrig, Slattery, Verdugo-Ihl, Courtney-Davies and Gao2017; Verdugo-Ihl et al., Reference Verdugo-Ihl, Ciobanu, Cook, Ehrig, Courtney-Davies and Gilbert2017).
Further work to clarify open versus closed system behaviour at the nanoscale should include determination of the ages of distinct domains in the hematite studied here. Such studies would also solve an important problem for the Olympic Dam deposit, whether trace-element remobilisation is confined to the brecciation event within a few Ma of the onset of IOCG system formation (Courtney-Davies et al., Reference Courtney-Davies, Ciobanu, Tapster, Cook, Ehrig, Crowley, Verdugo-Ihl, Wade and Condon2020), or is due to a later overprint event, hundred(s) of Ma after formation.
Conclusions
Key observations resulting from this study are:
(1) Grain-scale remobilisation of trace elements (W and Pb) during coupled dissolution–reprecipitation reactions is associated with crystal structural modifications in hematite.
(2) A two-fold hematite superstructure model with oxygen vacancies was constructed and assessed by STEM simulations and shows good agreement with HAADF STEM imaging. This model accounts for W release from the studied hematite but could be further tested for W incorporation into this mineral.
(3) Lead mobilisation, confirmed here at the nanoscale, is responsible for U–Pb isotope disturbances in hematite. This implies that perturbations of isotopic systems in mineral geochronometers are readily traceable at the nanoscale despite being invisible at the micrometre scale.
(4) Twinning in minerals provides ideal pathways for fluid percolation and metal entrapment and thus their presence, particularly as conjugate sets, can be an indicator of open system behaviour, thus directly affecting the robustness of the hematite geochronometer, although this would need to be validated by further work.
Supplementary material
To view supplementary material for this article, please visit https://doi.org/10.1180/mgm.2020.49.
Acknowledgements
This work was funded by the ‘FOX’ project (Trace elements in iron oxides: deportment, distribution and application in ore genesis, geochronology, exploration and mineral processing), supported by BHP Olympic Dam and the South Australian Government Mining and Petroleum Services Centre of Excellence. N.J.C. acknowledges support from the ARC Research Hub for Australian Copper–Uranium (Grant IH130200033). We appreciate the positive and constructive comments of two journal reviewers and Principal Editor Roger Mitchell.