

An overwhelming male dominance persists all over the world within the board and management positions of corporations. Increased political representation, education, and labor market participation among women are only weakly correlated with the number of women in leadership positions in the corporate sector (World Economic Forum Reference Forum2018). The proportion of female chief executive officers (CEOs) in Fortune 500 companies (the largest companies in the United States) is very low and only increased from 0.2% in 1995 to 6.4% in 2017, although progress has been more rapid in recent years (Zarya Reference Zarya2017).
Iceland is a case in point. Despite high levels of women in politics and paid work and the availability of paid parental leave and public child care, the gender imbalance in business leadership is perplexing. This has raised concerns that women's talents are being underutilized in decision-making at the top level in corporations (Terjesen, Aguilera, and Lorenz Reference Terjesen, Aguilera and Lorenz2015). The European Commission (2012) points out that change is necessary in the corporate world to strengthen Europe's competitiveness and to create a sustainable future in which both women's and men's talents are fully utilized. A comparable concern is found in the European Parliament's report on women in business leadership (Pande and Ford Reference Pande and Ford2011), which argues that the shortage of women in managerial positions in business is unacceptable and calls for some form of kick-start, such as gender quotas. This is a bold demand because there has been skepticism surrounding the implementation of gender quotas in the business world (Rafnsdóttir, Einarsdóttir, and Snorrason Reference Rafnsdóttir, Einarsdóttir, Snorrason, De Vos and Culliford2014). Unlike electoral quotas, which are based on the assumption that legislatures are expected to reflect and be accountable to the entire voting population, corporate boards are supposed to be responsible only to shareholders (Chandler Reference Chandler2016).
It is of vital importance how problems are framed and conceptualized. Bacchi's (Reference Bacchi1999, Reference Bacchi2009) method of policy analysis, “What's the Problem Represented to Be?” (WPR), proposes that problems do not merely exist “out there” in societies but are produced through their formulations and conceptual framing. It is a widespread opinion that the low representation of women in leadership positions is due to issues of supply rather than demand, indicating that the hindrances lie with individual women themselves, rather than in structural hindrances and discrimination (Pande and Ford Reference Pande and Ford2011, 8). Hakim (Reference Hakim2011), for example, claims that women's own career aspirations and priorities explain the small number of women in top leadership. This is contested by others, such as Pande and Ford (Reference Pande and Ford2011), who claim that women's lack of interest is not the primary constraint on female leadership. On the contrary, they find evidence that individuals and groups who are affected adversely by quotas, such as male incumbents and firm owners, respond strategically to reduce the impact of gender quotas on leadership outcomes. This is in line with an Icelandic study showing that 49% of female managers, compared with 25% of their male counterparts, believe that the business sector is dominated by men, with insufficient trust in women (Rafnsdóttir et al. Reference Rafnsdóttir, Axelsdóttir, Diðriksdóttir and Einarsdóttir2015).
Within the existing legal framework, business leaders can have a strong impact on the selection of top management professionals in corporations and on the headhunting process for board members; therefore, it is important to analyze their views on this matter and determine whether there are any demographic or institutional patterns. In addition, the structural and individual explanations for the lack of gender diversity in business leadership point toward different policies, interventions, and actions on behalf of governments and corporations to resolve the problem of gender disparity.
Against this background, we address the following questions, with Iceland as a case example: (1) Are certain groups of corporate leaders more likely than others to support gender quotas in corporations, depending on their gender, age, and the type of corporation they belong to (women in the majority, gender balanced, or men in the majority in the company's leadership)? (2) Do corporate leaders tend to explain the underrepresentation of women as managers by pointing to structural or individual explanations?
THE ICELANDIC CONTEXT
Gender relations in Iceland are characterized by high political representation of women and high female labor market participation. Since 2009, the country has served as a beacon of gender equality in terms of the global gender gap (World Economic Forum Reference Forum2018). Political opportunity is the factor that grants Iceland top placement in the Global Gender Gap Index (Einarsdóttir and Hjartardóttir Reference Einarsdóttir and Hjartardóttir2009; Inter-Parliamentary Union 2018), although it was not until 2009 that Iceland reached the Nordic level of female representation in parliament, partly as a result of gender quotas within the political parties (Einarsdóttir and Hjartardóttir Reference Einarsdóttir and Hjartardóttir2009). Iceland has the highest female labor market participation among Organisation for Economic Co-operation and Development (OECD) countries: 86.2% in 2016 compared with the OECD average of 63.3% (OECD 2017). Women work 35 hours a week on average, compared with 44 hours for men (Statistics Iceland 2015). Despite high female labor market participation, Iceland has one of the highest fertility rates in Europe: 1.8 in 2015, compared with the European Union average of 1.58 (Eurostat 2017). This has been met with public child care and nine months of paid parental leave, including a three-month nontransferable paternity leave (Centre for Gender Equality 2017; Gíslason Reference Gíslason2007). In this light, the underachievement of women in top leadership in economic life is a highly topical issue.
The fact that Iceland is far from being a gender equality front-runner in economic leadership prompted the minister of business to present a bill in December 2009 that considered the gender ratio on the boards of public companies. The economic crisis in 2008 called for a rethinking of the relationship between the state and the market (Chandler Reference Chandler2016). In Iceland, the crisis opened a window of opportunity for wider support of gender quotas, which had already been enforced in the public sphere. This was not least due to the increased representation of women in the parliament and how (left-of-center) women parliamentarians joined forces to challenge status quo (Axelsdóttir and Einarsdóttir Reference Axelsdóttir and Einarsdóttir2017; Phillips Reference Phillips1995). In 2010, legislation requiring a minimum of 40% representation for each gender on boards for companies with more than 50 employees was passed (Public Limited Companies and Private Limited Companies Act no. 13/2010). Public limited companies, private limited companies, and cooperative limited companies were granted an adaptive period until September 2013. Shortly after, the Althing (the national parliament) passed similar legislation regarding pension funds (Act on Mandatory Pension Insurance and on the Activities of Pension Funds no. 122/2011; KPMG and University of Iceland 2013). A few years earlier, a gender quota for public committees, councils, and boards had been introduced (Act on Equal Status and Equal Rights of Women and Men no. 10/2008). Soon after the implementation of the quota, women's representation on boards increased, but almost exclusively in the companies that the laws applied to.
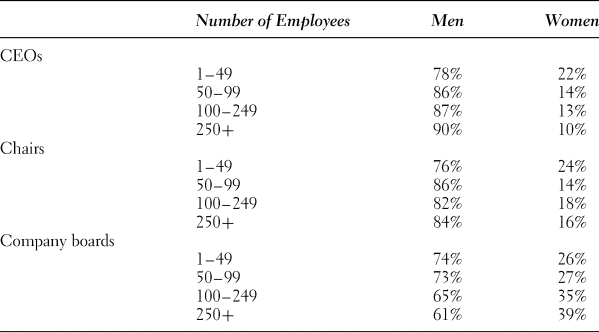
Female representation on company boards covered by the law, especially the largest companies (250 employees or more), has been steadily increasing, reaching 39% in 2016. On the other hand, the gender composition of company boards not affected by the law has been stable over time, reaching 26% in 2016. The quota law has changed neither the basic gender balance of companies' boards not covered by the law (less than 50 employees) nor the gender balance of CEOs and board chairs, regardless of whether the companies are covered by the law (see Table 1). Hence, female CEOs have lower representation in companies covered by the quota law (50 employees and more) than in companies not covered by it (12% against 22%) as of 2016. Female chairs are also fewer in companies covered by the law than in companies not covered by it (16% against 24%). Against this backdrop, this research aims to develop theoretical and practical knowledge about the reasons for the lack of gender diversity in business leadership.
Gender division among CEOs and chairs of boards in companies to which quota laws apply (50+) and do not apply (1–49).

Source: Statistics Iceland 2017.
GENDER QUOTAS, DEBATES, AND TRENDS
While the history of electoral quotas can be traced back to the 1970s (Dahlerup Reference Dahlerup2006), the introduction of corporate quotas is a quite recent phenomenon, with the first quotas enforced in Norway in 2008 and shortly after that in Iceland. In principle, the same arguments apply to both types of quotas in terms of pros and cons. However, quotas in political representation have been considered more justifiable than corporate and employment quotas, “because government should be tied to the people in some degree,” according to Bacchi (Reference Bacchi and Dahlerup2006, 33). Similar arguments have been put forth by Phillips, claiming that gender parity in elected assemblies “is a major, and necessary, challenge to the social arrangements which have systematically placed women in a subordinate position” (Reference Phillips1995, 82). Consequently, there has been less pressure for quotas in companies and corporate boards than in politics. The reason, according to Teigen, is consideration for the “autonomy of industry and respect for private self-governance” (Reference Teigen and Niskanen2011, 87), which has limited the interest in and the request for measures.
However, these boundaries between politics and economics are now being blurred, reflected in an increased willingness to introduce active measures in corporate life. The dearth of women in leadership positions in private business has attracted increased attention internationally, and the issue of gender quotas in the business world is on the agenda in the leadership debate in European countries and worldwide (Dämmrich and Blossfeld Reference Dämmrich and Blossfeld2017). In 2015, 10 countries had established quotas for female representation (ranging from 33% to 50%) on publicly traded corporate and/or state-owned enterprise boards of directors, with various sanctions. Fifteen other countries had introduced nonbinding gender quotas into their corporate governance codes, enforcing a “comply or explain” principle. Many other countries are in the process of debating, developing, and approving legislation for gender quotas on boards (Terjesen, Aguilera, and Lorenz Reference Terjesen, Aguilera and Lorenz2015). While politicians, high-ranking officials, and gender equality representatives have in general driven the debate forward, the main voices against gender quotas are those of corporate managers and owners, as well as representatives of employers’ organizations. For instance, this was the case in Norway (Teigen Reference Teigen2015), whereas in Iceland, the opposition to gender quotas has been strongest among right-wing political representatives (Rafnsdóttir, Einarsdóttir, and Snorrason Reference Rafnsdóttir, Einarsdóttir, Snorrason, De Vos and Culliford2014), especially right-wing female parliamentarians (Axelsdóttir and Einarsdóttir Reference Axelsdóttir and Einarsdóttir2017).
Prior to the implementation of the Icelandic quota law, most Icelanders saw it as important to increase the gender balance in top management. A survey conducted in 2011 showed that 85% of women and 71% of men saw it as important to equalize the proportion of men and women in top management positions within private companies and public institutions (Rafnsdóttir, Einarsdóttir, and Snorrason Reference Rafnsdóttir, Einarsdóttir, Snorrason, De Vos and Culliford2014). This support was more pronounced among managers: 97% of female managers in Icelandic corporations, compared with 74% of their male counterparts, saw it as important to increase gender equality in this area. However, this did not translate into support for gender quotas: only 69% of female managers and 25% of male managers supported gender quotas for boards of corporations. The oldest (60+) and the youngest (30–39) age groups were most in favor of increasing the proportion of women (Rafnsdóttir, Einarsdóttir, and Snorrason Reference Rafnsdóttir, Einarsdóttir, Snorrason, De Vos and Culliford2014). In a 2017 survey, 64% of women in Iceland and 36% of men supported the gender quota laws. The youngest (18–29) and the oldest (60+) age groups were most supportive of gender quota laws (54% versus 53%). Those with lower incomes were more supportive than those with higher incomes, and those who supported left-wing parties were more supportive than those who supported right-wing parties (Social Science Research Institute 2017).
The impact of age and cohorts on support for gender equality is documented in research (Clark Reference Clark2017). In an international comparative study, Inglehart and Norris (Reference Inglehart and Norris2003) found that the older the cohorts, the more traditional their beliefs about gender relations. However, support for gender equality seems to have reached a “plateau” in affluent (postindustrial) societies; egalitarian values have stopped increasing in popularity since the postwar generations (Reference Inglehart and Norris2003, 39–40). Seierstad (Reference Seierstad2016) found the same trend in interviews with women board members in Norway. Although her participants were largely in favor of quotas, the youngest women expressed reservations and skepticism, a “disinclined support,” toward gender quotas (Reference Seierstad2016, 397). As for education, Inglehart and Norris (Reference Inglehart and Norris2003) found stronger support for gender equality among the well educated, whereas the 2011 Icelandic survey (Rafnsdóttir, Einarsdóttir, and Snorrason Reference Rafnsdóttir, Einarsdóttir, Snorrason, De Vos and Culliford2014) did not show a significant correlation between views toward gender quotas and education, occupation, or income. This calls for more detailed explorations of the impact of age and education on gender equality views, which we will discuss in this article.
The arguments for and against corporate gender quotas are often based on the same grounds: justice or democracy, and profitability or utility arguments (Axelsdóttir and Einarsdóttir Reference Axelsdóttir and Einarsdóttir2017; Teigen Reference Teigen and Niskanen2011, Reference Teigen2015). The justice arguments for quotas emphasize that women's qualifications and proficiencies are undervalued in the current male-dominated system and that women have the right to equal representation as men (Einarsdóttir Reference Einarsdóttir and Jóhannesson2007; Teigen Reference Teigen and Niskanen2011). Justice arguments against quotas claim that quotas violate the principle of equal treatment and give women preference over men in a form of “reverse discrimination” (Seierstad Reference Seierstad2016, 392), creating a situation in which women are chosen because of their gender and not their qualifications (Dahlerup Reference Dahlerup2006; Rafnsdóttir and Þorvaldsdóttir Reference Rafnsdóttir and Þorvaldsdóttir2012; Teigen Reference Teigen and Niskanen2011). Quotas have further been seen as disadvantaging women who have reached their position without quotas and harming the reputations of women, who may be seen as secondary board members (Rafnsdóttir and Þorvaldsdóttir Reference Rafnsdóttir and Þorvaldsdóttir2012).
The profitability arguments for quotas claim that women have special qualities that are underutilized in management, imposing a loss on firms in the long run (Einarsdóttir Reference Einarsdóttir and Jóhannesson2007; Teigen Reference Teigen and Niskanen2011). These alleged female characteristics are empathy, carefulness, and cooperation, in opposition to the alleged male characteristics of competitiveness, initiative, and power (Rafnsdóttir and Þorvaldsdóttir Reference Rafnsdóttir and Þorvaldsdóttir2012; Teigen Reference Teigen and Niskanen2011). The profitability arguments against quotas claim that if leadership ability is correlated with gender, for whatever reason, the paucity of female leaders may in fact be efficient. Assigning leadership positions to inexperienced and worse-performing women leaders may worsen allocation (Pande and Ford Reference Pande and Ford2011) as quotas lead to less competent women replacing more competent men (Teigen Reference Teigen2015).
A recent Icelandic study reveals that senior managers’ views on gender quotas vary depending on whether private or public companies are at stake (Diðriksdóttir Reference Diðriksdóttir2017). Senior managers generally favor quotas for the boards of state-owned companies, for local governments, and for public institutions. On the other hand, managers (especially male managers) see gender quotas as questionable in private companies, as they are considered to violate the property rights of shareholders. Furthermore, the correlation between support for quotas and utility arguments is stronger than the correlation between support for quotas and justice arguments. This suggests that interventions such as gender quotas must be supported by utility arguments to be accepted (Diðriksdóttir Reference Diðriksdóttir2017).
Recent research indicates a complex combination of policies to enhance gender balance in top executive management (Axelsdóttir and Halrynjo Reference Axelsdóttir and Halrynjo2018). Seierstad (Reference Seierstad2016) calls for a deeper dialogue on gender quotas that goes beyond the narrow perceptions of justice and utility arguments as opposites, as they are not necessarily mutually exclusive. The women board members she interviewed expressed complex and often contradictory views, embracing utility and justice arguments at the same time. Seierstad concludes that the picture is more nuanced than hitherto portrayed, implying “a ‘dual entanglement’ of merit and gender within justice and utility logics in their deployment to support radical strategies such as quotas” (Reference Seierstad2016, 400). In line with Seierstad's call, we add a new dimension to the current debate by analyzing whether managers use individual or structural approaches when describing the lack of gender balance in business leadership positions. In this way, we develop theoretical knowledge of the current situation as well as practical knowledge, as these two frameworks—the individual and the structural—require different implementation strategies.
INDIVIDUAL AND STRUCTURAL APPROACHES TO GENDERED LEADERSHIP
To deepen the debate about lack of gender diversity in business leadership, we use individualistic and structural approaches to analyze our data. However, as Lewis and Simpson (Reference Lewis and Simpson2017) point out, these two approaches are not always completely separate in the theoretical discussion, even if they are viewed as opposite approaches. Although most research in the area emphasizes structural constraints (Lewis and Simpson Reference Lewis and Simpson2017), the individualistic framework has been prominent, especially since Hakim (e.g., Reference Hakim1998, Reference Hakim2000) introduced the preference theory.
Individualistic Framework
The individualistic framework has much in common with postmodern theorizing of the individualization of Western societies (e.g., Bauman Reference Bauman2001; Kangas and Rostgaard Reference Kangas and Rostgaard2007; Lewis and Simpson Reference Lewis and Simpson2017). “The process of individualization frees people from structural constraints—a process which inevitably erodes the explanatory validity of structural variables” (Kangas and Rostgaard Reference Kangas and Rostgaard2007, 241). Thus, applying the theory to the lack of gender diversity in business leadership, the individualistic framework sees women as less qualified than men or as less interested in becoming business leaders. In other words, preferences and decisions about family formation and labor market participation matter (Fortin Reference Fortin2005; Gash Reference Gash2008). Hakim (Reference Hakim2004, Reference Hakim2011) has received considerable attention for profoundly criticizing the European trend toward legislating against gender segregation in the labor market. Based on the preference theory, she points out that managers and policy makers should not expect the same job outcomes from women and men because they have different career aspirations, priorities, and life goals. She states that women's lifestyle choices explain continuing occupational segregation and that women do not seek careers to the same extent as men. The preference model is based on Becker's rational choice theory, proposing that gender segregation is primarily the result of people's choices according to their human capital levels and lifestyles (Becker [1981] Reference Becker1991).
Although Hakim's and Becker's approaches have been influential, they have also been criticized for ignoring the social construction of preferences and choices and for overlooking the heterogeneity of women and men (Browne Reference Browne2006; Pascall Reference Pascall2012). By analyzing Irish women's commitment in labor market, Collins and Wickham (Reference Collins and Wickham2004) conclude that Hakim's stress on the importance of women's preferences and aspirations makes a point but needs to be investigated, rather than deducted from social policies and official ideologies. This free choice theorizing resonates with postfeminist approaches in which women are considered to have full responsibility for their own career and well-being, juggling complex roles based on a cost-benefit calculus. Gender inequality is converted from a structural problem into an individual affair, where everything depends on the individual's capacity to exercise his or her own autonomous choices (Budgeon Reference Budgeon2015; Rottenberg Reference Rottenberg2014).
Structural Framework
Within the structural framework, women as individuals are viewed as equally qualified for and interested in business leadership as men. Nevertheless, institutional and societal processes determine the embodiment of women's labor force participation, rather than preferences or personal choices (e.g., Crompton and Lyonette Reference Crompton and Lyonette2005; James Reference James2007; Rafnsdóttir and Heijstra Reference Rafnsdóttir and Heijstra2013). It is assumed that invisible barriers exist that work against gender balance at the management level (Teigen Reference Teigen and Niskanen2011). From this perspective, the quota law can be seen as a direct regulatory push to penetrate the glass ceiling and other invisible barriers. Joan Acker (Reference Acker1990, Reference Acker2006) introduced the terms “gendered institutions” and “inequality regimes” to highlight the fact that bureaucratic organizations are not as gender-neutral as is often assumed. She refers to “systematic disparities between participants in power and control over goals, resources, and outcomes; workplace decisions such as how to organize work; opportunities for promotion and interesting work; security in employment and benefits; pay and other monetary rewards; respect; and pleasures in work and work relations” (Acker Reference Acker2006, 443). The hiring process may, for instance, be imbued with gender, as competence involves judgment and can be affected by the gender of both the applicant and the decision makers (Acker Reference Acker2006, 450). Inequality regimes have proven to be relatively persistent, according to Acker (Reference Acker2012).
Menéndez, Fagan, and Ansón refer to gendered institutions as a wide range of organizational structures such as “job design, career ladders, work practices, recruitment and selection methods” (Reference Menéndez, Fagan, Ansón, Fagan, Menéndez and Ansón2012, 4). They see the cultures of organizations as shaped by assumptions and expectations about gender-appropriate roles. They claim that organizational processes are “gendered rather than gender-neutral,” characterized by structural rather than individual causes of gender disparities in business leadership. Blair-Loy (Reference Blair-Loy2003) and Weyer (Reference Weyer2007) argue that women are not viewed as suitable candidates for leadership positions because of gendered working conditions. In a study in 26 European countries, Dämmrich and Blossfeld (Reference Dämmrich and Blossfeld2017) found that women's chances of gaining a supervisory position varied depending on gender composition in the occupations. Women were disadvantaged compared with men in almost all participating countries in female-dominated occupations (> 69% women) and gender-mixed occupations (31% to 69% each gender). On the other hand, the results varied among countries for women in male-dominated occupations (> 69% men) depending on structural conditions and national context.
Building on this, we use survey data to analyze (1) whether certain groups of leaders are more likely than others to support gender quotas, depending on their gender, age, education, and type of organization (women in the majority, gender balance, or men in the majority in the company's leadership) and (2) whether the leaders tend to explain the underrepresentation of women as managers differently (by appealing to structural or individual explanations).
HYPOTHESES AND ANALYTICAL STRATEGY
We draw on these theories and ask what explains the gender disparity among business leaders. We seek to understand what factors explain differences in support for gender quotas among managers in corporations in Iceland. In line with our previous discussion, we hypothesize the following:
H 1:
Women are more likely than men to support gender quotas.
H 2:
Support for gender quotas increases with education.
H 3:
Support for gender quotas increases with age.
H 4:
Individuals working in male-dominated corporations (in terms of the gender balance among board members, managers, middle managers, and total employees) are less likely to support gender quotas than people working in corporations with more gender-equal distribution.
H 5:
Those who appeal to individual explanations to explain women's underrepresentation among managers are less likely to support gender quotas than those who refer to structural explanations. Conversely, we expect that individuals who explain women's underrepresentation among managers as structural (i.e., as a result of discrimination against women in the job market) are more likely to support gender quotas (see Meier Reference Meier2008).
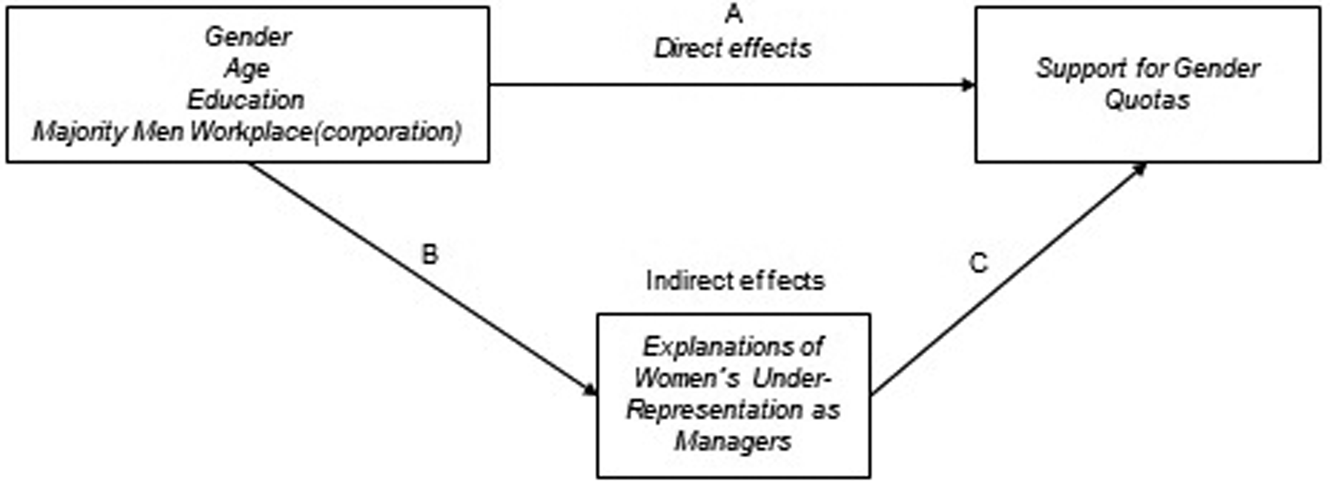
Our fifth hypothesis is presented in Figure 1. We expect the foregoing characteristics (gender, age, education, and type of workplace) will correlate with support for gender quotas partly because they are related to differences in how people tend to explain the underrepresentation of women.
Hypothesized model.

METHODS
Data
An electronic questionnaire was sent in November 2014 to management professionals (i.e., all those who report directly to the chair or CEO of a company) in the 250 largest companies in Iceland according to income. The companies were selected from a list of the 300 largest companies in Iceland presented in the business magazine Free Commerce (Frjáls Verslun). The magazine classifies companies by turnover. A total of 1,349 individuals received the questionnaire by email, with a 73% response rate. The questionnaire consisted of 59 questions; participants were not required to answer all questions, and thus not all participants completed the survey. Most instances of item nonresponse were questions at the end of the survey, including questions about the participant's characteristics and background (such as gender, age, and education). Therefore, we see item nonresponse as a sign of a hurriedness rather than the managers deliberately skipping the last questions. A survey including 59 questions may be too long for busy managers, and in fact some participants noted that the length was a problem in messages to us. The final sample in the analyses is between 489 and 504, with about 27% female respondents (see Rafnsdóttir et al. Reference Rafnsdóttir, Axelsdóttir, Diðriksdóttir and Einarsdóttir2015 for more detailed information).
Measures
To increase the reliability of our dependent variable, support for gender quotas, we averaged the score of 10 survey items asking about views on gender quotas in different situations. All survey questions are shown in Table 3. The answers ranged from 1 (disagree completely) to 5 (agree completely). Some of the survey items were negatively worded, so we reversed those items so that all 10 survey items would reflect support for gender quotas. Cronbach's alpha, which was used to assess the reliability of the combined measure, was equal to 0.92, indicating strong internal consistency in the answers to the questions regarding gender quotas. The average score on the combined measure was 2.99 (standard deviation [SD] = 1.04).
We created two variables to measure explanations of women's underrepresentation as corporate managers.Footnote 1 The first measure captures the view that women in the workforce face a structural disadvantage that prevents them from reaching the highest positions. This measure was constructed by averaging the scores for five survey items: (1) “Too much of the recruitment for management positions happens through informal networks,” (2) “A lot of men have problems working with female managers,” (3) “Recruitment of women into management positions is not a priority within the business sector,” (4) “Women applicants are ignored during the recruitment process,” and (5) “The business sector is dominated by men with insufficient trust in women” (Cronbach's alpha = 0.72).
The second measure was also constructed by averaging five survey items: (1) “A lot of women handle the pressure from a leadership position more poorly than men,” (2) “Women are less likely than men to choose to pursue a career path with great responsibilities,” (3) “Women are less likely than men to be willing to fight for their career,” (4) “There are not enough qualified women to recruit,” and (5) “Women are less interested in positions with responsibilities than men are.” This measure captures the view that the explanation for women's underrepresentation in management positions can be found at the level of individual women—that is, that women are less driven or less qualified than men to be managers (Cronbach's alpha = 0.74). The answer choices for all 10 items ranged from 1 (completely agree) to 5 (completely disagree).
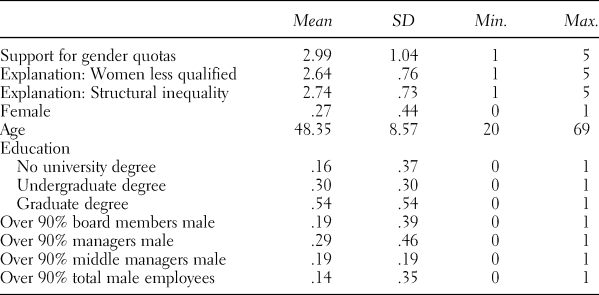
We also use self-reported gender and age. In our final analyses, there were 315 men and 117 women. The average age was 48.35 years (SD = 8.57), the youngest person was 20, and the oldest was 69. Participants were asked about their highest level of education. We constructed two dummy variables included in the regression analyses: one for participants with an undergraduate degree and one for participants with a graduate degree. Participants without any university degree served as a reference group. About 16% of our sample had no university degree, 30% had an undergraduate degree, and 54% had a graduate degree (see Table 2).
Descriptive statistics

We also examined the impact of company gender distribution. We created four dummy variables, one each for individuals working in a company with majority male board members, majority male managers, majority male middle managers, and majority male total employees. Participants were given the options of (1) nearly all women (over 90%), (2) mostly women (61%–90%), (3) somewhat equal gender division (40%–60%), (4) mostly men (61$–90%), and (5) nearly all men (more than 90%). We compared individuals working in companies with nearly all men and with all other groups. Descriptive statistics for all variables included in the analyses are shown in Table 2.
FINDINGS
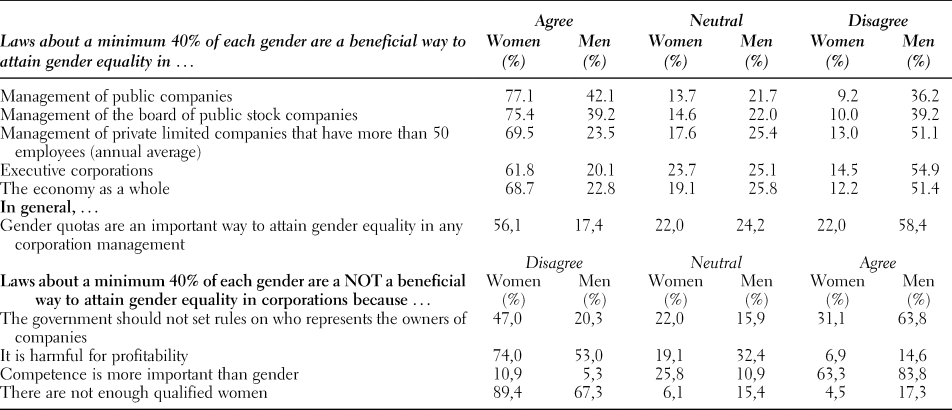
We begin our analyses in Table 3, examining gender differences in the responses to each survey item regarding gender quotas. A relatively high percentage of women agreed that gender quota laws can be beneficial to the management of public companies (77.1%), but only about 42% of men agreed with that statement. When asked about gender quotas in management in private companies, a somewhat lower percentage of women respondents agreed, and a much lower percentage of men (only about 20%). About 56% of female participants agreed with the statement that, in general, gender quotas are an important way to attain gender equality in any corporation's management, but only 17% of male participants agreed with this statement.
Attitudes toward gender quotas by gender

Notes: We combined “completely (dis)agree” and ” (dis)agree.” All percentage differences between men and women shown in table are statistically significant (p < .01).
Table 3 likewise shows that men were twice as likely as women to agree with the statement that obligatory gender quotas are not beneficial because the government should not set rules about who represents the owners of companies (almost 64% of men versus about 31% women). However, a high percentage of both women and men agreed that gender quotas harm profitability. Most men and women agreed that competence is more important than gender (about 63% of women and almost 84% of male participants). Very few women (under 5%) believed that there are not enough qualified women, and about 17% of males agreed with that statement.
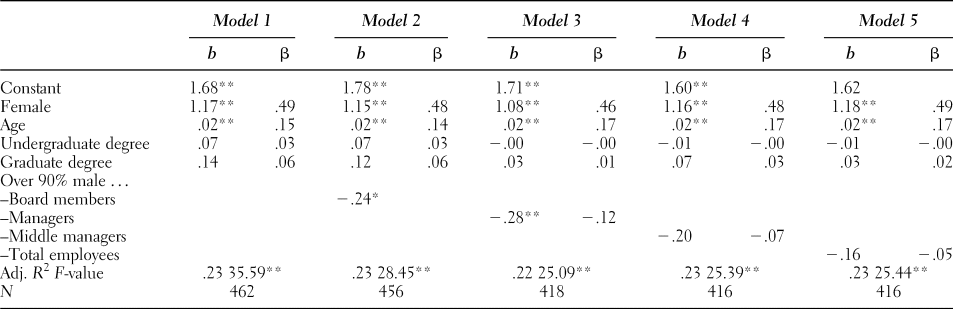
The next step in our analyses was to examine the impact that our independent variables had on the combined measure of support for gender quotas (Path A, Figure 1). We begin in Table 4 by not including the variables for explanations for the underrepresentation of women as managers, thus solely examining the direct relationships between the independent variables shown in Figure 1.
Ordinary least squares regression estimates predicting support for gender quotas

Note: b = unstandardized coefficient, β = standardized coefficient.
+p < .1; * p < .05; ** p < .01.
In Model 1 (Table 4), we only include gender, age, and education as predictors. As expected, independent of their age and education, women were significantly more likely than men to support gender quotas. On the measure for gender quotas, which ranges from 1 to 5, women's average score is 1.17 times higher than the average score for men (b = 1.17**). Age is also significantly related to support for gender quotas, increasing with increased age. A one standard deviation increase in age is, on average, associated with a 0.15 standard deviation increase in support for gender quotas (b = 0.02**, β = 0.15). Education, however, is not related to attitudes toward gender quotas.Footnote 2 Although those with an undergraduate (b = 0.07) and a graduate degree (b = 0.14) indicated higher average support for gender quotas than those without a college education, this difference is not statistically significant.
In the following models in Table 4, we added a dummy variable for individuals working in majority male corporations. We included these different variables in separate models to prevent us from losing statistical power; these different dummy variables are also highly correlated and thus may produce multicollinearity problems.Footnote 3 The results in Model 2 (Table 4) show that managers that work in a corporation in which more than 90% of the board members are male were significantly less likely to support gender quotas than respondents working in corporations with more gender-equal distribution (b = –0.24*). The same pattern can be observed in Model 3, showing that managers working in corporations with majority male members were less likely to support gender quotas than managers in other types of corporations (b = –0.28**). These relationships are independent of the managers’ own gender (as well as age and education). Interestingly, gender composition among middle managers and among employees overall is not associated with attitudes toward gender quotas (Models 4 and 5, Table 4).
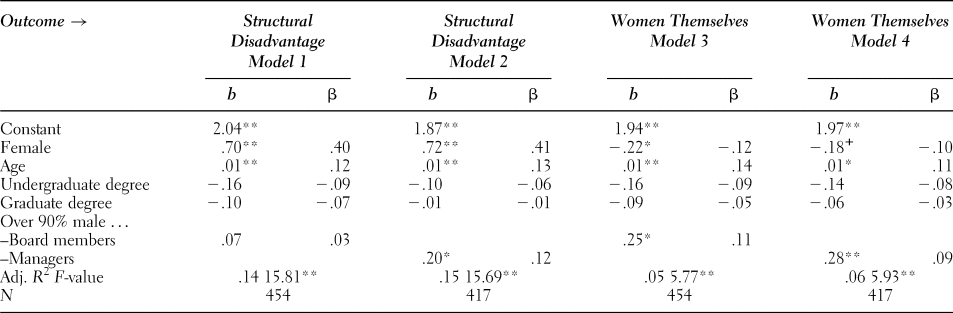
In Table 5, we focus on Path B (Figure 1), thus examining whether our intendent variables are related to variations in how managers explain women's underrepresentation as managers. In the models in Table 5, we do not include the variables for majority male middle managers and majority male total employees because these two variables were not significantly related to attitudes toward gender quotas. Model 1 reveals that women were more likely to believe that the underrepresentation of women as managers is caused by structural disadvantages women face. On a scale of 1 to 5, the women's score is on average 0.70 higher than the male score in our sample (b = 0.70**). Older managers were also more likely than younger managers to believe that women face discrimination, although the relationship between age and this view is rather weak (b = 0.01**, β = 0.12).
Ordinary least squares regression estimates predicting explanations for women's underrepresentation as managers

Note: b = unstandardized coefficient, β = standardized coefficient.
+p < .1; * p < .05; ** p < .01.
As observed in Model 3, education does not have a significant relationship with explanations for women's underrepresentation as managers. Likewise, the difference in explanations between those working in corporations with majority male board members and those working in other types of corporations is not statistically significant. In Model 2 (Table 4), we included the dummy variable for individuals working in corporations with majority male managers. This variable is significantly related to the view that women face some sort of discrimination within the labor market and are thus underrepresented as managers (b = 0.20*).
In Models 3 and 4 (Table 5), we examine differences in the view that the underrepresentation of women as managers is attributable to women themselves (i.e., that they are less driven or less qualified than men). Perhaps not surprisingly, women were somewhat less likely than men to hold this view. However, the gender-based difference concerning the view that women themselves are at fault is smaller than the gender-based difference concerning the view that women face discrimination (comparing the coefficients for gender in Models 1 and 2 to the coefficients for gender in Models 3 and 4, in which gender is barely significant). Age has a weak but statistically significant relationship with the belief that women are themselves at fault for their underrepresentation. Thus, even though older people were somewhat more likely to believe that women face discrimination in the workforce, the belief that women are less driven or less qualified than men also increased with age (e.g., in Model 3, b = 0.01**), but again, the relationship is weak. Similarly, managers working in corporations with majority male managers were significantly more likely than others to seek explanations for women's underrepresentation as managers in the women themselves (b = 0.28** in Model 4, Table 5).
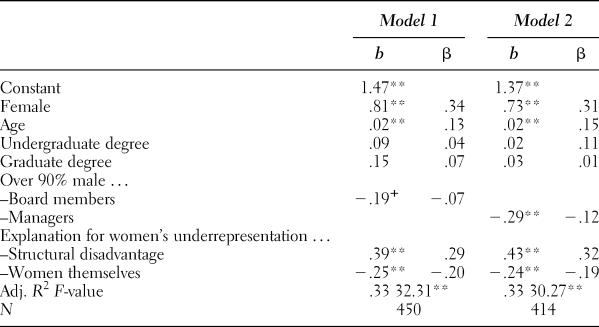
Finally, in Table 6, we examine the relationship between support for gender quotas and individuals’ explanations for women's underrepresentation as managers while controlling for all other variables (thus focusing on Path C in Figure 1). In line with our hypotheses, the view that women are in a disadvantaged position in the job market, and therefore underrepresented as managers, is associated with increased support for gender quotas (b = 0.39** in Model 1 and b = 0.43** in Model 2, Table 6). Likewise, the view that women's underrepresentation as managers is self-inflicted is associated with less support for gender quotas (b = –0.25** in Model 1, and b = –0.24** in Model 2). It is also important to note that the impact of gender on support for gender quotas decreased substantially (e.g., from b = 1.15** in Model 2, Table 4, to b = 0.81** in Model 1, Table 6). The coefficients for age and working in a male-dominated corporation did not change, and the coefficient for working with majority male board members decreased only slightly.
Ordinary least squares regression estimates predicting support for gender quotas

Note: b = unstandardized coefficient, β = standardized coefficient.
+p < .1; * p < .05; ** p < .01.
DISCUSSION
In this article, we asked whether certain groups of business leaders are more likely than others to support gender quotas and whether business leaders tend to explain the underrepresentation of women as managers with structural or individual explanations. In this way, we developed theoretical and practical knowledge concerning the gender disparity in business leadership positions, with significant relevance to policies and active measures. If the aim is to improve the gender balance in corporations, structural explanations require different approaches than individual explanations. Bacchi's (Reference Bacchi1999, Reference Bacchi2009) WPR method of policy analysis proposes that problem representations both reflect and affect political interventions and their political mobilization. If the dominant framing of the problem is skewed in line with the interests of corporations and their owners, the responsibility will lie with the individual women or with women as a group. Accordingly, political interventions might be in the form of women-friendly, supportive measures, or there may be no interventions. If, on the other hand, the problem is portrayed as a structural issue relating to institutional practices, then measures tend to focus on the larger organizational structure, norms, and practices of the corporations.
In addition to shedding light on the prevalence of structural and individual explanations in this respect, we also attempted to further the knowledge of factors that explain differences among managers in terms of support for gender quotas in management positions. We hypothesized that women, older professionals, and those with higher education (a college degree) would be more prone to support gender quotas, in line with previous research showing more support for gender equality in these groups (Inglehart and Norris Reference Inglehart and Norris2003; Seierstad Reference Seierstad2016). Our main argument is that these groups might have a better sense of the structural disadvantages faced by women in the labor market, which prevents them from reaching the highest positions. In line with Acker's (Reference Acker1990, Reference Acker2006, Reference Acker2012) theories on gender organizations and inequality regimes, we also suggested that individuals working in majority male corporations would be less likely to support gender quotas. It may be assumed that majority male corporations tend to have a masculine culture that impacts the views on gender quotas among its employees. Our findings partly support these hypotheses.
We found that women are in every situation considerably more likely than men to think that gender quota laws for top positions in the workforce are a beneficial way to attain gender equality. Both men and women are more likely to support gender quotas in public rather than in private companies. This resonates with extant research (Diðriksdóttir Reference Diðriksdóttir2017; Teigen Reference Teigen and Niskanen2011, Reference Teigen2015). Although few managers (both male and female) believe that gender quotas harm profitability and that there are not enough qualified women, a somewhat higher percentage of participants (particularly male participants) do not think that the government should set rules about who represents the owners of companies. The reason could be the view that the causes of the gender disparity lie outside the company or the labor market itself. Our findings indicate that how people explain the underrepresentation of women as managers is strongly related to their support for gender quotas. In other words, people who believe that women are structurally disadvantaged in the labor market are more likely to support gender quotas than those who do not. Conversely, the more people believe that individual factors explain the lack of gender diversity in business leadership, the less likely they are to support gender quotas. Importantly, a substantial part of the gender-based differences in support for gender quotas is due to the fact that men and women explain the underrepresentation of women in managerial roles differently. Women are more likely to believe that women are disadvantaged in the labor market, and they are less likely to appeal to individual explanations to explain women's underrepresentation in management roles. Thus, our findings contradict Hakim's (Reference Hakim2004, Reference Hakim2011) assertions that labor market relations reflect women's free choice and preferences.
Our results also show that older individuals are more likely to support gender quotas than younger individuals, and this difference is independent of how people explain the underrepresentation of women as managers. This is consistent with the findings of Inglehart and Norris (Reference Inglehart and Norris2003), who discovered that although younger generations tend to have more egalitarian views on gender equality than older ones, that trend has reached a “plateau.” This resonates with the findings of Seierstad (Reference Seierstad2016, 397), who discovered complex age patterns, with some young women as “reluctant supporters” of gender quotas.
In line with Inglehart and Norris (Reference Inglehart and Norris2003), but contrary to Barnes and Córdova (Reference Barnes and Córdova2016), we hypothesized that managers with a university degree would be more likely to support gender quotas than those without a university degree. However, our findings indicate that education has no impact on attitudes toward gender quotas. This result could be attributed to the fact that our sample lacks variation; about 84% of our managers have at least a bachelor's degree.
We also hypothesized that individuals working in majority male corporations would be less likely to support gender quotas than those working in corporations with gender-equal distribution. In line with Acker's gender organizations (Reference Acker1990, Reference Acker2006), and Dämmrich and Blossfeld (Reference Dämmrich and Blossfeld2017), who found that women's chances of gaining supervisory positions varied depending on company gender composition, we suggested that individuals in more male-oriented work environments might be more prone to resist gender quotas. Our results indicate that the gender division among employees overall and among middle managers did not have any impact on individuals’ support for gender quotas. However, working in a corporation with a majority male board members or majority male managers is associated with less support for gender quotas. This relationship does not seem to be affected by differences in how people explain women's underrepresentation in managerial roles. For example, even though those working in corporations that have almost exclusively male managers are more likely to believe that women are less qualified and less driven than men—causing women to have fewer management positions than men at such companies—they are also more likely than others to believe that women are structurally disadvantaged (thus, these two views are not mutually exclusive). Furthermore, independent of explanations for the underrepresentation of women as managers, those working in these majority male manager corporations are still less likely to support gender quotas. Thus, unlike the differences in support for gender quotas between men and women—which can be explained, at least in part, by differences in beliefs about causes of the underrepresentation of women as managers—those working in corporations with majority male managers are less likely to support gender quotas for other reasons.
The strength of this research is its strong data set, based on a survey including all managers belonging to the executive committees of the 250 largest companies in Iceland and not only a survey sample. The response rate is high. However, a weakness of our study is that we cannot connect companies to respondents, which means that we do not know how comparable companies are across different levels of gender equality and across differing attitudes toward gender quotas. Nevertheless, we see the data as valuable to the theoretical and practical debate about the causes for lack of gender diversity in business leadership.
CONCLUSIONS
This research adds to the knowledge on corporate board quotas with implications both for potential legislative and policy measures as well as for corporate life. Business leaders are in a key position to influence the gender imbalance in top leadership positions, given the limits provided by the legal and regulatory framework. This research provides nuanced indications that support for gender quotas is strongly related to how business leaders explain the underrepresentation of women as managers. Male business leaders are more likely than females to see individual reasons behind the lack of gender diversity in business leadership (i.e., to believe that the reason for the gender disparity lies with the women themselves rather than in the surrounding structures). This is particularly prevalent among the youngest age group. The individualist approach and the structural approach require different policy measures to change the gender composition of corporations. The individualist approach implies that women are either less qualified or less driven than men to be managers. This would call for individualized interventions. The structural approach implies that competent women may be blocked from leadership positions, such as by the structure of the work or the labor market inhibiting a woman's advancement (by penalizing career interruptions, etc.). This view implies that there is an efficiency case for using quotas. Quotas may also have a positive effect on potential women leaders themselves, resulting in a more efficient selection of leaders, and mandated female leaders may serve as role models for other aspiring women (Pande and Ford Reference Pande and Ford2011). The research also reveals that male dominance at higher company levels—that is, on boards and among managers—is related to negative views on gender quotas, whereas the gender composition among middle managers and employees in general is unrelated to views on gender quotas. This emphasizes the impact of business leaders on the recruitment of women to top positions in companies and the importance of improved gender balance in top leadership roles.
The policy implications of our findings have direct relevance for the Icelandic conditions, but they may also be valuable in a wider context, as not all countries have implemented laws to boost gender diversity in the boardroom. The corporate quota reform is clearly a measure responding to a problem at the structural level rather than the individual level, according to Bacchi (Reference Bacchi and Dahlerup2006). Since most companies obey the law, the reform has become successful, but only within the framework of the quota laws. That is, no spin-off effect to other areas in corporate operations are identified. This, in addition to some other recent reforms in Iceland, reflects an inclination of the Icelandic legislative assembly to frame problems as structural and institutional practices rather than the problems of individual women. Hence, for example, the radical parental leave reform from 2000, which includes a nontransferable, take-it-or-leave-it paternity leave, and the Icelandic legislation on the Equal Pay Standard enforced in 2018, which requires employers to comply to an equal pay system. Both serve as examples of a law-based, structural rather than individual problem representation. The fact that gender diversity in business leadership has increased almost only in connection to the quota laws, may be related to the fact that the most powerful individuals in the companies, male CEOs, are skeptical toward implications such as corporate quotas. The inclination of the Icelandic authorities to introduce legislation, however, counteracts the negative effects of the opposition and the corporate quotas are not at risk. For countries considering increasing the number of women in business, the Icelandic experience regarding the legal framework and the views and agency of key players may feed into a better informed decision-making.