Introduction
During recent years some investigations have been carried out on moraine ridges in front of existing glaciers in Scandinavia. From air photographs several large moraine ridges were selected; most of them seemed to be larger than would be expected from the size of the glacier which had produced them. It was therefore assumed that some of the largest moraines contained an ice core.
In many cases the existence of buried ice could be proved by applying the electric earth resistivity method (for description of the method, see Reference DobrinDobrin, 1952, p. 293–305, or Reference Krynine and JuddKrynine and Judd, 1957, p. 264–66) and in some cases by seismic soundings. Based on these measurements and further air–photo interpretation, maps have been compiled showing the distribution of ice–cored moraines in mountain areas in Scandinavia (Reference ØstremØstrem, 1964). Samples of the ice cores have been collected from several ridges, and by means of a special technique it has been possible to obtain information about the age of this ice. Crystallographic studies have also been made on samples of the ice (Reference ØstremØstrem, 1961, Reference Østrem1963, Reference Østrem1965).
In order to compare the resistivity of ice from the moraine ridges with other sorts of ice, a series of measurements were made in December 1960 at Merentutkimuslaitos (Institute for Marine Research) in Helsinki, Finland.
The samples collected from ice–cored moraines and glaciers were packed in multi–layered plastic bags and transported in insulated containers, cooled by dry ice. The duration of this transport was in no case more than 48 hr., mostly far less. The samples were later stored for some months in a freezing cabinet at approximately −20°C. The artificially frozen ice originated from water frozen in the cold room.
Method of Measuring The Resistivity
Samples of the ice to be examined were cut into small flat pieces by means of a band saw. The thickness of each piece of ice was about 1.5 cm., and the pieces were circular or rectangular, depending on the original shape of the ice sample and the desired orientation of the piece to be examined. In most cases the ice samples were collected in the field by a core sampler, thus the samples were cylindrical. When cutting the cylinder horizontally, the resulting pieces of ice were circular; when making a vertical slice, rectangular pieces were obtained.
After sawing, the surfaces of the piece of ice were smoothed by polishing with emery paper fixed to flat wooden blocks. Then the electrodes were placed on the plane parallel surfaces, and the thickness of the ice was measured with a micrometer.
The electrodes were made of polished silver plates fixed to a plastic holder (Fig. 1). To avoid creeping currents along the surface of the ice, each circular electrode was supplied with a ring of the same material in the same plane as the electrode itself, but separated from it by a space of a few millimetres. The ring around the electrode was always connected in such a manner that it had the same electric potential as the electrode, but only the current flowing through the ice between the electrodes was measured. The effective surface of the electrode proper was 3.94 cm.2.
The electrode arrangement for measuring the resistivity of ice. The electrodes consist of circular silver plates fixed to plastic holders. Rings of silver plate are placed around the electrodes in order to avoid creeping currents along the surface of the ice (see the text). The pressure of the electrodes against the ice can be controlled

By this arrangement the current flow through the ice is believed to be homogeneous and not disturbed by creeping currents along the surface.
The electrodes were pressed against the ice surfaces by springs, resulting in a pressure of about 100 g./cm.2. Efforts were made to maintain equal pressure during every measurement.
The source of electricity was a dry battery (anode battery) giving about 140 V. The current was measured on a mirror galvanometer with a reading accuracy of 7.6×10⁻⁸ A. per scale unit.
When measuring the current several readings were made on the same piece of ice. The electrodes were moved onto different areas of the ice—but were always facing directly opposite each other—and readings were made at as many different spots on the parallel surfaces as possible. After each reading the direction of the current was reversed and a new reading made before moving the electrodes to the next spot. It was evident that the readings always differed, depending on the direction of the current. All readings were therefore made at least twice with the current flowing in opposite directions.
In some cases variations in resistivity with time were observed. The current was allowed to flow continuously and readings were taken at intervals of one minute, or more frequently when necessary.
The resistivity of the ice was calculated from the formula:

where V is the voltage, measured over the poles of the battery, s is the cross–sectional area of the electrode, I is the current, measured with the galvanometer, and x is the thickness of the ice, i.e. the distance between the electrodes.
Nearly all the measurements were made at a temperature of −5°C. in the cold laboratory, but in one special case the ice was taken into a freezer with a temperature of −25°C.
Results
As mentioned above, the resistivity did not appear to be a well–defined figure, even for a given piece of ice. The readings differed somewhat from place to place on the same piece of ice, and there seemed to be a very great difference in resistivity when the current was reversed.
When the current was flowing in one direction through the ice, the readings on different parts of it were nearly the same, or at least of the same order of magnitude. But when the current was flowing in the opposite direction, the resistivity was quite different—often 10 or 100 times the value measured in the first case. This difference in resistivity had no correlationto the order in which the measurements were made. Every piece of ice had its specific “low–resistivity direction”.
The total number of readings was 135, all of them made with the current flowing in two opposite directions. All measurements gave similar results, though the difference in resistivity varied somewhat. The greatest difference was found in the ice samples taken from the core of the moraine at Isfallsglaciären. In this ice, the resistivity in the one direction was in some cases more than 100 times the resistivity in the opposite direction, but the mean ratio of 74 pairs of readings was 12.5.
For glacier ice the difference in resistivity measured with different directions of the current was not so pronounced. The mean value of the quotients calculated from to measurements was only 2.5, with a measured maximum of 13, i.e. the resistivity in one case was 13 times the resistivity measured with the current reversed.
The smallest differences in resistivity were found on artificially frozen ice made from distilled water mixed with small quantities of salts (NaCl or MgCl2). The mean value of 27 measurements gave the quotient 1.6 with a highest observed quotient of 5.0.
For some cases with relatively high quotients a selection of typical values of resistivity measured on different types of ice are shown in Figure 2. In this diagram the two measured resistivity values at every spot on each ice sample have been placed directly above one another. The upper point illustrates the resistivity when measured in the “high resistivity direction”, the lower point illustrates the value of the resistivity in the “Iow resistivity direction”. In all cases the “high resistivity direction” was the same for all the measuring points on the same piece of ice.
Example of some typical resistivity variations in different samples of ice. The lower points indicate the resistivity measured with current flawing in the direction of lowest resistivity, the higher points indicate the resistivity measured with current flowing in the opposite direction. Connected points have been plotted from measurements on the same point on the ice sample.
υ —indicates a vertical section of ice
h—indicates a horizontal section of ice
IV—artificially frozen ice containing 0.5‰ MgCl2
I—artificially ice containing 0.5‰ NaCl

All the readings were made very quickly, as the resistivity seemed to decrease shortly after the current was switched on. In most cases the readings were made within a few seconds, as soon as the instrument had stabilized. If the current was left on much longer, it was evident that the resistivity decreased during the following few minutes.
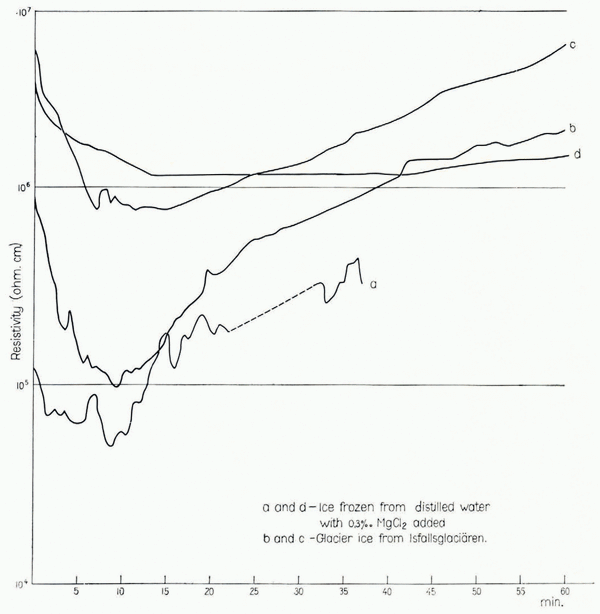
In order to follow the resistivity variations with time, some measurements were made with a constant voltage connected to the electrodes for a longer period. Readings were made at intervals of 30–60 sec. and the results are plotted in Figure 3. It can be seen that the resistivity decreases in all cases, but after about 10 min. it increases again and seems to reach its first observed value after 30–60 min. Curve d indicates that the amplitude of variation with time is less when the temperature is lower, but on this point more experiments are needed. The resistivity also seemed to vary with temperature (higher resistivity at lower temperatures) but this phenomenon could not be measured under proper conditions due to limitations in the laboratory equipment. Therefore more experiments are needed on this point also.
Resistivity variations with time, measured at −5°C. (curves a, b and c) and –25°C. (curve d). In all cases the resistivity decreased during the first few minutes after the current was switched on. After a further lapse of time the resistivity increased again, but the rate of increase differed. The resistivity of the sample measured at −25° C. increased very slowly, and only after more than two hours did the resistivity reach the. first observed value (not shown on the diagram)

Discussion
It is evident that the measurements of electrical resistivity of ice with direct current give a wide variety of values. In this connection two main features seem to influence the results:
-
The ice does not have the same resistivity for currents in all directions. Somepreferred orientation for the lowest resistivity seems to exist, and the resistivity measured when the current flows in the opposite direction may be many times as great.Footnote *
-
The resistivity in the ice seems to vary with time. In the above mentioned experiments efforts were made to make all the readings within the same time limits, thus avoiding influence from the time factor.
Three types of ice were examined: ice from an ice–cored moraine, glacier ice from a temperate glacier, and artificially frozen ice containing small quantities of salts. The readings varied between the following limits (measured at −5°C.):Footnote †

It is meaningless to compute mean values for the different types of ice, as the figures refer to current flowing in opposite directions.
The “rectifying effect” of the ice seemed to be common to all the samples examined, but among them the ice from the ice–cored moraine had the most effective “rectifying effect”, with a maximum quotient between the current in the two directions of 180. (Mean value 12.5.)
As this ice has very small crystals (see Fig. 4) without any preferred crystal orientation (except in very narrow bands of dirty ice) the above mentioned electrical effect does not seem to depend upon the orientation of the ice crystals.
An ice sample taken from the lateral moraine at Isfallsglaciären, Sweden. Above: the cylindrical ice core before cutting. Note the dark oblique band to the left and the translucent band in the middle of the cylinder. Below: a thin section (vertical slice) of the ice sample photographed in white light and polarized light respectively. Note the bands with different crystal sizes

Some of the artificially frozen ice samples had a very pronounced orientation of the optic axes of the crystals, but this fact did not seem to influence the electric “rectifying effect”. No evidence was found of a close connection between these two factors.
The artificially frozen ice had the lowest quotient between the high and the low resistivity, whether the ice crystals had a preferred orientation or not. It is possible that the salt content (the brine at the grain boundaries) makes this ice different from the glacier ice, which is assumed to be purer. The crystal size in the two types of ice was about the same (2–5 cm. in diameter), and the content of air bubbles also seemed to be about the same, but all the samples of glacier ice had a larger quotient between high and low resistivity.
Conclusions
The electric resistivity of ice varies with time when current is flowing through the ice. The resistivity drops during the first few minutes, then it rises again and will reach its first observed value within 30–60 minutes. It is possible that free ions in the interstices between ice crystals are responsible for this effect, as the amplitude of the variation is less at lower temperatures. When measuring the electric resistivity on ice samples with direct current, great variations in resistivity can be observed. The resistivity seems to depend on the direction of the current; when measuring with the current reversed a considerable difference in resistivity appears. The quotient between the low resistivity and the high resistivity measured on the same point of the same piece of ice not only varies from one type of ice to another, but also varies between different samples of the same type of ice. In most cases the ice from ice–cored moraines had the greatest quotient, i.e. the greatest “rectifying effect” occurred in this type of ice. Glacier ice also had a large quotient, in all cases much greater than that observed in the artificially frozen ice. The effect did not seem to be connected with the orientation of the ice crystals.
It is not certain that the observed difference of the “rectifying effect” between different types of ice is real, however. It might have been caused by polarization at the electrode contacts due to impurities. The type and concentration of these impurities might nevertheless be typical for a given type of ice and thus explain the observed systematic difference, if it is systematic. (Impurities might have been added to the surfaces when handling the specimens, whereby the different types of ice might have been handled differently by chance.)