I. INTRODUCTION
Hierarchically, human bone is an excellent example of macro- to micro- to molecular structure, which starts from spongy bone from surface down to collagen fibrils on a length scale, which is again composed of columnar collagen molecule and inorganic component mainly hydroxyapatite (HAp) nanocrystals.Reference Bhowmik, Katti and Katti1 This structure of bone provides unique mechanical properties to support the body weight, producing different blood cells, and also for storing of different ions.Reference Tortora2 Many authors have tried to explain the correlation between this hierarchic structure up to molecular level and mechanical properties observed in different parts of the body through different methods including finite element modeling,Reference Ji and Gao3 multiscale modeling techniques,Reference Buehler4 etc. Bhowmik et al. had shown the mechanical effect of collagen molecules with mineral and also effect on the function of the protein biomolecules at the region of inorganic–organic interfaces.Reference Bhowmik, Katti and Katti1 At the nanoscale level, bone consists of HAp mineralized at specific positions on collagen molecules. This mineralized nano-hydroxyapatite (n-HAp) in these regions is occurred as hexagonal geometry with the c-axis parallel to the collagen fibrilsReference Itoh, Kikuchi, Koyama, Takakuda, Shinomiya and Tanaka5 and collagen interacts them through telopeptides nonhelically known as N- or C-telopeptides available at the end of these proteins.Reference Kadler, Holmes, Trotter and Chapman6 Natural bone tissue is basically a biocomposite, which consists of crystals of n-HAp distributed in the matrix of collagen. Biomaterials such as HAp, bioactive glasses (BGs), and glass-ceramics materials can chemically be attached to living bone tissue and introduce a specific biological active response by forming an interfacial bond of hydroxyl carbonated apatite (HCA, main inorganic part of human bone) layer on its surfaces.Reference Regi, Ragel and Salinas7 Due to this ability, these materials have various applications in the field of bone tissue regeneration, coatings on inert or metallic implants, as drug delivery vehicle, tumor treatment, biomimetics, etc. The apatite crystallites that are present in various parts like human bone, dentin, enamel, and cementum are considered as nanostructure materials due to their extreme small size.Reference Racquel8 Due to their larger specific surface area (SSA), n-HAp possesses some special properties and has various applications in composites with organic polymers.Reference Giannelis9,Reference Liu, De Wijn and Van Blitterswijk10 However, another aspect of this observation has not been studied in detail regarding the interactions of this n-HAp crystals and DNA molecules although the material has been used extensively for the development of bone scaffolds, localized drug delivery system, etc. Understanding of this part is important for developing a novel implant material with similar mechanical properties to that of natural bone.Reference Katti11 The interaction of DNA and n-HAp are believed to play a vital role in different biomedical fields.Reference Baker, Rogers, Shepherd and Stone12 In a recent study, atomistic computer simulation methods have been used to explain the influence of the HAp surface on the binding process and stability of the DNA conformation.Reference del Valle, Bertran, Chaves, Revilla-Lopez, Rivas, Casas, Casanovas, Turon, Puiggali and Aleman13 One spectroscopic study indicated the involvement of vibrational modes of DNA, protein, and phospholipids in the microcalcifications of HAp that was formed in the organism.Reference Baker, Rogers, Shepherd and Stone12 HAp particles have been used as carriers for nonviral gene as well.Reference Zhu, Huang, Zhou, Huang, Liu, Li, Xue and Long14 Thus, n-HAp and DNA complexes were found to cross into the cell membrane and integrating into the cell genome. Recently, Okazaki et al. synthesized HAp minerals in the presence of biomolecules to study the effect of DNA on crystal growth of HAp and reported that DNA stops crystal growth of HAp and are adsorbed at the surface.Reference Okazaki, Yoshida, Yamaguchi, Kaneno and Elliott15 Bertran et al. used the molecular modeling method to study stability and structure of biominerals by forming DNA molecules embedded into HAp nanopores.Reference Bertran, del Valle, Revilla-Lopez, Chaves, Cardus, Casas, Casanovas, Turon, Puiggali and Aleman16
Another new material called mesoporous bioactive glass (MBG) has recently gained considerable attention because of its efficacy toward delivering biomoieties locally, especially for bone drug delivery, bone restoration, and bone-in growth bioactivities. MBG is favorably known for its bioactivity and ordered mesoporous channels, and considered as the third-generation of BGs. HCA formation is greatly accelerated by increasing the SSA and porosity of BGs, which indirectly enhances the bioactivity.Reference Zhao, Feng, Huo, Melosh, Fredrickson, Chmelka and Stucky17 This HCA layer has the same composition and structure as that of the mineral phase of the bone.Reference Ohtsuki, Kokubo and Yamamuro18 In comparison to BG synthesized from sol–gel route, MBG shows better ability of bone formation in vitro. Mesoporous structure allows cell migration, mass transfer, nutrients supply, and diffusion of nutrients and oxygen together with the elimination of metabolic wastes that are necessary for new tissue formation.Reference Hutmacher19 MBGs are important in biomaterial research fields due to their well-defined mesoporous structure.Reference Yan, Yu, Zhou, Tang and Zhao20 Apart from mesoporosity, MBG also shows excellent surface textural properties, higher surface area to volume ratio, and tunable pore size.Reference Zhao, Feng, Huo, Melosh, Fredrickson, Chmelka and Stucky17
On the basis just elaborated, in the present investigation we studied and established how these two materials primarily in nano form interacted with DNA molecules by performing different characterizations like absorbance, circular dichroism (CD) spectroscopy, UV-melting and isothermal titration calorimetry (ITC), which will explain not only the hitherto complexity explaining the bone ultra-structure up to molecular level but also interactions at the interface could be justified when subjected to load.
II. MATERIALS AND METHODS
A. Raw materials
n-HAp powder was synthesized by the wet precipitation method at room temperature in laboratory by using analytical reagent grade chemicals di-ammonium hydrogen ortho-phosphate (99–100%) (DAP), calcium nitrate tetra-hydrate (98–99%) (CN), ammonia solution (25–28%), and triethanolamine (98–99%) (TEA), all obtained from SD Fine-Chem, Mumbai, India. For MBG synthesis, triethyl phosphate (99.8%; TEP), tetraethyl orthosilicate (≥99%; TEOS), CN (98–99%), nitric acid (HNO3), cetyl trimethyl ammonium bromide (CTAB), and ammonium hydroxide (NH4OH; about 30% A.R.) were procured from SD Fine-Chem, Mumbai, India, while ethanol (absolute) was obtained from Merck, Mumbai, India. DDW (double distilled water) was used for all processing. DNA (calf thymus type XI42% guanine–cytosine composition) was purchased from Sigma-Aldrich.
B. Synthesis of n-HAp and MBG powders
During the synthesis of n-HAp powder, CN and DAP were used as calcium and phosphate precursors and TEA as the capping agent (details have been reported elsewhere).Reference Kundu, Ghosh, Sinha, Sen, Balla, Das and Basu21 Stock solutions of CN and DAP, each 1 M concentration in DDW, were taken in such a manner that the Ca:P molar ratio to be maintained at 1.67. Molar ratio of CN:TA was 1:0.6 during synthesis of n-HAp.Reference Kundu, Ghosh, Sinha, Sen, Balla, Das and Basu21 Furthermore, the solution was continuously stirred for 10–45 min by using a mechanical stirrer (rpm = 2000–3000) maintaining pH at 9–12 by adding ammonia solution. DAP was added dropwise at a rate of 3–5 mL/min under vigorous stirring again maintaining pH at 9–11 until end. Subsequently, the solution was aged for 48 h, which gave a gelatinous precipitate later. Finally, this was filtered by using a centrifuge (Neofuge 23R, Heal Force, Shanghai, China) at 10,000 rpm for 10 min and washed thoroughly with DDW until ammonia is removed completely. The precipitate was freeze-dried at −80 to −85 °C and 10–20 Pa (Freeze Drier, FDU-2200, Eyela, Tokyo, Japan) and kept for further material characterizations.
MBG nanopowders of the SiO2–CaO–P2O5 system were prepared using ionic surfactant CTAB as a template as described elsewhere.Reference Yun, Kim, Lee and Song22 CN, TEOS, and TEP were used as the source of Ca, Si, and P, respectively. In the synthesis of MBG, 26.4 mL of NH4OH was added dropwise (at a rate of 3–5 mL/min) in 1080 mL of distilled water, then 0.66 g of CTAB, 3 mL of TEOS, 0.13 mL of TEP, and 0.68 g of CN were added successively at 5 min intervals. Precursor solution was stirred continuously at high speed for 3 h. Furthermore, this was centrifuged at 10,000 rpm (at 25 °C for 7–10 min). Finally, the precipitate was washed carefully with distilled water to remove ammonia completely. Finally, the calcination of the as-synthesized MBG nanopowder was performed at 650 °C with the rate of 1 °C/min for 6 h before proceeding for characterizations.
C. Powder characterization
Phase characterizations were conducted by X-ray diffraction (PANalytical, Almelo, the Netherlands) using monochromatic Cu Kα1 radiation and continuous data were collected over the 2θ range from 20 to 90°. The diffraction patterns thus obtained were matched with the available database of JCPDS PDFs. FTIR (Spectrum 100, Perkin-Elmer, Waltham, Massachusetts) in middle-IR spectra, 4000 to 400 cm−1, was performed to determine the chemical bonding between the functional groups and also the stereochemistry associated with the powders by using the alkali halide (KBr) disk technique. Particle size distribution was measured by the laser scattering method (Microtrac S3500, Microtrac Inc., Montgomeryville, Pennsylvania) for both the powder in aqueous medium (double distilled water). The suspended particles were ultrasonicated for 15 min prior. Zeta potential was measured in an aqueous medium using a Zetasizer instrument (Malvern Panalytical, Malvern, United Kingdom). Zeta potential was measured for the assessment of polarity of the particles. For the measurement of SSA of the powder samples, N2 gas adsorption method multipoint Brunauer–Emmett–Teller (BET) instrument (Nova 2000, Quantachrome, Odelzhausen, Germany) was used. Nitrogen adsorption and desorption volume at a particular relative pressure were used for the purpose of field emission scanning electron microscopy (FESEM) using a Supra35 VP, Carl Zeiss, Oberkochen, Germany, to study the powder shape and morphology. Both powders were also studied by TEM (Tecnai G2 30ST, FEI, Eindhoven, the Netherlands).
For the cytotoxicity test, both powders were used in pallet form (15 mm diameter, 2 mm thick). All procedures were carried out in sterile environment using aseptic techniques. The mouse embryonic fibroblast cell line (NIH3T3) was used for this study. Both n-HAp and MBG powder pellets were autoclaved at 121 °C for 20 min for sterilization before cell culture study. The cells were directly seeded on the top surface at a density of 5000 cells/mL in 12-well tissue culture plates. Due to the high porosity of MBG samples, they soak the cell suspension easily as compared to n-HAp. One mL of aliquot DMEM (Dulbecco’s Minimum Essential Medium) accompanied with 10% of fetal bovine serum were added to a nearby area of the samples in each well plates after 2 h of cell seeding. The cell culture study was conducted for 3, 5, and 7 days (at 37 °C, 95% humidified air atmosphere and 5% CO2 environment).Reference Bernard, Balla, Davies, Bose and Bandyopadhyay23 Pellets of both powders were removed after 3, 5, and 7 days of incubation to analyze the cell and sample interactions by using a Desktop SEM (Phenom pro-X, Phenom-World, Eindhoven, the Netherlands).
To check the cell viability, MTT assay was performed by plating 5000 cells per n-HAp and MBG pellets in triplicate for 3, 5, and 7 days of incubation to evaluate the of NIH3T3 cells proliferation on both samples. Solution of MTT [3-(4,5-dimethylthiazole-2-yl)-2,5-12-phenyltetrazolium bromide] was prepared by adding 5 mg of MTT reagent (Sigma-Aldrich, Steinheim, Germany) in per mL PBS. After each interval of days, MTT solution of 100 and 900 µL of DMEM was added to each pellet of n-HAp and MBG to form formazan through the action of mitochondrial dehydrogenase. After incubation (at 37 °C, 4 h), both MTT and DMEM solutions were removed, and 1 mL of DMSO (dimethyl sulfoxide) was added. A dark purple color obtained due to dissolving the formazan crystals. The 100 µL of resulting supernatant was shifted to a 96-well plate, and absorbance study was conducted by using an ELISA reader (Spectra Max 190-microplate reader, Molecular Devices, San Jose, California) at the wave length of 595 nm. After incubation, all the pellets of both samples were washed thrice with PBS (0.1 M) and were secured with paraformaldehyde (2%)/glutaraldehyde (2%) in cacodylate buffer solution (0.1 M) overnight at 4 °C. Then dehydration of the fixed samples was performed in an ethanol series of 30, 50, 70, 95, and 100% three times with 10 min interval.Reference Bernard, Balla, Davies, Bose and Bandyopadhyay23 Then the samples were dried at room temperature and observed by SEM by mounting on an aluminum stub followed by gold coating.
D. DNA interaction study
Spectral studies (absorbance) were conducted at a temperature of 20 ± 0.5 °C by using a Jasco V660 monochromator double beam spectrophotometer (Hachioji, Japan International Co., Tokyo, Japan). For titration, quartz cells (1 cm path length) were used. The methodology was implemented by Chaires,Reference Chaires24 which is also followed during the present study and has been detailed elsewhere.Reference Islam, Chowdhury and Kumar25 Fluorescence experiments were carried out using a Quanta Master 400 (Horiba PTI, Burlington, Canada) using FelixGX spectroscopy software and an EHEIM-2232 307 instrument (GmbH & COKG, Berlin, Germany) to control the temperature during the experiment.
ITC experiment was performed using a MicroCal VP-ITC unit (MicroCal, Inc., Northampton, United Kingdom) following protocols established in the laboratory, reported elsewhere.Reference Islam, Chowdhury and Kumar25,Reference Hossain and Kumar26 Each 500 mM degassed sample solution from a rotating syringe was injected into a chamber containing DNA solution. Same procedure of adding each material into experimental buffer solution was followed for control experiments. Heat evolved in the dilution experimental part was deducted to provide heat profile for alkaloid-DNA binding. Data were plotted to provide thermodynamic parameters (ΔH 0 and K). ΔG 0 and binding entropy (TΔS 0) were calculated by using the following equations:
 $$\Delta {G^0} = - RT\ln K\quad ,$$
 $$T\Delta {S^0} = \Delta {H^0} - \Delta {G^0}\quad ,$$
where R and T represent the universal gas constant [8.31451 J/(K mol)] and absolute temperature in Kelvin, respectively.
CD spectroscopy was carried out using a Jasco J815 spectropolarimeter (Jasco International Co. Ltd., Tokyo, Japan) which contained a Peltier-controlled cuvette holder and PFD 425 L/15 (temperature controller) for testing changes occurs in conformation of DNA helix in the presence of the ceramic material as reported earlier.Reference Sinha, Islam, Bhadra, Kumar, Banerjee and Maiti27
UV melting study was carried out using a Shimadzu Pharmaspec (Shimadzu Corporation, 1700 unit, Kyoto, Japan) fitted with the TMSPC-8 Peltier-controlled model accessory. In this test, first 20 μM DNA solution was mixed with various concentrations of both powders and then the continuous change in absorbance occurred at 260 nm was noted by heating the mixture (rate of 0.5 °C/min).Reference Bhowmik, Hossain, Buzzetti, Auria, Lombardi and Kumar28 T m (melting temperature) is basically the middle point of the melting transition, which is calculated by means of the maxima of the first derivative plots.
III. RESULTS AND DISCUSSION
A. Powder characterization
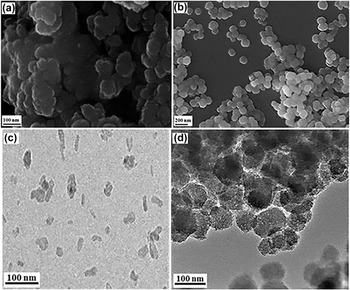
XRD of the synthesized powders are given in Fig. 1. The powders intended for n-HAp were found to have matched with JCPDS PDF no. 01-89-6438 (HAp) [Fig. 1(a)]. Corresponding positions of major peaks well matched with the standard peaks [e.g., (211) for I 100 peak at 31.77° 2θ, (112) for I 52 peak at 32.2° 2θ, and (300) for I 63 peak at 32.9° 2θ]. Average crystallite size (D) was calculated by using Scherer’s equation, D = 0.9λ/β cos θ, [where λ (0.54 nm) is the monochromatic X-ray wave length, β denotes the broadening of the diffraction peak at half of its maximum intensity, and θ is the diffraction angle (in this case 2θ = 25.88°)] and it was found to be ∼8.15 ± 4. This estimated crystallite sizes were then compared with the images obtained from FESEM data of the n-HAp powders [Fig. 2(a)]. The calculated particle/crystallite sizes well-matched as observed from FESEM microstructure. In case of MBG powder, amorphous nature can be observed from the XRD data with no peak(s) corresponding appearance of the crystalline phase which can be shown from the XRD graph of MBG [Fig. 1(b)].
XRD pattern of (a) n-HAp (PDF # 01-089-6438) and (b) MBG nanopowders [Inset: FTIR plot of (a) n-HAp and (b) MBG].

FESEM and TEM images of n-HAp [(a) and (c)] and MBG nanopowders [(b) and (d)].

FTIR spectra of both powders (n-HAp and MBG) synthesized are given in Fig. 1 (inset). It can be observed that functional groups for PO43− and OH−, that is, corresponding to HAp crystals are presented in Fig. 1(a) (inset). Very minor peaks at 1454 and 1414 cm−1 appeared due to the vibrational frequency of CO32− ions. Peaks obtained at 3431 and 1615 cm−1 were due to the absorption of the water molecules. The presence of well-defined bands at 1454 and 1414 cm−1 is assigned to CO32− groups’ incorporation in the apatite structure.Reference Tkalcec, Sauer, Nonninger and Schmidt29 A carbonate band present at 1454 cm−1 associates with the incorporation of CO32− groups at the OH site and the band at 1420 cm−1 related to the incorporation of CO32− at PO43− position in the apatite structure.Reference Narasaraju and Phebe30,Reference Suetsugu, Shimoya and Tanaka31 The band occurred at 865 cm−1 was related to both types of occupation. In Fig. 1(b) (inset), MBG powders showed characteristic Si–O–Si vibrational bands at 1086, 810, and 467 cm−1, indicating asymmetrical stretching of the bridging oxygen atoms of Si–O–Si within the tetrahedron, Si–O–Si asymmetric stretching mode, and bending mode.Reference ElBatal, Azooz, Khalil, Monem and Hamdy32 C–O vibration bands of the carbonated group for MBG powder can be confirmed from the peaks at 876 cm−1 and between 1400–1500 cm−1 also observed by Mezahi et al.Reference Mezahi, Lucas-Girot, Oudadesse and Harabi33 The peaks obtained at 575 and 953 cm−1 attributed to P–O bending vibration in PO43− group show the occurrence of calcium phosphate (Ca–P) clusters for the MBG sample. The presence of Si–O–Si, C–O, and P–O bands confirms the SiO2–CaO–P2O5 system. The presence of P–O bands may have some role for improved bioactivity behavior for MBG powder.Reference Garcia, Cicuendez, Izquierdo-Barba, Arcos and Vallet-Regi34
Zeta potential was performed to explain the stability of both powders in aqueous state. These were found to be −30 mV and −16.5 mV for n-HAp and MBG, respectively. Both particles are found to be cationic in aqueous suspension. Zeta potential is a measure of magnitude of charges on nanoparticles, the higher the value (positive or negative), the more stable the colloid dispersion is.Reference Hanaor, Michelazzi, Leonelli and Sorrell35 n-HAp showed the highest value of zeta potential which is indirect assessment of highest dispersability/stability of these particles suspended in the aqueous medium. In case of MBG, low zeta potential as compared to n-HAp indicates low electrostatic repulsion between the particles resulting in higher attraction by Van der Waals forces causing agglomeration of the particles and this may also happened due to the high value of Abbe number, which indirectly indicates low dispersion of the powder to the aqueous solution. Multipoint BET of both powders was checked which resulted the values of SSA for both powders, which are found to be 114.5 and 473.2 m2/g for n-HAp and MBG, respectively. The total pore volume and mean pore diameter of MBG were calculated and found to be 0.27 cm3/gm and 3.6 nm, respectively, conforming the mesoporosity of the BG.Reference Wu, Fan and Chang36
The morphology of powders was observed by FESEM [Figs. 2(a) and 2(b)]. In case of n-HAp [Fig. 2(a)], a cauliflower-like microstructure was observed with more or less spherical shape having lower crystallinity. The average particle size of this powder was ∼12–16 nm. In case of MBG [Fig. 2(b)], the spherical morphology of the particle was observed with particle size less than 75 nm. It appears that a spherical morphology is preferred by the usage of cationic surfactant CTAB in the reaction system at pH 3–5. Principally, it is related to the dynamics of surfactant self-assembly to spherical shape in such a way, a polar hydrophilic head is outward and hydrophobic tail is inward in ammonium water solution. When TEOS is added, the growth rate of the silica precursor is high, which conducts the formation of silica walls around the surface of micelles polar hydrophilic head. This results in the formation of spherical individuals particles.Reference Li, Chen, Ning, Yuan and Hu37 TEM, on the other hand, showed particle/pore size–shape–morphology of individual particles [Figs. 2(c) and 2(d)]. TEM images of n-HAp [Fig. 2(c)] showed the crystalline nature of the powder with a needle-like shape morphology. However, the TEM image of MBG showed the presence of mesopore channels throughout their structure. It can also be seen that the individual boundary of the MBG particulates are not well defined and its circumference is irregular.
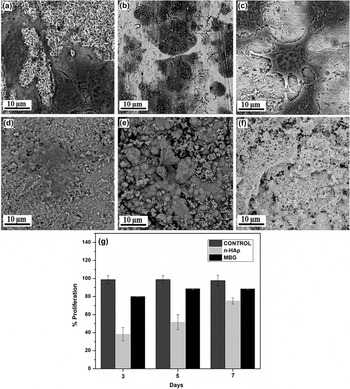
MTT assay was used to quantitatively analyze the adhesion and proliferation of viable NIH3T3 cells on n-HAp and MBG pellets. The cell morphology by SEM after MTT assay displayed cell growth of NIH3T3 on the surface of both samples which were evaluated for 3, 5, and 7 days of cell culture [Figs. 3(a)–3(c) for n-HAp and 3d–3f for MBG, respectively]. Pellets of both samples showed better cell adherence and cell in-growth had taken place inside the pores of pellets as well. NIH3T3 cells showed a flattened morphology and well spread over pellets surface after day 7 for n-HAp [Fig. 3(c)] and MBG [Fig. 3(f)]. Cell adherence and viability results suggest that both samples were biocompatible in nature. The viability of NIH 3T3 cells on the pellet surface is considered by measuring the optical density of the solution by using an ELISA reader. Figure 3(g) represents the comparison of viable cell density for both samples after 3, 5, and 7 days of culture. Both sample pellets showed biocompatibility nature and superior growth kinetics. The maximum cell viability was observed in MBG after 7 days (90%) while n-HAp showed nearly 80% viable cells. These observations proved that both the samples were noncytotoxic.
NIH3T3 cell morphology on the sample surface by SEM on (a–c) n-HAp and (d–f) MBG after 3, 5, and 7 days, respectively, and % proliferation (viability) (g).

B. DNA interaction study
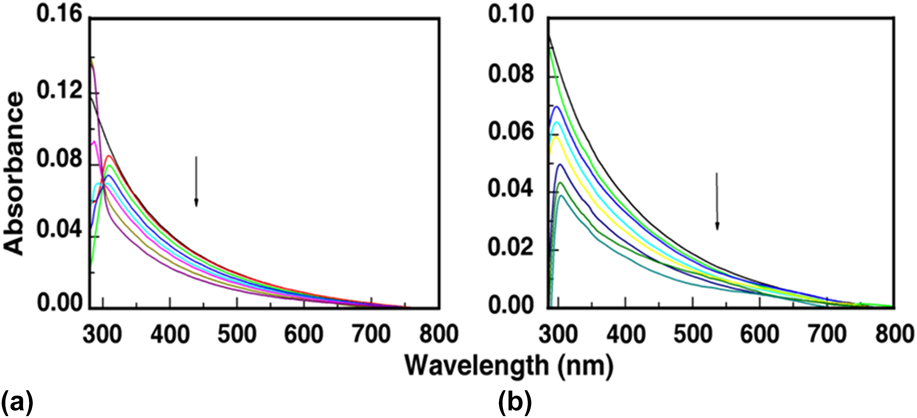
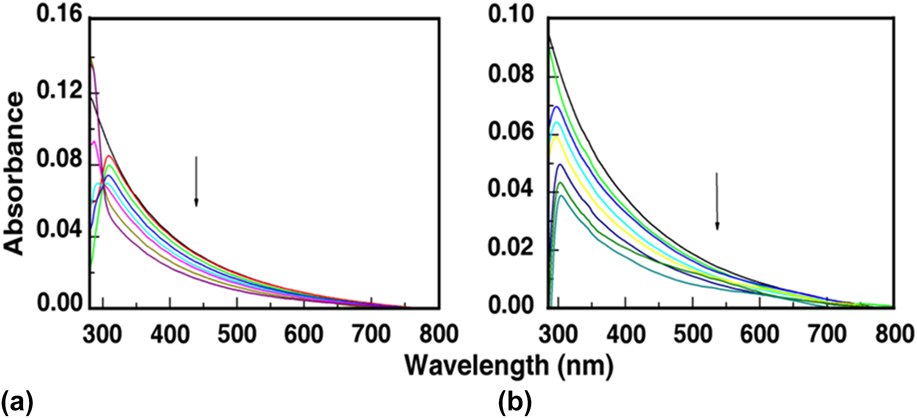
Absorbance spectroscopy is an important tool that characterizes the interaction between inorganic powder and DNA. Both n-HAp and MBG have showed absorption spectra without any peak maxima (Fig. 4). However, due to the addition of DNA, a peak was generated at 308 and 296 nm, respectively, in both cases with decreasing peak maxima intensity. In case of n-HAp, there is an isosbestic point observed, which indicates an equilibrium binding between n-HAp and DNA in the solution phase. But, in case of MBG, no such isosbestic point was observed.
Absorption spectral titration of (a) n-HAp and (b) MBG in the presence of successive addition of DNA.
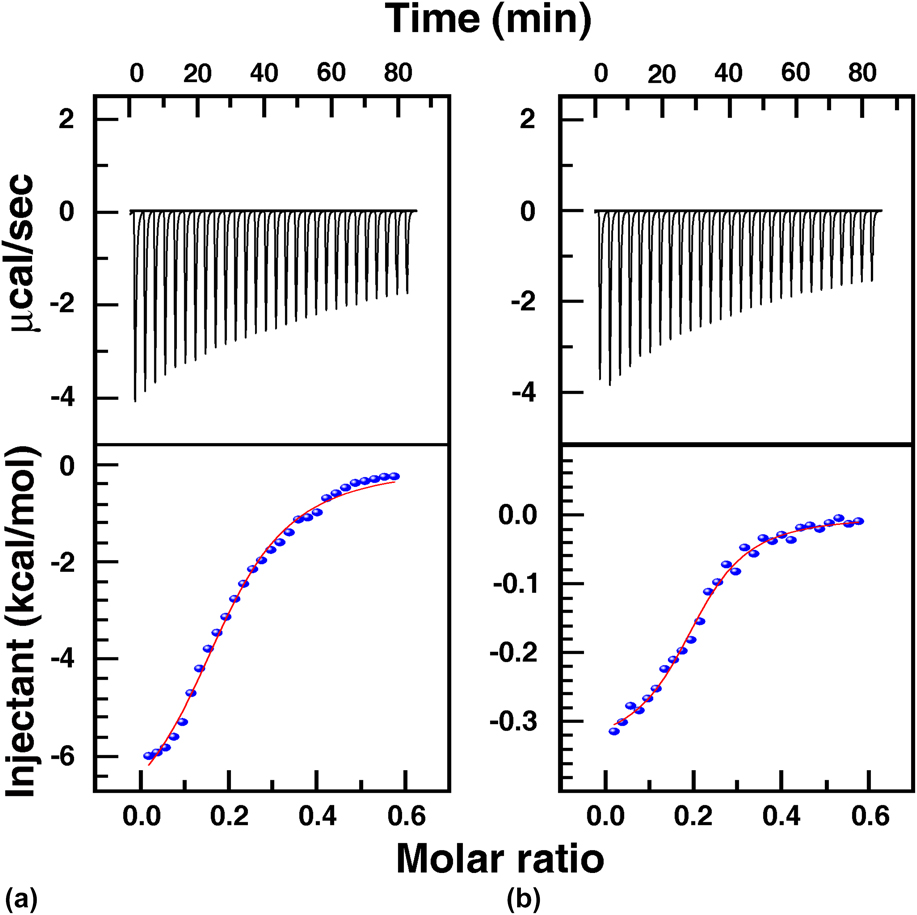
Energetics of the interaction between nanomaterials and biomolecules can be characterized by the ITC method. Binding enthalpy is measured directly with high accuracy. The technique also provides stoichiometry along with binding affinity data by a single titration. Separation of Gibbs binding energy into enthalpy and entropy could be analyzed by using ITC data, which indicates the overall nature of forces that initiate binding interaction. In Fig. 5, each heat burst curve indicates a single injection and then correction of heats can be done by deducting the matched dilution heat that is found from the control experimental heat by putting equal amount of nanoparticle solutions to the buffer solution as shown at upper part of the figure. The corrected heat of the complex is shown in lower portion of Fig. 5 (plotted against molar ratio). The binding obtained in each case was characterized by endothermic heat. The lower data point of the figure is related to the experimental points along with continuous lines (calculated best fit to the model).Reference Chatterjee and Kumar38,Reference Chatterjee and Kumar39
ITC results of (a) n-HAp and (b) MBG nanopowders.

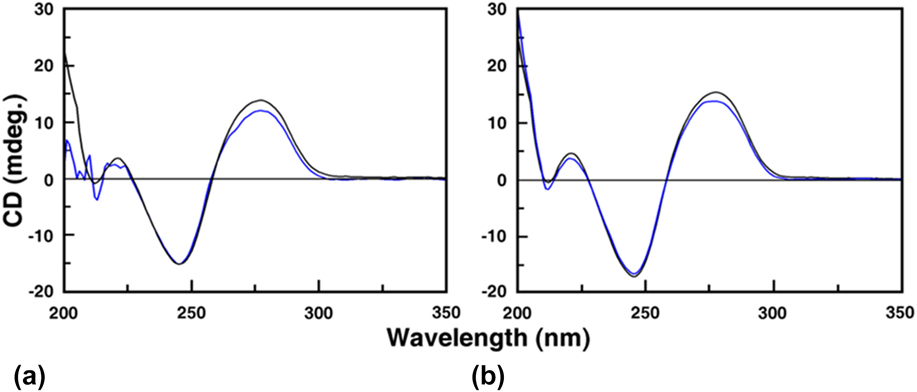
The collective ITC data showed that the interaction between the CT DNA and the materials is spontaneous in nature with ΔG < 0. The high positive value of entropic contribution in both events clearly recommends that the binding of n-HAp and MBG to the DNA involves disruption of an H-bonded water molecule network and displaced Na+ ions on the DNA surface, resulting in an increase in entropy value and forming the thermodynamic system energetically favorable. The ΔH 0 and K-value for n-HAp were found to be −2.216 kcal/mol and 1.26 × 10⁵ M−1 and those of MBG were found to be −0.3251 kcal/mol and 1.59 × 10⁵ M−1, respectively. From these two values, ΔG 0 for both materials was calculated, i.e., 1.26 × 10⁵ kcal/mol for n-HAp and −7.0891 kcal/mol for MBG. The higher value of K indicates that the affinity of DNA to MBG was slightly higher than that of n-HAp.Reference Chatterjee and Suresh Kumar40 CD spectra of DNA arise from the asymmetric backbone sugars and the helical arrangement of its B-form conformation. The DNA duplex shows characteristic CD spectra in the range of 275–280 nm (positive band) because of the base stacking interactions between adjacent bases and a negative band around 248 nm is mainly because of the helicityReference Roy, Chatterjee, Pramanik, Devi and Kumar41 shown in Fig. 6. Due to the addition of n-HAp and MBG to a 60 μM solution of DNA, molar ellipticity of the DNA was changed revealing that the materials are interacted with the DNA molecule.Reference Roy, Chatterjee, Pramanik, Devi and Kumar41
CD spectra of DNA (black curve) in the presence of (a) n-HAp and (b) MBG (blue curve).

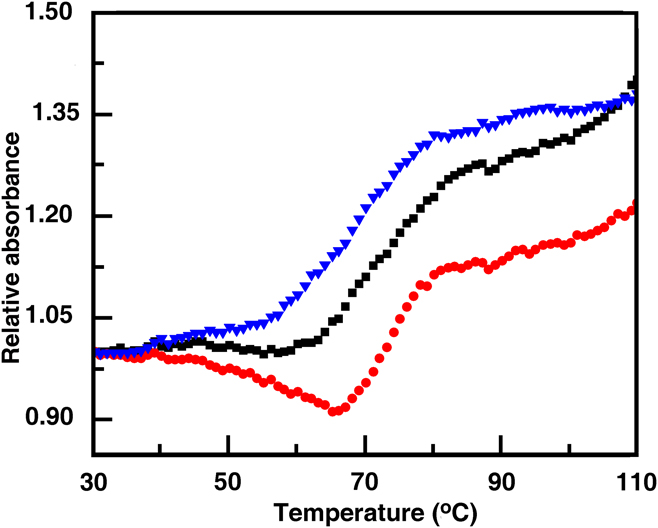
Thermal melting studies were performed to understand whether the ceramic materials’ binding have altered the stability of DNAs. ΔT m is the difference in melting temperature (T m) values between the bound and the control duplex and a shift may represent the binding-induced thermal stabilization or destabilization. Under the experimental conditions, CT DNA showed a melting temperature (T m) of 68.4 °C. In the presence of MBG and n-HAp, the melting temperatures were shifted to 77.2 °C and 75.8 °C, respectively, shown in Fig. 7, suggesting that the nanoparticle stabilized DNA helix to a considerable extent. ΔT m values were around 9 °C and 6.5 °C for MBG and n-HAp, respectively.Reference Das, Pramanik, Chatterjee, Das, Devi and Suresh Kumar42
Thermal melting profile of only DNA (blue) and in the presence of n-HAp (black) and MBG (red).

IV. CONCLUSIONS
n-HAp powder by using TEA as the capping agent and MBG by using ionic surfactant CTAB were synthesized successfully. A detailed comparative evaluation on their phases, band assignments, stability in aqueous medium, morphology, particle size analysis, and surface area were extensively characterized. Cytotoxicity test confirmed the biocompatible and nontoxic nature of both powders. After that DNA intercalation study was carried out with both n-HAp and MBG powder by performing different characterization studies, i.e., absorption study, ITC, CD, and UV melting. Both the powders showed good interaction with DNA, which was confirmed from these above studies. However the binding ability of the MBG powder was slightly better as compared to n-HAp powder, which can be seen from the ITC result.
ACKNOWLEDGMENTS
The authors are grateful to Director, CSIR-Central Glass and Ceramic Research Institute and Director, CSIR-Indian Institute Chemical Biology, Kolkata, India, for their kind support to this work. This work is financially supported by Society for Biomedical technology (SBMT), Government of India through Project No. GAP0241. Personnel associated to material characterizations are acknowledged sincerely.