Introduction
LaFeAsO0:9F0:1 was reported in 2008 to be a superconductor with a T c around 26 K at ambient pressureReference Kamihara, Watanabe, Hirano and Hosono1 and around 43 K under applied pressure up to 4 GPa.Reference Takahashi, Igawa, Arii, Kamihara, Hirano and Hosono2 Its parent compound, LaFeAsO, which has alternate La2O2 sheets made from edge-sharing OLa4 tetrahedra and Fe2As2 sheets made from edge-sharing FeAs4 tetrahedra, undergoes a tetragonal-to-orthorhombic phase transition at a temperature T s around 160 K and an antiferromagnetic ordering transition at T m around 140 K. Since then, the iron pnictide superconductors have been under extensive investigation. In part, this is because several new families of superconductors were discovered based on the idea that superconductivity could arise from structurally and chemically similar compounds (see the article by Sefat and Singh in this issue). In addition, the interplay between superconductivity, magnetism, and crystal structure in these new Fe-based superconductors is so rich that it could significantly contribute to the understanding of the origin of high-T c superconductivity (see References Reference Canfield and Bud’ko3–Reference Johnston5 and references therein).
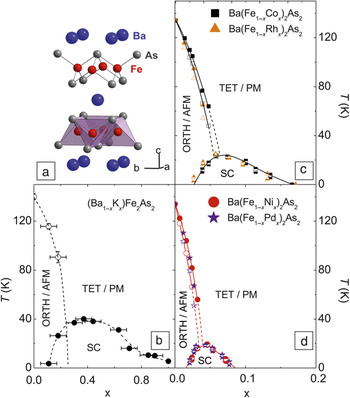
Among the Fe-based superconductors, doped BaFe2As2 compounds (members of the family called 122 because of their chemical formula) have been studied most systematically. They have become a model system for understanding high-temperature superconductivity in Fe-based superconductors because large, high-quality, homogeneous single crystals can be easily grown and reproduced, especially transition-metal doped BaFe2As2.Reference Canfield and Bud’ko3 The parent compound, BaFe2As2, shows structural and physical properties similar to LaFeAsO: it consists of alternating Ba and Fe2As2 layers, the latter made from edge-sharing FeAs4 tetrahedra, as shown in Figure 1a. The compound also manifests simultaneous structural (tetragonal to orthorhombic) and magnetic (paramagnetic to antiferromagnetic) phase transitions at T s= T m = 134 K.Reference Rotter, Tegel, Johrendt, Schellenberg, Hermes and Pöttgen6
(a) Crystal structure of BaFe2As2. (b) T–x phase diagram of (Ba1–xKx)Fe2As2 series.Reference Rotter, Pangerl, Tegel and Johrendt8 (c) T–x phase diagrams of Ba(Fe1–xTMx)2As2 (TM = Co and Rh) series.Reference Ni, Thaler, Kracher, Yan, Bud’ko and Canfield9 (d) T–x phase diagrams of Ba(Fe1–xTMx)2As2 (TM = Ni and Pd) series.Reference Ni, Thaler, Kracher, Yan, Bud’ko and Canfield9 ORTH, orthorhombic; TET, tetragonal; AFM, antiferromagnetic; PM, paramagnetic; SC, superconducting.

When doped with K, BaFe2As2 is the first oxygen-free Fe-based superconductor to have a critical temperature T c up to 38 K.Reference Rotter, Tegel and Johrendt7 With K doping, the structural and magnetic phase transitions are monotonically suppressed; superconductivity is stabilized in a dome-like region centered near the critical doping concentration where the antiferromagnetism (AFM) is completely suppressed; superconductivity and antiferromagnetism coexist in the underdoped region (Figure 1b).Reference Rotter, Pangerl, Tegel and Johrendt8 Although these are the universal features of the phase diagrams of all doped BaFe2As2 superconductors as well as BaFe2As2 under pressure, the suppression rates of T s and T m and the dome ranges differ with the dopant or other tuning parameter. In this article, we briefly summarize the current view of the phase diagrams of electron-, hole-, and isoelectronic-doped BaFe2As2, as well as BaFe2As2 under pressure, focusing on the empirical trends inferred from these phase diagrams and the universal behavior observed in these series.
Phase diagrams of electron- and hole-doped BaFe2As2
In BaFe2As2, superconductivity can be tuned by 3d (Co, Ni, Cu, Co/Cu mixture),Reference Canfield and Bud’ko3 4d (Rh, Pd),Reference Ni, Thaler, Kracher, Yan, Bud’ko and Canfield9 and 5d (Ir, Pt)Reference Wang, Shi, Yan, Yuan, Lu, Wang and Zhao10–Reference Saha, Drye, Kirshenbaum, Butch, Zavalij and Paglione12 electron doping. The phase diagrams of these doped series show universal behavior and can be compared quantitatively due to the successful growth of homogeneous single crystals of the doped materials.Reference Canfield and Bud’ko3Figure 1c and 1d summarize two pairs of phase diagrams of Ba(Fe1–xTMx)2As2 single crystals: the TM = Co, Rh pair and the TM = Ni, Pd pair.Reference Canfield and Bud’ko3, Reference Ni, Thaler, Kracher, Yan, Bud’ko and Canfield9, Reference Nandi, Kim, Kreyssig, Fernandes, Pratt, Thaler, Ni, Bud’ko, Canfield, Schmalian, McQueeney and Goldman13, Reference Kreyssig, Kim, Nandi, Pratt, Tian, Zarestky, Ni, Thaler, Bud’ko, Canfield, McQueeney and Goldman14 In these doping series, the structural and magnetic phase transitions at T s= T m= 134 K in BaFe2As2 are monotonically suppressed and separated with doping. Superconductivity up to ∼24 K for Co- or Rh-doping and ∼19 K for Ni- or Pd-doping is found in both tetragonal/paramagnetic and orthorhombic/antiferromagnetic phasesReference Canfield and Bud’ko3 and stabilized in a dome-like region of the phase diagram. Figure 1c and 1d clearly show that (1) the phase diagram of Co-doped BaFe2As2 is almost identical to that of Rh-doped BaFe2As2, and the phase diagram of Ni-doped BaFe2As2 is almost identical to that of Pd-doped BaFe2As2, despite the differences in the lattice parameters and related structural quantities between 3d and 4d dopants in each pair;Reference Canfield and Bud’ko3 (2) there is a clear difference between these two pairs of phase diagrams in the sense that the extent of the superconductivity dome, in terms of x, for the Co/Rh pair is twice that for the Ni/Pd pair; the lines of structural and magnetic transitions behave somewhat similarly.
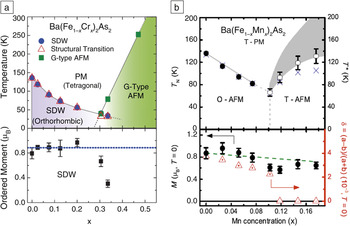
Superconductivity has not been observed so far in the transition metal, hole-doped series: Ba(Fe1–xTMx)2As2 (TM = Mn and Cr.Reference Sefat, Singh, VanBebber, Mozharivskyj, McGuire, Jin, Sales, Keppens and Mandrus15–Reference Kim, Kreyssig, Thaler, Pratt, Tian, Zarestky, Green, Bud’ko, Canfield, McQueeney and Goldman18 Instead, the competing orders in these doping series are different types of magnetism.Reference Marty, Christianson, Wang, Matsuda, Cao, VanBebber, Zarestky, Singh, Sefat and Lumsden17, Reference Kim, Kreyssig, Thaler, Pratt, Tian, Zarestky, Green, Bud’ko, Canfield, McQueeney and Goldman18Figure 2 shows the phase diagrams of Ba(Fe1–xTMx)2As2 (TM = Mn and Cr) inferred from neutron diffraction and bulk measurements.Reference Sefat, Singh, VanBebber, Mozharivskyj, McGuire, Jin, Sales, Keppens and Mandrus15, Reference Marty, Christianson, Wang, Matsuda, Cao, VanBebber, Zarestky, Singh, Sefat and Lumsden17, Reference Kim, Kreyssig, Thaler, Pratt, Tian, Zarestky, Green, Bud’ko, Canfield, McQueeney and Goldman18 For both Mn- and Cr-doping, (1) the structural and magnetic phase transitions in BaFe2As2 are initially monotonically suppressed with doping, and no separation of these two transitions like that seen for electron doping is detected; (2) when T s and T m are suppressed down to ∼50–70 K, instead of superconductivity, G-type AFM ordering with a propagation vector of (1, 0, 1) (in the tetragonal basis) for Cr-doping and “stripe-like” or “two-Q” AFM ordering with a propagation vector of (1/2, 1/2, 1) for Mn-doping are found. The magnetic ordering temperatures of these new magnetic phases increase upon further doping. These trends differ from the Ba(Fe1–xCox)2As2 case, in which superconductivity occurs when the magnetic order is suppressed. Such contrasting behavior between transition-metal electron- and hole-doping suggests that in the case of Mn- and Cr-doping, superconductivity might be precluded by the stabilization of new magnetic phases. It is noteworthy that the initial suppression rate of T m with doping (dT m/dx) is very similar for TM = Cr and Mn and is approximately a factor of two lower than that in the case of TM = Co, Rh, Ni, and Pd. Qualitatively, such difference in dT m/dx can be expected since the magnetic moment is approximately constant for the former doped series,Reference Marty, Christianson, Wang, Matsuda, Cao, VanBebber, Zarestky, Singh, Sefat and Lumsden17, Reference Kim, Kreyssig, Thaler, Pratt, Tian, Zarestky, Green, Bud’ko, Canfield, McQueeney and Goldman18 whereas it decreases monotonically to zero for the latter series.Reference Kreyssig, Kim, Nandi, Pratt, Tian, Zarestky, Ni, Thaler, Bud’ko, Canfield, McQueeney and Goldman14, Reference Fernandes, Pratt, Tian, Zarestky, Kreyssig, Nandi, Kim, Thaler, Ni, Canfield, McQueeney, Schmalian and Goldman19–Reference Dioguardi, Roberts-Warren, Shockley, Bud’ko, Ni, Canfield and Curro21
T–x phase diagrams as well as the ordered moment obtained from neutron scattering measurements of (a) Ba(Fe1–xCrx)2As2 seriesReference Marty, Christianson, Wang, Matsuda, Cao, VanBebber, Zarestky, Singh, Sefat and Lumsden17 and (b) Ba(Fe1–xMnx)2As2 series.Reference Kim, Kreyssig, Thaler, Pratt, Tian, Zarestky, Green, Bud’ko, Canfield, McQueeney and Goldman18 PM, paramagnet; SDW, spin density wave; AFM, antiferromagnet; O, orthorhombic; T, tetragonal.

Isoelectronic doping and pressure
As discussed previously, hole doping (on the alkaline-earth site) and, particularly, electron doping (on the Fe site) present relatively simple ways to suppress magnetism and induce superconductivity. However, two alternative approaches, which do not imply distinct shifts of the Fermi level, have also been successfully implemented.
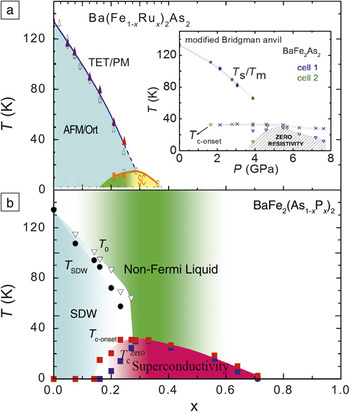
Superconductivity has been induced by Ru substitution on the Fe siteReference Sharma, Bharathi, Chandra, Reddy, Paulraj, Satya, Sastry, Gupta and Sundar22–Reference Kim, Pratt, Rustan, Tian, Zarestky, Thaler, Bud’ko, Canfield, McQueeney, Kreyssig and Goldman25 and by P substitution on the As site.Reference Jiang, Xing, Xuan, Wang, Ren, Feng, Dai, Xu and Cao26, Reference Kasahara, Shibauchi, Hashimoto, Ikada, Tonegawa, Okazaki, Shishido, Ikeda, Takeya, Hirata, Terashima and Matsuda27 Angle-resolved photoemission spectroscopy (ARPES) measurementsReference Brouet, Rullier-Albenque, Marsi, Mansart, Aichhorn, Biermann, Faure, Perfetti, Taleb-Ibrahimi, Le Fevre, Bertran, Forget and Colson28 suggest that Ru doping is indeed isoelectronic, with no holes or electrons added. Figure 3 presents the phase diagrams of Ba(Fe1–xRux)2As2Reference Kim, Pratt, Rustan, Tian, Zarestky, Thaler, Bud’ko, Canfield, McQueeney, Kreyssig and Goldman25 and BaFe2(As1–xPx)2Reference Kasahara, Shibauchi, Hashimoto, Ikada, Tonegawa, Okazaki, Shishido, Ikeda, Takeya, Hirata, Terashima and Matsuda27 single crystals. For both doping schemes, the appearance of the phase diagrams is similar to those of electron doping, although for Ru doping, no splitting between the structural and magnetic phase transitions—as was found for electron doping—is detected. (In the case of P doping,Reference Kasahara, Shibauchi, Hashimoto, Ikada, Tonegawa, Okazaki, Shishido, Ikeda, Takeya, Hirata, Terashima and Matsuda27 it is not clear if the splitting between structural and magnetic transitions develops, since the transition temperatures were determined from bulk measurements using a criterionReference Kasahara, Shibauchi, Hashimoto, Ikada, Tonegawa, Okazaki, Shishido, Ikeda, Takeya, Hirata, Terashima and Matsuda27 different from the one used for Co doping, which was confirmed by neutron/x-ray scattering.Reference Kreyssig, Kim, Nandi, Pratt, Tian, Zarestky, Ni, Thaler, Bud’ko, Canfield, McQueeney and Goldman14) In Ba(Fe1–xRux)2As2, the maximum T c is around 18 K, with the superconducting dome spanning from x ∼0.18 to ∼0.36. In BaFe2(As1–xPx)2, superconductivity is stabilized over an extended dome regime from x ∼0.14 to ∼0.7, with the highest T c around 31 K.
(a) T–x phase diagrams of Ba(Fe1–xRux)2As2 single crystals determined by bulk and neutron scattering measurements.Reference Kim, Pratt, Rustan, Tian, Zarestky, Thaler, Bud’ko, Canfield, McQueeney, Kreyssig and Goldman25 Inset: The T–P phase diagram of BaFe2As2 obtained using a modified Bridgman anvil cell.Reference Colombier, Bud’ko, Ni and Canfield30 (b) BaFe2(As1–xPx)2 single crystals determined by transport and thermodynamic measurements.Reference Kasahara, Shibauchi, Hashimoto, Ikada, Tonegawa, Okazaki, Shishido, Ikeda, Takeya, Hirata, Terashima and Matsuda27 SDW, spin density wave; TET, tetragonal; PM, paramagnetic; AFM, antiferromagnetic; Ort, orthorhombic.

Superconductivity can also be induced in BaFe2As2 by external pressure P.Reference Alireza, Ko, Gillett, Petrone, Cole, Lonzarich and Sebastian29–Reference Yamazaki, Takeshita, Kobayashi, Fukazawa, Kohori, Kihou, Lee, Kito, Iyo and Eisaki31 It is known that the degree to which the pressure is hydrostatic can strongly affect the T–P phase diagramReference Paglione and Greene4, Reference Yamazaki, Takeshita, Kobayashi, Fukazawa, Kohori, Kihou, Lee, Kito, Iyo and Eisaki31, Reference Canfield, Bud’ko, Ni, Kreyssig, Goldman, McQueeney, Torikachvili, Argyriou, Luke and Yu32 due to the highly anisotropic compressibility and high responsivity to (local and global) stresses and strains of the materials in the 122 family. This leads to different T s and T m suppression rates and to different extents of the superconducting dome under pressure. However, despite these differences, the key features of the T–P phase diagram are similar. The inset in Figure 3a shows the T–P phase diagram obtained using a modified Bridgman anvil cell.Reference Colombier, Bud’ko, Ni and Canfield30 With applied pressure, the structural and magnetic phase transitions at 134 K are monotonically suppressed, and no separation of these two is observed. Superconductivity occurs when T s and T m are suppressed sufficiently, and T c(P) has a dome-like shape, with its maximum occurring at a pressure close to that needed to suppress T s and T m to zero.
The induced superconductivity in these two isoelectronic doping cases is often viewed as a chemical analogue to applied pressure. This view appears to be oversimplified because (1) Ru doping and P doping do not change the lattice in a similar manner; and (2) the substitution of Ba by isoelectronic Sr, which has a smaller ionic radius and thus introduces chemical pressure into the system, results in neither superconductivity nor the suppression of T s and T m.Reference Wang, Yang, Ma, Tian, Shi, Lu, Zeng and Li33 Recent high-resolution x-ray diffraction measurementsReference Rotter, Hieke and Johrendt34 suggest that although Sr doping results in similar unit-cell parameters to that of the superconducting BaFe2(As1–xPx)2 samples, the Fe–As bond length decreases by less than 0.5% with x = 1 Sr doping, whereas it monotonically decreases by 1.5% with x ∼0.5 P doping. This suggests a possible relation between the Fe–As bond length and the suppression of T s and T m.Reference Rotter, Hieke and Johrendt34
Transition metal electron-doped BaFe2As2—Empirical trends
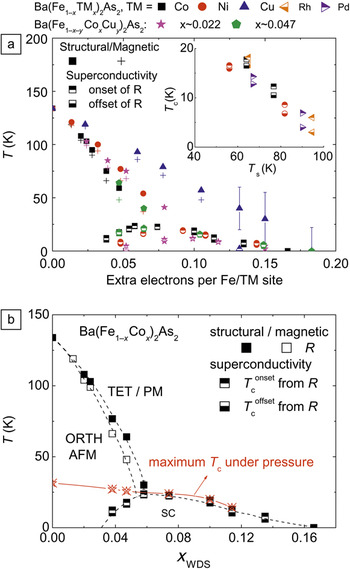
The effects of 3d and 4d transition metal electron dopants on BaFe2As2 single crystals have been discussed in detail in References Reference Canfield and Bud’ko3 and Reference Ni, Thaler, Yan, Kracher, Colombier, Bud’ko, Canfield and Hannahs35. Here we present a brief summary. Considering that the T–x phase diagrams of Co/Rh- and Ni/Pd-doping pairs are basically identical (Figure 1), for simplicity, we plot the structural, magnetic, and superconducting critical temperatures of BaFe2As2 doped with Co-, Ni-, Cu- and two different sets of (Co+Cu)-dopings as a function of the number of extra electrons. We define e, the extra electron count per TM site as x for Co or Rh doping, 2x for Ni or Pd doping, and 3x for Cu doping. Except for Cu doping, the superconducting dome, in particular in the overdoped part, scales well with e (Figure 4a), whereas the structural/magnetic transitions scale reasonably well with doping concentration.Reference Canfield and Bud’ko3 For the underdoped part of the dome, there appears to be a clear correlation between T c and T s (or between T c and T m) (Figure 4a, inset). These observations lead to the understanding that T c in the underdoped regime is determined by T s(T m), while T c in the overdoped regime is controlled by the extra electrons added.
(a) T–e phase diagrams of Ba(Fe1–xTMx)2As2 (TM = Co, Ni, Cu, and Co/Cu).Reference Ni, Thaler, Yan, Kracher, Colombier, Bud’ko, Canfield and Hannahs35 Inset: superconducting transition temperature T c as a function of structural phase transition temperature, T s, in Ba(Fe1–xTM x)2As2 (TM = Co, Rh, Ni, and Pd). Note that T c versus T m results in similar scaling. (b) Comparison of the effects of chemical doping and application of pressure for the Ba(Fe1–xCox)2As2 series.Reference Ni, Thaler, Yan, Kracher, Colombier, Bud’ko, Canfield and Hannahs35, Reference Colombier, Torikachvili, Ni, Thaler, Bud’ko and Canfield36 ORTH, orthorhombic; TET, tetragonal; AFM, antiferromagnetic; PM, paramagnetic; SC, superconducting; WDS, wavelength dispersive spectroscopy.

Taken together, these observations suggest that there are two necessary, but individually not sufficient, conditions for superconductivity: (1) the structural/magnetic phase transitions should be suppressed to a sufficiently low temperature; and (2) there exists a range of extra electron values e, inside which superconductivity can be stabilized if T s(T m) are sufficiently suppressed. For the case of Cu doping, the extra electron window is missed, thus only limited superconductivity with T c ∼2 K is observed.
This argument appears to be consistent with the examples of isoelectronic doping discussed previously and is reinforced by the pressure measurements for pure and Co-doped BaFe2As2,Reference Colombier, Bud’ko, Ni and Canfield30, Reference Colombier, Torikachvili, Ni, Thaler, Bud’ko and Canfield36 which are summarized and compared with the T–x phase diagram in Figure 4b.Reference Canfield and Bud’ko3 For the overdoped side of the superconductivity dome, T cmax(x), the maximum T c value measured under pressure for a given x differs only slightly from the T c values at ambient pressure; however, for the underdoped side, it increases and shows how large T c can potentially be if T s(T m) are fully suppressed. This observation clearly indicates that the two necessary, but not individually sufficient, conditions for superconductivity in this series seem to apply to different halves of the superconducting dome.
Phase diagrams and Lifshitz transitions
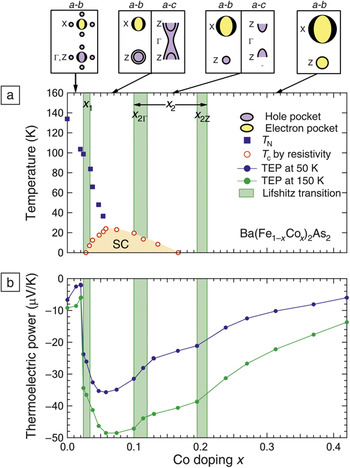
The picture of simple filling of rigid bands that was assumed in the extra-electron, e, scaling discussed previously has been challenged in some band structure calculations.Reference Wadati, Elfimov and Sawatzky37 Experimentally, though, it appears to be supported by a recent Hall and Seebeck coefficientReference Deok Mun, Bud’ko, Ni, Thaler and Canfield38 and ARPES measurements.Reference Liu, Kondo, Fernandes, Palczewski, Mun, Ni, Thaler, Bostwick, Rotenberg, Schmalian, Bud’ko, Canfield and Kaminski39 Both Hall and Seebeck coefficients measured at constant temperature (below T s and T m for Hall) for Ba(Fe1–xCox)2As2 and Ba(Fe1–xCux)2As2 approximately scale with e, suggesting the applicability of the rigid-band approximation (at least for small x values). However, the results of these studiesReference Deok Mun, Bud’ko, Ni, Thaler and Canfield38, Reference Liu, Kondo, Fernandes, Palczewski, Mun, Ni, Thaler, Bostwick, Rotenberg, Schmalian, Bud’ko, Canfield and Kaminski39 and their recent extensionsReference Liu, Palczewski, Kondo, Fernandes, Mun, Hodovanets, Thaler, Schmalian, Bud’ko, Canfield and Kaminski41, Reference Lifshitz42 go beyond mere recognition of applicability of the rigid-band approximation in these materials. Drastic changes of the Fermi-surface topology (Lifshitz transitionsReference Lifshitz42) have been suggested by anomalies in the transport measurementsReference Deok Mun, Bud’ko, Ni, Thaler and Canfield38, Reference Hodovanets, Mun, Thaler, Bud’ko and Canfield40, Reference Fang, Luo, Cheng, Wang, Jia, Mu, Shen, Mazin, Shan, Ren and Wen43, Reference Rullier-Albenque, Colson, Forget and Alloul44 and observed by ARPESReference Liu, Kondo, Fernandes, Palczewski, Mun, Ni, Thaler, Bostwick, Rotenberg, Schmalian, Bud’ko, Canfield and Kaminski39, Reference Liu, Palczewski, Kondo, Fernandes, Mun, Hodovanets, Thaler, Schmalian, Bud’ko, Canfield and Kaminski41 for several ranges of Co concentrations in Ba(Fe1–xCox)2As2 (Figure 5).Reference Liu, Palczewski, Kondo, Fernandes, Mun, Hodovanets, Thaler, Schmalian, Bud’ko, Canfield and Kaminski41
(a) Location in the Ba(Fe1–xCox)2As2 phase diagram of the known Lifshitz transitions, at which the Fermi surface topology changes, and the associated features in the superconducting and antiferromagnetic transition temperatures T c and T N. Top insets show the schematic Fermi surface topology in the a–b and a–c planes for each region in the phase diagram. (b) Thermoelectric power (TEP) versus doping for two different temperatures.Reference Liu, Palczewski, Kondo, Fernandes, Mun, Hodovanets, Thaler, Schmalian, Bud’ko, Canfield and Kaminski41

These topological changes appear to be relevant for superconductivity. On the underdoped side, the superconductivity emerges at the doping level, where a Lifshitz transition reduces the magnetically reconstructed Fermi surface to its paramagnetic appearance.Reference Liu, Kondo, Fernandes, Palczewski, Mun, Ni, Thaler, Bostwick, Rotenberg, Schmalian, Bud’ko, Canfield and Kaminski39 Upon further doping, T c starts to decrease when the cylindrical, central hole pocket changes to ellipsoids centering at the Z point, and goes to zero before these ellipsoids disappear around x = 0.2. Beyond this doping level, the central pocket changes from hole- to electron-like, and superconductivity does not exist.Reference Liu, Palczewski, Kondo, Fernandes, Mun, Hodovanets, Thaler, Schmalian, Bud’ko, Canfield and Kaminski41 A necessary condition for superconductivity in Ba(Fe1–xCox)2As2 appears to be the presence of the central hole pockets rather than perfect nesting between central and corner pockets.
Summary
Either doping or applying pressure to BaFe2As2 results in qualitatively similar phase diagrams. The closely linked structural and magnetic transitions are suppressed, and if they are suppressed to a sufficiently low temperature (or/and low enough magnetic moment), and the material is within a certain range of carrier concentration (certain Fermi-surface topology), superconductivity emerges. With increasing doping or pressure, superconductivity and magnetism initially coexist, but after complete suppression of structural and magnetic transitions, T c starts to decrease and ultimately disappears. However, in non-superconducting Ba(Fe1–xMnx)2As2, Ba(Fe1–xCrx)2As2, new magnetic phases emerge, while in (Ba1–xSrx)Fe2As2, no suppression of magnetism is observed, so the empirical trends just outlined are not satisfied.
Very similar behavior was reported on doping or under pressure for SrFe2As2 and CaFe2As2, although these two materials are more sensitive to the local or global stress that may lead to the observation of filamentary superconductivity. The pressure behavior of CaFe2As2, however, is much more complex due to the appearance of the collapsed tetragonal phase (Reference Reference Canfield, Bud’ko, Ni, Kreyssig, Goldman, McQueeney, Torikachvili, Argyriou, Luke and Yu32 and references therein). For these and historical and practical reasons, T–x and T–P phase diagrams have been explored to a lesser extent.
We would like to conclude with a word of caution. It is tempting to look for universalities in the physical properties and mechanism of superconductivity for all iron-pnictide superconductors. On a gross level, the issues discussed previously appear to extend beyond the cases of doped BaFe2As2, at least to the 1111 family. However, ∼30 K superconductivity was recently discovered in AxFe2–ySe2 (A = K, Rb, Cs),Reference Guo, Jin, Wang, Zhu, He and Chen45 which has a crystal structure very similar to the 122 family. In the case of AxFe2–ySe2, the superconducting state (1) occurs very deep in the magnetically ordered state with a large magnetic moment,Reference Shermadini, Krzton-Maziopa, Bendele, Khasanov, Luetkens, Conder, Pomjakushina, Weyeneth, Pomjakushin, Bossen and Amato46–Reference Ryan, Rowan-Weetaluktuk, Cadogan, Hu, Straszheim, Bud’ko and Canfield48 and (2) possibly has an insulating/semiconducting parent compoundReference Bao, Li, Huang, Chen, He, Green, Qiu, Wang and Luo49 that might violate the premises of some models of superconductivity that have been suggested for iron-pnictides. At this stage, it might be wiser to patiently continue collecting reliable experimental data on different families with an optimistic hope that “everything in this world can volunteer some reply, what takes up time is posing the questions,”Reference Saramago and Pontiero50 and the physical picture will emerge later.
Acknowledgments
We would like to thank P.C. Canfield for countless fruitful discussions, adult supervision, and providing a local example of how to practice Gonzo science. Collaboration and support of the members of Novel Materials and Ground States Group, Condensed Matter Physics Program and Division of Materials Sciences and Engineering at Ames Laboratory/Iowa State University is greatly appreciated. N. Ni would like to thank R.J. Cava for discussions and the support by the AFOSR MURI on superconductivity. Work at the Ames Laboratory was supported by the U.S. Department of Energy, Office of Basic Energy Science, Division of Materials Sciences and Engineering. Ames Laboratory is operated for the U.S. Department of Energy by Iowa State University under Contract No. DE-AC02-07CH11358. S.L.B. was supported, in part, by the State of Iowa through Iowa State University. We are grateful to Chang Liu for providing us with a modified version of Figure 4 from Reference Reference Liu, Palczewski, Kondo, Fernandes, Mun, Hodovanets, Thaler, Schmalian, Bud’ko, Canfield and Kaminski41 and stimulating endless discussions.