

Williams syndrome (WS) is a rare neurodevelopmental disorder caused by a microdeletion of approximately 25 genes on the long arm of chromosome 7 (Osborne, Reference Osborne, Morris, Lenhoff and Wang2006). In addition to common physical features (Morris, Reference Morris, Morris, Lenhoff and Wang2006), WS is associated with cognitive impairments and a diagnostic profile that contrasts severe deficits in visuospatial constructive abilities with relative strengths in verbal short-term memory and language skills (Mervis et al., Reference Mervis, Robinson, Bertrand, Morris, Klein-Tasman and Armstrong2000). There is wide variability in IQ in WS, but most studies report mean intelligence in the range of mild to moderate mental retardation. People with WS also present with a characteristic personality profile, often showing high levels of social disinhibition, empathy, anxiety, and an intense interest in people (Gosch & Pankau, Reference Klein-Tasman and Mervis1997; Klein-Tasman & Mervis, Reference Mervis2003).
WS was originally thought to provide a model for the dissociation of linguistic and cognitive abilities (Bellugi, Marks, Bihrle, & Sabo, 1988). This view has been challenged in recent years, as fine-grained analyses of different aspects of language functioning in WS have revealed a complex picture of relative strengths in some areas, and delay or relative impairment in others (Karmiloff-Smith, Brown, Grice, & Patterson, Reference Karmiloff-Smith, Brown, Grice and Paterson2003; Mervis, Reference Mervis, Winograd, Fivush and Hirst1999, Reference Mervis2003, Reference Mervis, Morris, Lenhoff and Wang2006). One area of research interest has been the paradoxical relation between linguistic competence and social communicative functioning in people with WS, who are extremely motivated to interact with other people but lack the ability to appropriately or effectively sustain and monitor such interactions.
The first reports of unusual language proficiency in adolescents with WS were published over 15 years ago, in studies of elicited narratives based on the Frog, Where Are You? picture book (Mayer, Reference Mayer1969). Reilly, Klima, and Bellugi (1990) compared narratives produced by a small group of adolescents with WS to those of well-matched adolescents with Down syndrome (DS) and mental age-matched typically developing (TD) children, focusing on assessments of basic language production measures, an index of prosodic features of speech, and use of narrative enhancement devices, which included a variety of linguistic devices that went beyond narrating the basic events in the story. These narrative enhancement devices, also referred to as evaluative language, included references to the emotional and other mental states of story characters, dramatic devices such as character speech or sound effects, exclamatory phrases, and emphatic markers to capture the attention of the listener, and inclusion of causal and other types of inferences. The adolescents with WS used more prosody (e.g., instances of pitch changes, vocalic lengthening, modifications in volume calculated as a “prosodic index”) than did either comparison group, and produced more narrative enhancement devices than did the DS group. These findings were interpreted as reflecting a unique expressive language style used by people with WS.
Follow-up studies by this same research group (Losh, Bellugi, Reilly, & Anderson, 2000; Reilly, Losh, Bellugi, & Wulfeck, 2004) using the same picture book compared larger groups of children with WS with two age-matched control groups: one composed of TD children, and one of children with specific language impairment (SLI). Findings from these studies largely confirmed the increased use of evaluative devices, a composite measure based on use of emotion and mental state terms, dramatic language, sounds effects, and character speech and inferences, in the narratives produced by children with WS, revealing their “particular preference for types of evaluation which serve as social engagement devices, reflecting their profile of excessive sociability” (Losh et al., Reference Losh, Bellugi, Reilly and Anderson2000, pp. 265–266). Thus, the children with WS used a significantly greater amount of evaluation than did either the SLI or the TD groups, and employed a range of different evaluative devices comparable to the TD control group. In particular, the WS group used more “social engagement devices” (which included sound effects, character speech, and audience hookers) than did comparison groups, but fewer cognitive inferences, especially among the 4- to 9-year-olds. However, in line with their general intellectual impairment, the children with WS scored significantly lower than either comparison group on narrative measures that tap cognitive inferencing skills, such as story structure and integrating themes.
Jones and colleagues (2000) reported on several discourse contexts including storytelling, picture descriptions, and biographical interviews involving questions about participants’ interests, family, or activities. A consistent finding across these different discourse contexts was the increased use of social evaluative devices by children and adolescents with WS compared to control groups matched on age or developmental level. Social evaluative devices were defined as elements that served to engage the listener and included descriptions of affective states, emphatic markers, and character speech. The authors also provided anecdotal reports of the participants with WS “turning the tables” on the experimenter and asking personal questions, suggesting that the increased use of social engagement devices may not always be accompanied by socially appropriate discourse skills.
Stojanovik, Perkins, and Howard (Reference Stojanovik, Perkins and Howard2004) compared children with WS and children with SLI on their language abilities in story-telling tasks. A microanalysis of the use of linguistic devices (e.g., cohesive ties, various grammatical markers, and complex syntactic structures) did not yield any significant differences between groups in their spontaneous morphosyntactic abilities. Moreover, in this study, the children with WS tended to use fewer linguistic devices (cohesive ties, grammatical markers, and complex syntactic structures) than did the SLI children, although they tended to produce longer narratives overall when prompted by the adult researcher. This study suggests that the increased use of social evaluative devices reported in earlier studies of narrative in WS might not be linked to standard linguistic measures of grammatical and discourse features.
The idea that people with WS use an enhanced expressive style in communication that emerges from these studies of narrative and other discourse genres, contrasts with growing evidence of difficulties with the pragmatic aspects of discourse in this population. Several studies have explored the social use of language by people with WS through conversation samples. One of the first studies to systematically investigate expressiveness in the conversation of people with WS was conducted by Udwin and Yule (Reference Udwin and Yule1990), who examined the claim that children with WS use “cocktail party speech.” A group of 43 school-age children with WS participated in a half-hour interaction with an adult researcher. Just over one-third of the children with WS (16 participants) were classified as hyperverbal, which was defined as fluent speech, with excessive use of stereotyped phrases, idioms, overfamiliarity of language, a habit of introducing irrelevant personal experiences into conversation and perseverative responding. The group with WS did not differ significantly from a group of matched children with intellectual disabilities in the quantity or grammatical complexity of speech produced. However, the WS group did use significantly more idioms, social phrases, and fillers than did the control group, and proportionally more of the WS group displayed an overfamiliar manner. These findings underscore the need for more systematic investigations of how individuals with WS use language in a variety of contexts and how well this use serves social communication functions.
More recently, Stojanovik (Reference Stojanovik2006) compared the pragmatic conversational abilities of children with WS to a control group of children with SLI matched on verbal ability and a control group of age-matched TD children. Semistructured language samples were obtained through picture descriptions, after which the children were asked to discuss their own experiences and interests. Although the children with WS produced longer responses than the SLI group, their responses contained fewer continuations in which additional information was offered than either control group. Compared to the TD group, both the children with WS and the children with SLI provided fewer adequate responses to the researcher's requests for information and clarification. The WS group also tended to provide too little relevant information and had more difficulty inferring meaning than the TD group. The results of this study corroborate findings of pragmatic language difficulties in children and adults with WS as assessed with the Children's Communication Checklist (Laws & Bishop, Reference Laws and Bishop2004), a parent report measure designed to identify pragmatic impairments in five domains: appropriateness of the initiation of communication, coherence of conversation, tendency to use stereotyped conversation, use of conversational context, and conversational rapport. Laws and Bishop (Reference Laws and Bishop2004) found that children and young adults with WS differed from TD children in all five areas, and were also rated by parents as less skilled than matched groups with other language disabilities in the use of stereotyped conversation and initiation of conversation.
Thus, previous studies provide evidence of enhanced expressive style but poor pragmatic competence in the communication style of people with WS. Across a variety of studies in which connected discourse samples were elicited, children and adolescents with WS differed from control groups on measures of expressiveness such as use of affective prosody or social evaluation, but most of these studies were based on relatively small samples and a restricted age range, which did not include adults. Only one study included the use of prosodic devices as a variable of interest (Reilly et al., Reference Reilly, Klima and Bellugi1990), but few details about how prosody was measured were provided.
The study reported here was designed to clarify some of the apparently contradictory findings regarding the expressive quality of language used by individuals with WS. The first goal was to test whether increased expressive style would be found in connected discourse produced by adults with WS. We investigated the verbal productions of a large sample of adolescents and adults with WS compared to two control groups: one of individuals with learning/intellectual disabilities (LID) matched on chronological age, IQ, vocabulary knowledge, and gender, and the other of TD individuals matched on age and gender with both the WS and the LID groups. Language samples were elicited using a simple picture description task. We assessed expressive style using a combination of content-based analyses and acoustic analyses of prosody, based on both audio recordings and transcripts of participants’ responses. A second goal of our study was to investigate whether the possible group differences in the use of expressive devices between participants with WS and controls would be reflected in how naive judges rated the expressive quality of the verbal productions of the different participant groups, and how such perceptions of expressiveness in communication related to indices of social-adaptive functioning in WS.
Methods
Participants
The study included adolescents (12 to 17 years, 11 months [17;11], M = 14.9) and adults (18 to 34;5, M = 22.4) from three populations: 38 participants with WS (22 adolescents, 16 adults), 36 participants with LID of mixed etiologies (21 adolescents, 15 adults), and 37 TD individuals (24 adolescents, 13 adults).
The participants with WS were recruited through the Williams Syndrome Association and their diagnosis was confirmed through genetic testing (FISH test). The participants with LID were recruited through a residential school serving this population and were screened for autism spectrum behaviors using the parent report instrument the Social Responsiveness Scale (Constantino, Reference Constantino2004). Five individuals were excluded because they received high scores on this instrument. The TD participants were recruited through local schools and other referral sources.
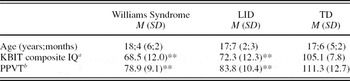
All three groups were matched on age, F (2, 108) = .30, p = .74, and gender, and the WS and LID groups were also matched on KBIT composite IQ scores (Kaufman & Kaufman, Reference Kaufman and Kaufman1990; p = .19) and receptive vocabulary (Peabody Picture Vocabulary Test, Third Edition; Dunn & Dunn, Reference Dunn and Dunn1997; p = .13). Table 1 presents details of the participant groups.
Participant characteristics

Note: WS, Williams syndrome; LID, Learning/intellectual disability; TD, typically developing; PPVT, Peabody Picture Vocabulary Test.
aWS and LID < TD.
bWS and LID < TD.
**p < .01.
Picture description task
Participants were asked to describe the “Cookie Theft” picture from the Boston Diagnostic Aphasia Examination Battery (Goodglass & Kaplan, Reference Goodglass and Kaplan1983). This is a complex line drawing depicting a sink overflowing with water as the mother washes dishes, and two children taking cookies from a jar behind the mother's back. This picture was chosen because it has been used widely across other language-impaired populations, as well as with individuals with WS (Jones et al., Reference Jones, Bellugi, Lai, Chiles, Reilly and Lincoln2000), and because it is appropriate for a broad age range, including adults. After the participant described the picture, the researcher gave a generic prompt, “Anything else?” until the participant indicated that she or he had finished. All verbal responses were digitally recorded and later transcribed.
Social adaptive functioning
The parents of the participants with WS completed a standardized parent-report instrument designed to measure adaptive functioning in individuals with intellectual disabilities: the Scales of Independent Behaviors—Revised (SIB-R; Bruininks, Woodcock, Weatherman, & Hill, Reference Bruininks, Woodcock, Weatherman and Hill1996), which includes A Social Interaction And Communication Cluster of scales, designed to measure social communicative abilities in everyday life. Ratings on a 4-point scale (0 = never to 3 = does very well) cover various behaviors relevant to social interaction and communication (e.g., “Talks about the same things that others in a group are talking about,” “Answers a telephone call and writes down a message for someone who is not there,” “Uses complex sentences containing ‘because'”).
Content analyses
Linguistic production measures. All verbal productions were transcribed verbatim by trained transcribers who were unaware of the participants’ group membership. Basic linguistic production measures were obtained using the default dictionary setting of the Linguistic Inquiry and Word Count computer program (Pennebaker, Francis, & Booth, Reference Pennebaker, Francis and Booth2001), which provided the following measures used in the analyses: total number of words, mean number of words per sentence (where sentence was defined by standard methods based on pause length and intonation), and dysfluencies (e.g., “Um,” “mmh,” false starts).
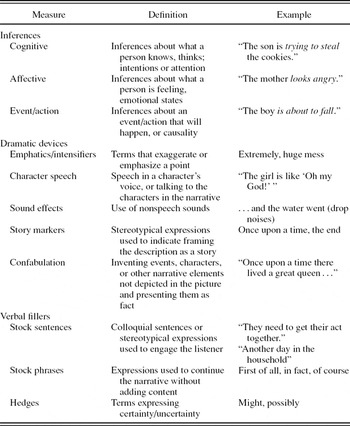
Evaluative content measures. A coding system was developed, based on methods used in previous studies with individuals with WS (Losh et al., Reference Losh, Bellugi, Reilly and Anderson2000; Reilly et al., Reference Reilly, Losh, Bellugi and Wulfeck2004), to assess the use of evaluative content devices in the transcripts. Table 2 provides the list of categories of content devices coded, with definitions and examples. Based on a random selection of 12 transcripts, three researchers, unaware of participant diagnostic group, created 11 indices, divided into inferences, dramatic devices, and verbal fillers to capture the different aspects of evaluative content that were produced by the participants in this study.
Evaluative content measures

Two independent raters, unaware of participant diagnostic group, coded the transcripts for content devices and used the audio recordings directly to code character speech and sound effects. Interrater reliability was established by first training the raters together on 20% of the transcripts, with disagreements being resolved by a third rater. The raters then coded an additional 20% of the transcripts, reaching interrater reliability greater than 80%. The remaining transcripts were coded by one of the trained raters.
Acoustic measures. The acoustic properties of the sound files were analyzed using Praat speech software (Boersma & Weenink, Reference Boersma and Weenink2006). The acoustic variables were selected based on previous work on expressive prosody (e.g., Gerken & McGregor, Reference Gerken and McGregor1998; Shriberg et al., Reference Shriberg, Paul, McSweeny, Klin, Cohen and Volkmar2001; Sidtis & Van Lancker Sidtis, Reference Sidtis and Van Lancker Sidtis2003). Pitch, duration and intensity measurements were first taken for the entire narrative, but because mean narrative durations were significantly different across groups, acoustic analyses of speech rate (average number of syllables/s), pitch (fundamental frequency [F0]) mean, maximum, and range (measured as pitch modulation above the mean pitch and obtained by dividing the maximum F0 by the mean F0 for each recording), and mean intensity (volume) were conducted on the second set of 10 words in each audio file.Footnote 1 The first 10 words were not included in analysis to eliminate any effects of false starts or other hesitations that might occur as the participant formulates how he or she will describe the picture. We focused our analyses on a set of 10 words because of the variable length of the language samples we obtained from the participants, which in some cases were very brief (<30 words total).
Expressiveness ratings. The audio recordings were assessed for expressiveness by 20 adult raters (10 male, 10 female), naive to both the purpose of the study and the participant groups. They were asked to listen to the audio recordings, presorted in randomized order, and to rate each one for expressiveness on a 4-point Likert scale. Our instructions invited the judges to provide an overall subjective impression of the language samples that incorporated both content and prosody. The following definitions of the rating scale were given to participants:
Rating 0: Utterly monotonous, sounding unnatural or robotic. If you have to strain to hear any change in pitch, rate it a 0.
Rating 1: Flat-sounding or unengaged. Some prosody is present, but not as much as in normal conversational speech or it is not consistently used. Often these speech samples have a falling pitch at the end of each sentence, but little other pitch variation.
Rating 2: Normal, engaged conversation, typical for everyday conversation, including some variations in pitch or intensity.
Rating 3: More expressive or dramatic than everyday conversation; may sound quite exaggerated or “theatrical.”
The raters were provided with both written instructions and sample audio files to calibrate what a speech sample might sound like at each of the four levels of expressive quality.
Results
Linguistic production measures
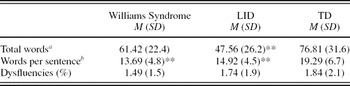
Table 3 presents group means (and standard deviations) for the linguistic productivity measures. One-way analyses of variance (ANOVAs) were conducted to examine group differences for: total number of words in each narrative, words per sentence, and dysfluencies. Significant group differences were found for total number of words, F (2, 108) = 10.74, p < .001, and for mean words per sentence, F (2, 108) = 10.86, p < .001, but not for dysfluencies (F < 1). Post hoc Scheffé pairwise comparisons indicated that the TD group used significantly more words than the LID group (p < .001), but showed only a trend toward greater total number of words than the WS group (p = .052), whereas the differences between the WS and LID groups on this measure did not reach statistical significance (p = .09). The TD group used significantly more words per sentence than did either the WS or the LID group (p < .01 and p < .001, respectively), whereas the WS and LID groups did not differ on this measure (p = .63). There were no significant differences between adolescents and adults in any of the three diagnostic groups on these productivity measures.
Measures of linguistic production

Note: WS, Williams syndrome; LID, Learning/intellectual disability; TD, Typically developing.
aTD and WS > LID.
bTD > WS and LID.
**p < .01.
Evaluative content measures
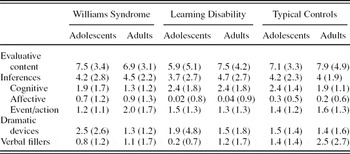
To control for the group differences in productivity, the content measures were converted into ratio scores, dividing the frequency of each measure by the total word count for each participant. Group comparisons of the ratio scores were analyzed using nonparametric Kruskal–Wallis ANOVAs because of significant negative skew in the distribution of the ratio scores. Analyses were conducted on each of the different types of inferences and the combined dramatic devices and verbal fillers (see Table 4).
Mean ratios (standard deviations) for each category of evaluative content per 100 words

Groups differed significantly in the proportional use of affective inferences (χ2 = 8.69, p < .02), and verbal fillers (χ2 = 11.52, p < .01). Follow-up Mann–Whitney U tests revealed that the WS group used more affective inferences than both the LID (z = −2.49, p < .02) and TD groups (z = −2.3, p < .03). The TD group used more verbal fillers than both the WS (z = −2.27, p < .03) and LID groups (z = −3.17, p < .01).
Although group differences in the proportional use of dramatic devices did not reach statistical significance, because several studies reported that children and adolescents with WS were striking in their use of some of these devices, we followed up on which participants were most likely to use these aspects of evaluative content. Overall, the WS participants were more likely to use at least one of the following devices: character speech, sound effect, story marker, or confabulation (28.9% of participants) than the LID or TD participants (16.7 and 8.1%, respectively), χ2 (2, N = 111) = 5.58, p = .062, suggesting a trend supporting the earlier research on children and adolescents with WS.
Finally, we created a composite evaluation measure to capture the speaker's interpretation of the events depicted that was modeled after a similar measure defined in previous studies (e.g., Losh et al., Reference Losh, Bellugi, Reilly and Anderson2000), and which included the sum of all the evaluative content devices used. A Kruskal–Wallis ANOVA on this composite variable revealed significant group differences in the overall use of evaluation (χ2 = 10.21, p < .01). Follow up Mann–Whitney U tests revealed that the WS group and the TD group used more evaluative devices than did the LID group (z = −2.48, p < .02, and z = −2.92, p < .01, respectively), but there were no significant differences between the WS and TD group (p = .39). To examine age effects in the use of evaluation, we compared the adolescents and the adults from the WS and LID groups separately; Mann–Whitney U tests revealed that these group differences were driven by the increased use of evaluation by the adolescents with WS compared to the adolescents with LID (z = −2.14, p < .04), whereas the adults in the WS and LID groups did not differ significantly on this measure. However, when examining differences in use of evaluative language based on the ratio variable created by dividing the composite total evaluation variable by total word count for each language sample, the group differences in proportional use of evaluation did not reach statistical significance (χ2 = 1.41, p = .49).
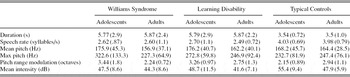
Acoustic measures. An inspection of data distributions showed that the selected acoustic measures of prosody had normal distributions; therefore, we used parametric statistical analyses to examine group differences. Preliminary analyses of the total duration of the language samples indicated significant group differences, F (2, 108) = 3.7, p < .03, and post hoc Scheffé pairwise comparisons showed that the duration of the language samples of the WS group was significantly longer than that of those produced by the LID group (M = 33.54 vs. 25 s, respectively, p < .03), with other pairwise comparisons nonsignificant. Because of the differences in sample duration we selected the second set of 10 words from each recording to conduct acoustic measurements of prosody, as described earlier.
Table 5 presents the means (and standard deviations) for the acoustic measures of prosody for each group of participants. There were significant group differences in speech rate, F (2, 108) = 30.96, p < .001, because of the TD participants speaking significantly faster (at M = 4.01 syllables/s) than did either of the clinical groups (M = 2.62 syllables/s for the WS and M = 2.61 syllables/s for the LID, p < .01 for each Scheffé post hoc comparison). The WS and LID groups were overall very similar in rate of speech, and no significant differences were found in the rate of speech of adolescents compared to adults in any of the groups.
Means (standard deviations) for each category of acoustic measurements based on the second set of 10 words

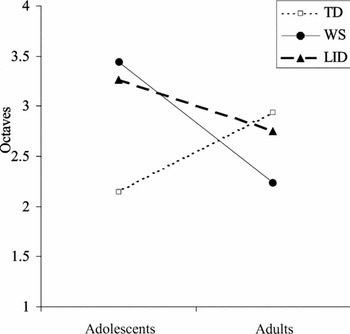
An ANOVA on pitch range modulation with diagnostic group and age group as between- subjects factors yielded no significant main effects for diagnostic group, F (2, 103) = 1.23, p = .29, partial η2 = .02, or for age group, F (1, 103) = 1.69, p = .19, partial η2 = .02, but showed a significant Age × Diagnostic Group interaction, F (2, 103) = 6.03, p < .01, partial η2 = .11 (see Figure 1). Follow-up analyses comparing adolescents and adults separately within each diagnostic group revealed that the WS adults used a narrower pitch modulation range than did the WS adolescents, F (1, 36) = 6.46, p < .02, partial η2 = .15, whereas the reverse was true for the TD group, in which adults used a larger pitch range than did the adolescents, F (1, 35) = 5.41, p < .03, partial η2 = .13. Although in the LID group there was a trend toward the use of a larger pitch range modulation by adolescents compared to adults, this difference was not significant, F (1, 32) = 1.59, p = .21, partial η2 = .05. There were no significant group differences on any other acoustic measures of prosody.
The mean pitch range modulation for the diagnostic group and age group.

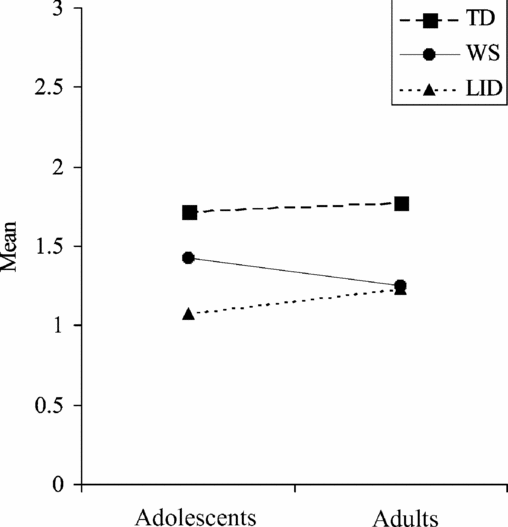
Expressiveness ratings. Mean expressiveness ratings were calculated for each group, and are shown in Figure 2. Analyses were conducted using Kruskal–Wallis ANOVA, because of the ordinal nature of this measure. Results showed significant group differences for expressiveness ratings, χ2 = 26.41, p < .001, and follow up pairwise Mann–Whitney U tests indicated that the TD group was rated as significantly more expressive than both the WS (z = −3.52, p < .001) and LID (z = −4.93, p < .001) groups, which did not differ significantly from one another (z = −1.72, p = .09). In the WS group there was a significant negative correlation between expressiveness ratings and age (r s = −.349, p < .04), whereas in the control groups no significant correlations were found between expressiveness ratings and age (r s = .15, p = .38 for the TD group and r s = −.06, p = .73 for the LID group).
The mean expressiveness ratings by diagnostic group and age group.
To investigate the relationship between expressiveness ratings and the proportional use of various evaluative content measures, we computed nonparametric (Spearman) correlations for each group. In the WS group only dramatic devices ratio was significantly correlated with expressiveness ratings (r s = .437, p < .01), whereas in the LID group significant correlations were found for overall narrative evaluation (r s = .405, p < .02), as well as for two types of evaluative devices: dramatic devices (r s = .375, p < .03) and verbal fillers (r s = .427, p < .01). No significant correlations were found for any evaluative devices and expressiveness ratings in the TD group.
Correlations were also computed between expressiveness ratings and acoustic measures within each diagnostic group. For the TD group only, speech rate was significantly correlated with expressiveness ratings (r s = .426, p < .01).
Expressiveness and adaptive social communication scores. For the WS group, scores on the Social Communication Skills Cluster of the SIB-R were significantly correlated with expressiveness ratings (r s = .380, p < .02), suggesting that better real-life adjustment to the demands of social interaction and communication is reflected in the expressive quality of the language used in picture descriptions.
Discussion
The main goal of this study was to investigate the expressive language style used by adolescents and adults with WS, who were compared to age-matched typical controls and age-, IQ-, and receptive vocabulary-matched individuals with learning or intellectual disabilities on a picture description task. We used a variety of measures to assess the participants’ connected discourse including content coding, acoustic analyses, and ratings of expressiveness by naive raters. The main findings provided some support for earlier studies reporting an unusual expressive narrative style used by children and adolescents with WS, but this was only found in the content coding measures. Across several of our measures we found age-related declines in the expressive characteristics of the language in the WS group. Finally, we found that ratings of expressiveness in the WS group were significantly correlated with parental report measures of social communicative competence.
As noted in the introduction, several studies have reported on the striking expressive style used by children and adolescents with WS (Losh et al., Reference Losh, Bellugi, Reilly and Anderson2000; Reilly et al., Reference Reilly, Klima and Bellugi1990, Reference Reilly, Losh, Bellugi and Wulfeck2004). This style encompasses both prosodic features and dramatic narrative elements that serve to engage the listener, including, for example, sound effects, character speech, and reference to the affective states of story characters. In our study the only evaluative content device that was used significantly more by the participants with WS compared to either control group was affective inferencing, supporting the findings from Reilly et al. (Reference Reilly, Klima and Bellugi1990) and Losh et al. (Reference Losh, Bellugi, Reilly and Anderson2000). The global evaluation measure did distinguish between the WS and LID groups, suggesting that people with WS may use more narrative evaluations than people with other developmental disabilities. The TD group was equivalent to the WS group on this variable, so the picture descriptions of individuals with WS were not exceptional in evaluative content. Across the groups, fewer differences in the use of various evaluative content devices emerge when compared on the proportional use of these devices relative to the total number of words in each language sample. Although participants with WS were more likely to use some dramatic devices compared to the control participants, this difference did not reach significance. In contrast to earlier work, we did not find differences in the prosodic characteristics of the WS group in comparison to the LID group, and naive raters listening to the audio recordings did not find the connected discourse of the WS group to be more expressive than those of the LID group.
Overall, our findings do not reveal as many remarkable expressive features in the language from the participants with WS as reported in other studies. One possible interpretation is the difference in the verbal production task we used. Most of the earlier studies relied on a story retelling task, using a book based on fantasy characters, Frog, Where Are You? In contrast, we used a simpler picture description task that may not appropriately elicit narrative evaluation expressed as particular devices, such as character speech, sound effects, or audience hookers. In addition, our task did not elicit very long language samples from many of the participants. This may have limited the opportunities for producing highly expressive language. The limited length of the samples that we collected represents a limitation of our study, and suggests that our findings should be replicated on longer samples of language elicited in a broader range of discourse contexts.
Our study also differs from previous research in the way the evaluative content and prosodic characteristics were measured and analyzed. To adjust for differences in length of narratives, proportional measures of content devices were computed instead of relying on absolute frequency. Prior studies calculated proportional use relative to the number of propositions in each language sample, whereas we computed proportional use relative to the total word count. Given the differences in complexity and length of propositions in the language samples of the three groups, with the WS and LID groups using less complex propositions, we selected total word count as the denominator, a choice that may have contributed to the more limited group differences found in our study in the proportional use of evaluative devices. For the prosodic measures, we used objective acoustic analyses of audio files instead of ratings. We also adopted a more conservative methodology for measuring prosodic characteristics, based on selecting a set of 10 words for acoustic measurements, and controlling for natural individual differences in pitch by using a pitch range modulation variable obtained by dividing the maximum fundamental frequency by the mean fundamental frequency for each participant. It is possible that the acoustic measurement procedures we used may have impeded fully capturing the prosodic richness of the participants’ verbal productions, but if this were the case, it should have been reflected in the expressiveness ratings obtained from naive judges, who were asked to rate global expressiveness, including both prosodic and content features. Consistent with the acoustic measures of prosody, raters unaware of group membership rated the verbal productions of the participants with WS lower than those of their age-matched typical controls and not significantly differently from those of the participants with LID.
It is interesting that we did not find significant correlations between expressiveness ratings and any of the evaluative content measures in the TD group. In contrast, in the WS group ratings of expressiveness were related to the use of dramatic devices, and in the LID group the overall use of evaluation and two particular types of evaluative language, narrative fillers and dramatic devices, were also related to expressiveness ratings. In the TD group expressiveness ratings were correlated with speech rate, a pattern not found in the WS and LID groups. Thus, it appears that differences in the groups’ speech profiles affect the raters’ implicit reliance on different aspects of the verbal samples in their subjective ratings of expressiveness, such as use of dramatic devices in the WS and LID groups, and fluency or rapid speech rate among the TD participants. These findings underscore qualitative differences in the speech of individuals with developmental disabilities (cf. Kernan, Sabsay, & Rein, Reference Kernan, Sabsay and Rein1986; Shriberg & Widder, Reference Shriberg and Widder1990).
One important finding in this study is the significant negative correlation between expressiveness ratings and age found only for the participants with WS. Moreover, in the WS group we found a decline with age in the proportional use of dramatic devices, evaluation, and pitch range. In contrast to previous research, our study included a group of older participants (18 to 34;5). This extended age range enabled us to capture age-related changes in these aspects of expressive language, changes that appeared to be unique to the WS group.Footnote 2 These declines in expressiveness in adulthood may also explain why we found fewer significant differences in expressive features in the language from the participants with WS compared to controls than reported in other studies, which had included younger participants. Even though previous studies have not focused on developmental changes in the expressive style of people with WS beyond adolescence, our finding is consistent with results of a study by Reilly and colleagues (2004) who examined various aspects of expressive language in 36 children with WS divided into three age groups (4–6, 7–9, and 10–12 years). They found the most dramatic usage of evaluation, especially social evaluation, in the youngest group, with the proportional use of evaluative devices decreasing with age, as shown in their figure 8 (Reilly et al., Reference Reilly, Losh, Bellugi and Wulfeck2004, p. 240). What might explain these age-related changes in expressiveness in WS? One possibility is that the changes are related to their social experiences as they get older. Perhaps in school settings and in interactions with other people children and adolescents with WS receive negative feedback on their overly expressive linguistic style and in response, they modify their language to conform to their peers. A second possibility is that physical changes in their vocal chords, related to elastin insufficiency, might explain the reductions in pitch range found in adulthood.
Our relatively large sample of participants with WS did include a few adolescents who used an abundance of evaluative and prosodic devices who fit the profile of having an unusually expressive language style, but it is important to acknowledge that a minority of cases does not represent the overall group profile, and that significant heterogeneity in the use of expressive devices is present in all groups, but even more so in the WS and LID groups. This conclusion is supported by the range of standard scores (49–101) on the SIB-R social communicative competence scale, scores that were significantly correlated with expressiveness ratings in the WS group. The SIB-R provides a parent report-based measure of social communicative abilities, and the positive correlation with expressiveness ratings does not support the hypothesis of a clear-cut contrast between “remarkable expressive abilities” and impairments in pragmatic skills in individuals with WS, as suggested by apparently conflicting findings from previous research. To the contrary, it appears that those individuals with WS who are considered to be more adept at social communication and interaction by their parents tend to be considered more expressive in their language style. Unfortunately, we were not able to collect parent ratings of social communication skills from the LID or TD groups, so we do not know whether this relationship between expressiveness and social communicative abilities extends to other populations with or without disabilities.
The results of this study provide new evidence for the view, which has been emerging from more recent research, that there is considerable heterogeneity in linguistic abilities in the WS population, and that expressive style in communication is not a straightforward outcome of social motivation in WS. Moreover, expressive language style appears to be related in complex ways to both social motivation and social experience, given the age-related trends found in several aspects of the verbal productions of the participants with WS. Future research should focus on the biological and experiential factors that contribute to this heterogeneity so that we can delineate the mechanisms that underlie variability in expressive language skills in people with WS and develop more effective interventions for both children and adults with this and other developmental disorders.
This study contributes to refining the description of the behavioral phenotype of WS in the domain of language use and demonstrates how a methodologically rigorous and comprehensive approach to assessing expressive style of language, by using adequate sample sizes and taking developmental considerations into account, may lead to a more complex picture than that of a syndrome-specific behavioral phenotype characterized by certain strengths and weaknesses that are possibly genetically determined. WS remains a fascinating population for exploring broader questions in psycholinguistic research not because it might represent a case of or model for the dissociation of “spared” language capacities from other cognitive functions (Bellugi et al., Reference Bellugi, Marks, Bihrle, Sabo, Bishop and Mogford1988), but because it provides a unique opportunity to examine the complex interplay between heightened social motivation, social experience, and their impact on the manifestation and development of linguistic and cognitive abilities.
ACKNOWLEDGMENTS
This research was supported by a grant from the National Institute of Child Health and Human Development (RO1 HD 33470) and by a grant from the General Clinical Research Center program of the National Center for Research Resources, National Institutes of Health (M01-RR00533) to Boston University School of Medicine. We express our sincere gratitude to the National Williams Syndrome Association and the New England regional chapter for their help in recruiting participants and to the families and individuals who participated in this study.