I. INTRODUCTION
Numerous amorphous alloys have been produced in binary, ternary, and multicomponent metal systems since Duwez obtained the first metallic amorphous alloy (namely, metallic glass) in 1959 by liquid melt quenching in Au–Si system.Reference Klement, Willens and Duwez1 Especially, in the late 1980s, Inoue et al.Reference Inoue and Takeuchi2 obtained bulk metallic glasses (BMGs) in ternary systems that consist mainly of common elements and since then, ternary BMGs have been a hot topic both in the materials science and in condensed matter physics. Recently, much interest has been attracted to Zr–Ni–Ti ternary alloys, since excellent performance on hydrogen storage has been reported in thermodynamically stable Ni–Zr–Ti icosahedral-quasicrystalline phases.Reference Kelton and Gibbons3–Reference Konstanchuk, Ivanov, Bokhonov and Boldyrev5 Besides, Ni–Zr–Ti is regarded as the most practical system for high-temperature shape-memory alloys with relative low price of the raw materials.Reference Meisner, Sivokha and Perevalova6–Reference Firstov, Humbeeck and Koval8 Since the atomic size difference between Ni and Ti(or Zr) is large (>17%) and bonding between Ni–Ti or Ni–Zr is very strong in the liquid state forming a deep eutectic in the binary phase diagram,Reference Boer, Boom, Matterns, Miedema and Niessen9 the Ni–Zr–Ti system thus has been selected as a potential amorphous alloy system with high glass-forming ability (GFA) based on well accepted proposed empirical rules.Reference Inoue10
The term of GFA frequently relates to the ease or difficulty with which the metallic glasses are formed and it has been approached generally in two different ways. First, the consideration is given to a specific alloy, treating the glass formation as the consequence of a frustration of crystallization during freezing of the liquid melt.Reference Elliott11 In practice, the critical quenching speed,Reference Ulmann12 maximum size of the attainable metallic glass, reduced glass transition temperature,Reference Davies13 gamma parameter,Reference Lu and Liu14, Reference Lu and Liu15 and so on are frequently used to describe the GFA of an alloy. Second, the consideration is given to a specific metal system. This situation can be depicted as a competition between the crystalline and amorphous phases as a function of the alloy composition. Reference Li, Dai, Cui and Liu16, Reference Liu, Lai and Zhang17 In this situation, the glass-forming range (GFR) is frequently used to indicate an alloy composition range within which the metallic glass or amorphous alloy is energetically favored to form.Reference Li, Dai, Cui and Liu16, Reference Li, Dai, Liang, Tai, Kong and Liu18 To estimate the GFR of a binary metal system, several empirical criteria or rules have been proposed, based on some specific properties or intrinsic characteristics of the system. For example, based on the equilibrium phase diagram of a binary metal system, TurnbullReference Turnbull19 has proposed a well-known deep eutectic criterion to predict the metallic glass formation upon liquid melt quenching. A great variety of metallic glasses have been obtained by ion beam mixing and solid-state amorphization, both in systems known as glass-forming and non-glass-forming systems according to deep eutectic criterion, which clearly shows the inadequacy of deep eutectic criterion. In the early 1980s, EgamiReference Egami and Waseda20 has proposed a criterion to predict the metallic glass formation by considering the atomic size difference of the constituent metals of a binary metal system. Though Egami’s rule could predict a quantitative GFR of a binary metal system, the prediction is not always reliable, probably because the atomic size difference of a metal system could only partially reflect the intrinsic characteristics of the system. In addition, thermodynamic approach by comparing the Gibbs free energy of the competing alloys phases has also been applied to predict the GFR/GFA of a binary metal system. The Gibbs free energy could be calculated by using the Miedema–Alonso’s methodReference Weeber and Bakker21 or alternatively by using the CALPHAD method.Reference Bormann, Gartner and Zoltzer22 Miedema–Alonso’s model still belongs to sort of empirical approach and the model is strictly valid only at low temperature and CALPHAD calculations are still inadequate due to some problems associated with insufficient experimental input, fitting errors, and invalid extrapolation to an under-cooling condition.
The author’s group has recently developed an atomistic scheme that is capable of predicting the favored composition region for metallic glass formation in a binary metal systemReference Li, Dai, Liang, Tai, Kong and Liu18 by using some glass-producing techniques. In reported works, n-body potentials of some binary system are constructed with the aid of ab initio calculations. The constructed and proven realistic n-body potentials are then applied in a series of molecular dynamics (MD) simulations. In MD simulations, solid solution models are used to compare the relative stability of the solid solution versus their competing disordered counterpart, as a function of the solute concentration. Simulation results not only reveal the physical origin of the metallic glass formation but also quantitatively determine, for each system, an alloy composition range, within which metallic glass formation is energetically favored, thus leading to develop the atomistic theory capable of predicting the GFR, or the quantitative GFA, of the binary metal system. This method has been applied successfully to estimate GFRs of many binary systems such as Ni–Nb system, Cu–Ru systems, etc.Reference Li, Dai, Liang, Tai, Kong and Liu18 The same idea and simulations methods have been further extended recently to estimate some ternary metal systems as well, e.g., the Ni–Hf–Ti,Reference Dai, Li and Liu23 Ni–Nb–Ta,Reference Dai, Li, Che and Liu24 and Ni–Zr–AlReference Zhao, Li and Liu25 systems and obtained satisfying results. Generally, the calculated results were in good agreement with the experimental observations.
Atomic chemical interaction and topology constraints are supposed to be of crucial importance in metallic glass formation and stability of supercooled metallic glasses. It has been proven by experimental observationsReference Chen, Hui, He and Bian26 that the long-range order of compounds has disappeared after the crystalline-to-amorphous transition, but the chemical interaction among atoms still exists and leads to the formation of multiple chemical short-range orders (CSROs)Reference Finney and Wallace27 in metallic glasses. Initially proposed CSRO parameter is calculated as 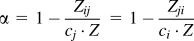 Reference Gazzillo, Pastore and Enzo28 with Z = ci· (Zji + Zjj) + cj· (Zij + Zii) for a binary alloy. Here, ci is the concentration of the component i and Zij is the average numbers of the j atoms around the i atom. However, there are inadequacies of this parameter in describing the CSROs in a metal system. First of all, the parameter is proposed to deal with the binary system and is not able to describe the CSROs involved in the ternary or multicomponent systems. Second, it gives separate data for each type of atoms. That is, it may generate three different parameters to describe the CSROs of a ternary alloy. Recently Li et al.Reference Li, Kong and Liu29 proposed a parameter, namely microchemical inhomogeneity (MCI) parameter to describe the intrinsic atomic configurations, which quantitatively reflect the CSROs by using one generalized parameter for a given binary alloy. MCI parameters of four binary metal systems, i.e., the Ag–Ru, Ag–Co, Ni–Ru, and Ni–Hf systems, have been selected and investigated in the previous study.Reference Li, Kong and Liu29 Governed by atomic configurations of a system, MCI parameter is evaluated from an interatomic potential of the system through MD simulations as the MD simulations can provide some detailed information concerning the atomic configurations by the proper calculation of the total or partial pair correlation functions.
In this study, we first construct the n-body potential of the Ni–Zr–Ti system under the framework of smoothed second moment approximation of the tight binding (Smoothed TB-SMA) theory.Reference Li, Dai, Wang and Liu30 The constructed potential is then applied to predict GFRs in Ni–Zr–Ti ternary system, including three binary GFRs for Ni–Zr, Ni–Ti, and Zr–Ti binary systems using MD simulations. As the interatomic potential of a ternary metal system governs the intrinsic atomic interactions in the system, it could be further applied to examine the atomic configurations in Ni–Zr–Ti system during the crystal-to-amorphous phase transition. Therefore, the coordination numbers (CNs), MCI parameter, and Honeycutt and Anderson (HA) pair analysisReference Honeycutt and Anderson31 have been calculated to investigate the atomic configurations and CSROs for the binary and some ternary alloys in Ni–Zr–Ti system.
II. CALCULATION METHODS
A. Construction of n-body Ni–Zr–Ti potential
To describe the interatomic interactions of Ni–Zr–Ti system, an empirical n-body potential is constructed based on Smoothed TB-SMA scheme proposed recently by Li et al.Reference Li, Dai, Wang and Liu30 It has been proven that the total energy derived from the Smoothed TB-SMA can keep smooth in the entire calculated range and smoothly go to zero at cutoff radius, indicating that this model does overcome the energy jumps at cutoff radius which takes place in Cleri’s TB-SMA potentialReference Cleri and Rosato32 and Cai’s EAM potential.Reference Cai and Ye33 Accordingly, the total potential energy Ei of atom i can be calculated by

with


where ψ and ϕ are called here the pair function and density function, respectively. For the hexagonal close-packed (hcp) Zr and Ti and face-centered cubic (fcc) Ni, they can respectively be written as


where Ei is the total potential energy of atom i and rij is the distance between atoms i and j of the system. r cm1 and rcm2 are the transition points of the pair item and density item, respectively. r c1 and r c2 are the cutoff radii of the pair item and density item, respectively. n 1 and n 2 are two integers determined by experience. Differing from the original TB-SMA, here r 0 is an ordinary potential parameter, often yet not necessarily equating to the nearest neighbor distance. A 1, p 1, p 2, A 2, B 1, q 1, q 2, and B 2 are the other potential parameters to be determined by fitting.
Concerning the interactions between the atoms, there should be six sets of potential parameters in the ternary metal system: three sets for the interactions of pure Ni–Ni, Zr–Zr, and Ti– Ti, and another three sets for the interactions of cross Ni–Zr, Zr–Ti, and Ni–Ti, respectively. Generally, the potential parameters of pure metals were determined by fitting their lattice constants, cohesive energies, and elastic modulus obtained by experiments or ab initio calculations. In the fitting process of the cross potential, compounds with different structures and different compositions were involved to ensure that the constructed potential can describe the interatomic interactions in the whole composition range and in different environments. Since there are not enough experimental data of Ni–Zr–Ti compounds, ab initio calculations, a reliable way to acquire some physical properties of the alloy phases, were applied to get some properties of the compounds.
The ab initio calculations were conducted based on density functional theory,Reference Kohn and Sham34 in the generalized gradient approximation (GGA), with projector augmented wave pseudopotentials, as implemented in the Cambridge Serial Total Energy Package (CASTEP).Reference Segall, Lindan, Probert, Pickard, Hasnip, Clark and Payne35 For the GGA correlation energy, the Perdew–Wang parameterization (GGA-PW91) was used,Reference Perdew and Wang36, Reference Perdew37 together with a kinetic energy cutoff of 350 eV on a 11 × 11 × 11 FFT grids in first Brillouin zone. Geometry optimizing was first performed to determine the lattice constants and total energies of the compounds at equilibrium, and then the elastic constants were calculated; meanwhile, the bulk moduli were obtained. The cohesion energies of compounds can be easily derived from the total energies obtained by the ab initio calculation.
B. Molecular dynamics simulation
As the process of producing the metallic glasses is always far-from-equilibrium process and the related kinetic condition is extremely restricted, complicated structured phases could not nucleate and grow. It follows that the competing phase to metallic glass, or amorphous phase, is the terminal solid solution, which is frequently of simple structure, i.e., fcc, body-centered cubic (bcc), or hcp. Consequently, the scientific issue related to predict the GFR of a binary metal system could be converted into an issue of comparing the relative stability of solid solution versus its amorphous counterpart as a function of solute concentration, thus enabling to determine the two critical solid solubilities, beyond which the solid solutions become unstable and turn into the corresponding amorphous states (AS) (i.e., forming the metallic glass). Theoretically, in a binary metal system, the relative stability of the amorphous phase and the solid solution are both governed by the atomic interaction of the system and could hence be determined through appropriate computations or simulations.
Based on the constructed Ni–Zr–Ti potential, MD simulations are then carried out with Parrinello–Rahman constant pressure scheme,Reference Parrinello and Rahman38 in which the equations of motion were solved using the second-order four-value predictor-corrector algorithm of Gear with a time step t = 1×10⁻¹⁵ s.Reference Allen and Tildesley39 Simulation temperature and pressure were set to be 300 K and 0 Pa, respectively. The type of initial solid solution model is decided by the dominant type of atoms in a certain alloy, i.e., fcc solid solution for Ni-rich alloys and hcp solid solution for Zr/Ti-rich alloys. The solid solution models consist of 2048 and 2156 atoms for the fcc and hcp solid solutions, respectively. For these solid solution models, the [100], [010], and [001] crystalline directions are parallel to the x, y, and z axes, respectively. Meanwhile, periodic boundary conditions are adopted in three axes. In setting the models, the desired solute atoms are added into the model by randomly substituting solvent atoms, and the compositions vary with an interval of 3–5 at.%. In this study, MD simulations are conducted for a considerably long time so as that all the related dynamic variables show no secular variation. To reach a relatively stable (i.e., metastable) state, the longest MD simulation time is 500,000 MD time steps (2.5 ns) for some solid solution models.
C. Characterization methods of local atomic configurations
The structural changes in the simulation models were monitored by the projections of atomic positions and pair correlation function g(r). For a metal system, the total pair correlation functions g(r), the partial pair correlation function g A(r) of atom A, and the partial pair correlation function g AB(r) between atom A and B in the present work are calculated by

and

and

where V is the volume of the calculated cell, N is the total number of atoms, and N A and N B are the number of A and B atoms. A stands for Ni, Zr, or Ti atom. Δr is the distance interval in the calculation. The function δ(t) equals one when −0.5Δr < t < 0.5Δr and equals zero elsewhere. For a crystal, the g(r) exhibits a sequence of peaks, and the position and magnitude of the peaks are signatures of the crystal structure of the system. For a liquid or disordered solid, the function exhibits major peaks close to the average atomic separation for the neighboring atoms, and the magnitude of the peaks decays exponentially, approaching 1, with distance. The pair correlation function is thus commonly recognized as a compelling feature to identify an amorphous structure to determine the structure of the alloys.
In binary or ternary systems, coordination number is determined by integrating the total or partial pair correlation functions out to a distance corresponding to the first minimum in the function. Specifically Z AB, the average coordination number of atoms B around atoms A, can be calculated by

then Z A, Z B, and Z total can be calculated by  ,
 , and
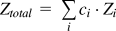 .
The proposed MCI parameterReference Li, Kong and Liu29 is independent of the atomic species and indicates an intrinsic character of a system with different compositions and thus is a parameter capable to reflect the CSROs quantitatively of a binary system and for a general multicomponent system. According to initial definitions, pii = (Zii/Zi) and pij = (Zij/Zi) (j≠i)Reference Li, Kong and Liu29 are the average probabilities of an i atom to have an atom of similar species and to have an atom of dissimilar species as its nearest neighbor, respectively, which can be calculated from CNs for a given composition. In this work, MCI parameter has been further extended to describe the CSROs of Ni–Zr–Ti ternary system with different compositions. The MCI of the component i, ζi, in a given metal system is here defined as:
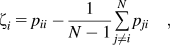
where N is the number of types of atoms, i.e., N = 2 for a binary system and N = 3 for a ternary system. Then the MCI of the system, ζ, can be calculated by  . Previous work revealed that for a system with positive MCI parameters ζ, the system has a tendency for clustering, segregation, or phase separation at those compositions since atoms would prefer to have the atoms of similar species as its neighbors. For a system with negative MCI parameters ζ, atoms prefer to have dissimilar atoms as neighbors and thus have a tendency to form some CSROs or compounds at those compositions. While for a system having no tendency toward phase separation or forming CSROs and featuring random distribution of neighboring atoms, e.g., only forming solid solutions in the whole composition range, its MCI parameter obtained should be always close to zero.
HA pair analysis is a method for analyzing atomic configurations according to the local environment of the bonded pairs, in which two atoms are viewed as forming a bond pair if they are within a given cutoff distance that equals the first minimum in the pair correlation function g(r). Calculation details of the HA method has been explicated in a previously published article.Reference Zhao, Li and Liu40 In this work, the average total fraction of icosahedra-related pairs (i.e., sum of fractions of 1551, 1541, and 1431 pairs) and the average total fraction of fcc/hcp-related pairs (i.e., sum of fractions of 1421 and 1422 pairs) are defined as two indexes to monitor the atomic configurations in those binary/ternary alloys under study.
III. RESULTS AND DISCUSSION
A. Potential parameters and thermodynamics properties of the Ni–Zr–Ti system
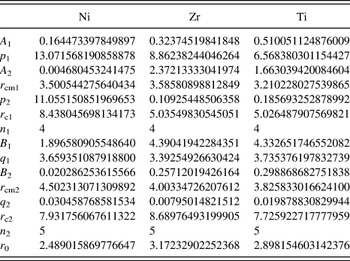
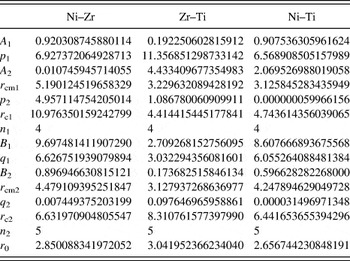
The empirical potential expressed by Eqs. (1)–(5) are first constructed for the Ni, Zr, and Ti metals and the newly fitted parameters are shown in Tables I and II. To evaluate the relevance, some physical properties are reproduced from the constructed potentials.
Smoothed second moment approximation of the tight binding (Smoothed TB-SMA) potential constructed in this study for Ni, Zr, and Ti. A 1 and A 2 are expressed in eV/atom; r m1, r c1, r m2, r c2 and r 0 are expressed in Å; and B 1 and B 2 are expressed in eV2/atom.

Smoothed TB-SMA potential constructed in this study for the Ni–Zr, Ni–Ti, and Zr–Ti. A 1 and A 2 are expressed in eV/atom; r m1, r c1, r m2, r c2 and r 0 are expressed in Å; and B 1 and B 2 are expressed in eV2/atom.

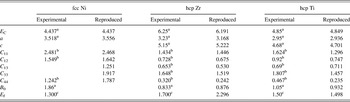
The experimental data and reproduced lattice constants (a), cohesive energies (E C), bulk modulus (B 0), elastic constants (C 11, C 12, C 13, C 33, and C 44), and vacancy formation energies (E f) of fcc Ni, hcp Zr and Ti metals are shown in Table III. It can be seen that the reproduced lattice constants, cohesive energies, and bulk modulus of Ni, Zr, and Ti match well with their experimental values. Besides, the stability orders of stable and metastable structures identified by potential for Ni, Zr, and Ti metals are consistent with the experimental observations. For instance, the potential energy of hcp Zr is −6.191 eV/atom, lower than −6.182 and −6.146 eV/atom, the potential energy of fcc and bcc Zr, indicating that hcp Zr is the most stable among the three structures. Similarly, fcc Ni and hcp Ti are identified as the most stable among the hcp, fcc, and bcc structures.
Properties of fcc Ni, hcp Zr, and hcp Ti used in fitting and the reproduced results: cohesion energies E C, lattice constants a or c, elastic constants C ij, bulk modulus B 0 and vacancy formation energy E f. E C and E f are expressed in eV/atom, a and c in Å, C ij and B 0 in Mbar.

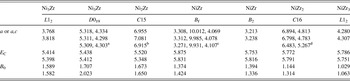
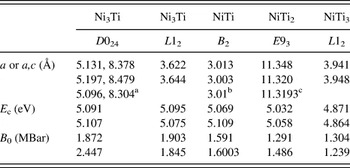
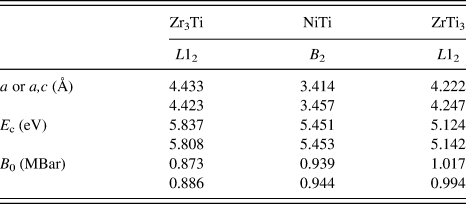
The properties of metallic compounds in the Ni–Zr, Ni–Ti, and Zr–Ti binary systems are then derived by the potential and presented in Tables IV—VI. For comparison, the experimental data and the ab initio calculations are also listed in the tables. In Tables IV—VI, the lattice symmetry of D019 and D024 is hexagonal, that of C16 is tetragonal, that of B f is orthorhombic, the lattice symmetry of C15, E93, L21, and C1b is cubic, and the cubic L12 and B 2 are superstructures of fcc and bcc, respectively.Reference Villars and Calvert50 As for the C1b structure (MgAgAs type), not counting the equivalent permutations it has possible three different atomic distributions distinguished by the type of atoms occupying the Ag position. For the Ni–Zr, Ni–Ti, and Zr–Ti system, several different compositions and structures are chosen, which covers a large composition range and many types of environment. Besides, it can be seen that the maximum error of the cohesive energies and lattice constants is less than 3% compared with the experimental data and the ab initio calculation. It means that the constructed potential is appropriate for describing the atomic interactions in these binary systems and can be reliably applied to the issues related to the structures and energy.
Lattice constants a or a,c, cohesive energies E C, and bulk modulus B 0 of Ni–Zr compounds obtained from ab initio calculation (first lines), reproduced by Smoothed TB-SMA potential (second lines), and experimental data (third lines). E C is expressed in eV/atom, a or a,c in Å, and B 0 in Mbar.

Lattice constants a or a,c, cohesive energies E C, and bulk modulus B 0 of Ni–Ti compounds obtained from ab initio calculation (first lines), experiments (third lines), and reproduced by Smoothed TB-SMA potential (second lines).

aRef. Reference Laves and Wallbaum47, bRef. Reference Purdy and Parr48, cRef. Reference Mueller and Knott49.
Lattice constants a or a,c, cohesive energies E C, and bulk modulus B 0 of Zr–Ti compounds obtained from ab initio calculation (first lines) and reproduced by Smoothed TB-SMA potential (second lines).
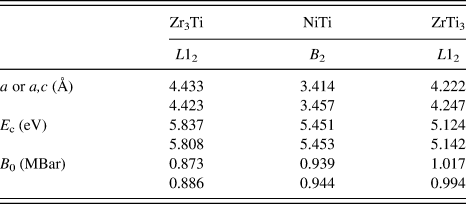
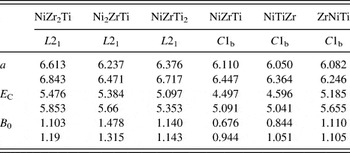
Though there are several ternary phases reported in Ni–Zr–Ti alloy system according to phase diagram, there lack available or reliable data concerning properties of those compounds. We here choose six hypothetic ternary phases, i.e., L21 NiZr2Ti, L21 NiZr2Ti, L21 NiZr2Ti, C1b NiZrTi, C1b NiTiZr, and C1b ZrNiTi with relatively simple structures to further verify the relevance of the constructed potential. The properties of abovementioned ternary compounds are then derived and compared with experimental data and ab initio calculations in Table VII. There are obvious discrepancies of lattice constants and cohesion energies between results reproduced by interatomic potential and those obtained by ab initio calculations, but in general, results are quite consistent with the results of ab initio calculations. The average error is around 5% and maximum error is less than 10%, except for C1b NiZrTi. And for a certain structure, e.g., L21, the relative difference between cohesion energies of three compounds are quite close to ab initio calculation results. Experiences show that the maximum errors of elastic constants determined by ab initio calculation may be as large as 10% or even 30% in some cases. These errors may also bring some uncertainties in the fitting process of the potential of Ni–Zr–Ti system. Since the interatomic potential belongs to an empirical method, discrepancies in lattice constants and cohesion energies of this system cannot be reduced to a considerably low level after improving the quality of potential for a long time. It thus can be concluded that the interatomic potential can be reliably applied to issues related to the structure as well as energy and that there may exist noticeable errors in calculating the properties of compounds with interatomic potentials.
Lattice constants a or a,c, cohesive energies E C, and bulk modulus B 0 of L21 NiZr2Ti, L21 Ni2ZrTi, L21 NiZrTi2, C1b NiZrTi, C1b NiTiZr, and C1b ZrNiTi obtained from ab initio calculations (first lines), reproduced by Smoothed TB-SMA potential (second lines). E C is expressed in eV/atom, a in Å and B 0 in Mbar.

B. Evaluation of the GFRs in Ni–Zr–Ti system
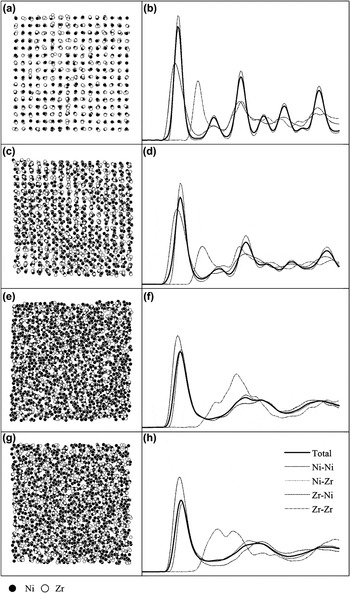
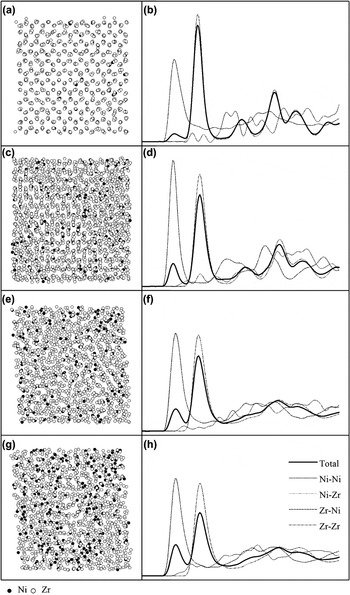
After proving the relevance of interatomic potential of Ni–Zr–Ti system, a serial of MD simulations were first carried out for Ni–Zr, Ni–Ti, and Zr–Ti binary systems, respectively, with various solute concentrations, to determine the GFRs of those binary systems. For Ni–Zr system, Fig. 1 displays the projections of the atomic positions on the x–y plane and the total and partial pair correlation functions g(r)s calculated for the Ni-rich fcc solid solutions consisting of Zr up to 10, 20, 23, and 30 at.%, respectively. From Fig. 1, one sees that the Ni-based solid solutions containing 10 at.% of Zr still remain in the fcc crystalline structures as seen in Figs. 1(a) and 1(b). When the concentration is increased up to 20 at.% Zr, the lattice begins to develop some disordering as shown in Figs. 1(c) and 1(d). Once the concentration exceeds 23 at.% Zr, the crystalline structures collapse completely, as evidenced by Figs. 1(e) and 1(f), in which the shapes of the g(r) curves are commonly observed for the amorphous alloys. For the Zr-rich solid solution, Fig. 2 displays the projections of the atomic positions on the x–y plane and the total and partial pair correlation functions g(r)s calculated for the Zr-rich hcp solid solutions consisting of Ni up to 5, 10, 13, and 20 at.%, respectively. Figure 2 indicates that when the concentration of the Ni atoms is less than 5 at.%, the hcp crystalline structure is preserved perfectly. With the increase in the number of the solute atoms, the new metastable crystalline phase turns into a disordered state little by little. Further increasing the concentration up to about 13 at.% Ni, the lattice collapses completely and turns into an AS, indicating that a crystal-to-amorphous transition takes place. From the above results, one can see that there are two critical solid solubilities: one is 23 at.% of Zr for fcc Ni-based solid solution and the other is 13 at.% of Ni for hcp Zr-based solid solution. Therefore, for the Ni–Zr system, an amorphous alloy would form when its composition falls into the composition range bounded by the two determined critical solid solubilities and the GFR of the system is about 23–87 at.% of Zr with an error of about 3 at.%.Reference Lai, Li, Lin and Liu51 By monitoring the projections of atomic positions and pair correlation function g(r)s of the a certain system, the GFR of the Ni–Ti system can also be identified as about 25–87 at.% of Ti. While for the Zr–Ti system, lattices of alloys remain hcp structures and g(r)s curves can keep the hcp peaks at all compositions, suggesting that the Zr–Ti alloys can remain in the initial hcp crystal structure in whole composition range. In other words, Zr–Ti system is a completely miscible system and metallic glasses could not be obtained in whole composition range. In summary, the GFRs of Ni–Zr, Ni–Ti, and Zr–Ti system are 23–87 at.% Zr, 25–87 at.% Ti, and zero, respectively.
Total and partial pair correlation function for face-centered cubic (fcc) Ni-rich solid solutions with the compositions of (a) 10 at.% Zr, (b) 20 at.% Zr, (c) 23 at.% Zr, and (d) 30 at.% Zr. The solid line is for total g(r), the dashed line is for Ni–Ni g(r), the dotted line is for Ni–Zr g(r), the dash-dotted line is for Zr–Zr g(r), and the dash-dot-dotted line is for Zr–Ni g(r).

Total and partial pair correlation function for hexagonal close-packed (hcp) Zr-rich solid solutions with the compositions of (a) 5 at.% Ni, (b) 10 at.% Ni, (c) 13 at.% Ni, and (d) 20 at.% Ni. The solid line is for total g(r), the dashed line is for Ni–Ni g(r), the dotted line is for Ni–Zr g(r), the dash-dotted line is for Zr–Zr g(r), and the dash-dot-dotted line is for Zr–Ni g(r).

We then compare above simulation results predicted directly from their respective n-body potentials with other theoretical results and the experimental observations. Experimentally, the glass formation by mechanical alloying in the Ni–Zr alloys system is generally possible of 17–73 at.% Zr.Reference Eckert, Schults, Hellstern and Urban52 Amorphous phases with compositions ranging from 9 to 78 at.% Zr were obtained by melt spinning.Reference Buschow and Beekmans53, Reference Buschow54 Accordingly, considering the errors of the GFR determined by experimental characterization and MD simulation, the GFR of Ni–Zr system determined in this study is consistent with the previous predictions based on other methods and supported by the experimental observations. GFR determined in this study for Ni–Ti system, i.e., 25–87 at.% of Ti, agrees well with former experimental observations. Using high-energy ball milling, single amorphous phases were obtained between 28 and 72 at.% Ni in Ni–Ti alloys.Reference Schwarz, Petrich and Saw55 In Ti–Ni alloys splat cooled at rates 107–108 K/s, Polesya and SluipchenkoReference De Tendler, Rodriguez, Gallego and Alonso56 observed an extended solubility of titanium in nickel of 22.3 at.% Ti. Experimentally, Lai et al.Reference Lai and Liu57 obtained amorphous phases in a composition range from 37.6 to 85 at.% Ti with an experimental error of 5 at.% Ti. We then conclude that the estimated GFR of Ni–Ti system is quite compatible with theoretical results and experimental observations. In this work, amorphous structures could not be obtained in Zr–Ti system, and this is consistent with theoretical prediction based on thermodynamic calculations.Reference Gallego, Somoza, Alonso and Lopez58 Zr and Ti are both of the hcp structure. The heat of mixing between Zr and Ti is nearly zero. Meanwhile, the atomic radius difference between Zr and Ti is only 8%.Reference Boer, Boom, Matterns, Miedema and Niessen9 Inspecting the phase diagram of Zr–Ti system,Reference Boer, Boom, Matterns, Miedema and Niessen9 one sees that Zr and Ti are completely miscible in both α(Zr,Ti) and β(Zr,Ti) phases, i.e., they could form Zr–Ti solid solution in whole composition range, exhibiting a good agreement with the results predicted by this study.
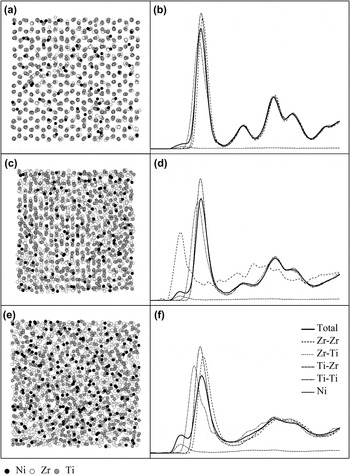
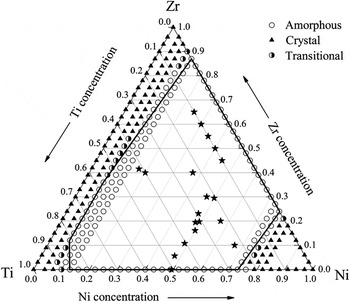
As mentioned earlier, prediction of the GFR of a binary metal system is actually a question of determining the two critical solid solubilities of the system. This idea could be extended to multicomponent metal system. A ternary metal system can be regarded as comprising numerous binary systems; i.e., the ternary Ni–Zr–Ti metal system could be divided into numerous NixZryTi100-x-y binary metal systems. In each binary NixZryTi100-x-y system, x is constant and y is variable. Consequently, we could predict the GFR of a ternary metal system by determining the critical solid solubilities of all of its component binary systems. For the Ni–Zr–Ti ternary system, we first vary x and y with an interval of 3–5 at.% to construct NixZryTi100-x-y solid solution models, and then MD simulations are performed based on the constructed interatomic potential and solid solution models. After equilibrating adequate MD time steps at a given temperature, the structures of NixZryTi100-x-y models generally exhibit three states: a crystal state (CS), a transition state (TS), and an AS. Shown in Fig. 3 are the projections of atomic positions, partial and total g(r)s for the three states. From the figure, one can vividly see that the projections of the atomic positions of CS show a completely ordered state and those of the AS show a completely disordered state. For the TS, the projections exhibit an order–disorder coexisting state. Further inspecting Fig. 3, one sees that g(r) curves of the CS feature apparent crystal peaks, exhibiting a long-range order feature, whereas in the g(r) curves of the AS, the crystal peaks beyond the second peak have disappeared, exhibiting a short-range order and long-range disorder feature. In the g(r) curves of the TS, some crystal peaks have disappeared whereas others still remain, exhibiting an order–disorder coexisting feature. According to the projections of the atomic positions, partial and total g(r)s, all the simulated NixZryTi100-x-y samples are then classified into three structure states and thereby constructed the CS–AS phase diagram shown in Fig. 4. In the figure, the central polygon region bounded by bold black line is the glass-forming region, compositions of which are labeled by open circles. Solid triangles represent compositions of CS and half-filled black circles represent compositions of transitional state.
The typical projections of atomic positions, partial and total pair correlation g(r) for (a, b) crystal state (CS) (Ni04Zr51Ti45), (c, d) transitional state (Ni07Zr51Ti42), and (e, f) amorphous state (AS) (Ni13Zr51Ti36) of the Ni–Zr–Ti ternary system derived from molecular dynamics (MD) simulations.

The CS–AS phase diagram derived from MD simulation at 300 K for the Ni–Zr–Ti ternary system.

From the derived crystal–amorphous phase diagram, one could conveniently predict the metallic glass-forming region in the Ni–Zr–Ti ternary metal system. On the boundaries of this composition triangle, GFRs are consistent with those obtained for Ni–Zr, Ni–Ti, and Zr–Ti binary metal systems. Solid solutions with compositions outside the glass-forming region are stable and those with compositions within the glass-forming region become unstable and turn into disordered states. In other words, when the composition falls into the central polygon glass-forming region, the amorphous phase is energetically favored against its competing solid solution of simple crystalline structure. It follows that the region thus defined could be considered as the GFR of the Ni–Zr–Ti ternary metal system. It is important as well to compare the simulations results of Ni–Zr–Ti ternary metallic glasses with the experimental observations. By melt-spinning technique, amorphous ribbons with compositions of Ni57Zr20Ti23,Reference Lee, Kim and Kim59 NixZr90-xTi10 (x = 25, 30, 35, 40, 45),Reference Liu, Hui, Hou, Liu and Chen60 Ni17Zr41.5Ti41.5,Reference Basu, Louzguine, Inoue and Ranganathan61 Ni37Zr40Ti23, Ni47Zr30Ti23, Ni57Zr20Ti23, and Ni67Zr10Ti23Reference Park, Yi and Kim62 have been obtained. Ni20Zr40Ti40Reference Kocjan, McGuiness, Linaric and Kobe63 amorphous alloys were synthesized by mechanically alloying, which carried out in a high-energy planetary ball mill. Amorphous thin films with compositions of Ni48.2Zr19.5Ti32.3, Ni47.7Zr5.6Ti46.7, Ni49.4Ti50.6,Reference Inoue, Sawada and Namazu64 Ni48.7Zr10.8Ti40.5, Ni49.8Zr16.1Ti34.1B, Ni49.5Zr19.7Ti30.8, Ni47.5Zr23.1Ti29.4, and Ni49.9Zr29.5Ti20.6Reference Kim, Mizutani and Miyazaki65 were fabricated using magnetron sputtering apparatus. Obviously, these experimental amorphous compositions, denoted by pentalpha in Fig. 4, all fall into the determined AS region, indicating that the proposed scheme in this study is relevant for the determination of the GFR of a ternary metal system.
C. Local atomic configurations derived for binary/ternary alloys in Ni–Zr–Ti system
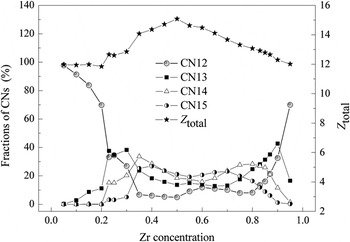
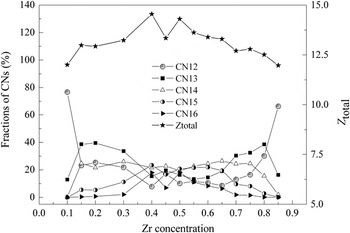
To reveal the local atomic configurations of some binary and ternary systems in Ni–Zr–Ti system, three binary systems, i.e., Ni–Zr, Ni–Ti, and Zr–Ti systems, and a ternary NixZr90-xTi10 system have been investigated. The statistical distributions of CNs and the average total CN Z total for solid solutions and metallic glasses were calculated and results of Ni–Zr and NixZr90-xTi10 systems are shown in Figs. 5 and 6.
Coordination number (CN) distributions and Z total in Ni–Zr binary system derived from MD simulation.

CN distributions and Z total in NixZr90-xTi10 ternary system derived from MD simulation.

From the figures, some common characteristics concerning the atomic configurations have been revealed in these alloys. In all the systems chosen, dominant CNs in solid solutions are CN12, and Z total is around 12 as well. Compared with that of solid solution, the fractions of CN = 12 in amorphous phases decrease significantly to lower than 40%, whereas fractions of large CNs (>12) increase obviously to higher level. For example, for Ni85Zr15, the CNs of solid solution consists of CN9–13, in which CN12 takes up to 83.8% as shown in Fig. 5. Once amorphous phases are formed, the fractions of CN12 drop sharply while CN13–16 play more dominant role in CN distribution within GFR. Take Ni60Zr40 alloy for another example, the CNs of the amorphous phase consist of CN10–16, and fractions of CN12, CN13, CN14, CN15, and CN16 are 6.05%, 18.3%, 28.6%, 26.8%, and 14.3%, respectively. Similar trend can be found in Ni–Ti system as well. Since the fraction of large CNs (>12) increases in metallic glasses, Z total increases to be above 12 within GFR and reach its peaks point at 50 at.% of Zr in Ni–Zr system and 55 at.% of Ti in Ni–Ti system. In contrast, for the Zr–Ti system, we obtained the solid solution in the whole composition range, the dominant coordination number is CN12 (takes up to 99%) and Z total is very close to 12 (±0.015) for the whole composition range. From the constructed CS–AS phase diagram (Fig. 4), GFR of NixZr90-xTi10 system is predicted to be 15–80 at.% Zr. Similar to binary systems in Ni–Zr–Ti system, similar tendency has been obtained for CN distributions and Z total as shown in Fig. 6 where fraction of CN12 can be seen as a clear index to indicate the GFR of this system and once metallic glasses are formed, CN12 drops to below 30% and fractions of large CNs (>12) increase obviously. The existence of large CNs in the metallic glasses is supposed to contribute to the increase to Z total.
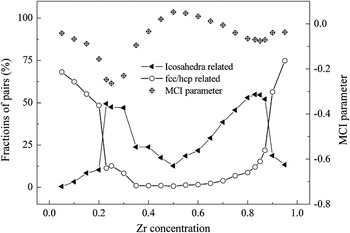
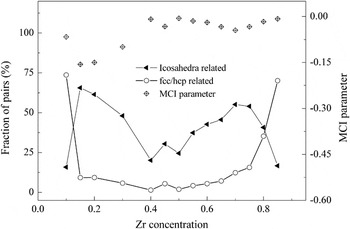
The distribution of CNs in binary and ternary metal systems could have close correlations with topological stability in atomic configurations. For Ni–Zr and Ni–Ti systems, the Goldschmidt atomic radii of Zr/Ti (0.160 nm/0.147 nm) is larger than that of Ni (0.124 nm).Reference Kittel41 Though CNs of Ni, Zr, and Ti in pure metals are the same, i.e., 12 for fcc or hcp structure. Atoms in metallic glasses have higher mobility than in crystalline structures, thus CN = 13–16 tend to form and increase for adjacent atoms to form topologically more stable local configurations, which reduce the energy of the system. To further investigate the local structures of metallic glasses in binary Ni–Zr, Ni–Ti, Zr–Ti, and ternary NixZr90-xTi10 systems, the MCI parameter ζ of each system was calculated from the CNs. The MCI parameter ζ and HA pair analysis results of abovementioned systems were studied over wide composition ranges, and the results of binary Ni–Zr and ternary NixZr90-xTi10 systems are shown in Figs. 7 and 8. In HA pair analysis technique, the sum of fractions of 1551, 1541, and 1431 pairs show the degree of icosahedral/icosahedra defect structures, whereas the sum of fractions of 1421 and 1422 show the degree of close-packed crystalline structure such fcc and hcp. In this work, the sum of fractions of 1551, 1541, and 1431 pairs (named as icosahedra related pairs) and the sum of fractions of 1421 and 1422 pairs (named as fcc/hcp related pairs) are then defined as two indexes to monitor the atomic configuration in binary/ternary metal alloys.
Fractions of icosahedra-related pairs, fcc/hcp-related pairs, and microchemical inhomogeneity (MCI) parameter of Ni–Zr system.

Fractions of icosahedra related pairs, fcc/hcp-related pairs, and MCI parameter of NixZr90-xTi10 ternary system.

As can be seen in Fig. 7, the fcc/hcp related pairs (i.e., 1421 and 1422) dominate in solid solutions in Ni–Zr system and the fractions drop sharply, which shows that fcc/hcp structures are not dominant once metallic glasses are formed. Similar trend can be found in ternary NixZr90-xTi10 system (shown in Fig. 8) as well and fraction of fcc/hcp related pairs changes in a similar trend as CN12 owing to the same structural origins. Within GFRs of binary Ni–Zr, Ni–Ti, Zr–Ti, and ternary Ni10Zr90-xTi10 systems, the fraction of icosahedra related pairs (i.e., 1551, 1541, and 1431) show a clear increase to over 20% and vary with alloy compositions.
As for the MCI parameter ζ, positive or close to zero data obtained with compositions outside GFR and for alloys with negative parameter ζ, there is a general preference for forming unlike pairs and CSROs. Interestingly, there are two clear points in Ni–Zr, Ni–Ti and NixZr90-xTi10 system where MCI parameter ζ reaches a local lowest as shown in Figs. 7 and 8. Take Ni–Zr system for example, the two local lowest points (seen in Fig. 7) for ζ are 23 at.% Zr and 85 at.% Zr. At the same composition point, the fraction of icosahedral pairs reaches a very high level (∼50%), which implies that the icosahedra-related structures existing in Ni–Zr system play important role in forming CSROs. Similar trends can be seen in Ni–Ti and NixZr90-xTi10 systems as well. For Zr–Ti system, the parameter ζ is close to zero (0.0 ± 0.02) and the fractions of fcc/hcp related pairs are over 99% in the whole composition range, which means there form totally random distributions of atoms in Zr–Ti solid solutions. In addition, similar to Zr–Al system,Reference Zhao, Li and Liu40 the most negative points of MCI parameter ζ in binary Ni–Zr and Ni–Ti systems locate very close to the most negative value of formation enthalpy of the system and very close to the composition of the most stable binary compound according to the binary phase diagrams. The most negative points of MCI parameter ζ in Ni–Zr and Ni–Ti systems are 23 at.% Zr and 30 at.% Ti and the most stable compounds in these systems are Ni7Zr2 and Ni3Ti, respectively. Since MCI parameter is a statistical one to investigate the local atomic configurations of a system, there could exist ±0.05 deviation to this parameter of a given composition raised by different calculation methods to generate partial CNs.
The existence of CSROs in binary and ternary metallic glasses can be explained by the fact that there were large negative enthalpies of mixing between Zr and Ni (−49 kJ/mol) and Ni and Ti (−35 kJ/mol)Reference Boer, Boom, Matterns, Miedema and Niessen9 respectively. While for Zr–Ti system, enthalpy of mixing between Zr and Ti is small (0 kJ/mol)Reference Boer, Boom, Matterns, Miedema and Niessen9 and such loose bonding between unlike pairs is responsible for the random configurations in Zr–Ti solid solutions. It is discussed that the existence of CSROs in the metallic glasses may result in a variation of Gibbs free energy of liquid and then affects thermodynamics and kinetics of homogeneous nucleation.Reference Saida, Imafuku, Sato, Sanada, Matsubara and Inoue66 Thus, the existence of CSROs benefits the formation and topological stability of the metallic glasses in general.
IV. CONCLUSION AND REMARKS
Taking the construction of an n-body potential of Ni–Zr–Ti ternary metal system as the very base, authors intend to develop an atomistic scheme through appropriate computations and simulations, which is quantitatively capable of predicting alloy composition ranges within which metallic glass formation is energetically favored in the system. Main results are concluded as follows:
(1) The interatomic potential of Ni–Zr–Ti system has been constructed under the framework of Smoothed TB-SMA theory. The potentials are verified to be relevant and appropriate for describing the atomic interactions in these binary systems and can be reliably applied to the issues related to the structures and energy.
(2) The constructed potential is applied to predict GFRs in Ni–Zr–Ti system, including three binary GFRs for Ni–Zr, Ni–Ti, and Zr–Ti systems using MD simulations. In summary, the GFRs of Ni–Zr, Ni–Ti, and Zr–Ti system are 23–87 at.% Zr, 25–87 at.% Ti, and zero, respectively. The estimated GFRs of these three binary systems are quite compatible with theoretical results and experimental observations. A CS–AS phase diagram derived from MD simulation is constructed to demonstrate the GFR of Ni–Zr–Ti ternary system. The GFR is very consistent with experimental observations of the system, indicating that the proposed scheme in this study is relevant for the determination of the GFR of a ternary metal system.
(3) The CNs, MCI parameter, and HA pair analysis are calculated to investigate the local atomic configurations in Ni–Zr–Ti system during crystal-to-amorphous phase transition. Fraction of CN12 can be seen as a clear index to indicate the GFR of a given system and compared with solid solution alloys, large CNs (>12) increase significantly in amorphous phases and play more dominant role than CN12. The existence of large CNs in the alloys contributes to the obvious increase to average total coordination number Z total. The most negative points of MCI parameter ζ in binary Ni–Zr and Ni–Ti systems locate very close to the most negative value of formation enthalpy of the system and very close to the composition of the most stable binary compound according to the phase diagrams. Besides, icosahedra-related structures existing in Ni–Zr, Ni–Ti and NixZr90-xTi10 systems play important role in forming CSROs, which benefit the formation and topological stability of the metallic glasses.
ACKNOWLEDGMENTS
The authors are grateful for the financial support from the National Natural Science Foundation of China (50871058, 50971072), the Ministry of Science and Technology of China (2011CB606301), the Ministry of Education of China (200800030054), and the Administration of Tsinghua University.