I. INTRODUCTION
To increase the capacities of IC chips, a heteroepitaxial thin film is often deposited to a dissimilar substrate. However, the disparity of the material properties can bring about substantial residual stresses in such a thin film system. When the residual stresses are sufficiently large, the electronic properties of an IC can be considerably affected.Reference Hynecek1
Lattice and thermal mismatches between the dissimilar material layers are the two origins of residual stress generation in heteroepitaxial thin film systems. Previously, theoretical predictions of residual stresses were based on the disparate lattice parameters and coefficients of thermal expansion (CTEs), using the theory of elasticity. Such predictions, however, are valid for certain range of film thicknesses when the lattice misfit can be entirely accommodated by elastic strain. Beyond a critical thickness,Reference Frank and Van-der-Merwe2, Reference People and Bean3 the residual stresses are partially relieved by the formation of crystalline defects such as twinsReference Zhang, Liu and Zhang4, Reference Liu, Zhang and Zhang5 and dislocations.Reference Matthews and Blakeslee6, Reference Maree, Barbour, Vanderveen, Kavanagh, Bullelieuwma and Viegers7 The calculation of the stress relief is however not as simple as the previously thought because the interface defects are discrete and not uniform, and their interactions are complex. That is why quantitative relationships between residual stresses and experimentally measured lattice defects have never been established.
A heteroepitaxial silicon-on-sapphire (SOS) thin film system has a high lattice mismatch strain of up to 5.9% in Si [100] and 14.1% in Si [010] directions. The residual stresses measured by the x-ray diffraction methodReference Liu, Zhang, Brawley, Atanackovic and Duvall8 are much smaller than the theoretical predictions when both lattice and CTE mismatches are considered. This indicates a significant stress relief due to lattice defects. Some early studies using transmission electron microscopy (TEM) showed that there is a high density of lattice defects,Reference Hamarthibault and Trilhe9–Reference Phillips, Batstone, Pfeiffer, Fan, Phillips and Tsaur15 of which microtwins are predominant.Reference Hamarthibault and Trilhe9, Reference Batstone10 This partly mitigates the compressive residual stresses in the Si film due to the local tension in the Si  $(1\bar 13)$ twining plane.Reference Lihl, Oppolzer, Pongratz, Skalicky and Svanda11 However, Twigg et al.Reference Twigg, Richmond and Pellegrino12 argued that twinning is insignificant in stress relief because it only contributes less than 0.7% of the total stress released, whereas dislocations are more influential. AbrahamReference Abrahams, Buiocchi, Corboy and Cullen13 observed dislocation arrays in a plane-view as-deposited SOS sample, and concluded that they are edge dislocations parallel to [011] and
 $[01\bar 1]$ directions with the spacing of 36.9 ± 6.0 Å. AnidowReference Aindow, Batstone, Pfeiffer, Phillips and Pond14 analyzed the interface in the cross-sectional view of a rapidly thermally annealed (RTA) sample. Through the weak beam imaging of the interface inclined to the beam direction, he observed misfit dislocations with the line direction of 15° away from [110] toward [010], and ascribed this to the effect of anisotropy of misfit. Phillips et al.Reference Phillips, Batstone, Pfeiffer, Fan, Phillips and Tsaur15 examined specimens of as-deposited and RTA SOS exactly on the sapphire zone axis
 $[20\bar 21]$. They observed occasional terminations of silicon {111} fringes at the interface of an as-deposited sample, but a nearly periodic array of the terminations in the RTA sample. The terminations were interpreted as dislocations. However, all of these investigations of dislocations did not lead to a quantitative calculation of residual stresses.
In their recent study,Reference Liu, Ruan, Zhang and Haddad16 the authors noticed that the magnitudes of residual stresses in a thinner film (e.g., 280 nm) are much larger than those in a thicker film (e.g., 5 μm), although the two film systems were fabricated under exactly the same processing conditions. Such effect of film thickness cannot be explained by any analytical model available, or by the finite element (FE) simulations based merely on CTE and lattice mismatches.
This article aims to obtain a deeper understanding of the following: (i) How do lattice and thermal mismatches influence the residual stresses? (ii) How do residual stresses vary with the film thickness? (iii) How can a macroscopic FE method be used to accurately predict the residual stresses in a thin film system?
II. EXPERIMENTAL METHODS
A. Sample preparation
The samples upon investigation were (001) silicon films of thickness 5 μm, deposited on a 600-μm thick  $(10\bar 12)$ sapphire substrate by conventional chemical vapor deposition (CVD). The in-plane alignments are Si [100] ‖ Al2O3 [
 $\bar 1101$] and Si [010] ‖ Al2O3
 $[11\bar 20]$. For studying the microstructures, the cross-sectional transmission electron microscopy (TEM) specimen along silicon [110] was prepared by using the Nova 200 Nanolab (FEI, Hillsboro, OR) Focused Ion Beam (FIB) system. In the FIB process, the silicon film was protected by platinum (Pt) deposition on the surface and then milled by gallium (Ga) ion beam at 30 kV and 0.63 nA. The AutoTEM software was used to reduce the thickness to less than 100 nm for a better lattice view. The TEM specimen was tilted around silicon <110> zone axis by a double tilt holder in a Philips CM-200 TEM (Philips, Hillsboro, OR) to obtain the bright-field images and the high-resolution lattice images with a 200 kV electron beam.
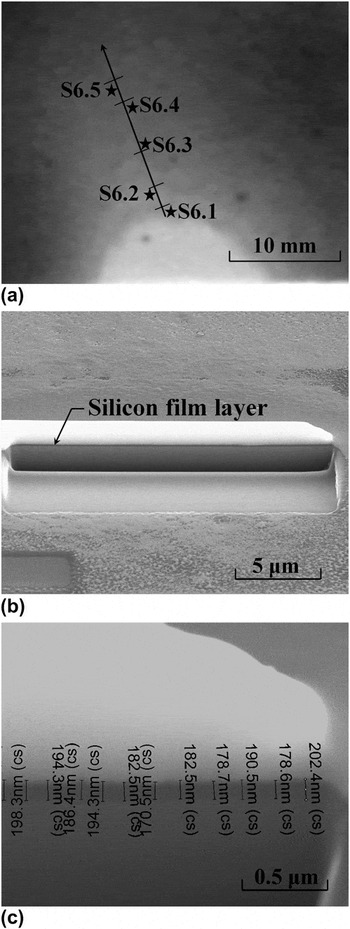
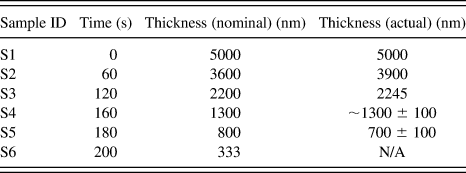
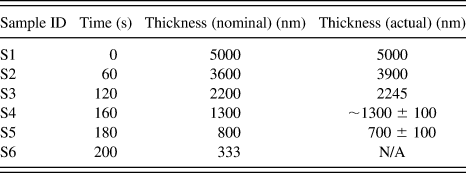
For revealing the stress variations with film thickness, the silicon film was etched to different thicknesses in 80 °C 1:2 potassium hydroxide (KOH) etchant with the nominal etching rate of 14 kÅ/min.Reference Williams, Gupta and Wasilik17Table I lists the nominal film thicknesses according to the etching time and the actual film thickness (>700 nm) measured by a reflectometer (Mikropack NanoCalc 2000 UV-Vis-NIR, Mikropack GmbH, Ostfildern, Germany). The film thickness was uniform after a short-duration etching, but became increasingly nonuniform as the etching time increased. After a 200-s etching, the surface undulated considerably, making the reflectometer ineffective. For obtaining an accurate value of thickness, a significantly etched film was measured from the cross-section of a sample, which was obtained by milling a pocket in the material, using FIB. Figure 1(a) shows the surface of a silicon film after a 200-s etching. By milling a pocket as shown in Fig. 1(b), the silicon film was clearly discerned and the thickness could be accurately measured as shown in Fig. 1(c). It was found that the film thickness varied from 60 to 450 nm along the line from Point S6.1 to S6.5. As TEM cannot be integrated with the residual stress measurement, Raman Spectroscopy was adopted to investigate the thickness-dependent residual stresses in this article.
An etched thin film: (a) areas on etched SOS (S6) for FIB and Raman experiments, (b) image after cross-section ion milling (around Point S6.3), (c) FIB film thickness measurement result.

Theoretical and measured film thickness after chemical etch.
B. Raman spectroscopy for measurement of film thickness and residual stresses
Raman spectroscopy was conducted with a Renishaw Invia spectrometer (RENISHAW plc., Gloucestershire, UK) in the backscattering configuration. A standard setup of 514 nm argon ion laser and 1800 l/mm grating was utilized to detect the silicon band at around 520.5 cm−1 and the sapphire band at 417 cm−1. The incident light was focused on the (001) surface of the silicon film using a 20x microscopic object and the scattered light was collected by the same object. The spot size of the incident beam is about 2 μm and the penetration depth in Silicon is about 0.77 μm.Reference DeWolf18 The spectral resolution is about 1.7 cm−1. For determining the peak position, we proceeded to fit the Raman spectrum with Gaussians and search for the minima of the second derivative of the fitted function.
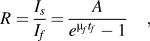
The Raman spectra were used to analyze both the residual stresses and film thickness. For stress measurement, the shift of Raman Δω (cm−1) band was used. As the residual stress in the epitaxial silicon film has been confirmed by the x-ray diffraction (XRD)Reference Liu, Zhang, Brawley, Atanackovic and Duvall8 to be equibiaxial, the change of Si–Si bond length, which is reflected by the shift of Raman peak, can be uniquely related to the in-plane normal stresses by using σ = −249Δω (MPa).Reference Englert, Abstreiter and Pontcharra19 The residual stress calculated by this equation is consistent with the XRD stress measurement.Reference Liu, Zhang, Brawley, Atanackovic and Duvall8 It should be noted that even though the lattice misfit strains in the orthogonal lattice directions are very different, they must have been well accommodated by the interface defects. This is the reason why our XRD measurement indicated that even for a 280-nm thin silicon film the stress state is still equibiaxial,Reference Liu, Zhang, Brawley, Atanackovic and Duvall8 and also the reason why the effects of lattice misfit strains in both directions can vanish when the silicon film is thicker than 1 μm (see Sec. III.A. as followed). On the other hand, the 3D FE simulation of the effects of misfit strains induced by the anisotropic CTEsReference Moridi, Ruan, Zhang, Liu and Haddad20 shows the normal residual stresses along the two orthogonal in-plane directions differ less than 7% and are much larger than other stress components. Therefore, the equibiaxial stress state can be regarded as a reasonable assumption for the silicon films of different thicknesses. For thickness measurement, the intensity ratio R of the sapphire to silicon bands was used. This method is applicable, when the film is thinner than 800 nm and the sapphire band appears in the spectrum. The relation between R and film thickness tf can be rationalized by a stochastic model of Raman scattering (see derivation details in the Appendix A), which gives rise to
 $$R = {{I_s } \over {I_f }} = {A \over {e^{{\rm{\mu }}_f t_f } - 1}}\quad,$$
where Is and If are the peak intensities for the substrate and film respectively, tf is the film thickness, A and μ f are coefficients.
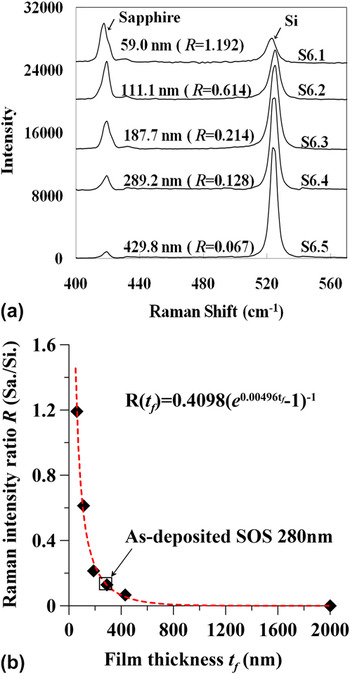
Figure 2(a) shows the Raman spectra pertaining to the films with known thickness. A thicker film leads to a higher silicon peak and smaller R. Figure 2(b) shows the intensity ratio R versus the film thickness tf in comparison with the predictions by Eq. (1). The excellent fitting indicates that Eq. (1) can indeed be used to determine the thickness of the silicon film. For example, for a pristine silicon film of thickness 280 nm, Eq. (1) predicts a film thickness of 280.5 nm as the intensity ratio was 0.1359. However, the method has a limited applicability. According to the fitting parameters shown in Fig. 2(b), a silicon film of 800 nm can absorb 98% of the incident laser photons, which is consistent with the penetration depth (770 nm) of 514 nm laser in silicon.Reference DeWolf18 Therefore, the film thickness to be determined by this method must be smaller than 800 nm.
Raman spectra and film thickness determination: (a) the Raman spectra of different areas of the sample S6; (b) sapphire/silicon intensity ratio versus film thickness.

III. EXPERIMENTAL RESULTS
A. Thickness-dependent stress
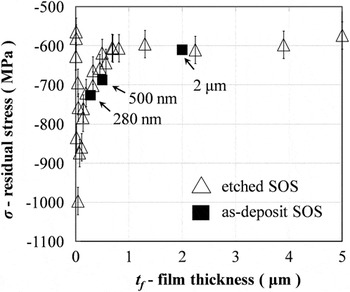
Two to three Raman spectra were taken from Samples S1 to S5 (tf >1 μm) with a relatively uniform thickness as shown in Table I. For Sample S6, the film thickness and residual stress were simultaneously measured from the Raman spectra. Plotting all the stress versus film thickness in Fig. 3, it is obvious that the residual stress increases with the reduction of the film thickness. The compressive residual stress in the silicon film is more or less uniform at 600 MPa when the film thickness is larger than 700 nm. This stress is equal to the thermal stress when the CTE mismatch is considered as the only mechanism of residual stress.Reference Moridi, Ruan, Zhang, Liu and Haddad20 Below 700 nm, the stress increases continuously as thickness reduces and becomes larger than 800 MPa at around 100 nm. This observation shows that the lattice mismatch and the interface defects can affect the residual stresses within the depth of 700 nm. Owing to the pronounced artifacts from the etching process, the measurement results scatter significantly when the thickness is below 50 nm. Therefore, only the measurements at the thickness larger than 50 nm are considered reliable.
Variations of residual stresses with film thickness on both etched SOS (0–5 μm) and as-deposited SOS (280 nm, 500 nm, and 2 μm).

It should be noted that the thickness reduction via chemical etching is to generate thinner films of different thicknesses such that a clear figure can be established. The issue that needs to be clarified is whether the chemically etched thin film has the same residual stresses as those of the as-deposited film. Therefore, we conducted more tests on the as-deposited thin films and shown the result in Fig. 3. It is noted that the residual stresses in the as-deposited film and those in the etched film of the same thickness are very close to each other. This thus justifies that the employment of chemical etching to obtain silicon film of different thickness is rational.
B. Atomic structure at interface
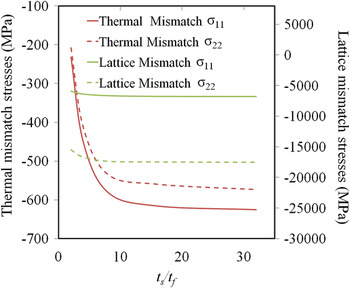
The residual stress becomes larger than the thermal stress as the thickness reduces. However, this cannot be explained by merely the lattice mismatch. This is because (i) the lattice misfit strains are significant (5.9% at Si [100] direction and 14.1% at Si [010] direction) which should lead to a stress of the order of 10 GPa, and (ii) the lattice mismatch, similar to the CTE mismatch, cannot lead to the thickness-dependence. This independence can be strictly proven for an isotropic material (see details in Appendix B). For the anisotropic SOS system under investigation, FE simulation results shown in Fig. 4 indicate that the effects of lattice and thermal mismatches are thickness-independent when the thickness of the substrate is 30 times thicker than the film. For the SOS system examined, ts/tf ≥ 120. It is then apparent that the interface defects, which have been found in many preceding works, must operate to accommodate the lattice mismatch and to remove its effect on residual stress at a large thickness. For ascertaining clarity of the mechanism, it is necessary to use the cross-sectional TEM to uncover the details of the interface defects.
Residual stresses versus thickness ratio ts/tf for thermal and lattice mismatch. Directions 1 and 2 pertain to silicon [100] and [010], respectively.

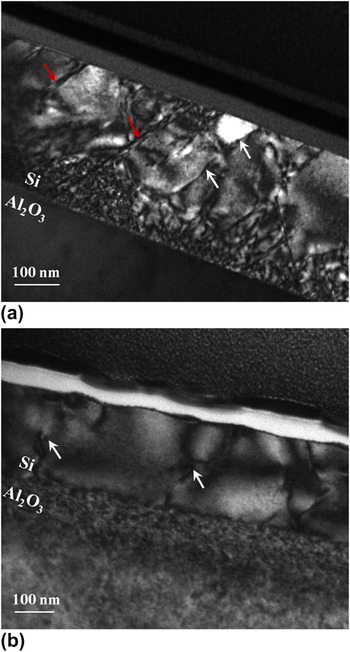
Figure 5(a) shows the bright-field image of the as-deposited 280-nm Si film. The diffraction from Si {111} with zone axis Si <110> was highlighted to have a better contrast of lattice defects. The microtwins, which are the typical planar defect in SOS material, are indicated by the red arrow. Twinning forms during film growth to accommodate the translational or rotational misalignments.Reference Stowell and Matthews21 However, it does not contribute much to the release of the misfit stress in SOS.Reference Twigg, Richmond and Pellegrino12 These planar defects can be effectively removed through ion implantation and high-temperature annealing,Reference McKenzie, Domyo, Ho and Munroe22 because the high crystal regrowth rate during annealing inhibits twinning or the formation of other planar defects.Reference Amano and Carey23Figure 5(b) shows the cross-sectional view of a specimen after ion implantation (200 keV and 5 × 10¹⁵ ions/cm2) and annealing at 1000 °C. There is no twinning or other planar defect but only dislocations (indicated by white arrows). The compressive stress measured from this implanted and annealed sample is 660 MPa, which is close to the thermal stress (700 MPa) calculated (cooling from 1000 °C), indicating that the lattice mismatch can be fully accommodated by misfit dislocations without twinning.
A bright-field TEM image of (a) as-deposited SOS (280 nm) and (b) implanted and 1000 °C annealed SOS (280 nm), viewed through Si {111} reflections around <110> zone axis. White arrows are dislocations and red arrows indicate planar faults.

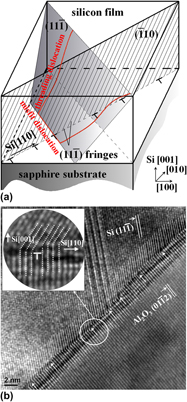
In Fig. 5(a), the threading dislocations were also noted and have been indicated by white arrows. They are structural imprints of crystal growth during depositionReference Morin, Forticaux, Bierman and Jin24 and also the residue of formation of interfacial misfit dislocations. The dislocations nucleate from surface and glide in the slip plane. This is the dominant mechanism for the dislocated atomic structure in the silicon thin film,Reference Maree, Barbour, Vanderveen, Kavanagh, Bullelieuwma and Viegers7, Reference Freund25 because the homogeneous nucleation of dislocations inside the crystal requires twice the energy as that from surface.Reference Hull and Bacon26Figure 6(a) illustrates such a dislocation mechanism schematically. As the silicon film grows, a dislocation in the form of half-loops nucleates from the surface, glides toward the interface and results in two threading dislocations gliding in the {111} plane and a misfit dislocation segment lying in the interface along the <110> direction. Such a misfit dislocation segment can be observed in the high-resolution TEM images.
(a) A schematic of the misfit and threading dislocations in silicon film and (b) a bright-field HRTEM image showing misfit of SOS interface. The TEM image was taken slightly off silicon <110> zone axis, with apparent  $(11\bar 1)$ and sapphire
 $(01\bar 12)$ plane fringes visible. The inset in (b) is an enlarged view for a single misfit dislocation.

The high-resolution bright-field images were taken when the specimen tilted slightly off the Si <110> zone axis, such that both silicon  $(11\bar 1)$ and sapphire
 $(01\bar 12)$ plane fringes were discernible as shown in Fig. 6(b). We then found extra sapphire planes, as indicated by the arrows. These edge-type dislocations, with a Burger’s vector of full lattice spacing, may also be the accumulated result of several partial dislocations near a twin. They induce local compression in substrate and tension in silicon film, and lead to the mitigation of the lattice misfit stress. A number of high-resolution images taken at different areas of the sample showed that the dislocated interface structures were similar. The average spacing between the adjacent dislocations was found to be 10.3 ± 0.5 sapphire
 $(01\bar 12)$ fringes, which is only slightly larger than the calculated average spacing of 10.1 fringes (see Sec. IV) from the difference of the two lattices. The residual stress is very sensitive to the average spacing, which will be discussed in Sec. IV. The individual spacing varies from 7 to 17 fringes in our TEM images. As has been verified by the authors,Reference Moridi, Ruan, Zhang and Liu27 this variation has a negligible effect on the resultant residual stress when the film thickness is larger than 60 nm.
IV. FE MODELING
To obtain a relatively complete picture about the effect of interface defects on the variation of residual stresses in the thin film systems discussed above, it is essential to establish a numerical model to integrate the microstructural defects with the macroscopic stress analysis. To this end, let us consider an array of misfit dislocations with the average spacing ns sapphire  $(01\bar 12)$ planes. The average strain due to these dislocations is
 ${{\bar \varepsilon }}_d = {1 \mathord{\left/ {\vphantom {1 {n_s }}} \right. \kern-\nulldelimiterspace} {n_s }}$. These dislocations accommodate the lattice mismatch and leads to the vanishing effect of lattice mismatch when the thickness is large. The full accommodation of lattice mismatch indicates
 ${\rm{\bar \varepsilon }}_d = (a_f - a_s )/a_s $, where af and as are lattice constants for film and substrate respectively. As the interface structure forms at the deposition temperature, we use the lattice constants at the corresponding temperature (af = 3.854 Å and as = 3.507 Å). The calculated dislocation spacing is ns = 10.1, which is close to the experimentally measured value of 10.3 ± 0.5. However, if only the average strain
 ${\rm{\bar \varepsilon }}_d $ induced by dislocations is considered, there will not be any thickness-dependence. For modeling these dislocations for a film that is only a few hundred nanometers thick, the discreteness of dislocation must not be overlooked.
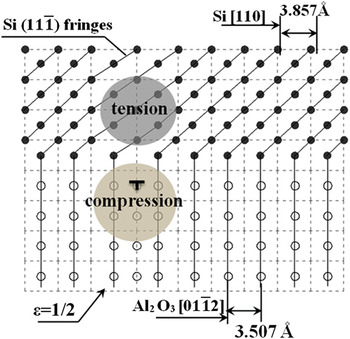
Continuum mechanics is generally used to resolve the stress field around a single dislocation.Reference Gutkin and Romanov28 Accordingly, the FE method can be used. The FE solution of the stress field around an edge dislocation has been verified by the analytical solution.Reference Moridi, Ruan, Zhang and Liu27 For the present problem, it is required to establish a plane-strain FE model of an array of dislocations at the interface for investigating the stresses in the Si thin film. The lattice mismatch in the model can be considered as a compressive strain predefined in the thin film and the misfit dislocations are discrete local expansion in the substrate.
The details of the FE model are shown in Fig. 7. The element size near the interface was taken to be the same as the substrate lattice constant, such that the dislocations can be modeled. The room-temperature lattice mismatch strain is 10.41% =  $(a_f - a_s )/a_s $, where the room-temperature lattice constants af = 3.84 Å at Si (110), and as = 3.478 Å at sapphire
 $(01\bar 12)$. The effect of the edge dislocations was modeled by the prestrain corresponding to the introduction of an extra plane of atoms in the substrate as shown in Fig. 7. The edge dislocations have the Burger’s vectors along sapphire
 $[01\bar 12]$. Although Si (
 $11\bar 1$) planes in Fig. 6(b) are fringes observed in the TEM images, the refined mesh around a dislocation is aligned with the directions of Si [110] and [001] for simplicity, as indicated by the dashed gray line in Fig. 7. The local strain corresponding to an edge dislocation is
 ${\rm{\varepsilon }} = b/2a_s = 1/2$, where b is the Burger’s vector equal to the spacing of sapphire
 $(01\bar 12)$ plane and in the direction parallel to the interface. The introduction of dislocations will cause local compression in the substrate and tension in the film. This is the mechanism that renders the observed thickness-dependence of residual stresses.
A schematic of lattice structure and misfit dislocation at interface: • silicon atoms, ο sapphire atoms, the dashed lines indicate the mesh in a 2D FE model.

For comparing with the experimental results, the thermal mismatch was also investigated by a 3D FE model with anisotropic elastic and thermal properties of silicon and sapphire.Reference Moridi, Ruan, Zhang, Liu and Haddad20 The model was cooled down from 900 to 25 °C by convection from all surfaces. The in-plane compressive stresses in the thin film obtained from this model were 659, 609, and 633 MPa in Si [100], [010], and [110] directions, respectively. Due to the linear elasticity assumed in the analysis, the stresses calculated from thermal mismatch and dislocated lattice structure can be superposed for comparing with the experimental measurements.
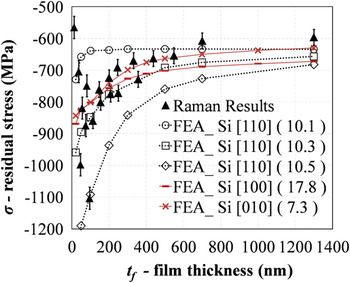
Figure 8 compares the total residual stresses from the FE analysis with those from the Raman experiments. The depth-dependent stresses  ${\rm{\sigma }}(z)$ obtained from the FE simulations were averaged using
 ${\rm{\bar \sigma }}(z) = {{\left( {\int_0^{t_f } {{\rm{\sigma }}(z)e^{ - {\rm{\mu }}_f z} {\rm{\mu }}_f dz} } \right)} \mathord{\left/ {\vphantom {{\left( {\int_0^{t_f } {{\rm{\sigma }}(z)e^{ - {\rm{\mu }}_f z} {\rm{\mu }}_f dz} } \right)} {(1 - e^{ - {\rm{\mu }}_f t_f } )}}} \right. \kern-\nulldelimiterspace} {(1 - e^{ - {\rm{\mu }}_f t_f } )}}$ to account for the effect of attenuation of the Raman signal. When the film thickness is beyond 1300 nm, the stress levels off at around 600 MPa as seen from both the experimental and numerical results. Therefore, Fig. 8 shows only the results between 50 and 1300 nm to emphasize the effect of the misfit dislocations. Three stress versus thickness curves were obtained from the FE simulations, corresponding to the dislocation spacing of 10.1, 10.3, and 10.5 sapphire
 $\left( {01\bar 12} \right)$ fringes. As shown in the figure, the denser dislocations (10.1 spacing) lead to the smaller compressive stress and also smaller affecting depth. The simulation result based on 10.3 spacing is the closest one to the experimental result, which is identical to the average dislocation spacing measured in the high-resolution TEM images in Fig. 6(b). Figure 8 also shows the calculated in-plane normal stresses σ[100] and σ[010] in Si [100] and Si [010] directions from similar FE simulations.Reference Moridi, Ruan, Zhang and Liu27 The dislocation spacing was found to be 17.8 and 7.25 respectively in [100] and [010] directions, which is consistent with the theoretical value calculated based on the lattice difference at the deposition temperature.Reference Moridi, Ruan, Zhang and Liu27 The stress versus thickness curves calculated from three different crystallographic planes agree with the experimental results very well, indicating that the interface misfit dislocation is indeed the mechanism of the thickness-dependence of residual stress.
Comparison of thickness-dependent stress between Raman experiment and FE simulation (50–1300 nm).

The excellent consistency between the FE analysis and experiment confirms that the FE model captures the main mechanism and can accurately predict residual stresses. It also validates the assertion that the discrete interface dislocations are predominant for the thickness-dependence of residuals stress in SOS systems. Although interface dislocations accommodate the lattice mismatch and leads to the vanishing effect on stress when the film thickness becomes sufficiently large, they cannot remove the effect of lattice mismatch at a small thickness due to the discreteness, leading to the observed thickness-dependence.
V. CONCLUSION
Residual stresses in a thin-film system are caused by thermal-lattice mismatches and interface defects. Experimentally, this article has exploited a simple but accurate technique based on Raman spectroscopy to investigate the thickness-dependent residual stresses. HRTEM has been used to reveal the interface misfit dislocations and their spacing. A FE analysis incorporating the effect of edge dislocations at the interface has been successfully carried out. The main findings are summarized below:
(i) When the film is thick, the residual stress is equal to the stress caused by the thermal mismatch. The residual stress increases with decreasing the film thickness.
(ii) An analysis based on merely the average effect of thermal and lattice mismatches cannot uncover the thickness-dependence of the residual stresses in the thin film system. The key factor to consider is the discrete distribution of dislocations at the film-substrate interface. If the thickness of a film is large, the effect of dislocations and the lattice mismatch can be averaged out, which then leaves only the thermal stress to play. With a small film thickness, however, the interface defect will set in and the effects of lattice mismatch and film thickness will appear.
(iii) A FE analysis can provide an accurate prediction of the residual stresses if interface dislocations can be properly incorporated. To identify the correct density of the dislocations is important for the prediction accuracy.
(iv) The misfit dislocation is the predominant mechanism in mitigating the lattice misfit stress and inducing the thickness-dependence.
ACKNOWLEDGMENT
This work was supported financially by the Australian Research Council.
APPENDIX A
Denoted by μfdz the probability that the photon is absorbed by the film material between depth z and z + dz, where μf is the unit volume absorptivity of the film. It is straight to find that the probability that the photon is not absorbed from the surface to depth z is  $e^{ - {\rm{\mu }}_f z} $. Therefore, the combined probability for the photon absorbed by the material at the depth between z and z + dz is
 $e^{ - {\rm{\mu }}_f z} {\rm{\mu }}_f dz$. Assuming that the absorption of the incident photon scatters a Raman photon of the wave length of interest for the study with a constant probability Kf, we can have the following relationship between the measured Raman peak intensity and the film thickness:
 $$I_f = K_f I_0 \int_0^{t_f } {e^{ - {\rm{\mu }}_f z} {\rm{\mu }}_f dz} = K_f I_0 (1 - e^{ - {\rm{\mu }}_f t_f } )\quad,$$
where I 0 is the intensity of the incident beam and tf is the thickness of the film. With the same rationale, we can have the relationship between the Raman peak intensity and the substrate thickness as follows:
 $$I_s = K_s I_0 e^{ - {\rm{\mu }}_f t_f } \int_0^{t_s } {e^{ - {\rm{\mu }}_s z} {\rm{\mu }}_s dz}\quad ,$$
where  $e^{ - {\rm{\mu }}_f t_f } $ is the fraction of the incident photons that can penetrate through the thin film. As the thickness of the substrate is generally very large, it is safe to take
 $t_s \to \infty $. This gives rise to:
 $$I_s = K_s I_0 e^{ - {\rm{\mu }}_f t_f }\quad .$$
Therefore the intensity ratio R between the substrate and the film is:
 $$R = {{I_s } \over {I_f }} = {{K_s e^{ - {\rm{\mu }}_f t_f } } \over {K_f (1 - e^{ - {\rm{\mu }}_f t_f } )}} = {A \over {e^{{\rm{\mu }}_f t_f } - 1}}\quad,$$
where  $A = {{K_s } \mathord{\left/ {\vphantom {{K_s } {K_f }}} \right. \kern-\nulldelimiterspace} {K_f }}$is a constant to be determined by experiment.
APPENDIX B
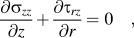
For an isotropic material, the depth independence can be easily derived from the theory of elasticity. As the film is much thinner than the substrate, it can be assumed that the out-of-plane stress vanishes, i.e., σzz = 0, and that only the in-plane displacements are significant. For the isotropic case, only the radial displacement ur needs to be considered. The equilibrium along thickness direction:
 $${{\partial {\rm{\sigma }}_{zz} } \over {\partial z}} + {{\partial {\rm{\tau }}_{rz} } \over {\partial r}} = 0\quad,$$
leads to:
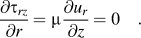 $${{\partial {\rm{\tau }}_{rz} } \over {\partial r}} = {\rm{\mu }}{{\partial u_r } \over {\partial z}} = 0\quad.$$
This shows that the radial displacement ur is independent of z, justifying that the in-plane stress 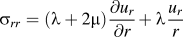 ${\rm{\sigma }}_{rr} = ({\rm{\lambda }} + 2{\rm{\mu }}){{\partial u_r } \over {\partial r}} + {\rm{\lambda }}{{u_r } \over r}$is independent of the depth. Here λ and μ are Lamé’s first and second parameters, respectively. It can be further shown that the in-plane stresses are equibiaxial. The membrane forces should satisfy:
 $${{\partial N_r } \over {\partial r}} + {{N_r - N_{\rm{\theta }} } \over r} + {\rm{\tau }}_{rz} = 0\quad,$$
where 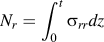 $N_r = \int_0^t {{\rm{\sigma }}_{rr} dz} $ and
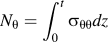 $N_{\rm{\theta }} = \int_0^t {{\rm{\sigma }}_{{\rm{\theta \theta }}} dz} $. As the interface shear stress τrz = 0 (see the proof by Huang and RosakisReference Huang and Rosakis29), equibiaxial stress state is then the exact solution of the above equilibrium equation.
The thickness-independence can also be straightforwardly understood from a dimensional analysis. As the residual stress in film is merely a function of misfit strains Δε, elastic modulus Ef, Es, Poisson ratios vf, vs and thickness tf, ts, the nondimensional residual stress in the film σf can be expressed as:
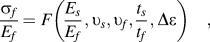 $${{{\rm{\sigma }}_f } \over {E_f }} = F\left( {{{E_s } \over {E_f }},υ_s ,υ_f ,{{t_s } \over {t_f }},\Delta {\rm{\varepsilon }}} \right)\quad,$$
where the subscript f and s pertain to film and substrate, respectively. When ts/tf is very large, the above equation approaches a constant as the stress cannot be infinite. This result is shown in Fig. 7. It is noted that for the effects of both lattice misfit strain and thermal misfit strain, ts/tf > 30 has ensured the thickness-independence. For the SOS system we examined, ts/tf ≥ 120.