


INTRODUCTION
Sugar yields have risen by 0·11 t/ha per year in recent years in the UK (Bruhns et al. Reference Bruhns, Baron and Maier2005). Similar increases over the last 30 years are being reported in France (0·17 t/ha per year; ITB 2003) and in trials in Germany (0·14 t/ha per year; Märländer et al. Reference Märländer, Hoffmann, Koch, Ladewig, Merkes, Petersen and Stockfisch2003). It is usually assumed that these increases result from a combination of the use of improved varieties and improved agronomic practice (ITB 2003; Märländer et al. Reference Märländer, Hoffmann, Koch, Ladewig, Merkes, Petersen and Stockfisch2003). These assumptions are justified only if changes in the weather, over a period of a few years, have had no impact on yield. However, our climate has been changing over recent decades probably in response to increasing atmospheric concentrations of CO2 and other ‘greenhouse’ gases (Long et al. Reference Long, Ainsworth, Rogers and Ort2004). Much attention has been given to the likely impacts of the large climate changes that are expected during the rest of this century, to sugarbeet (Jones et al. Reference Jones, Lister, Jaggard and Pidgeon2003; Richter et al. Reference Richter, Qi, Semenov and Jaggard2006) and to other crops (Richter & Semenov Reference Richter and Semenov2005). Some of the changes to the climate are likely to have positive impacts on beet yields; Scott & Jaggard (Reference Scott and Jaggard2000) attempted to analyse these changes. The present paper describes a more formal analysis of the climate change effects by using yield simulations made with a simulation model and with the UK daily weather records to assess the impact of climate on yield over the last three decades and compares these simulations with the UK national harvested yield and official variety trial results.
The study used the Broom's Barn Crop Growth Model (Qi et al. Reference Qi, Kenter, Hoffmann and Jaggard2005), which has been validated and tested under different environmental conditions and for a number of cultivars. The model runs on a daily time step and is not variety-specific. It simulates: the effects of temperature on seedling emergence, the growth of foliage cover and the development of the root system down through the soil profile; the effects of solar radiation, as intercepted by the foliage, on dry matter production; the effect of rainfall, irrigation and the soil water reserve on foliage cover and dry matter production; and the effect of crop dry weight on dry matter distribution to sugar. The data required to run the model are the latitude of the site where the crop was grown, dates of sowing and harvesting, an estimate of the available water capacity (AWC) of the soil, which can be derived from a description of the soil texture (Gregson et al. Reference Gregson, Hector and McGowan1987) and daily values for mean air temperature, global solar radiation, rainfall and potential evapotranspiration as estimated from the Penman–Monteith equation (Allen et al. Reference Allen, Pereira, Raes and Smith1998).
MATERIALS AND METHODS
Weather data
The weather variables used in the crop growth model have not been recorded over a long period at most of the meteorological observation sites within the sugarbeet-growing regions of the UK. Therefore, simulations were made with weather data recorded at the Broom's Barn weather station. This is one of the UK Meteorological Office's official climatology stations. Recordings were made manually and by trained observers from 1965 until 1996, when the station changed to an automated system based on a Campbell weather station (Campbell Scientific Ltd, Shepshed, Loughborough LE129GX, UK). Comparisons between automated and manual readings were made for one day in every week to check for any anomalies in the automatic system. Any large anomalies were investigated and if necessary the sensors were either recalibrated or replaced. Solar radiation was recorded since summer 1975 as the daily integral of irradiance, using electronic integrators and Kipp and Zonen solarimeters. Therefore, simulations were made for every year since 1976. The rainfall and air temperature data from Broom's Barn were compared with data from 17 other stations in the Meteorological Office's network, all within the beet-growing area (Fig. 1).
The distribution of weather recording stations (circles) in England and Wales, UK in relation to the areas of sugarbeet production (shaded). The filled square symbol represents Broom's Barn.

Crop data
The simulations were compared with yield data from three sources. The first set was data from a long-term series of experiments at Broom's Barn that every year measured the yields achieved with good agronomic practice, both rain-fed and irrigated. Some of these data were summarized by Dunham et al. (Reference Dunham, Draycott and Messem1993). The second source was the national average yield of sugar reported by British Sugar's factories. National average sugar yields were derived from the weight of clean, topped beet and the sugar concentration, as determined in the British Sugar tare-house laboratories, using approved International Commission for Uniform Methods of Sugar Analysis (ICUMSA) techniques (Jaggard et al. Reference Jaggard, Clark and Draycott1999). The protocols for the determination of these characteristics have guarded against any drift in their magnitude. The total area of sugarbeet was the sum of the area declared by all growers. Area declarations are made using the same criteria as those used in the UK government's annual agricultural census. Since the start of the 1970s, the contract between growers and British Sugar has been specified as a weight of beet, not an area to be devoted to the crop. Therefore, there has been no incentive for growers to declare either a larger or a smaller area than was actually sown with sugarbeet. The third source was data from the UK variety testing system. The UK official sugarbeet variety trials are managed by the National Institute of Agricultural Botany (NIAB). Each year, yields are measured on approximately ten trials distributed throughout the beet-growing regions of England. These trials are grown using recommended commercial agronomic practices but are seldom irrigated. The annual average sugar yield was calculated across all sites for all fully recommended varieties.
Allowance has been made for annual variations in the dates of sowing when the Broom's Barn Crop Growth Model was used to simulate annual sugar yields. The date by which half of the UK beet crop had been sown was estimated each year from annual surveys (Scott & Jaggard Reference Scott and Jaggard2000) and more recently from data submitted to British Sugar plc by all growers for all beet fields each year. Most beet crops in the UK are rain-fed. About two thirds of the UK crops are grown on sandy or sandy loam soils (Scott & Jaggard Reference Scott and Jaggard2000). Therefore the model was used to simulate growth in rain-fed conditions in sandy loam soil. In addition, the model was used to simulate growth and yield in the absence of any water stress.
Estimating the rate of annual yield increases
The annual sugar yield increase was estimated by fitting a simple linear regression using Genstat (VSN International Ltd, Oxford, UK). To apportion the total rate of annual sugar yield increases to the effects of climatic change and changes in varieties and agronomic practices, the following assumptions were made. First, that the calculated rate of annual sugar yield increases from the observations in the national official variety trials was the total rate of annual sugar yield increases. This total rate was the contribution of the combined effects of climate change and changes in varieties and agronomic practices. The second assumption was that the Broom's Barn Crop Growth Model is not variety-specific and thus can be treated as a virtual cultivar grown throughout the last three decades. It was used to calculate the annual rate of increase in sugar yield due to changes in the climate, both rain-fed and water stress-free (irrigated). The third assumption was that the difference between the annual rate of increase in sugar yield for rain-fed crops and the total rate for the official variety trials was the contribution due to varieties and agronomic practices.
RESULTS
The first question is ‘Does the model simulate yields realistically?’. Simulations of experiments grown each year with and without irrigation at Broom's Barn are shown in comparison to observed values in Fig. 2. The simulations used the real sowing and harvest dates, and the simulations agree reasonably well with the observations. The simulated sugar yields accounted for 0·88 of the variation in the observed sugar yields and the calculated root mean square error was 1·18. Over the same period, the yields in the experiments have tended to increase at a rate of 0·181 and 0·147 t/ha per year for irrigated and rain-fed crops, respectively.
The relationship between the observed and the simulated sugar yields of crops grown on the sandy loam soil at Broom's Barn during 1976–2004.

The first set of national yield simulations used the Broom's Barn daily weather data and the assumption that all crops were grown on sandy loam soil: sandy loam is the dominant soil type used for beet in England (Scott & Jaggard Reference Scott and Jaggard2000). Each year, the simulations started on the date by which half of the UK crop was sown (Fig. 3). These dates have tended to become earlier, although the trend is only significant at P<0·06. The average sowing date was earlier than 1 April twice in the first decade, four times in the second decade and eight times in the last nine years. The results for rain-fed and irrigated crops are illustrated in Fig. 4. The irrigated crops were estimated to yield, on average, about 3·5 t/ha more sugar than the rain-fed crops if grown on sandy loam soil with Broom's Barns weather. Linear regression showed that the slopes were significantly greater than zero (P<0·01) and were almost exactly the same (P<0·75), being 0·139 and 0·135 t/ha per year for rain-fed and irrigated crops, respectively. The rain-fed crop yields were significantly more variable than the irrigated ones; the irrigated yield variations reflect variations in temperature and solar radiation, while the rain-fed crops respond to variations in rainfall and evapotranspiration as well.
The date by which half of beet crops in the UK were sown from 1976 to 2004.

The simulated sugar yield (t/ha) until 31 October for crops sown in sandy loam soils on the annual average sowing date (Fig. 3). The estimated regression parameters and their standard errors, in parentheses, plus variance accounted for (R 2) are shown for rain-fed and stress-free crops.

The question arises as to whether the yield benefits ascribed in the present paper to the weather could be due to a drift towards growth-favourable observations at the Broom's Barn weather station that is not truly representative of the beet-growing region. The representative nature of the Broom's Barn data was examined by comparing them with data collected from 17 other sites (Fig. 1). Comparisons were made on the basis of mean air temperature and rainfall throughout March–October (Fig. 5). Broom's Barn has been slightly warmer than the mean of the other sites, but consistently within one standard deviation of the mean value. All 18 sites show a significant warming trend (P<0·01) of 0·045°C p.a. over the last three decades. In the case of rainfall, Broom's Barn is not consistently wetter or drier than elsewhere (Fig. 5), but it does fall outside the standard deviation range in eight seasons. There was no trend over time in the amount of rainfall. In the cases of rainfall and temperature, the mean values from Broom's Barn shift in synchrony with the means from the 17 sites. These results indicate that the Broom's Barn weather data can represent the whole beet-growing area.
The temperature (a) and rainfall (b) from 1 March until 31 October, 1976–2004 averaged across 17 weather stations distributed throughout the beet production regions. The vertical bars are ±1s.d. The mean temperatures and rainfall totals in the same period at Broom's Barn are superimposed as open symbols.

It is important to establish how much of the improvement in simulated yield over time might be due to improvements in seed quality (Scott & Jaggard Reference Scott and Jaggard2000) and bolting resistance. These characters have given growers the confidence to sow earlier, whenever weather and soil conditions have allowed. This was examined by repeating the simulations, but using the average sowing date for all years (Fig. 6). The average sowing date between 1976 and 2004 was calculated to be 5 April. The annual increase rates become 0·114 and 0·104 t/ha per year for rain-fed and irrigated crops, respectively: both rates are significantly greater than zero (P<0·01), but are not significantly different from each other (P<0·25). Neither of these rates is significantly different from the rates estimated with the annual average sowing date (Fig. 4). Nevertheless, the steeper slopes were both produced from simulations using the annual average sowing dates and the implication is that changes in sowing date since 1976 have been responsible for these small differences, i.e. 0·025 and 0·032 t/ha per year improvements in sugar yield were the result of a trends towards earlier sowing for the rain-fed and irrigated crops, respectively.
The simulated sugar yield (t/ha) on 31 October each year for beet crops sown on 5 April in sandy loam soil: 1976–2004. The estimated regression parameters and their standard errors, in parentheses, plus variance accounted for (R 2) are shown for rain-fed and stress-free crops.

The upward trend of the simulated yields can be compared to the trends in real yields over the same period (1976–2004). The trend observed in the UK variety testing system run by NIAB between 1976 and 2004 is 0·204 t/ha per year (Fig. 7). This change is significantly greater than zero (P<0·01) and is assumed to be the result of a combination of improvements in variety and seed performance over time and changes in the climate. In addition, the variety trial data were mostly subject to the same shifts in sowing date as the national crop. They also had many other agronomic changes in common with the national crop, but some of these have been yield-neutral and were designed to make the crop easier to manage or cheaper to grow (Scott & Jaggard Reference Scott and Jaggard2000). In contrast to the variety trial data, the upward trend in the national sugar yield delivered to the factories is 0·111 t/ha per year (Fig. 7). This increase is also significantly greater than zero (P<0·01) and is not significantly different (P<0·75) to that predicted from the climate changes alone (0·114 t/ha for rain-fed crops, Fig. 6). Delivered sugar yields were about 2·5 t/ha less than the rain-fed simulations of the experiments at Broom's Barn.
The annual trend in national delivered sugar yields and the official variety trial sugar yields. The estimated regression parameters and their standard errors, in parentheses, plus variance accounted for (R 2) are shown.

The present results indicate that climate change has had a large impact on the trend for increasing yields of sugar in the UK. Jones et al. (Reference Jones, Lister, Jaggard and Pidgeon2003) found that, with simulated past and future climate, sugar yields were likely to become more variable in future. The present paper examined whether there was a tendency for this increased variability in the observed and simulated rain-fed yields since 1976. Figure 8 shows the deviance from the fitted trends for the delivered and simulated rain-fed yield each year. Analyses of these deviances showed that there was no tendency (P<0·25) for a change in either set, so these data cannot be used to support the findings of Jones et al. (Reference Jones, Lister, Jaggard and Pidgeon2003), perhaps because the present data series is too short. However, there was a strong tendency for the observed deviances from the trend to have the same sign as the simulated ones. The relationship between them is shown in Fig. 9, where almost all of the data is confined to the two quadrants that represent a positive correlation.
Sugar yield deviance (t/ha) from the fitted trend lines for the UK delivered yields (circles) and the simulated rain-fed yields (squares): 1976–2004.

Correlation between the sugar yield deviances (t/ha) from the fitted trends for the UK delivered and simulated rain-fed yields, 1976–2004.

DISCUSSION
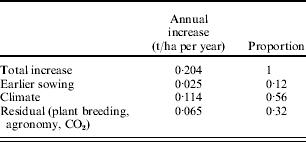
Simulations of sugar yield indicate that changes in the weather during the growing season, including those that allow earlier sowing, are sufficiently large to account for about two thirds of all the sugar yield improvement measured in the national variety trials since 1976 (Table 1) and are more than enough to account for the increases in delivered yields. Comparison of the trend in the national variety trial observations and the simulations suggests that the weather has accounted for annual yield increases of 0·139 t/ha (Fig. 4). Combinations of improved seed quality, seed treatments, bolting resistance and agronomic techniques have tended to advance the sowing date and this has been responsible for the difference between the annual yield increase rates (0·139 and 0·114 t/ha per year) of 0·025 t/ha. The remaining 0·065 t/ha must comprise the combined effects of changes in varieties, agronomy and the concentration of CO2. A long-term experiment at Broom's Barn indicates that modern beet varieties have an increased harvest index and this was part of the yield-improvement mechanism (Scott & Jaggard Reference Scott and Jaggard2000).
Allocation of annual rates of sugar yield increases measured in variety trials according to growth simulations using the Broom's Barn model during 1976–2004
Changes in the delivered sugar yields have been impressive, but slower, at 0·111 t/ha per year. The delivered yields are always less than trial yields (upon which simulated yields are based). Scott & Jaggard (Reference Scott and Jaggard1992) attempted to describe the many causes of the differences between observations in experiments and commercial practice. In summary, trial yields are usually bigger because the following yield-detracting features are excluded from the assessments: uncropped field margins that are part of the field area, headland effects, losses during harvesting, handling, storage and loading. In addition, trials that fail (perhaps due to poor plant establishment, ineffective weed control or the incidence of unplanned diseases) are usually discarded and seldom form part of the trial database; nevertheless, crop failures affect the national statistics.
The yield gap between trials and agricultural practice will become wider unless agricultural practices become more effective. Large improvements to pest and disease control practices might close this gap, but during the period considered in the present paper most pests and diseases in the UK beet crop have been controlled and crop protection research has made control measures more benign without any loss of efficacy. In the latter half of the 1970s, the proportion of the UK beet crop grown on clay loam soils declined from about 0·22–0·17 and was grown on sandy soils instead (Scott & Jaggard Reference Scott and Jaggard2000). This shift made the crop more drought prone but probably improved the recovery of roots at harvest, so probably had no overall effect on yield. Changes in fertilizer practice have been yield-neutral (Scott & Jaggard Reference Scott and Jaggard2000). In the UK, some changes in agronomy (e.g. reduction in the area irrigated, extension of the processing campaign) have actually widened this gap. The proportion of the UK crop that received irrigation peaked at 0·17 in 1990 (Jaggard et al. Reference Jaggard, Dewar and Pidgeon1998) and since then has declined to about 0·06 (Weatherhead & Danert Reference Weatherhead and Danert2002) as farmers have switched their water resources to more valuable, field-scale vegetable crops.
The period over which sugarbeet are processed at the factory (the processing campaign) has been lengthened to improve the efficiency of the use of capital invested in the factories. In the 1970s it was about 100 days; it is now typically 160 days. In consequence, harvest often starts earlier and always finishes later than it did 30 years ago. Although beet can be stored successfully in England to supply the factories in February, there are always storage losses (Jaggard et al. Reference Jaggard, Clark, May, McCullagh and Draycott1997). During a 160 day campaign, calculations suggest that these losses are responsible for a yield loss of at least 4% overall. In part, this extension of the campaign may explain why the trend to higher delivered yield is slower than in France, where campaigns typically last for 80 days (Bruhns et al. Reference Bruhns, Baron and Maier2005), and where the rate of increase has been 0·17 t/ha per year (ITB 2003).
There has been no tendency for either the agricultural practice or simulated yield deviances from the fitted rates to increase with time. Studies of the potential impact of future climate change often found that yields might become more variable as temperature and evaporation rates increase and as drought stress becomes more likely. Jones et al. (Reference Jones, Lister, Jaggard and Pidgeon2003) concluded that this could happen to sugarbeet, when they compared two 30-year periods, 1961–90 and 2021–50. It is probable that too short a period was examined in the present paper to detect any change in variation. The variations in delivered yields were positively correlated with those in the simulated yield series, but smaller. In part, the reduction in variation was probably because the yields were smaller. However, during this period sugarbeet farmers produced their crop for a market where the contract price for beet was high and the price for surplus beet was usually low. In poor seasons, one of the objectives of the farmers and the beet processor is to manipulate the crop so that it produces enough to satisfy the contract, by, for example, applying irrigation or by delaying harvest. In contrast, there has been little incentive to produce a large surplus so, in good years, some farmers have withheld irrigation and fungicides, harvested early and fed sugarbeet to livestock. The present analysis shows that these strategies have successfully limited yield variation.
During the period considered by the present study, the mean concentration of CO2 in the atmosphere has risen from 332 to 378 ml/m3 (equivalent to parts per million by volume (ppmv) (Keeling & Whorf Reference Keeling, Whorf, Boden, Kaiser, Sepanski and Stoss2005). This change has not been accounted for explicitly in the Broom's Barn growth model. An increase from the current CO2 concentration to 550 ml/m3 has increased sugarbeet dry weight by 8% (Manderscheid & Weigel Reference Manderscheid and Weigel2006). On the assumption that this response is linear, the recent change of 46 ml/m3 might have increased dry matter yield by about 2% over the last 30 years. This 2% is a partial cause of the yield trends measured in all of the sugarbeet datasets collected both in the UK and elsewhere throughout Europe. Had the model accounted for the likely effect of CO2 concentration increases on yield, it would suggest that climate change had a larger impact on yield than is implied in Table 1.
It would be interesting to establish whether the changing climate also affected the yields of other crops in the UK. A crop simulation model, Sirius, was used to address this issue for winter wheat, the major arable crop in the UK. Sirius is a wheat model that calculates biomass from intercepted photosynthetically active radiation (PAR) and grain growth from simple partitioning rules, on a daily basis (Jamieson et al. Reference Jamieson, Semenov, Brooking and Francis1998b; Brooks et al. Reference Brooks, Semenov and Jamieson2001). Leaf area index (LAI) is developed from a simple canopy model (Lawless et al. Reference Lawless, Semenov and Jamieson2005). Phenological development is calculated from the main-stem leaf appearance rate and final leaf number, with the latter determined by responses to day length and vernalization (Jamieson et al. Reference Jamieson, Brooking, Semenov and Porter1998a). Effects of water and N deficits are calculated through their influences on LAI development and radiation-use efficiency (RUE) (Jamieson & Semenov Reference Jamieson and Semenov2000). The model was calibrated and validated for several modern wheat cultivars and tested in many environments and climates, including Europe, New Zealand, USA and Australia and under conditions of climate change (Wolf et al. Reference Wolf, Evans, Semenov, Eckersten and Iglesias1996; Jamieson et al. Reference Jamieson, Berntsen, Ewert, Kimball, Olesen, Pinter, Porter and Semenov2000; Ewert et al. Reference Ewert, Rodriguez, Jamieson, Semenov, Mitchell, Goudriaan, Porter, Kimball, Pinter, Manderscheid, Weigel, Fangmeier, Fereres and Villalobos2002).
Sirius requires daily weather data (minimum/maximum temperatures, total radiation and total rainfall) as inputs. It also requires a set of cultivar parameters, including phyllochron, maximum canopy area, vernalization and day length sensitivity parameters; a description of the soil, including moisture retention properties, since they directly affect both water and nitrogen availability; and finally a management file that includes sowing date, N applications, irrigations and initial inorganic N.
The present simulations used cultivar parameters for cv. Avalon, which were calibrated against agronomic experimental data from the UK. The Avalon parameters were used because Avalon was the UK-grown winter wheat variety in the independent validation dataset, where yield was successfully simulated for a range of sowing dates and water stress regimes (Jamieson et al. Reference Jamieson, Semenov, Brooking and Francis1998b). The management description used in the present paper consisted of a sowing date of 10 October with an initial amount of inorganic N in the soil of 100 kg/ha from a single mineral N application of 130 kg/ha on 30 April. The soil description corresponds to a Rothamsted soil with an available water content (AWC) of 240 mm/m with a percolation constant of 0·3 mm/day and saturated moisture content, drained upper and lower limits of 440, 220 and 60 ml/l respectively over the whole profile. The initial inorganic N was described as being split over a 1·5 m profile, 0·5 in the top 0·5 m, 0·3 in the middle 0·5 m and the remainder in the bottom 0·5 m. Organic N content was 13 t/ha with mineralization constants of 0·07 (kg mineral N)(t organic N)/ha per day.
Sirius can be run with constant RUE, disregarding changes in CO2 concentration, and assessing only the effect of changes in weather on grain yield. The results of this simulation (Fig. 10) suggest that changes in climate alone have had almost no impact on wheat yields over the last three decades. If Sirius is used in the mode that takes account of changes in CO2 concentration, then the simulated increase in grain yield over the whole period was 0·43 t/ha (or 0·015 t/ha per year). Calderini & Slafer (Reference Calderini and Slafer1998) and Öfversten et al. (Reference Öfversten, Jauhiainen and Kangas2004) analysed yield trends in long-term yield datasets for cereals but neither identified explicitly any trend due to changes in the climate. The difference between sugarbeet and wheat in response to climate changes is probably due to the different processes of yield formation. Wheat, like other grain crops, undergoes a distinct developmental change before it reaches maturity and is harvested. Warming the environment advances anthesis and shortens the post-anthesis period, thus shortening the time for accumulation of photosynthates. The advance in the date of ear appearance is clearly shown in the analysis of Sparks et al. (Reference Sparks, Croxton, Collinson and Taylor2005). In contrast, beet grown for sugar production remains vegetative and warming during spring and early summer accelerates canopy development and increases yield. The present findings for sugarbeet are similar to those made in temperature gradient chambers for carrot, another indeterminate crop (Wheeler et al. Reference Wheeler, Ellis, Hadley, Morison, Batts and Daymond1996).
Grain yield, simulated by Sirius for winter wheat (variety Avalon) sown on 10 October, 1976–2004 with Broom's Barn weather data. The estimated regression parameters, their standard errors, in parentheses, and the variance accounted for (R 2) are given for the fitted line.

It is important to stress that the success of the plant breeders cannot be measured simply as the size of the yield increase that has been achieved; a continuous effort is needed to maintain yield at its current level. A modern example of this is provided by the incidence and impact of the sugarbeet soil-borne virus disease, rhizomania: very successful breeding programmes have introduced partial resistance to this potentially devastating disease and, at the same time, yields have been maintained, even increased.
CONCLUSION
The Broom's Barn Crop Growth Model, together with the weather recorded at Broom's Barn, indicate that since 1976 beet sugar yields have increased by 0·114 t/ha per year due to improvements in the weather and by another 0·025 t/ha per year due to earlier sowing. The annual deviations from these trends have not tended to become significantly bigger or smaller over the three decades. Comparison of the simulated yield increases due to climate with observations in official variety trials suggests that they account for about two thirds of the total yield increase of 0·204 t/ha per year. The remainder is probably due to a combination of improved varieties, increased CO2 concentration and changes to the agronomy. Improvements in growers' yields are smaller, partly because some of the agronomic changes have been to improve their profit and that of the beet processor, sometimes at the expense of yield. Simulations using the Sirius wheat model indicate that the small increase in wheat yield of 0·015 t/ha per year can be solely attributed to increased CO2 concentration with almost no effect from the recent, changing climate.
We are grateful to Simon Kerr of NIAB for providing sugar yield data from the national variety trials, to John Pidgeon for enthusiastic discussions, and to Dr T. Wheeler of Reading University for comments on a draft of the paper. Broom's Barn Research is supported by the British Beet Research Organization. Rothamsted Research receives grant-aided support from the Biotechnology and Biological Sciences Research Council of the United Kingdom.



