Introduction
The impact of weather on animal health is a topic of increasing concern in the light of future climate scenarios. Climatologists forecast that earth’s temperature will rise over coming decades and that frequency, length and intensity of heat waves (HWs) will increase. Several studies have aimed at assessing heat-related mortality in dairy cows. In one of these studies, we pointed out a greater frequency of deaths during summer months and also that temperature–humidity index (THI) values around 80 and 70 are the maximum and minimum THI, respectively, above which the number of deaths in dairy cows starts to increase significantly (Vitali et al., Reference Vitali, Segnalini, Bertocchi, Bernabucci, Nardone and Lacetera2009). A greater frequency of deaths in dairy cows during summer months was also described in other papers (Pinedo et al., Reference Pinedo, De Vries and Webb2010; Alvasen et al., Reference Alvasen, Jansson Mork, Hallen Sandgren, Thomsen and Emanuelson2012). The effect of HWs on human mortality has been studied in depth (Ostro et al., Reference Ostro, Roth, Green and Basu2009; Schifano et al., Reference Schifano, Cappai, De Sario, Michelozzi, Marino, Bargagli and Perucci2009). Conversely, this topic has not been investigated in domestic animals. Therefore, the present study was aimed at investigating the effect of HWs on mortality risk in dairy cows.
Material and methods
HW was defined as a period when the daily maximum temperature exceeded at least the 90th percentile of a reference distribution for at least 3 consecutive days (Klein Tank and Konnen, Reference Klein Tank and Konnen2003). Weather and mortality data for the study were limited to 6 years (2002 to 2007) and to the months of May to September. The reference distribution considered for HW identification was 1971 to 2000. The days not included in the waves were classified as days not in wave (nHW) or as first (aHWst), second (aHWnd) and third (aHWrd) day after the end of the HW. The latter categorization was carried out to investigate for potential prolonged effects of the waves (see below). Weather data were obtained from 12 weather stations located in 12 different Italian provinces and included temperature and humidity data, which were also used to calculate the THI (Vitali et al., Reference Vitali, Segnalini, Bertocchi, Bernabucci, Nardone and Lacetera2009). The 12 provinces were selected on the basis of the completeness of weather data and numerousness of dairy cows in the area. Cow data (~900 000 cows as an average of the 6-year period) were obtained from the Italian National Bovine Registry (BDN, 2010). Mortality data (46 610 cases) referred to records of cows older than 24 months that died on a farm from all causes (Vitali et al., Reference Vitali, Segnalini, Bertocchi, Bernabucci, Nardone and Lacetera2009). The relationships between HWs and mortality were studies using the case-crossover design (Maclure and Mittleman, Reference Maclure and Mittleman2000). In the model, the days in wave (HW) and the days after the wave were considered as hazard days, whereas the days not in wave were considered as control days. Conditional logistic regression models were used to calculate odds ratios (OR) and 95% confidence intervals (CI) for mortality recorded during hazard days compared with that recorded on control days pooled and stratified by month and length. P-values ⩽0.05 were considered statistically significant. All analyses were performed using Stata software 11.2 (StataCorp, 2011).
Results
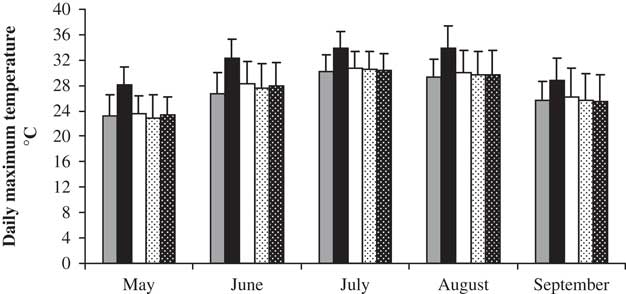
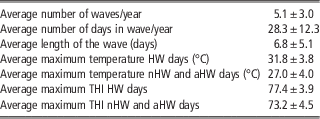
HWs inventory and profile, temperature and THI data are reported in Table 1. Figure 1 reports the average values of monthly temperatures recorded during the study period.
Average monthly temperatures in degrees celsius (±s.d.) recorded during the study period: non heat wave days (nHW) grey columns; heat wave days (HW) black columns; first day after heat wave (aHWst) white columns; second day after heat wave (aHWsd) white columns with black dots; third day after heat wave (aHWrd) black columns with white dots.

Heat waves inventory and profile, temperatures and THI data

HW=days in wave; nHW=days not in wave; aHW=days after the end of the HW; THI=temperature–humidity index.
Considering the events recorded within HW v. those recorded in nHW, the analysis pointed out a significant higher risk of mortality for the dairy cows exposed to HW with an OR of 1.196 (P<0.05; CI: 1.161 to 1.231). The deaths recorded during the 3 days after the end of the waves were considered and compared with nHW to account for potential prolonged effects. The analysis indicated a significant extended effect of the waves: in the aHWst the OR was still high with a value of 1.135 (P<0.05; CI: 1.076 to 1.198); the aHWnd and aHWrd showed a decreasing effect of the HW with OR, which were lower compared with that of aHWst and equal to 1.086 (P<0.05; CI: 1.02 to 1.157) and 1.076 (P<0.05; CI: 1.008 to 1.149), respectively.
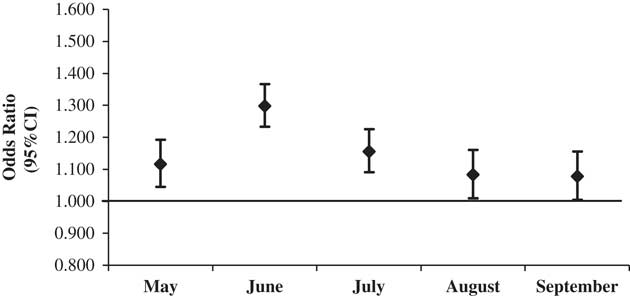
Mortality was also evaluated considering the month when HWs occurred. Although all months analysed showed significant OR, the HWs occurring in early summer months seem to be the most risky for dairy cows (Figure 2). June was the month with the greater risk to die with an OR of 1.298 (P<0.05; CI: 1.233 to 1.366). July and May also showed high OR with values of 1.156 (P<0.05; CI: 1.091 to 1.226) and 1.116 (P<0.05; CI: 1.045 to 1.193), respectively. For the HWs occurring in late summer, the analysis pointed out a lower risk to die with OR of 1.083 (P<0.05; CI: 1.009 to 1.161) and 1.078 (P<0.05; CI: 1.005 to 1.155), for the months of August and September, respectively. Also the length of the waves affected mortality. The analysis indicated an increased OR of 1.020 (P<0.05; CI: 1.017 to 1.023) for each consecutive day within the wave (not shown).
Odds ratio and 95% confidence intervals (CI) related to the effect of heat waves (HWs) on dairy cows mortality stratified by month of HW occurrence.

Conclusion
The analysis of meteorological data showed that the geographic areas considered were affected by several episodes of HWs during the study period. The analysis of mortality data indicated that the risk of dairy cows to die was higher during HWs. When a potential prolonged effect of HW was investigated, the model pointed out an extended risk of mortality during the 3 days after the end of the wave. The analysis also indicated a different risk to die in relation to the month of the wave occurrence. HWs occurring at the beginning of summer resulted in greater risk compared with those occurring at the end of the season. Finally, also the length of the wave was as risk factor. Dairy cow mortality increased for each consecutive day within the wave.
These results confirm the negative effects of heat stress on dairy cow health and strongly support the adoption of structural, management and proactive adaptation measures, which may ensure animal welfare and limit economic losses owing to hot weather.
Acknowledgement
Further information
The LiveM International Livestock Modelling and Research Colloquium was hosted by the Basque Centre for Climate Change (BC3) at the Maritime Museum in Bilbao, Spain between 14 and 16 October 2014. LiveM is the livestock and grassland modelling theme of the EU knowledge hub Modelling European Agriculture with Climate Change for Food Security (MACSUR). The MACSUR project is a pilot knowledge hub started by FACCE-JPI in 2012. It provides an opportunity to explore the role and potential of multi-disciplinary networking structures to address complex regional and global issues. More information on MACSUR and the LiveM theme can be found at www.macsur.eu, with PDFs of slides from conference presentations available through the conference website (http://www.livem2014bilbao.com/).