I. INTRODUCTION
Phosphorus is one of the most crucial elements of life and is widely distributed in nature. One of the important representatives of this element is phosphate, an essential building block for DNA and RNA. Phosphate accumulates mainly as polyphosphate, although low-solubility orthophosphate compounds (PO43−) are the simplest forms of phosphorus accumulation (Durán and Favaro, Reference Durán and Favaro2018). In many pharmaceuticals, it is present as phosphate salts or derivatives, such as monoester clindamycin phosphate, administered against bacterial infections and used in various drug combinations such as BenzaClin®, and Ziana/Veltin®. It is commonly found in synthetic steroids such as betamethasone, dexamethasone, prednisolone, hydrocortisone, and estramustine developed with their corresponding sodium phosphates to treat inflammations (Yu et al., Reference Yu, Yang, Shi and Tang2020).
Recently, the FDA (Food and Drug Administration (FDA), 2020) approved potassium phosphate, indicated as a source of phosphorus in intravenous fluids to correct hypophosphatemia in adults and pediatric patients (12 years of age and older), when an oral or enteral replacement was not possible, insufficient, or contraindicated. The purity of these salts is of paramount importance.
The largely unrecognized role of phosphorus content in medications is mainly due to its role in pharmaceutical preparations. It is mainly used as a pharmaceutical excipient, reported on the packaging label, without the precise concentration. As excipients, phosphates are used most as diluents and buffers to prevent pH fluctuations and provide the required density for preparation, thus facilitating the appropriate route of administration. Although excipients are often considered pharmacologically inert ingredients, they could also have iatrogenic effects, as shown by diethylene glycol in sulfanilamide, which caused acute kidney injury and killed more than 100 people in the United States. The phosphorus-containing excipients in drugs are not inert, as they increase both the phosphorus intake and the blood phosphorus levels, which could have potential iatrogenic effects. Although the phosphorus content in excipients usually contributes to only a small fraction of the recommended daily intake, it is still clinically significant in treating patients with chronic kidney disease because most of them will be on multiple medications (Li et al., Reference Li, Wang, Han, Xiong, Liao, Li, Sun, Maharjan and Su2019).
Phosphate measurement is an old question but also a new challenge. A recent review summarized contemporary methods for determining phosphate in environmental water samples based on published reports from 2016 to the beginning of 2020 (Zhu and Ma, Reference Zhu and Ma2020). It is clear from this review that each technique is characterized by its own merits and suitable scenarios, as well as obstacles that limit its practical application (e.g., methodologies such as spectrophotometry, fluorescence sensing, electrochemical sensing, mass-chromatography spectrometry, UV–Vis spectroscopy, and platforms, such as diffusive gradients in thin films (DGT), flow analysis, and microfluidics). No single method can meet all the analytical requirements or be appropriate for every application. Phosphomolybdenum blue (PMB)-based methods will remain dominant due to their feasibility and versatility. Coupling these methods with new sampling and automation techniques breathes new life into the classic PMB reaction.
In recent years, numerous important advances have been made in understanding the influence phosphates may have had on prebiotic chemistry. Several prebiotic routes to the synthesis of nucleotides, amino acids, and core metabolites that have been facilitated or controlled by phosphate acting as a general acid-base catalyst, pH buffer, or chemical buffer were discussed (Fernández-García et al., Reference Fernández-García, Coggins and Powner2017). These facile and subtle mechanisms for incorporating and exploiting phosphates to orchestrate selective, robust prebiotic chemistry, coupled with the central and universally conserved roles of phosphates in biochemistry, provide an increasingly clear message that understanding phosphate chemistry will be a key element in elucidating the origins of life on Earth.
However, few reports on the analysis of the purity of phosphates by powder X-ray diffraction (PXRD) were published. An interesting analysis of the distribution of phosphates in sodium tripolyphosphate (STPP) calcination was followed by PXRD of all intermediate components, showing several phosphate salts in PXRD patterns (Gorazda et al., Reference Gorazda, Banach, Makara and Wzorek2011). A single crystal of potassium dihydrogen orthophosphate (KDP) was grown by the Sankaranarayanan-Ramasamy (SR) method. The lattice parameters of the grown crystals were confirmed by PXRD analysis (Thilagavathi et al., Reference Thilagavathi, Thaila and Kumara Raman2011).
Phosphate buffer saline (PBS) has numerous biological and pharmaceutical applications, and a study on the effect of Trivedi's biofield energy treatment on the physicochemical properties of PBS (Kumar Trivedi, Reference Kumar Trivedi2015). The control and treated samples were characterized by PXRD. Furthermore, the treated PBS showed an increase in the Bragg angle (2θ) compared to the control sample. This result indicated an increase in the thermal stability of the treated PBS samples. In other words, the PXRD patterns were sensitive to a small energetic effect on the crystal structure of phosphate salts (Kumar Trivedi, Reference Kumar Trivedi2015).
Considering the phosphate accumulation impact in soils, Zhou and Huang (Reference Zhou and Huang1995) studied potassium ions' release at high ammonium dihydrogen phosphate (NH4H2PO4; ADP) concentration in pH 4. In this study, potassium release was investigated by PXRD and showed that ADP promoted K release from these soils. Data indicated that the application of ADP fertilizer could improve the rate of K supply in soils and convert some of the N and P in the fertilizer to a form that is slowly available in soils because of the formation of a crystalline reaction product.
Diammonium hydrogen phosphate ((NH4)2HPO4; DAP) and ADP were reported in interaction with boron, an essential plant micronutrient, presented a narrow range between deficiency and toxicity, being associated with phosphate less toxicity. The PXRD of this kind of sample clearly showed the presence of DAP and ADP (Magda et al., Reference Magda, Pode, Muntean, Medeleanu and Popa2010). ADP crystals exhibited excellent second harmonic generators (SHGs) having appreciable nonlinear optical properties. Good-quality transparent ADP single crystals have been grown by the slow evaporation technique at room temperature. The ADP PXRD pattern showed that the crystals possess a tetragonal structure with lattice parameters in good agreement with the reported data (JCPDS Card No. 850815) (Jegatheesan et al., Reference Jegatheesan, Murugan, Neelagantaprasad and Rajarajan2012). PXRD patterns of the Angera stone specimens treated with a DAP solution showed evidence of residual traces of the reagent (DAP peaks at 17.55°, 17.94°, 23.56°, 26.43°, 27.70°, 28.41°, and 29.16° and ADP at 16.63° (2θ, Cu Kα radiation)), a byproduct of the reaction; these two phases were still present within the specimens even though they were rinsed (Possenti et al., Reference Possenti, Conti, Diego Gatta, Realini and Colombo2019).
The importance of DAP or ADP or mixtures of these two phosphate components is observed in the movement of fertilizer phosphorous in the Ultisol soil, following the order DAP < ADP. Approximately 89–91% of the added phosphorous remained in the center section of the DAP-treated soils, while 79–80.5% of the added phosphorous remained in the center section of the monoammonium phosphate (MAP)-treated soils (Pierzynski and Hettiarachchi, Reference Pierzynski and Hettiarachchi2018). In agriculture, research is important to know DAP and ADP's quantification since their presence will significantly differ in plant cultivation efficiency. A good example is that the phosphorus use efficiency of calcareous soil is very low. So, increasing plant phosphorus use efficiency means decreasing phosphorus fertilizers. Although the dose of ADP and DAP fertilizers increased, they significantly increased the dry weight of the plant and the uptake of plant phosphorus according to the dose of 0 mg of P2O5 kg−1, but ADP was better than DAP. Generally, while the doses of ADP and DAP fertilizers increased, the agronomic phosphorus use efficiency (APUE) and the apparent recovery phosphorus use efficiency (ARPUE) of the popcorn increased. Furthermore, in bread wheat plants, APUE in ADP and DAP and ARPUE in ADP decreased, and the overall ADP was better than DAP. Also, when the doses of ADP and DAP fertilizers increased, that means in popcorn at ADP and bread wheat at ADP, and the physiological efficiency of DAP phosphorus (PPUE) was decreased, and generally, ADP was better than DAP as well. Finally, phosphorus use efficiency decreased when increased phosphorus doses decreased, and ADP was generally better than DAP (Gezgin and Yossif, Reference Gezgin and Yossif2019; Yossif and Gezgin, Reference Yossif and Gezgin2020).
The importance of the purity of DAP is clear from a few reports in the literature, as an example, the synthesis of 2-amino-4H chromones (Zhang et al., Reference Zhang, Hu and Zhou2015), 1,5-benzodiazepines (Sibous et al., Reference Sibous, Ghailane, Houda, Ghailane, Boukhris and Souizi2017), pyrido[2,3-d]pyrimidine derivatives (Abdolmohammadi and Balalaie, Reference Abdolmohammadi and Balalaie2012), and 2-amino-3-cyano-4H pyrans (Taghva and Kabirifard, Reference Taghva and Kabirifard2020).
This work then aims to analyze the purity of several commercial DAP samples by PXRD to classify both the chemical and crystal purities and distribution of reagents or impurities of the side reactions in the synthesis and its interaction and effects on anticancer activity of a drug, using a different kind of phosphate in its synthesis.
II. EXPERIMENTAL
A. Materials
We selected samples from different commercial sources and compared them with a sample synthesized in our laboratory (Sample 4) following some reported procedures (Magda et al., Reference Magda, Pode, Muntean, Medeleanu and Popa2010).
-
Sample 1: DAP ≥ 95.5% purity by alkalimetric analysis (from a company in the USA).
-
Sample 2: DAP ≥ 99% purity (from a Brazilian company).
-
Sample 3: DAP ≥ 99% purity (from a Brazilian company).
-
Sample 4: DAP ≥ 98% purity by alkalimetric analysis (synthesized in our laboratory).
B. Synthesis of DAP (Sample 4)
All reagents used were of analytical grade, and the synthesis followed the modified method of Magda et al. (Reference Magda, Pode, Muntean, Medeleanu and Popa2010). A total of 50 ml of phosphoric acid (58% H3PO4) (obtained from Merck, 85% H3PO4-345245-100 ml) in the presence of a pH meter were neutralized with a 25% ammonia solution (Merck catalog No 105428), continuously stirring at 20 °C to a pH of approximately 8.0, thus resulting in DAP crystals. The evaporated and dried powders were analyzed by PXRD.
C. Synthesis of ammonium magnesium phosphate complex (AMPC)
The syntheses of AMPC – a complex that displays anticancer activity against several cancer lines – were carried out following the Brazilian Patent (PIBR 10 2017 012768 0, PIBR granted 2022), European Patents (PCT/Br 2018/000031; EP 3 625 746-1) (Favaro and Durán, Reference Favaro and Durán2017, Reference Favaro and Durán2018, Reference Favaro and Durán2022), and US Patents (US Patent 20210238046-A1 (2021); US Patent 20210238044-A1 (2021); and US Patent 20210238045-A1 (2021)). Briefly, DAP's reaction with magnesium salt was performed at the pH, temperature, concentrations, and surfactant-controlled conditions. In the syntheses “A” and “B”, we used samples 3 and 4, respectively. The samples obtained were named AMPC-A and AMPC-B.
D. Powder X-ray diffraction
Powder X-ray diffraction (PXRD) data were collected on a STADI-P diffractometer (Stoe®, Darmstadt, Germany), in transmission geometry, at room temperature, operating at 40 kV and 40 mA and using Cu Kα 1 radiation (λ = 1.5405926 Å), selected by a Ge(111) curved primary-beam monochromator (Johann type). A Mythen 1 K detector (Dectris®, Baden, Switzerland) recorded the intensities from 14.000° to 85.385° (2θ), in steps of 0.015°, and a count time of 100 s at each 1.05°. The samples were loaded between two cellulose acetate foils in a sample holder that kept spinning during measurement.
E. Mean diameter (Z-average) and zeta potential (ζ)
The nanoparticle dispersion (for the AMPC samples) was diluted with deionized water (1:10 v/v). The mean diameter (Z-average) and zeta potential were measured by photon correlation spectroscopy and electrophoretic mobility, respectively, using a Nano ZS Malvern Zetasizer with a fixed angle of 173° at 25 °C.
F. Thermogravimetric analysis (TGA)
The thermogravimetric analysis (TGA) curves for the AMPC samples were measured using a Thermogravimetric Analyzer model 2950 from TA Instruments. All measurements were made with a continuous argon flow of 100 ml min−1 from room temperature to 800 °C at a heating rate of 10°C min−1. Before TGA analysis, all samples were dried under a dynamic vacuum for 48 h.
G. Differential scanning calorimetry (DSC)
Differential scanning calorimetry (DSC) curves for the AMPC samples were obtained by a DSC-Q10 Differential Scanning Calorimeter (TA instruments) using a standard sealed aluminum pan under nitrogen at a flow of 50 ml min−1, in the temperature range of 5 to 55 °C and heating rate of 5 °C min−1. The samples were previously lyophilized.
H. Energy-dispersive X-ray fluorescence (XRF)
The AMPC samples were irradiated in triplicate for 300 s under vacuum using an energy-dispersive X-ray fluorescence spectrometer Shimadzu EDX-720 (XRF). The samples were irradiated using an Rh X-ray tube operating at 15 kV (Na to Sc) and 50 kV (Ti to U). The current was automatically adjusted (maximum of 1 mA). A 10 mm collimator was chosen. The detection was carried out using the Si (Li) detector cooled with liquid nitrogen.
I. Scanning electron microscopy (SEM)
Scanning electron microscopy (SEM) images were acquired on a JSM-6010LA (Jeol®, Akishima, Japan) using secondary electrons and an accelerating voltage of 15 kV. The field of view for all samples was 200 μm. The samples were magnified 55 times to display average particle sizes.
J. Preclinical trial with mice on induce non-muscle invasive bladder cancer (NMIBC)
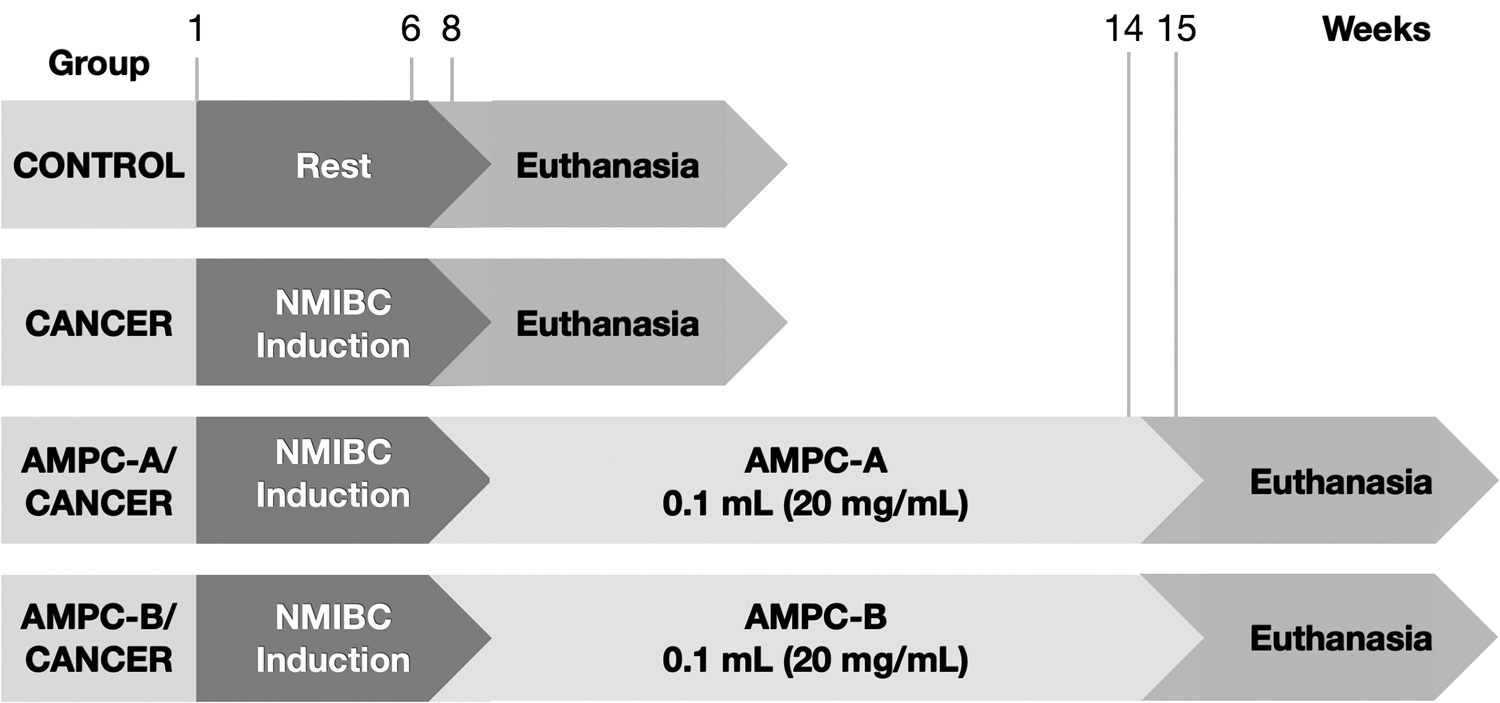
The Ethical Committee of the University of Campinas (UNICAMP) approved the study protocols. The protocol strictly followed the ethical principles in animal research (CEUA/IB/UNICAMP – protocol numbers: 4579-1/2017 and 4871-1/2018). According to the American Psychological Association Guidelines for Ethical Conduct in the Care and Use of Animals, all animal procedures agree with the Ethics Principles in Animal Research adopted by the Brazilian College of Animal Experimentation. Thirty-six female C57Bl/6J mice, seven weeks old, were obtained from the Multidisciplinary Center for Biological Investigation (CEMIB) of the University of Campinas (UNICAMP). Animals were divided into six groups (n = 6): two Control, two Cancer, AMPC-A/Cancer, and AMPC-B/Cancer (Figure 1).
Experimental design of the preclinical trial.

For NMIBC induction, animals received 0.10 ml of N-nitroso-N-ethyl urea (Sigma-Aldrich), dissolved in 30% dimethyl sulfoxide (DMSO) (Sigma-Aldrich) (50 mg ml−1) intravesically every other week for 6 weeks. Treatment started 2 weeks after NMIBC induction, once a week for 6 weeks. Before each intravesical catheterization using 24-gauge angiocatheter treatments, the animals were anesthetized with 10% ketamine (60 mg kg−1, i.p.; Ceva Animal Health Ltd., São Paulo, Brazil) and 2% xylazine (5 mg kg−1, i.p.; Ceva Animal Health Ltd., São Paulo, Brazil). The animals remained anesthetized for approximately 45 min after catheterization to prevent spontaneous micturition.
A week after the last treatment dose, the animals were euthanized with an intramuscular injection of 5 mg kg−1 xylazine and 80 mg kg−1 ketamine. A median laparotomy was performed to expose the organs, kidneys, and ureters to detect macroscopical alterations. Urinary bladders were collected and processed for histopathological analysis.
K. Histopathological analyses
Urine bladder samples were used in each group (n = 6) and fixed in Bouin solution (saturated picric acid, 10% formaldehyde, and glacial acetic acid). After 24 h of the fixation, according to Garcia et al. (Reference Garcia, Seiva, Carniato, d. Mello, Duran, Macedo, de Oliveira, R., I. S., O. S. and W. J.2016) protocols, the specimens were washed in ethanol (70%) and dried out in an ascending series of alcohols. Subsequently, the fragments were diaphanized in xylene for 2 h and embedded in the plastic polymer (Paraplast Plus, ST. Louis, MO, USA). Then, the samples were cut on a rotary microtome Slee CUT5062 RM 2165 (Slee Mainz, Mainz, Germany), 5 μm thick, stained with hematoxylin-eosin, and photographed with a Leica DM2500 photomicroscope (Leica, Munich, Germany). A senior uropathologist analyzed the urinary bladder lesions according to the Health World International Society of Urological Pathology Organization (Epstein et al., Reference Epstein, Amin, Reuter and Mostofi1998).
III. RESULTS AND DISCUSSION
A. PXRD analyses for phosphates
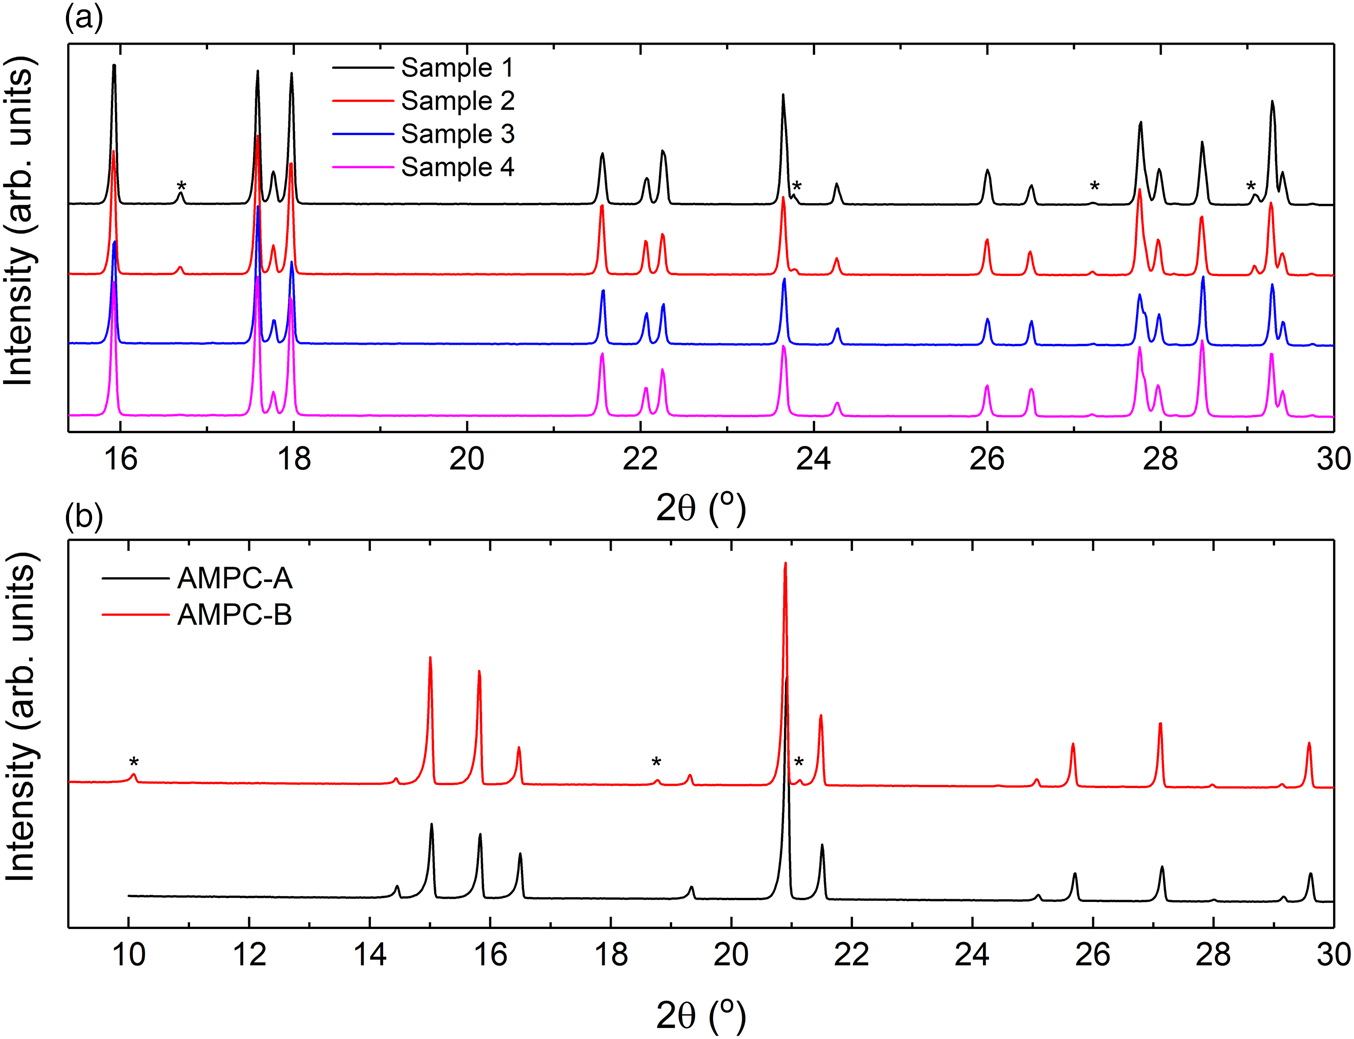
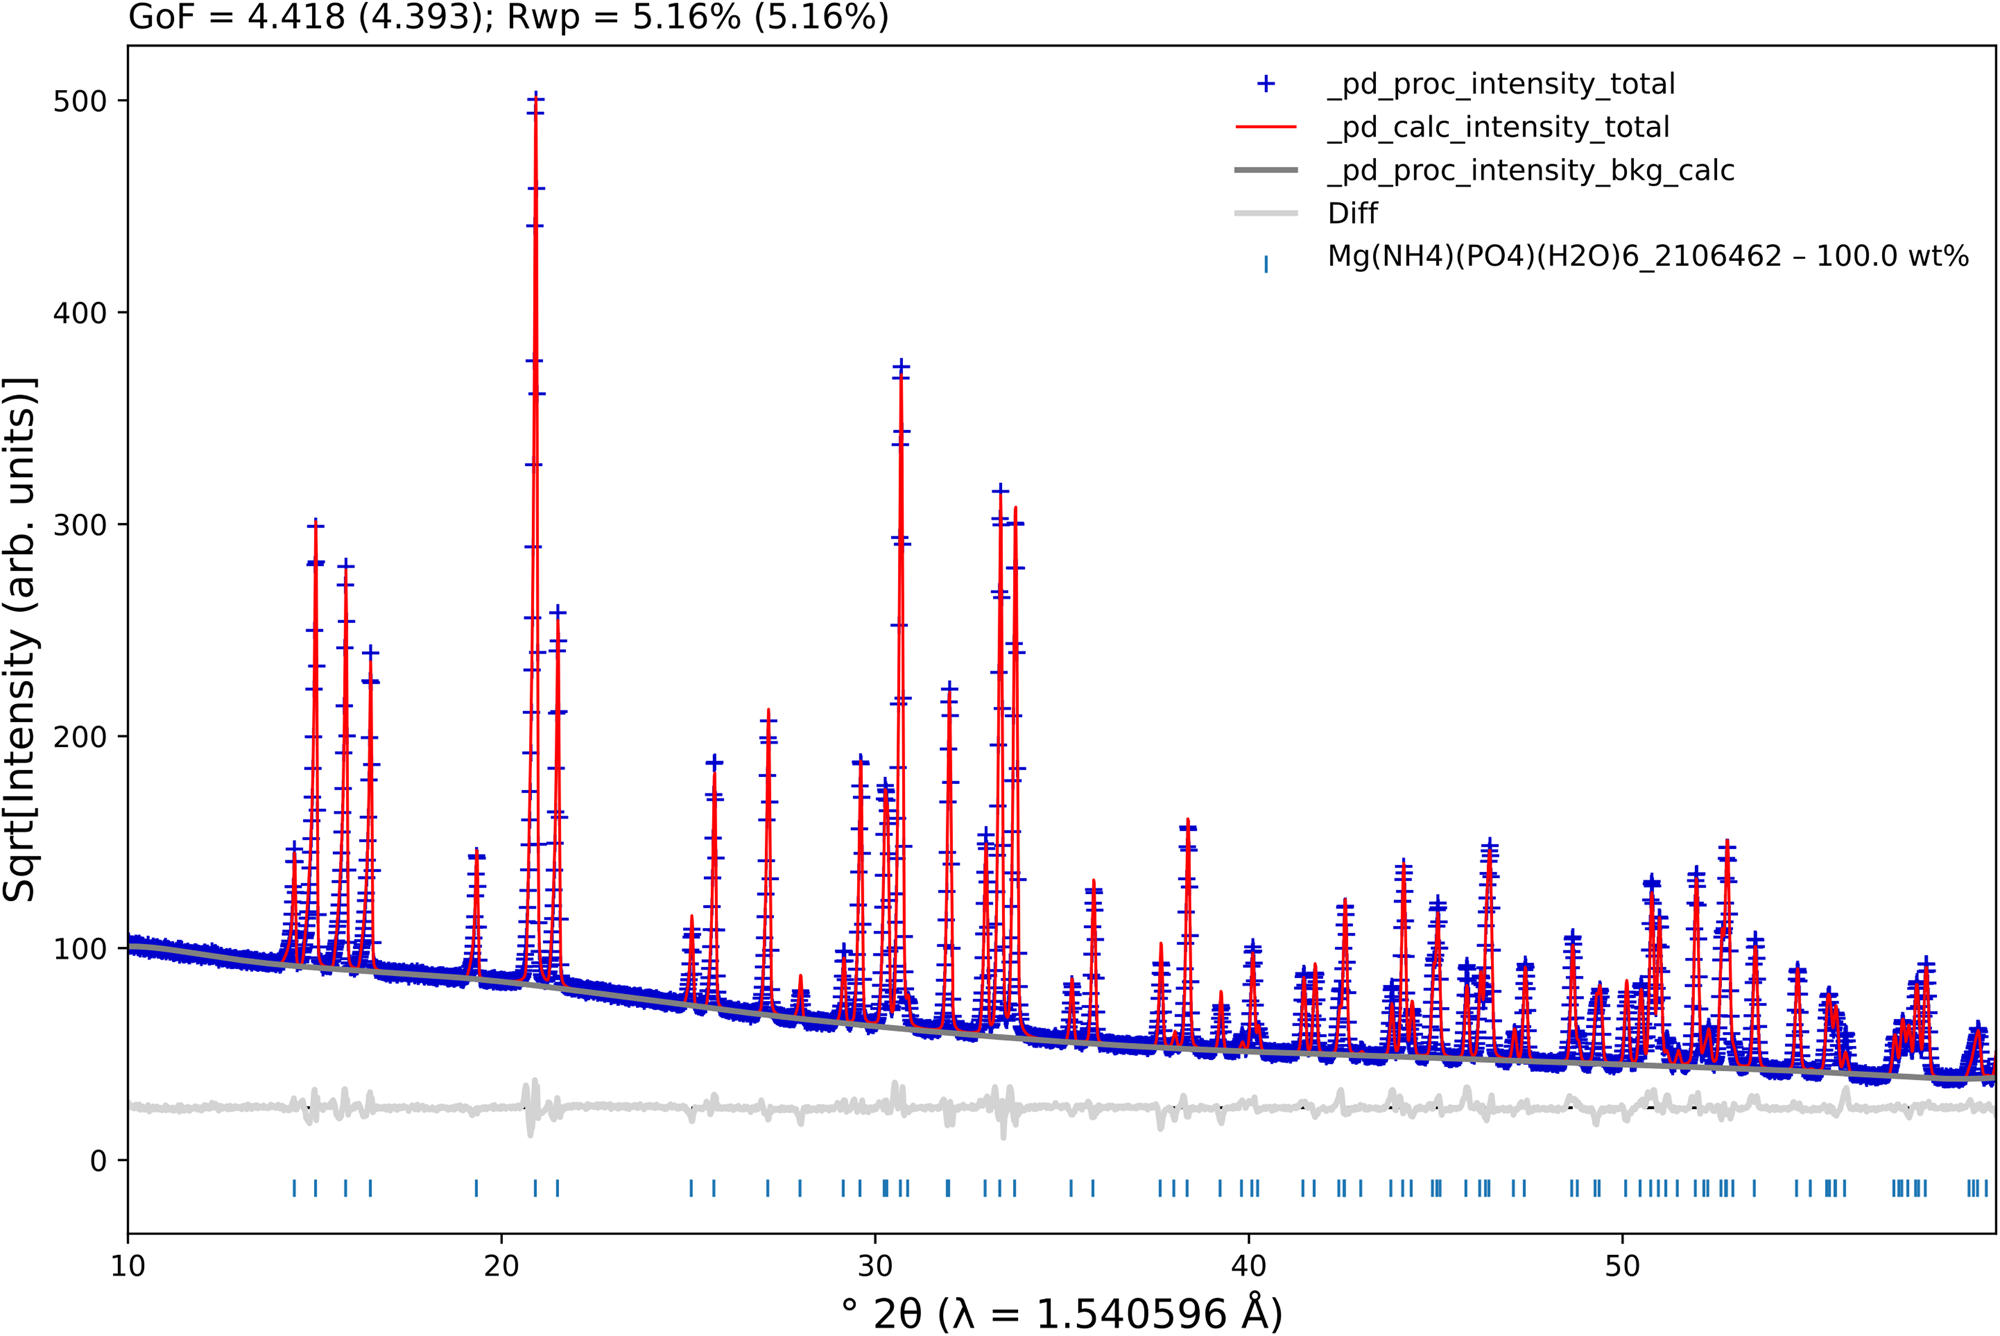
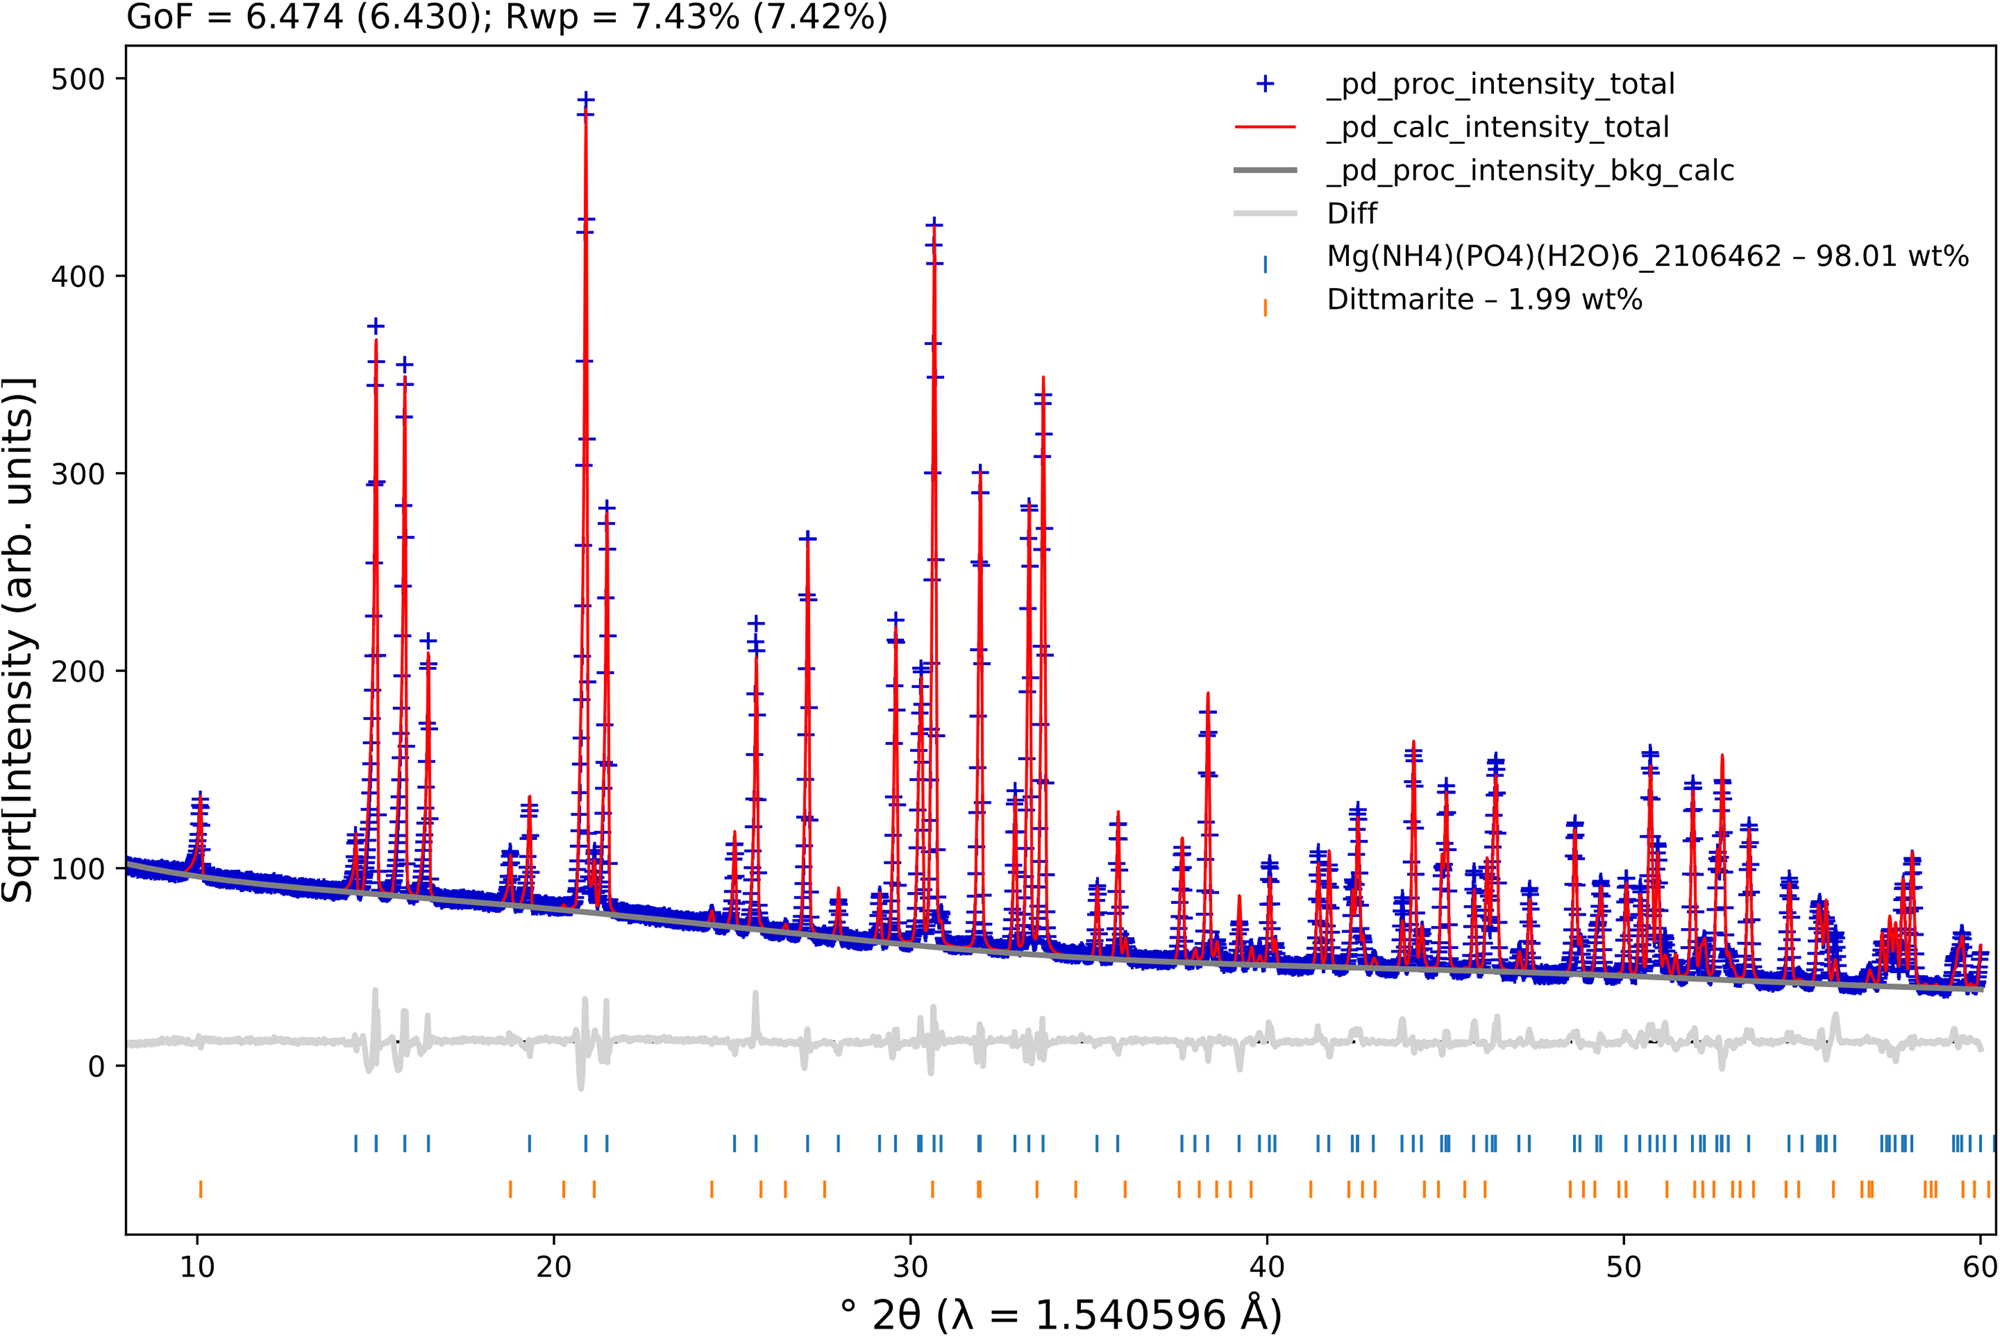
Figure 2(a) shows the normalized PXRD patterns for all DAP samples studied in a limited 2θ range (up to 30°). At first glance, as indicated by asterisks, one can notice the presence of possible “impurities”. A qualitative phase analysis, carried out using the QualX2 software (Altomare et al., Reference Altomare, Corriero, Cuocci, Falcicchio, Moliterni and Rizzi2015), and implemented with an internal version (PowCod 2205) of the Crystallography Open Database (COD) (Gražulis et al., Reference Gražulis, Daškevič, Merkys, Chateigner, Lutterotti, Quirós, Serebryanaya, Moeck, Downs and Le Bail2012), indicated the presence of DAP as the main crystalline phase and small amounts of ADP (displayed by the asterisks). The same procedure was carried out for the AMPC-A and AMPC-B samples, and the PXRD patterns are shown in Figure 2(b), which indicated that AMPC-A consists only of Mg(NH4)(PO4)(H2O)6 and AMPC-B contained both Mg(NH4)(PO4)(H2O)6 and Mg(NH4)(PO4)(H2O).
Powder X-ray diffraction patterns of the (a) DAP and (b) AMPC samples studied. The patterns were normalized, considering the most intense diffraction peak in each one. For the sake of clarity, only a small region was selected. The asterisks (*) indicate the presence of (a) ammonium dihydrogen phosphate (ADP) and (b) Mg(NH4)(PO4)(H2O). All the other peaks represent (a) diammonium hydrogen phosphate (DAP) and (b) Mg(NH4)(PO4)(H2O)6.

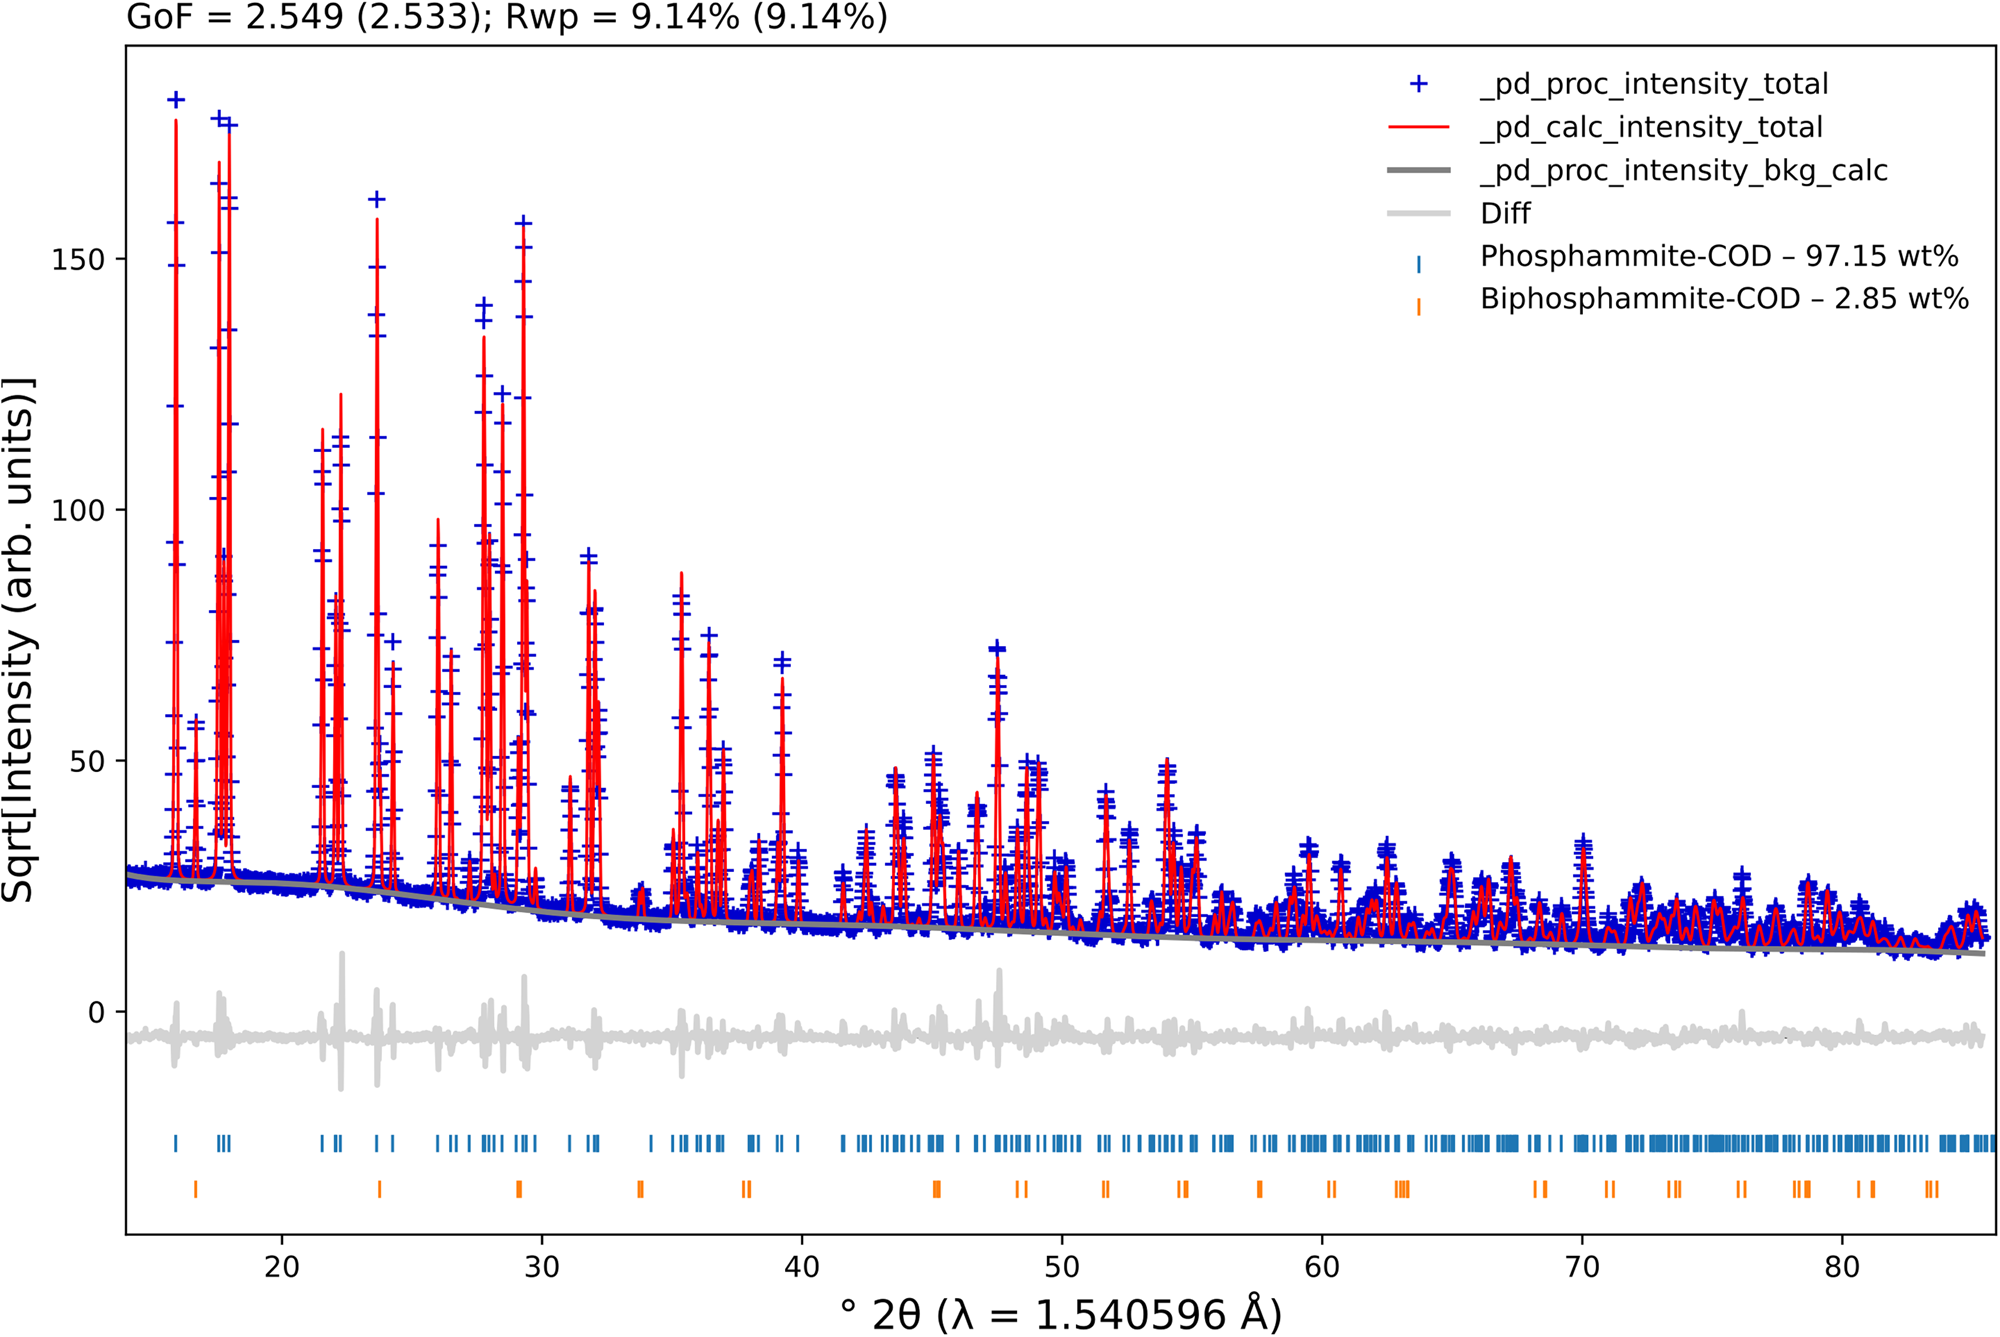
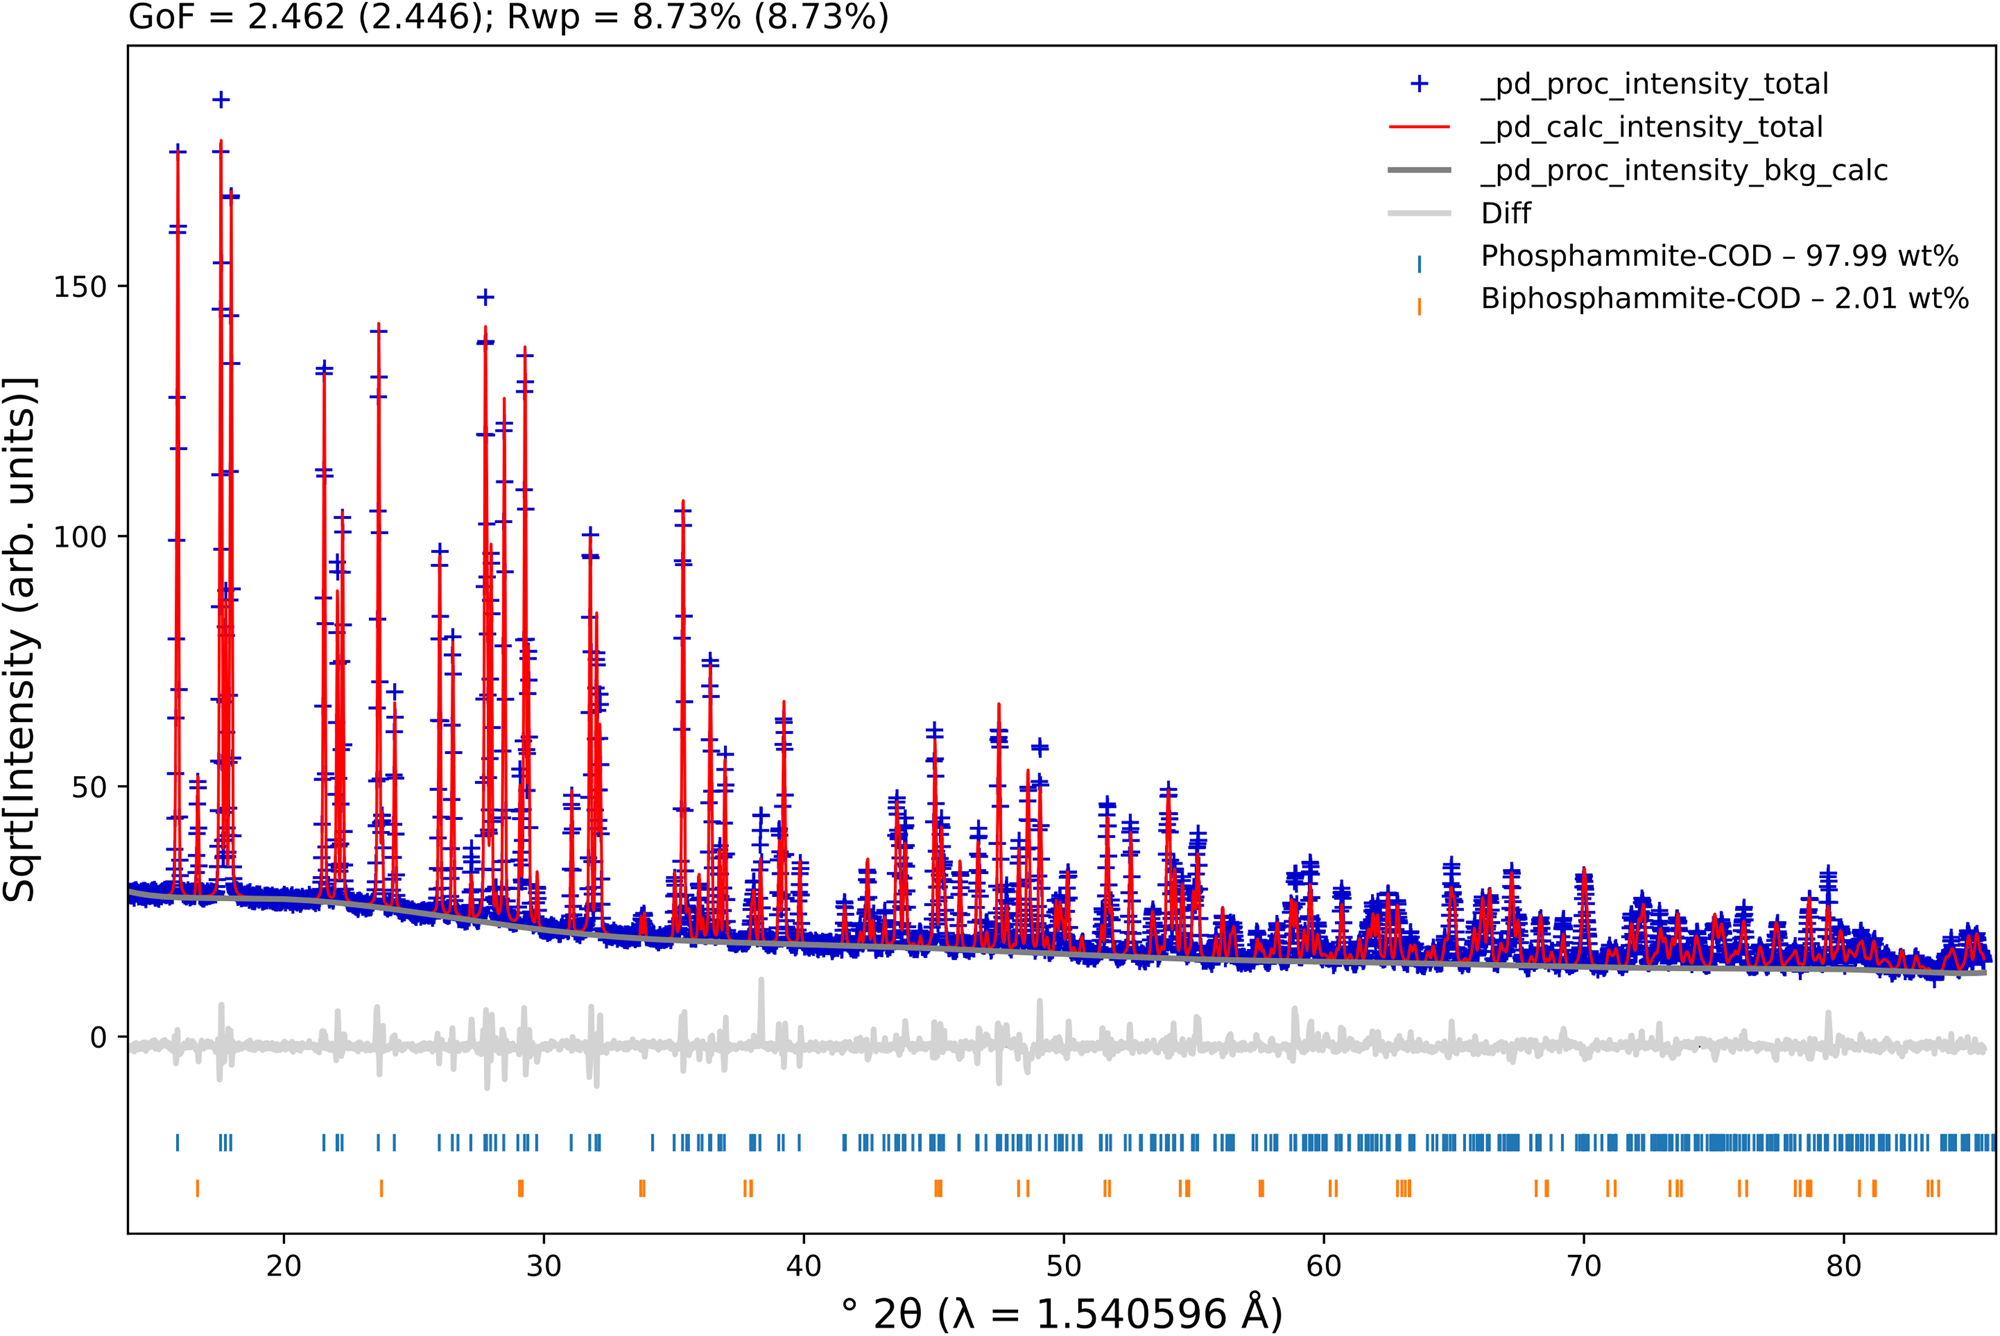
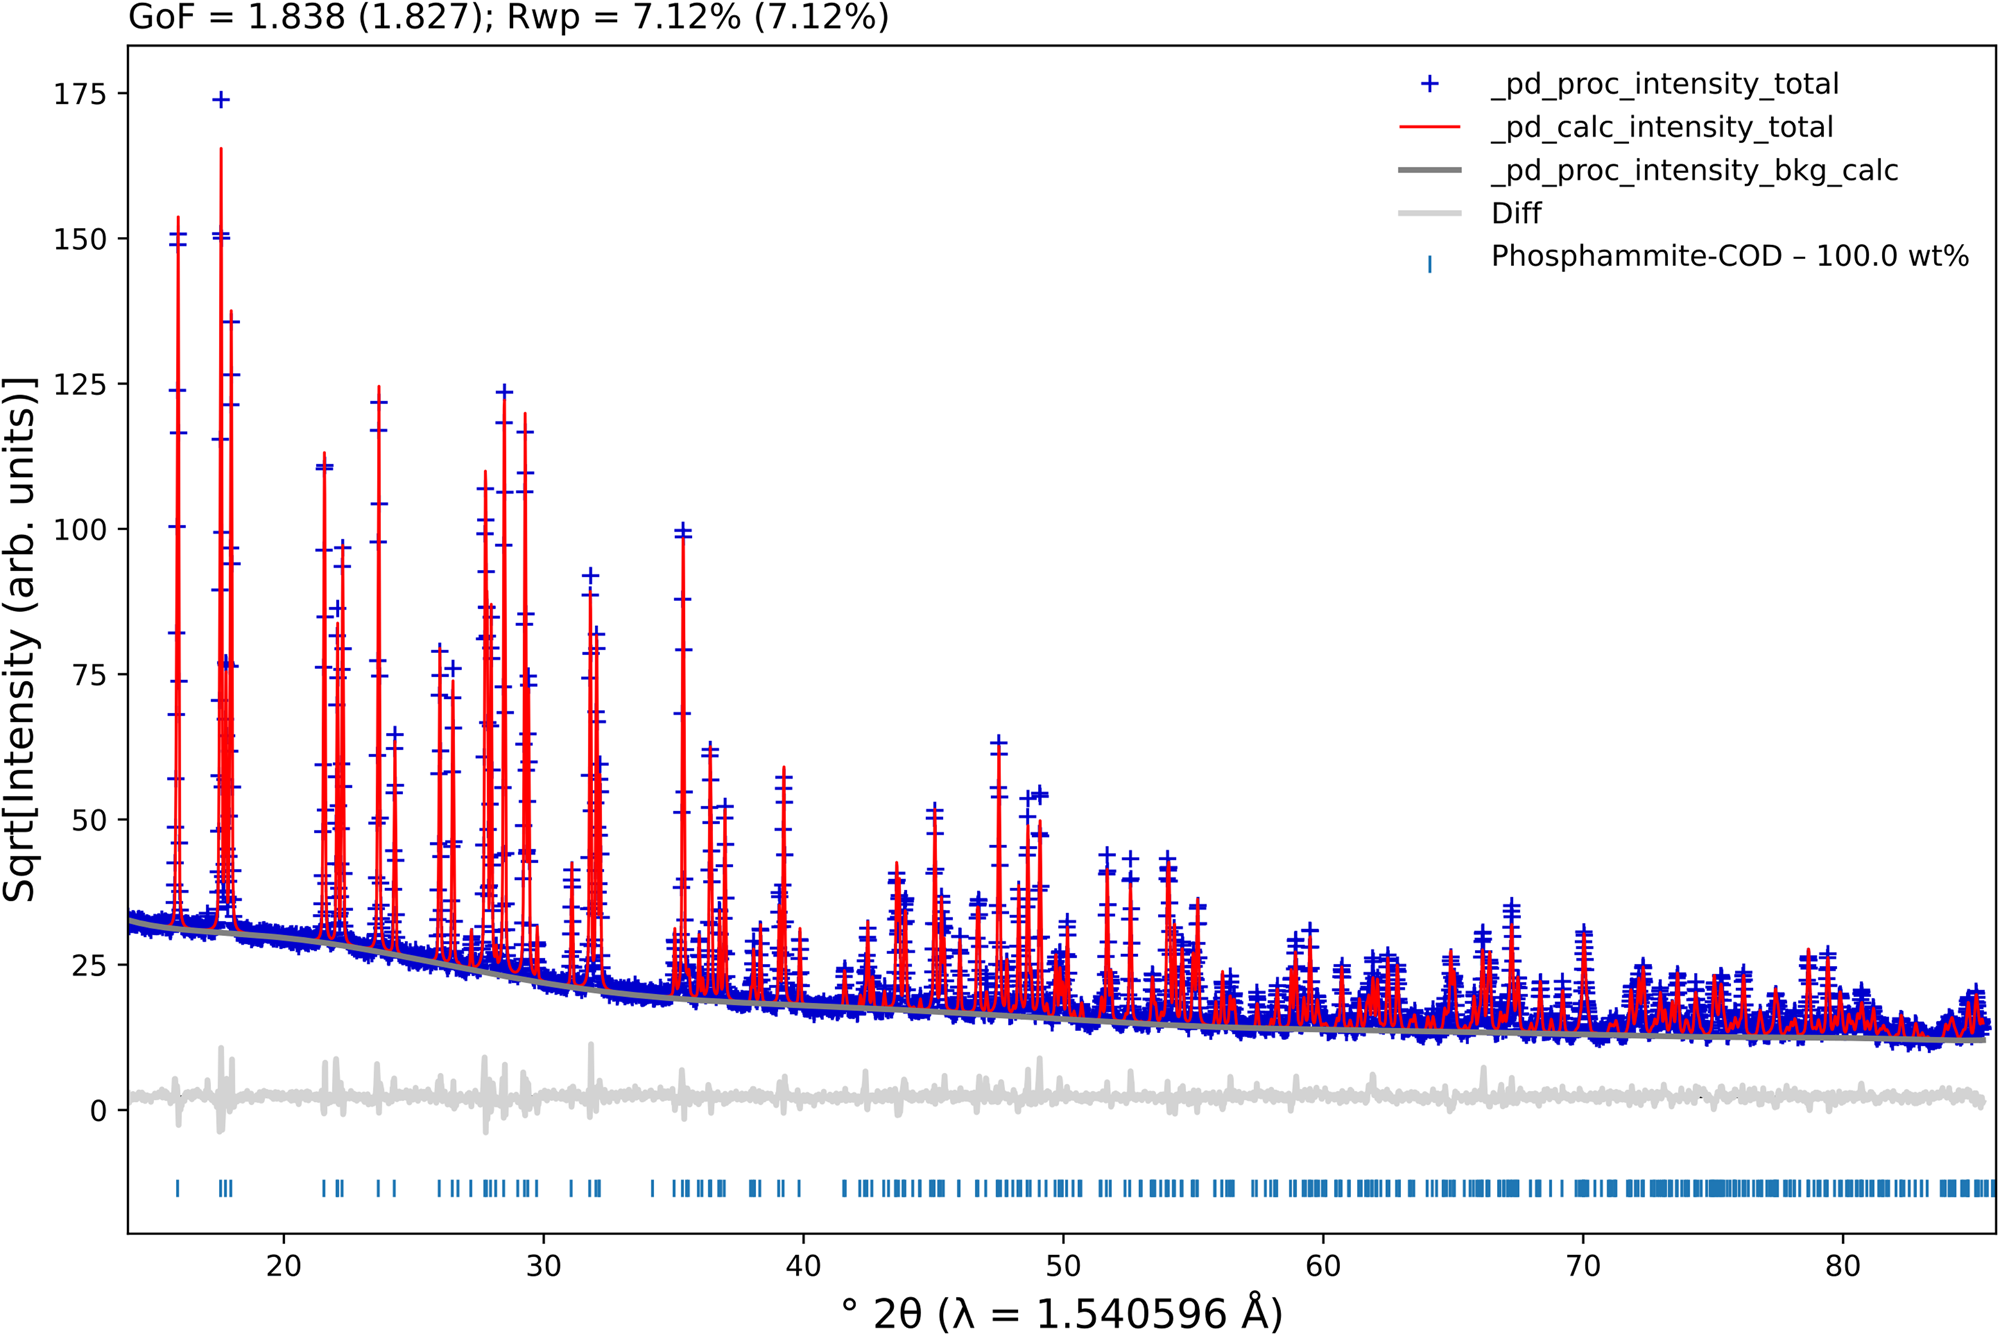
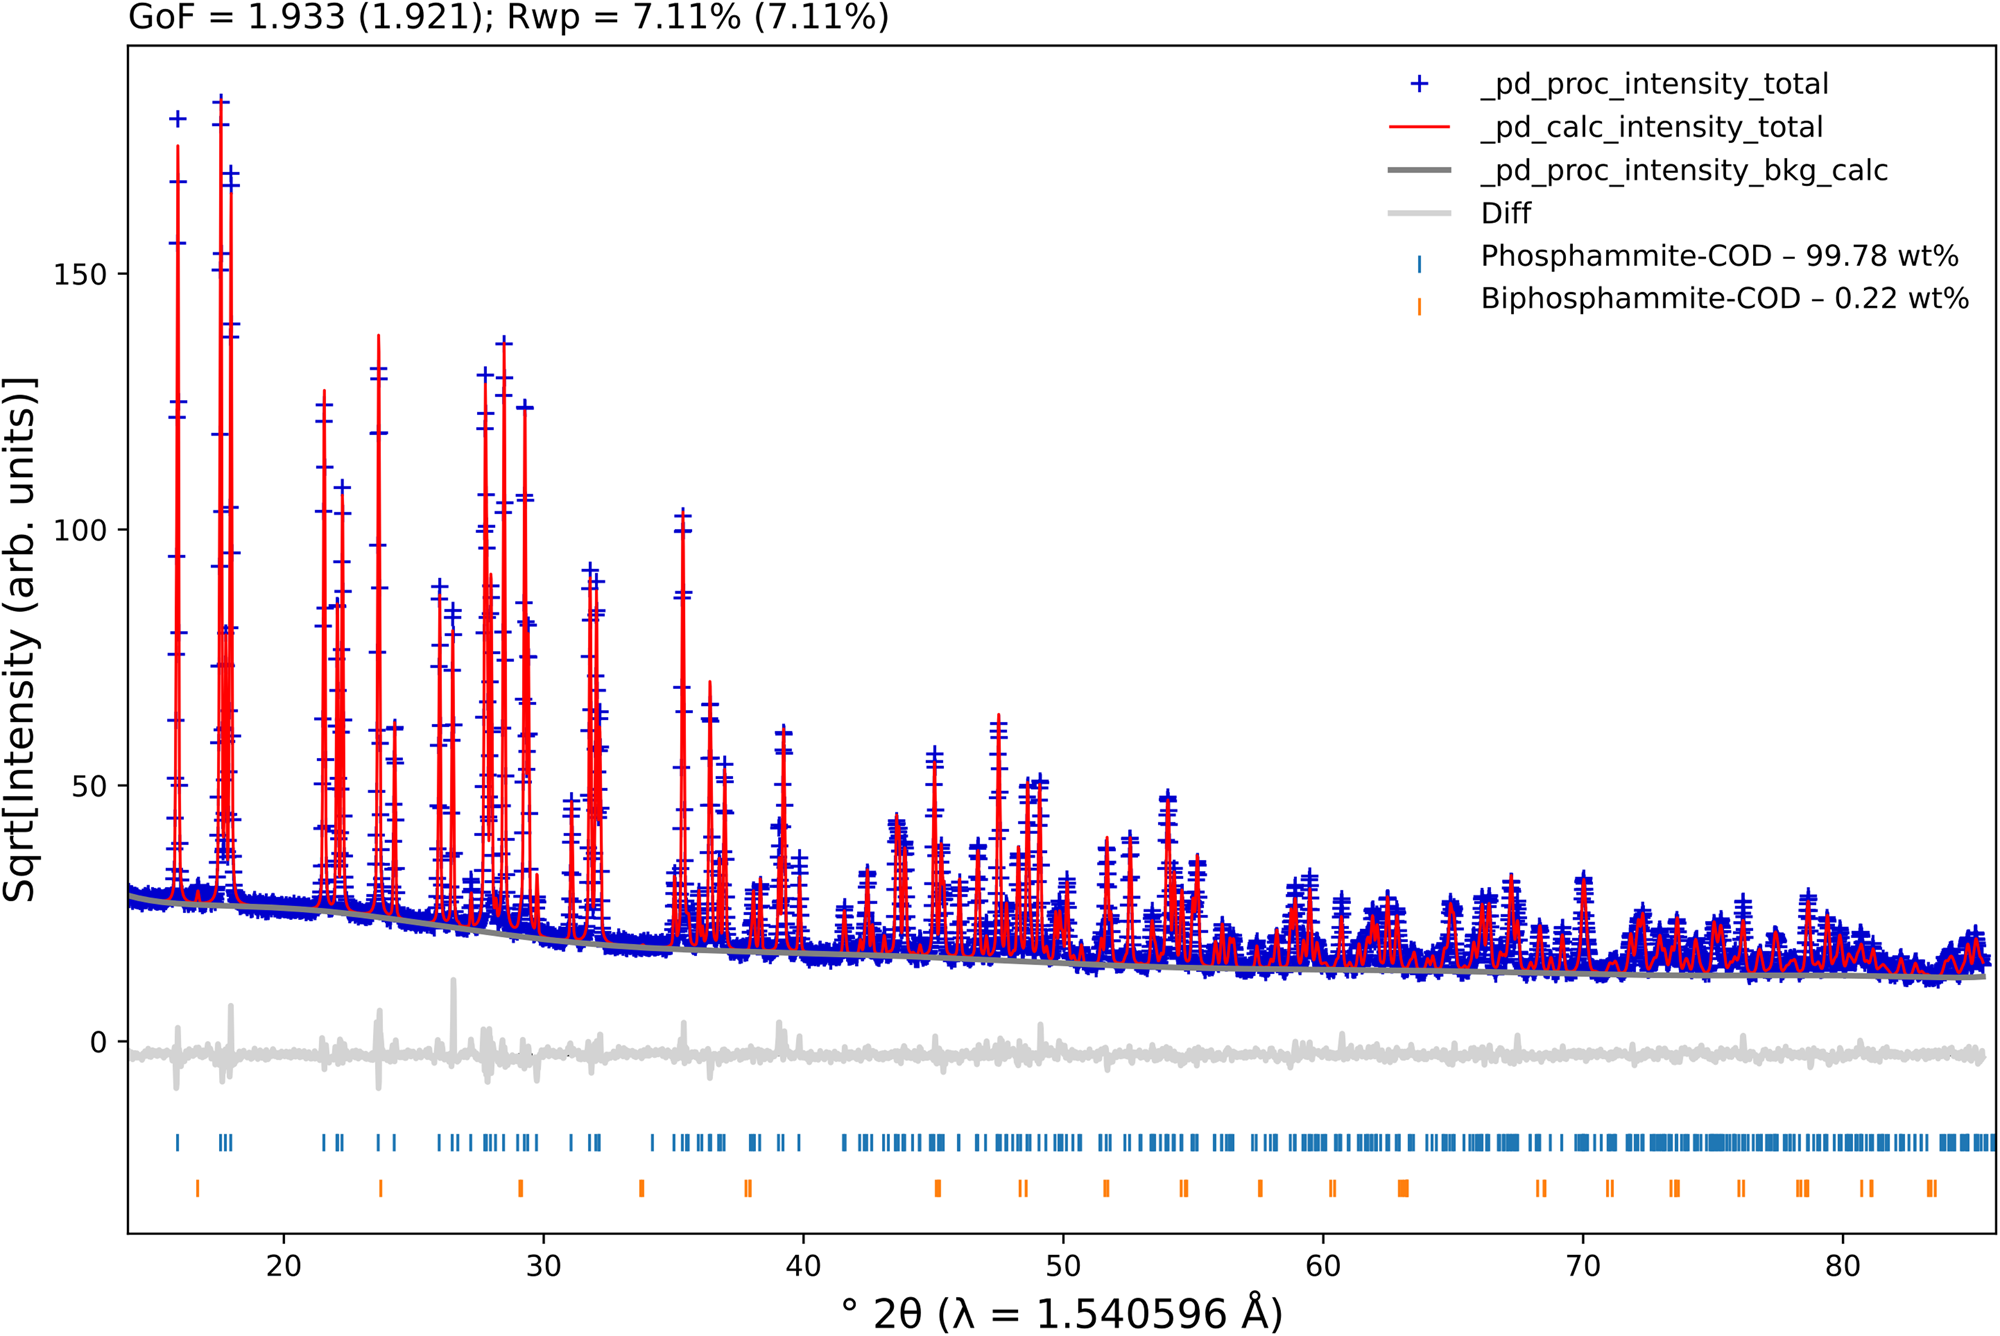
We then downloaded the DAP (COD 9011121 (Khan et al., Reference Khan, Roux and James1972)), ADP (COD 9007580 (Khan and Baur, Reference Khan and Baur1973)), Mg(NH4)(PO4)(H2O)6 (COD 2106462), and Mg(NH4)(PO4)(H2O) (ICSD 5148) crystallographic information framework (CIF) files from COD and the Inorganic Crystal Structure Database (ICSD) (Allmann and Hinek, Reference Allmann and Hinek2007) to perform quantitative phase analyses (QPAs) (Hill and Howard, Reference Hill and Howard1987; Bish and Howard, Reference Bish and Howard1988) using the Rietveld method (Rietveld, Reference Rietveld1969) employing the TOPAS-Academic v7 software (Coelho, Reference Coelho2018). To properly model the instrumental contribution, we measured a Si 640d standard reference material (SRM 640d), from the National Institute of Standards and Technology (NIST), under the same experimental conditions performed for the studied samples. We then performed a Pawley fit and used a simple axial model to correct for the slight axial divergence at low diffraction angles. In cases where the axial divergence is “severe”, its modeling is best described by using an empirical refinement of the so-called full axial model (Cheary and Coelho, Reference Cheary and Coelho1998). We also refined the specimen displacement (Gozzo et al., Reference Gozzo, Cervellino, Leoni, Scardi, Bergamaschi and Schmitt2010) using a slightly modified version of Eq. (3) (in Gozzo et al.'s paper), taking into account only displacements in the beam direction (and not perpendicular to it). Although the samples are measured in transmission geometry, loaded between two acetate cellulose foils, their thicknesses may deviate from the ideal center of the goniometer, thus shifting the peak positions; the correction used improves the fitting procedure satisfactorily. The modified Thompson-Cox-Hastings (TCHZ) pseudo-Voigt function (Young, Reference Young1993) was used to model the peak shapes. The refined values for the Gauss (U, V, and W; Z was kept equal to zero) and Lorentz (X and Y) contributions were then kept fixed to extract the crystallite and microstrain contributions (using the “double-Voigt approach” (Balzar, Reference Balzar, Snyder, Bunge and Fiala1999)) from the samples. The background was modeled using a 10th-order Chebyshev polynomial for the samples studied. The preferred orientation of the crystallites was considered using spherical harmonics (8 terms) for the DAP phase. The unit cell and isotropic displacement parameters were refined for all phases. The Rietveld plots for all samples are shown in Figures 3–8, which were generated using the program pdCIFplotter (Rowles, Reference Rowles2022).
Rietveld plot for sample 1. The blue plus signs represent the observed patterns, while the red line indicates the calculated ones. The gray line at the bottom of the figure represents the difference between the observed and calculated patterns. The vertical bars display the Bragg reflections of the identified phases.

Rietveld plot for sample 2. The blue plus signs represent the observed patterns, while the red line indicates the calculated ones. The gray line at the bottom of the figure represents the difference between the observed and calculated patterns. The vertical bars display the Bragg reflections of the identified phases.

Rietveld plot for sample 3. The blue plus signs represent the observed patterns, while the red line indicates the calculated ones. The gray line at the bottom of the figure represents the difference between the observed and calculated patterns. The vertical bars display the Bragg reflections of the identified phase.

Rietveld plot for sample 4. The blue plus signs represent the observed patterns, while the red line indicates the calculated ones. The gray line at the bottom of the figure represents the difference between the observed and calculated patterns. The vertical bars display the Bragg reflections of the identified phases.

Rietveld plot for the AMPC-A compound. The blue plus signs represent the observed patterns, while the red line indicates the calculated ones. The gray line at the bottom of the figure represents the difference between the observed and calculated patterns. The vertical bars display the Bragg reflections of the identified phases.

Rietveld plot for the AMPC-B compound. The blue plus signs represent the observed patterns, while the red line indicates the calculated ones. The gray line at the bottom of the figure represents the difference between the observed and calculated patterns. The vertical bars display the Bragg reflections of the identified phases.

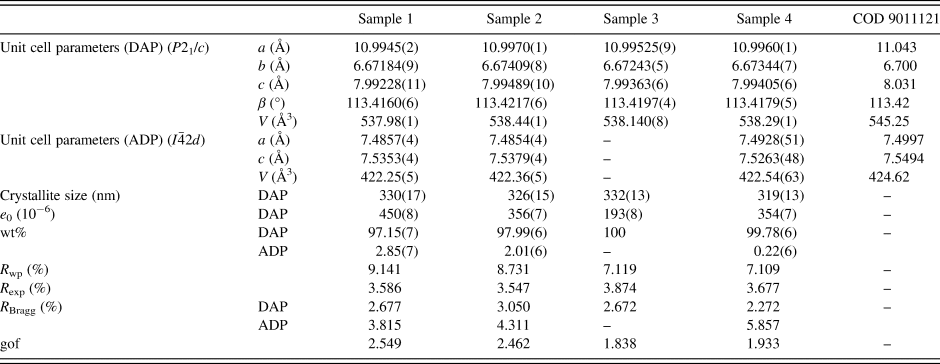
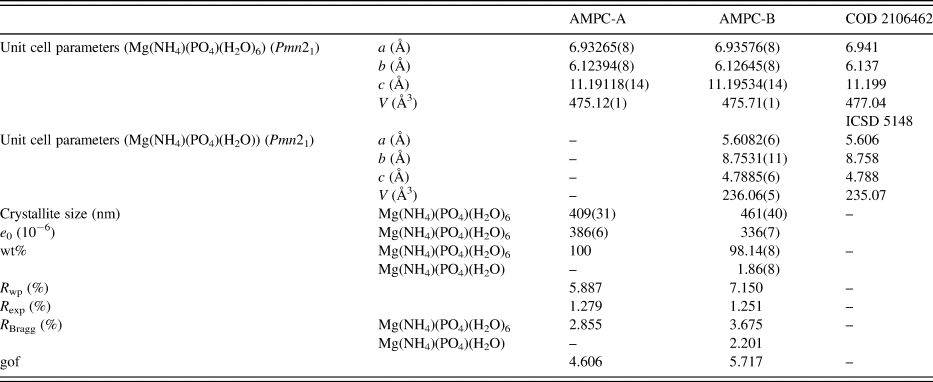
Refined unit cell parameters, crystallite sizes, mass fractions, R-factors, and goodness-of-fit indicators for all DAP samples are shown in Tables I and II for the AMPC samples.
Structural parameters – unit cell parameters, crystallite sizes, and mass fractions – R-factors, and goodness-of-fit indicator (gof) for all DAP samples.

Structural parameters – unit cell parameters, crystallite sizes, and mass fractions – R-factors, and goodness-of-fit indicator (gof) for all AMPC samples.

It is evident from the mass fraction values obtained with the QPAs that samples 1 and 2 contain more significant ADP amounts than sample 4; only sample 3 did not indicate ADP contamination. Another interesting fact is the presence of small impurities of ADP in samples 3 and 4. The former does not contain ADP contamination, while the latter contains ~0.2(1) wt%. Although small, this contamination can affect the formation/detection of Mg(NH4)(PO4)(H2O) in the AMPC-B sample. Although the average crystallite sizes did not differ significantly between all samples, the increased amount of ADP contamination induces a higher microstrain in the DAP phase. The crystallite size of the AMPC-A compound is relatively smaller than that of the AMPC-B compound. Although the former contains only one phase (struvite), when looking at the microstrain, an opposite behavior to what was seen for samples 1 to 4 took place, i.e., it is smaller for the AMPC-B sample, which contains both struvite and dittmarite contributions.
B. Mean average, zeta potential, and polydispersity for AMPC compounds
The mean diameter (Z-average), the zeta potential (ζ), and the polydispersity index for AMPC samples are shown in Table III.
Mean diameter (Z-average), zeta potential, and polydispersity index of AMPC samples obtained using samples 3 and 4.

These results show that the size distribution is of the same magnitude considering the estimated standard deviations. However, the zeta potential and the polydispersity index are quite different depending on the phosphate sources employed in the synthesis of the AMPC. As synthesis A considers sample 3, which contains only ADP, while sample 4 (obtained by synthesis B), which shows a small amount of DAP contamination, one can notice a higher polydispersity index (0.78 over 0.35 respectively), indicating a severe agglomeration of the nanoparticles in solution in sample 3.
C. Energy-dispersive X-ray fluorescence for AMPC compounds
Energy-dispersive XRF measurements of AMPC samples were used to infer their chemical composition according to the results shown in Table IV.
EDX results of AMPC samples.

Based on the results shown in Table IV, it is possible to infer the chemical structures of both AMPC samples, being (NH4)4Mg5(PO4)5 or (NH4MgPO4)4 + Mg2++ PO4−3 (for the compound obtained after synthesis A, AMPC-A) and (NH4)6Mg3(PO4)4 or (NH4MgPO4)3 + 3NH4+1 + PO4−3 (for the compound obtained by synthesis B, AMPC-B). This analysis clearly shows that the final products obtained from both types of phosphates are different. Apparently, not only the PO4/Mg ratio (3.9 vs. 3.2) in the structure of AMPC, but also different polymorphic forms of ammonium magnesium phosphate seem to play a significant role in the effectiveness of AMPC as an anticancer in the action of bladder tumor (Table VII).
D. Thermogravimetry analysis (TGA)
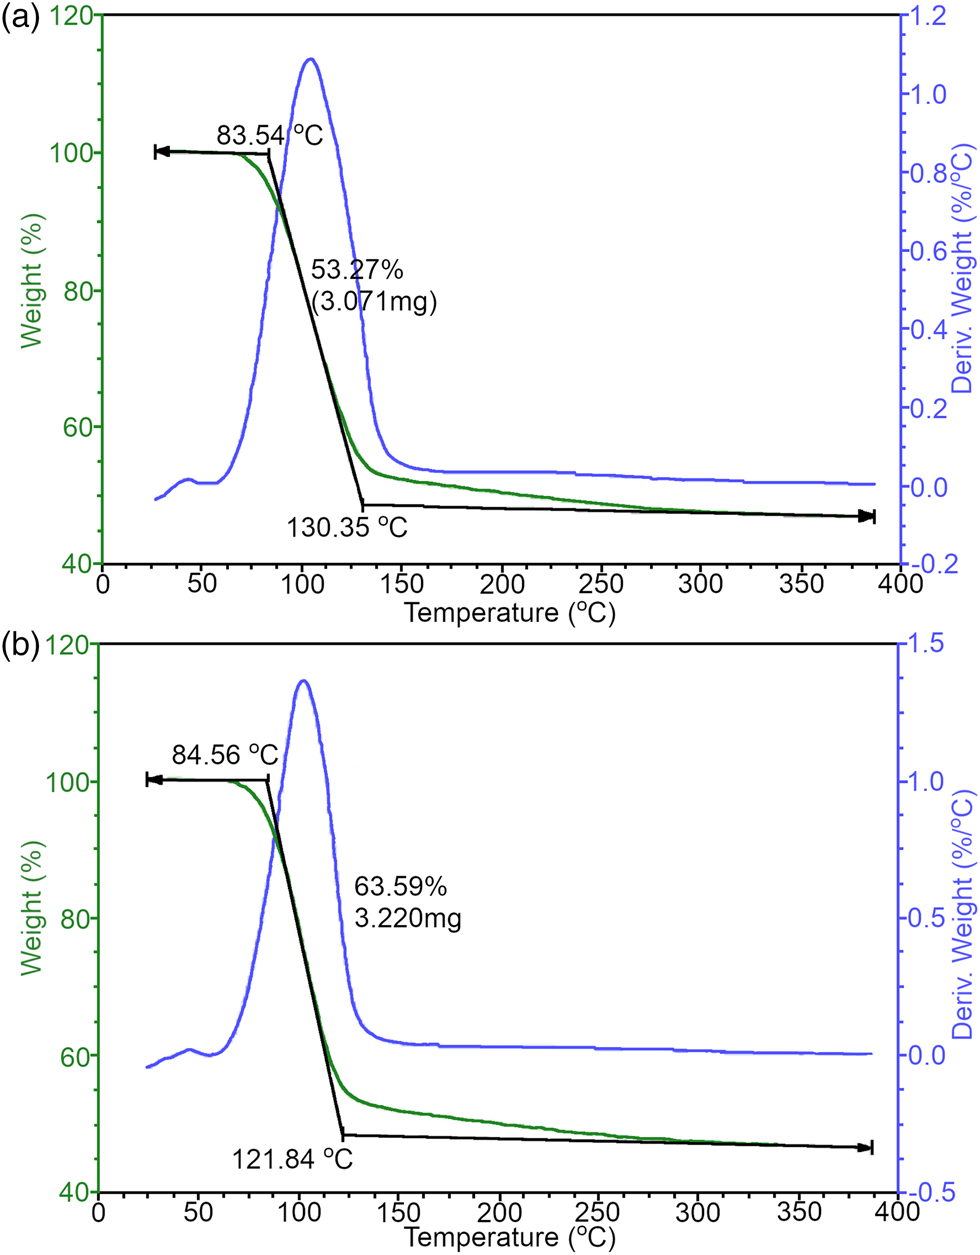
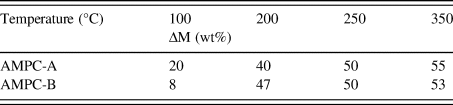
The TGA curves for the AMPC-A and AMPC-B compounds are shown in Figure 9. The mass losses are reported in Table V.
TGA curves for the (a) AMPC-A and (b) AMPC-B compounds. The green line is the sample weight, the blue line is the calculated weight loss as a function of temperature, and the black line provides the onset and completion of weight changes.

Variation of mass losses for the AMPC-A and AMPC-B compounds.

The first mass loss event (100 °C) is related to water elimination and/or ammonia. The results indicate that the thermal stability in both cases is slightly different. Again, this stability in sample 3 apparently also influences the anticancer activities of AMPC since the AMPC samples synthesized from sample 3 are more effective than sample 4 (Table VII). This can also be explained by the fact that sample 3 does not contain any contamination of DAP and shows a higher polydispersity index than sample 4.
E. Differential scanning calorimetry (DSC)
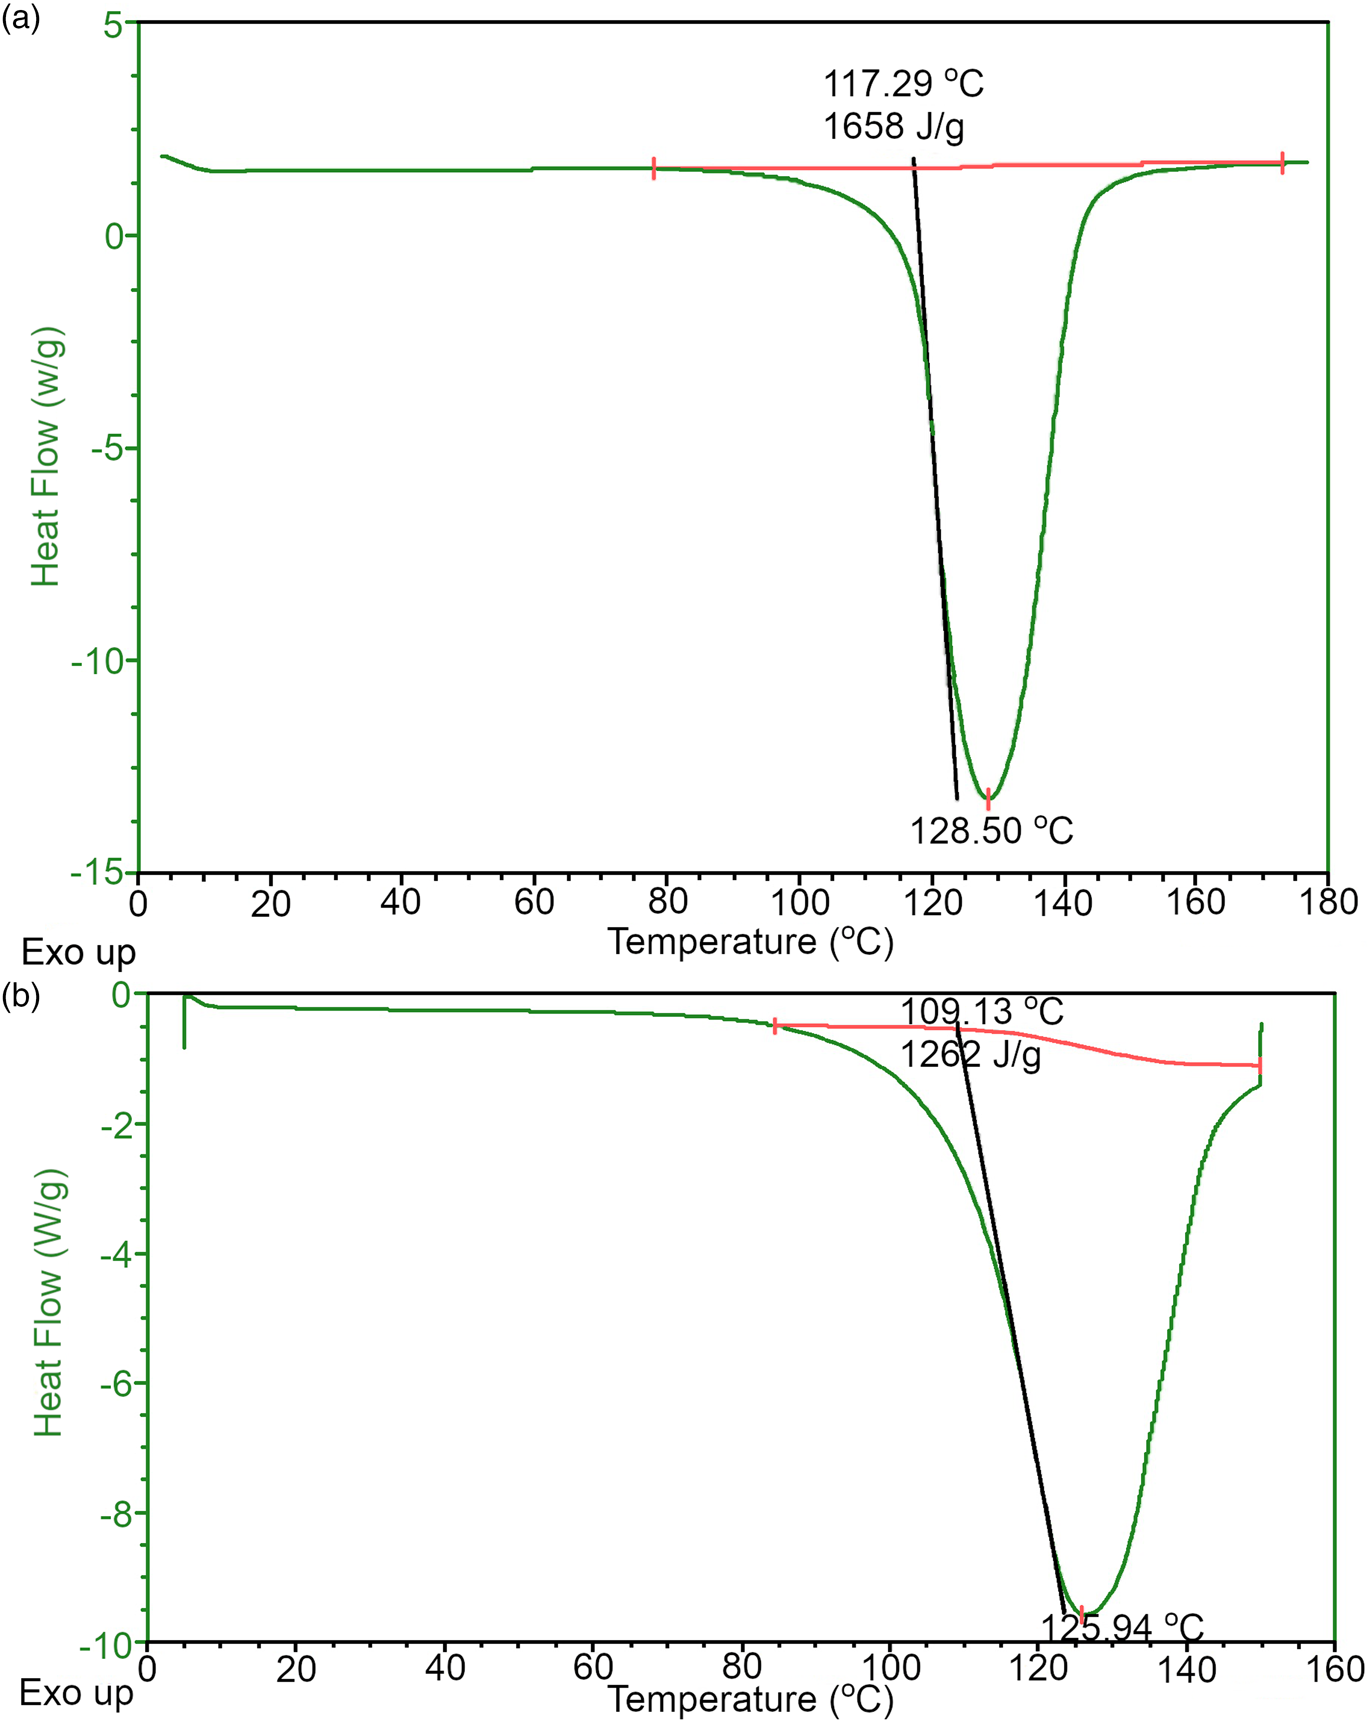
The DSC curves for the AMPC-A and AMPC-B compounds are shown in Figure 10. The onset temperature (Tonset), enthalpy variation, and melting point are shown in Table VI.
DSC curves for (a) AMPC-A and (b) AMPC-B compounds. The red line is used to calculate the Tonset, and the peak of the curve is used to calculate the melting point; with these values, the enthalpy variations (ΔHom) are calculated.

Onset temperature (Tonset), enthalpy variation (ΔHom), and melting point for the AMPC-A and AMPC-B compounds.

The DSC values show two different structures of the final phosphate. Regarding Tonset, AMPC-A is slightly more thermally stable than AMPC-B since thermal decomposition starts at a slightly higher temperature. The same was observed in Table V. Furthermore, the more significant variation in enthalpy (ΔH°m (J g−1)) means that AMPC-A is more crystalline than AMPC-B. Although not strictly connected, this higher degree of crystallinity impacts different crystallite sizes between AMPC-A and AMPC-B.
F. Scanning electron microscopy (SEM)
SEM images for samples 1 to 4 (available in the Supplementary material) did not display a significant size variation of the particles, which were as large as 200 μm, attributed to the DAP phase. The presence of much smaller particles (below 50 μm) may be possibly related to the ADP ones. Although not strictly related, the average crystallite sizes for the samples are within the estimated standard deviation (Table I).
G. Histopathological analyses
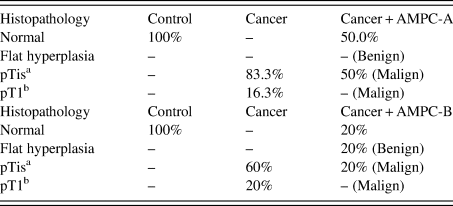
The biological activity of AMPC-A and AMPC-B was evaluated based on the effect of histopathological modifications on mice with bladder cancer with different crystal structures (Table VII). As a simplification, not all the alterations were plotted in Table VII.
Histopathological alterations in bladder cancer in mice in different experimental groups.

a Stage related to the carcinoma in situ (CIS) or “flat tumor”.
b The tumor has spread to the connective tissue (called the lamina propria) that separates the lining of the bladder from the muscles beneath, but it does not involve the bladder wall muscle.
Apparently, the different phosphate crystals used to synthesize the AMPC interfere with the final anticancer activity of the nanostructure. Probably, this could be important in terms of solubility and crystal aggregation in suspension, thus making the difference in antitumoral activities – a detailed experiment to prove this is in progress.
IV. CONCLUSION
All outcomes obtained in these analyses demonstrate the importance of specific methodology applied in the phosphate quantitative phase analysis by PXRD. Apparently, the small content of ADP impurities in DAP interferes with the final synthesis of AMPC. Some interference in the final crystallization occurred during the reaction for the AMPC formation. This is important in many pharmaceutical preparations.
Finally, this characterization was paramount in anticancer effectivity, as shown by other experiences with samples AMPC-A (obtained from sample 3) and AMPC-B (obtained from sample 4).
SUPPLEMENTARY MATERIAL
The supplementary material for this article can be found at https://doi.org/10.1017/S0885715623000167.
ACKNOWLEDGEMENTS
The authors thank the financial support provided by the Brazilian National Council for Scientific and Technological Development (CNPq proc. no. 305601/2019-9; 552120/2011-1), by the São Paulo Research Council [FAPESP grant numbers: 2018/10052-1; 2020/03419-6; 2021/03640-7], and the Coordinating for the Improvement of Higher Education Personnel [CAPES – grant number: 001].
CONFLICTS OF INTEREST
The authors declare no conflicts of interest.