

Introduction
NK cells are large granular cytotoxic lymphocytes that play a role in the innate immune response against tumour cells and virally infected cells (Vivier et al., Reference VIVIER, RAULET, MORETTA, CALIGIURI, ZITVOGEL, LANIER and UGOLINI2011). The lytic process by which NK cells kill their target cells involves recognition of target cells by effector cells and activation of the lytic machinery of the target cells, inducing apoptotic cell death. In pathogen-free chickens, these cells are thermolabile at 37°C, and they lose their functionality as the natural temperature of avian body is 41°C (Vivier et al., Reference VIVIER, RAULET, MORETTA, CALIGIURI, ZITVOGEL, LANIER and UGOLINI2011; Yoder and Litman, Reference YODER and LITMAN2011). This is in contrast to humans and rats, where NK cells are resistant to temperature manipulation for 30 or 60 minutes (Yoder and Litman, Reference YODER and LITMAN2011; Herberman et al., Reference HERBERMAN, NUNN, HOLDEN and LAVRIN1975a). These cells are resistant to treatment with anti-B or anti-T cell anti-sera (Calder et al., Reference CALDER, AITKEN, PENHALE, MCLEMAN and IRVINE1974; Sharma and Okazaki, Reference SHARMA and OKAZAKI1981). Fleischer (Reference FLEISCHER1980) reported that NK cells are adherent and phagocytic, however other studies refute these findings (Sharma and Coulson, Reference SHARMA and COULSON1979; Sharma and Okazaki, Reference SHARMA and OKAZAKI1981).
There is a wide range of cell lines that can be used as target cells for NK cell activity in both mammals and avian species (Gastpar et al., Reference GASTPAR, GEHRMANN, BAUSERO, ASEA, GROSS, SCHROEDER and MULTHOFF2005; Mandi et al., Reference MANDI, SEPRENYI, PUSZTAI and BELADI1985). Most of these are of lymphoid origin. The very first studies of avian NK cell activity were conducted using target cells from infectious bursal virus disease and Rous sarcoma virus (Sharma and Coulson, Reference SHARMA and COULSON1979; Sharma and Okazaki, Reference SHARMA and OKAZAKI1981). However, more recently, the LSCC-RP9 cell line, a retrovirus transformed B cell line, has been used because it was shown to be the most standard target susceptible to lysis by avian NK cells and could yield large number of cells of common origin in cultures (Sharma and Okazaki, Reference SHARMA and OKAZAKI1981; Mandi et al., Reference MANDI, SEPRENYI, PUSZTAI and BELADI1985). Since the LSCC-RP9 cell line is produced by infecting donor chickens with the RAV-2 virus that induces bursal lymphoma, this cell line continues to produce RAV-2 upon serial divisions (Sharma and Okazaki, Reference SHARMA and OKAZAKI1981; Mandi et al., Reference MANDI, SEPRENYI, PUSZTAI and BELADI1985; Sharma and Coulson, Reference SHARMA and COULSON1979).
Early reports in the literature on the presence of avian NK cell cytotoxicity in lymphoid cell tissues such as spleen, thymus, and blood are unclear. For example, Sharma and Okazaki (Reference SHARMA and OKAZAKI1981) reported that avian NK cells were resistant to treatment with rabbit antiserum that usually works against chicken thymocytes, although this observation excluded cytotoxicity from the conventional T-lymphocytes that is related to the thymus and develops after antigenic challenge. In agreement, it was revealed by Herberman et al. (Reference HERBERMAN, NUNN and LAVRIN1975b) that the thymus does not demonstrate NK cell cytotoxicity in nude mice. Sharma and Coulson (Reference SHARMA and COULSON1979) reported the presence of NK cytotoxicity in avian spleen, but no natural cytotoxicity in bursa, blood or thymus. Conversely, some authors reported the presence of NK cell activity in the thymus, bursa and intraepithelial lymphocytes, but with using a 16 hour incubation assay for the thymus and the bursa (Lillehoj and Chai, Reference LILLEHOJ and CHAI1988). Interestingly, it was reported that expression of NK cells in chickens was age dependent and increased as the birds get older (Sharma and Coulson, Reference SHARMA and COULSON1979; Sharma and Okazaki, Reference SHARMA and OKAZAKI1981). This age dependant response may explain the inconsistency of the results in the studies of avian NK cell activity as the experiments were done at different ages.
Immunomodulation of avian NK cell cytotoxicity has been documented for many factors. For example, Ohashi et al. (Reference OHASHI, MIKAMI, KODAMA and IZAWA1987) investigated the effect of chicken foetal antigen expressed on the cell membrane of Marek's disease lymphoblastoid cell lines on splenocyte NK activity. The authors purified this antigen by affinity chromatography using monoclonal antibody and cultured it with splenocytes of specific-pathogen-free chickens. This resulted in decreased splenocyte NK activity. Type-2 cytokines, such as transforming growth factor-β, downregulate NK cell activity (Abbas and Lichtman, 2003). Suppression of avian NK activity may be induced by restraint stress (Kushima et al., Reference KUSHIMA, FUJITA, SHIGETA, HORIUCHI, MATSUDA and FURUSAWA2003). On the other hand, the stimulation of avian NK activity was documented to be induced by thymulin hormone and cytokines such as IFN-γ (Marsh et al., Reference MARSH, MERLINO and STAEHELI2001; Merlino and Marsh, Reference MERLINO and MARSH2001; Reference MERLINO and MARSH2002), IL-2, IL-12 and IL-15 (Choi et al., Reference CHOI, LILLEHOJ, SONG and HAN1999). In addition, vaccines such as herpes virus from turkeys (HVT) against Marek's disease may enhance NK activity in chickens (Heller and Schat, Reference HELLER and SCHAT1987).
NK cell and T-lymphocyte cytotoxic activities are usually combined with each other in in vitro assays as both are characterised by cell-contact-dependent cell killing and use the same effector mechanisms, albeit triggered and regulated in different ways (Thomason et al., Reference THOMASON, ARCHER, MACKIN, STOKES and PINCHUK2014; Calder, Reference CALDER2007). In assays, the action of NK cells versus T-lymphocytes can be distinguished by altering, for example, the type of target cells or incubation time and by using immunophenotyping (Omori et al., Reference OMORI, SATO, TODA, SASAKI, ISOBE, NAKANISHI and YUKAWA2010; Thomason et al., Reference THOMASON, ARCHER, MACKIN, STOKES and PINCHUK2014; Fowles et al., Reference FOWLES, FAIRBROTHER, TRUST and KERKVLIET1997; Calder et al., Reference CALDER, YAQOOB, THIES, WALLACE and MILES2002, Betts et al., Reference BETTS, BRENCHLEY, PRICE, DE ROSA, DOUEK, ROEDERER and KOUP2003; Calder, Reference CALDER2007).
Classically, NK cell activity is detected by radioactive assays such as the 51Cr release assay. This technique has several drawbacks, especially regarding personnel health hazards related to the use of radioactive isotopes. In addition, these isotopes usually have short life spans and are not always taken up by the cells to be tested. This makes the radioactive assays unreliable in immunological protocols (Seliger et al., Reference SELIGER, SCHAERER, KOHN, PENDL, WEIGEND, KASPERS and HARTLE2012; Cerottini et al., Reference CEROTTINI, ENGERS, MACDONALD and BRUNNER1974; Vizler et al., Reference VIZLER, NAGY, KUSZ, GLAVINAS and DUDA2002).
The flow cytometric detection of NK cell activity using dual fluorescent staining of target cells is more suitable than the conventional radioactive cytotoxicity tests. This technique is sensitive, easy to perform, and reproducible to measure cell cytotoxicity in avian species. Unlike the radioactive 51Cr assays that needs about four hours incubation time, the flow cytometric analysis of NK cell activity can be evaluated after two hours of incubation (Djeu et al., Reference DJEU, HEINBAUGH, HOLDEN and HERBERMAN1979). Flow cytometric analysis of NK cell activity can be conducted for different types of effector cells such as peripheral blood mononuclear cells (PBMCs), splenocytes, and thymocytes (Xu et al., Reference XU, LI, ZHOU, GUO, LIU, ZHAO, CAO and LI2014; Herberman and Calleweart, Reference HERBERMAN and CALLEWEART1985; Lillehoj and Chai, Reference LILLEHOJ and CHAI1988; Merlino and Marsh, Reference MERLINO and MARSH2002; Vizler et al., Reference VIZLER, NAGY, KUSZ, GLAVINAS and DUDA2002).
Specificity and sensitivity of this assay have been tested by using several specific immunomodulator of NK cell activity. For example, the immunosuppressive effect of fish oil on NK cell activity is well documented in human (Yaqoob et al., Reference YAQOOB, PALA, CORTINA-BORIA, NEWSHOLME and CALDER2000; Miles et al., Reference MILES, BANERJEE, DOOPER, RABET, GRAUS and CALDER2004), rats (Jeffery et al., Reference JEFFERY, CORTINA, NEWSHOLME and CALDER1997), and chickens (Fritsche and Cassity, Reference FRITSCHE and CASSITY1992; Vizler et al., Reference VIZLER, NAGY, KUSZ, GLAVINAS and DUDA2002). In all of the experiments conducted, there is strong, repeatable correlations observed between the percentage of target lysis and the effector-to-target cell (E/T) ratios (Piriou et al., Reference PIRIOU, CHILMONCZYK, GENETET and ALBINA2000). In addition, one of the great advantages of this technique is its ability to differentiate NK cell subtypes, and it has the capacity to differentiate from other cells subtypes activities such as CD4+CD3- that have similar activity of NK cells (Piriou et al., Reference PIRIOU, CHILMONCZYK, GENETET and ALBINA2000).
Design of standard flow cytometric analysis of NK cell activity
This technique involved the following basic steps, with special reference to PBMCs as an example of effector cells:
preparation of peripheral blood leukocytes
Heparinised chicken blood was layered on to an equal volume of Lympholyte-H (Cedarlane Laboratories Ltd, USA). In addition to Lympholyte-H, several other reagents could be used to separate the PBMCs, e.g. Histopaque (Sigma-Aldrich), Ficoll Paque Plus (GE), Percoll (Sigma-Aldrich and EG). After centrifugation, the interface white layer that contained the leukocytes was collected and suspended in complete medium. The cell suspension was then layered again on Lympholyte-H and the previous step repeated to further remove red blood cells. The cells were washed and suspended in PBS (phosphate buffer saline) or complete medium and stored at 4°C. Cells in suspension were counted to ensure sufficient number for the assay. The effector cells, peripheral blood mononuclear cells (PBMCs), were re-suspended in complete medium at 5 x 10⁶ cells/ml (Reynolds et al., Reference REYNOLDS, TIMONEN and HERBERMAN1981; Fritsche and Cassity, Reference FRITSCHE and CASSITY1992; Ruggeri et al., Reference RUGGERI, CAPANNI, URBANI, PERRUCCIO, SHLOMCHIK, TOSTI, POSATI, ROGAIA, FRASSONI and AVERSA2002; Yaqoob et al., Reference YAQOOB, PALA, CORTINA-BORIA, NEWSHOLME and CALDER2000).
maintenance of target cells
The LSCC-RP9 cell line were suspended in complete medium (RPMI 1640 containing 10% foetal calf serum, 2 mM glutamine and antibiotics) and maintained in vitro at 41°C in an atmosphere containing 5% CO2. The viability of target cells should be >95% (Yaqoob et al., Reference YAQOOB, PALA, CORTINA-BORIA, NEWSHOLME and CALDER2000).
cell labelling
The target cells were labelled with 5 (6)-carboxyfluoresce-indiacetate succinimidyl ester (CFDA-SE). The cells were incubated at 41°C in an atmosphere containing 5% CO2 for 45 minutes. This incubation time may vary according to different cell types and protocols used. Wang et al. (Reference WANG, DUAN, LIU, FANG and TAN2005) reported that the optimal incubation was generally performed within five to eight minutes. These authors reported the cell death rate caused by CFDASE labelling to be below 5%. However, the incubation time used in the current protocol was 45 minutes. After incubation, the labelled LSCC-RP9 cells were washed twice with PBS and re-suspended in 1 ml complete medium. This cell suspension was further diluted 1:100 in complete medium to give a cell suspension of 5 x 10⁴ cells/ml (Mcginnes et al., Reference MCGINNES, CHAPMAN, MARKS and PENNY1986; Betts et al., Reference BETTS, BRENCHLEY, PRICE, DE ROSA, DOUEK, ROEDERER and KOUP2003; Kushima et al., Reference KUSHIMA, FUJITA, SHIGETA, HORIUCHI, MATSUDA and FURUSAWA2003) .
incubation of effector and lscc-rp9 cells
The effector cells (PBMCs) were mixed with the labelled LSCC-RP9 cells at ratios of 100:1, 50:1, 25:1 and 12.5:1, and were incubated for two hours at 41°C in an atmosphere containing 5% CO2. After incubation, a red fluorescent DNA dye (propidium iodide, PI) was added to label the target cells with permeabilised plasma membranes. The cell suspension was incubated at 4°C in the dark for 5 min and then analysed immediately by flow cytometry (Kushima et al., Reference KUSHIMA, FUJITA, SHIGETA, HORIUCHI, MATSUDA and FURUSAWA2003).
Data acquisition and flow cytometric analysis
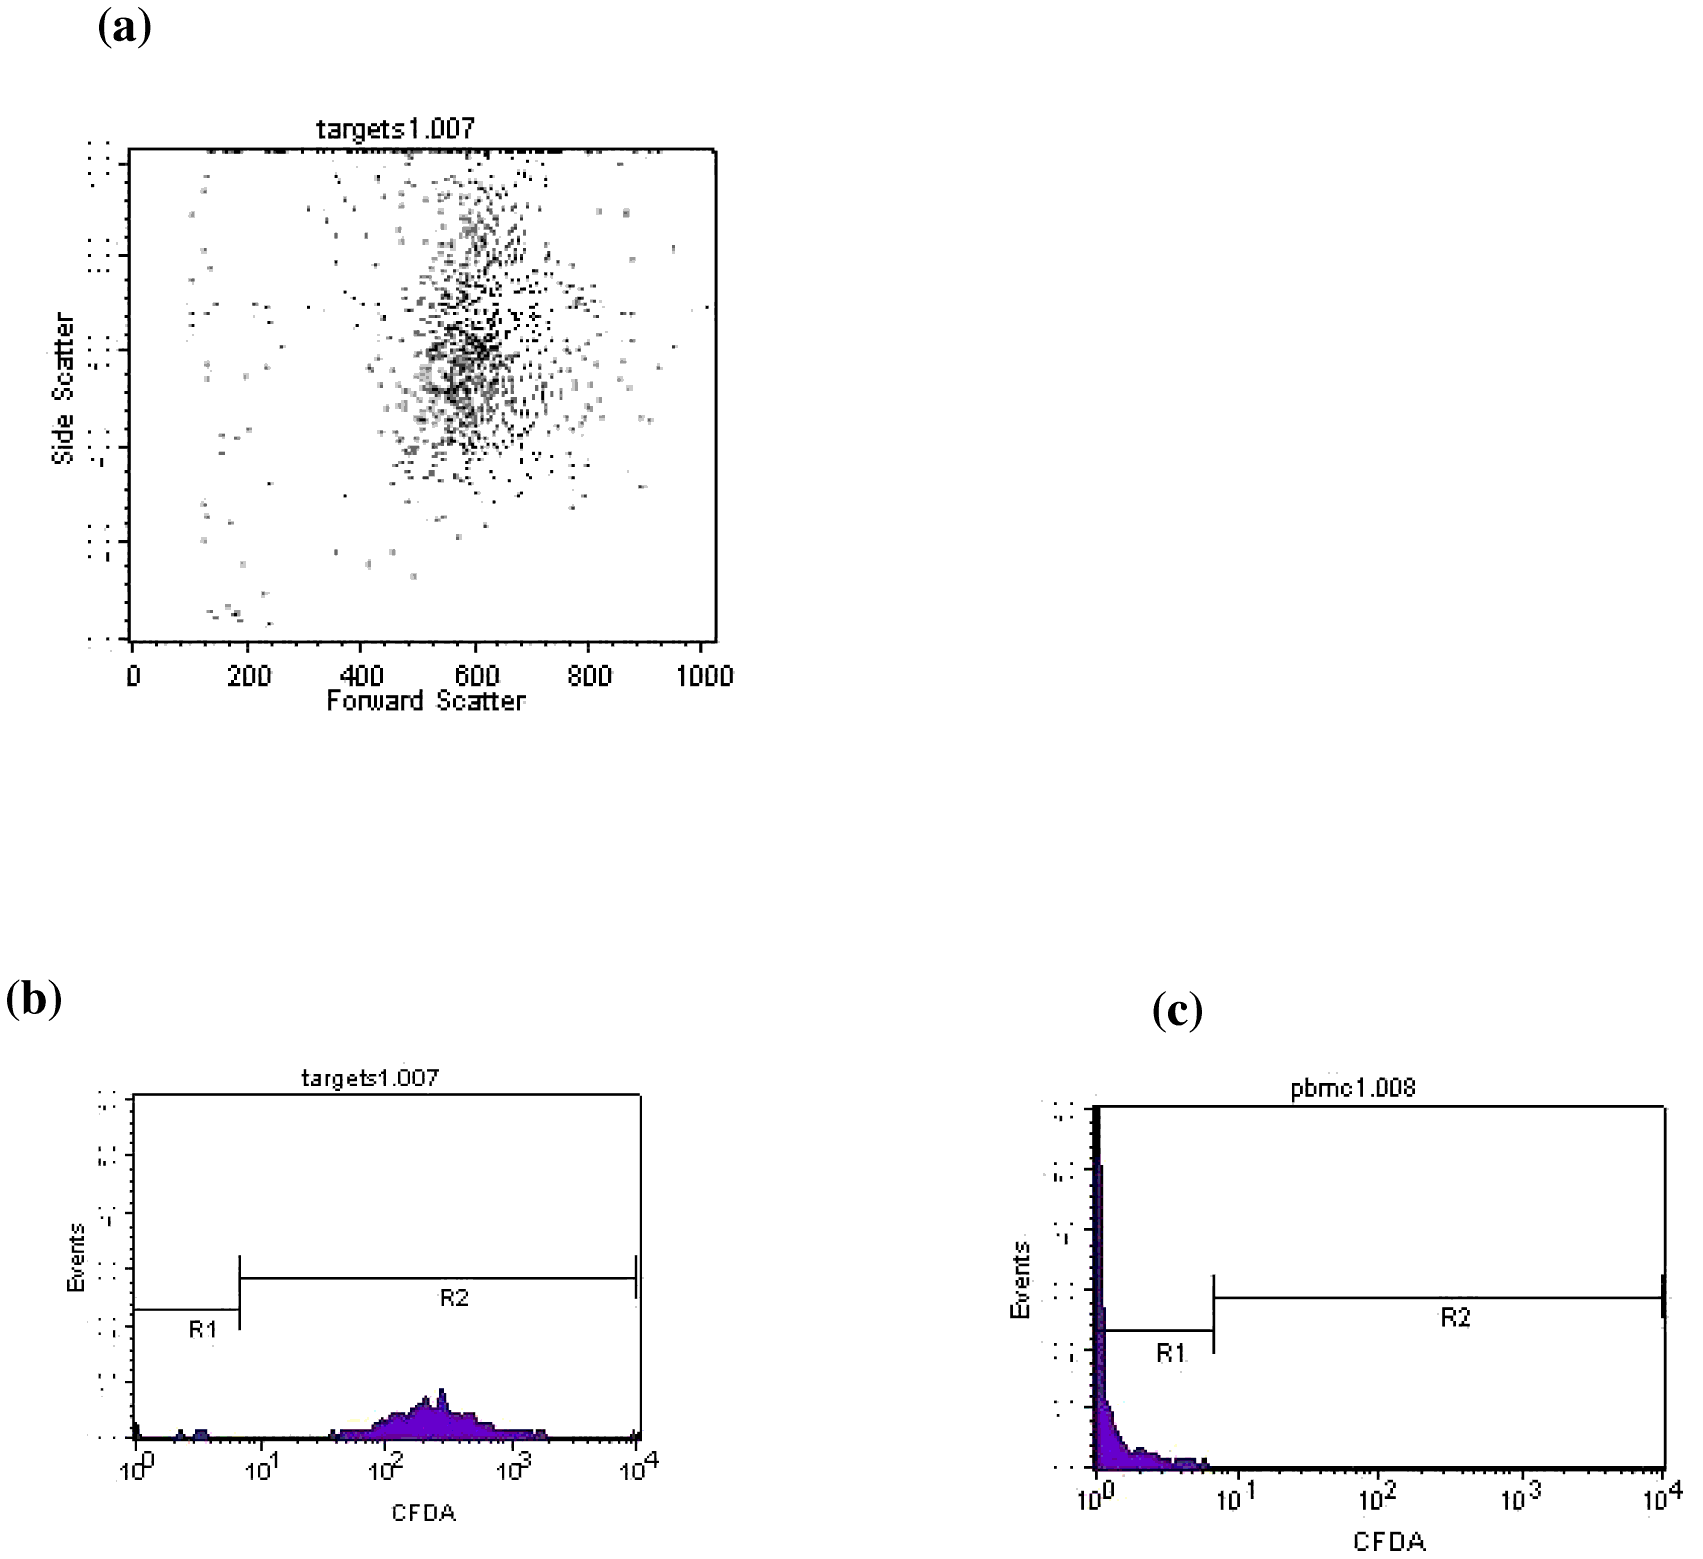
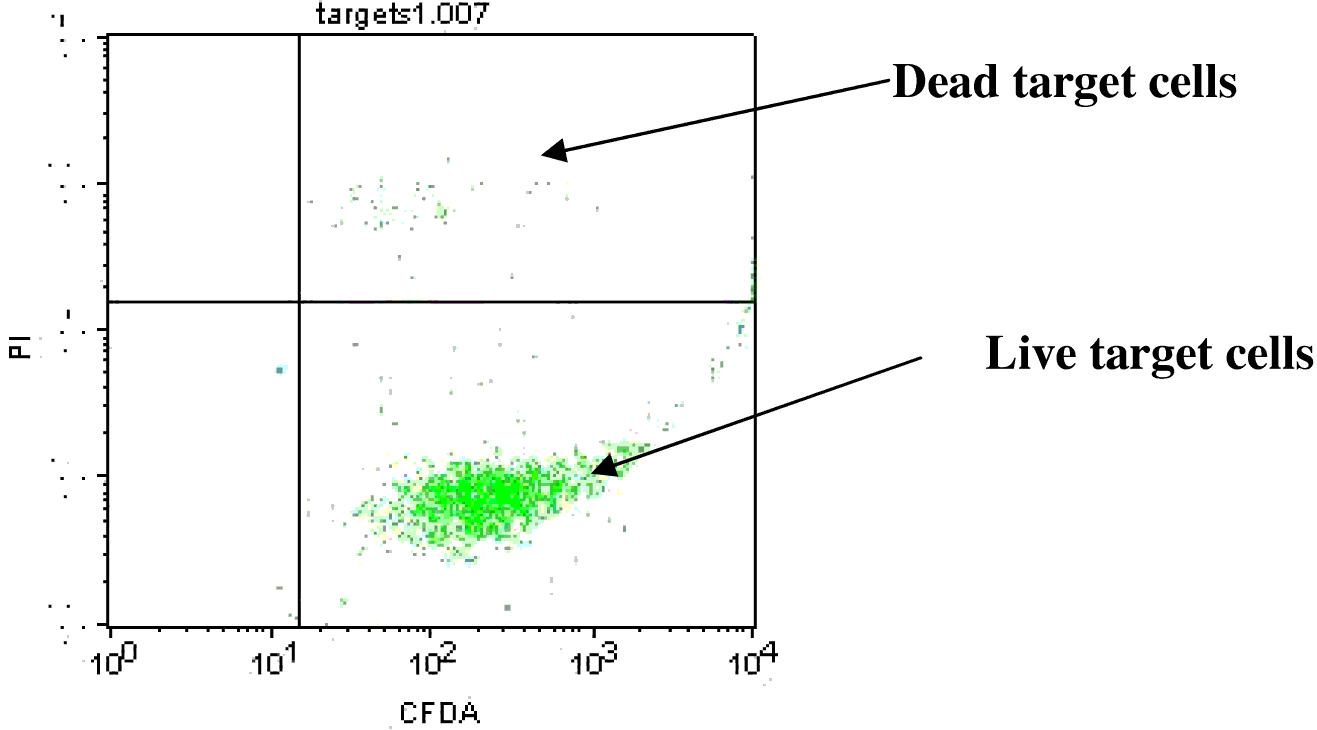
Flow cytometric analysis was carried out with a flow cytometer which had two lasers and filters for the band pass wavelengths for the green and red colours. The acquisition of these two colours occurs within specific light spectrums (i.e. 530/30 and 585/42 nm). Dual fluorescent stains were observed in the assay: the green fluorescence of 5(6)-CFDA-SE and the red fluorescence of PI. Cells staining positively for both red and green fluorescence represented the dead target cells. Cells staining positively for green fluorescence represented the live target cells. Target cells were visualised using both forward scatter/side scatter plots (Figure 1a) and fluorescence histograms (Figure 1b). An ‘R2’ region was set for green fluorescence, representing all target cells (Figure 2b). A sample of PBMC (effector cells) was run to verify the position of the R2 marker (Figure 1c). If a dot blot of CFDA (FL1) against PI (FL2) was drawn on the cells gated in R1 (represent effector cells) and a quadrant is drawn, then two other cell populations were visible, live effector cells in the lower left hand quadrant (neither red nor green) and dead effector cells in the upper left hand quadrant (stained red) (Piriou et al., Reference PIRIOU, CHILMONCZYK, GENETET and ALBINA2000, Vizler et al., Reference VIZLER, NAGY, KUSZ, GLAVINAS and DUDA2002; Miles et al., Reference MILES, BANERJEE, DOOPER, RABET, GRAUS and CALDER2004).
After discrimination between target and effector cells, a dot plot of CFDA (FL1) against PI (FL2) was constructed for the target cells gated in R2. A quadrant was drawn, whereby the dead target cells were positioned in the upper right hand quadrant (Figure 2).
Representative flow cytometric profiles of target and effector cells in the NK assay. (a) A dot plot of control target cells grouped by size (forward scatter; FCS) and granularity (side scatter; SSC). (b) FL1 histogram on the green fluorescent control target cells. (c) FL1 histogram on the green fluorescent control effector cells, to make sure that R2 was set on the right place (personal archive)

Representative dot plot of CFDA (FL1) against PI (FL2) (personal archive).
It was necessary to distinguish between dead target cells that have been killed by NK cells, from those that are dead because of apoptosis. This was determined by subtracting the percentage of dead cells in the target control sample, (in which target cells are incubated alone and then stained with PI), from the percentage of killed target cells in the test samples. Results of the assay were expressed as percentage of cytotoxicity after subtracting percentage of cytotoxicity in the control target tubes to exclude apoptotic dead cells.
To summarise, assessing NK cell activity is an important requirement to monitor and detect immune responses associated with viral infections and tumour cells abnormalities. This paper discusses flow cytometric cytotoxicity test as a convenient alternative to the classic radioactive isotope applications. It bypasses the limitations due to health hazards that is associated with classical methods. It is also reliable and reproducible to different cells of avian species such as blood, spleen, thymus and other tissues and cells which posses NK cell activity. The current assay showed a high degree of sensitivity as there was a good correlation between the percentage of target lysis and the effecter-to-target cell ratios. Reproducibility checks were usually conducted on five different occasions to ensure repeatability and reliability of this assay (Hatam et al., Reference HATAM, SCHUVAL and BONAGURA1994).
In the assay described in this paper, target cells were dually stained with green and fluorescent dye. The permeabilisation and killing of target cells were identified by using red fluorescent dye, PI. Accordingly, four cell populations were identified during the flow cytometric analysis. These cell populations included live effector, dead effectors, live target cells and dead target cells. The percentage of dead target cells represents strength of percentage NK cell activity. This provides direct monitoring of the cell cytotoxicity and death.
Conclusions
Flow cytometric assay using dual fluorescence of target cells is a highly sensitive and reproducible to measure NK cytotoxic cells of different species, including avian species. Flow cytometry has an advantage of safety and cost over the use of classical radioisotopes. It can be easily used to evaluate dead cells, and provide a method of reliably separating target and effector cell populations. Different types of cell markers can be used for determination of NK cells subtypes and expression of receptors and/or intracellular cytokines using flow cytometric analysis (Clark, 2001; Brenchley et al., Reference BRENCHLEY, KARANDIKAR, BETTS, AMBROZAK, HILL, CROTTY and KOUP2003) .
There are various applications of the flow cytometric analysis of NK cell cytotoxicity in the field of chemical, clinical and immunological studies in both human and animal species, including poultry (Partyka et al., Reference PARTYKA, NIZANSKI and LUKASZEWICZ2010; Abbas and Lichtman, 2003; Kushima et al., Reference KUSHIMA, FUJITA, SHIGETA, HORIUCHI, MATSUDA and FURUSAWA2003; Cossarizza et al., Reference COSSARIZZA, ORTOLANI, FORTI, MONTAGNANI, PAGANELLI, ZANNOTTI, MARINI, MONTI and FRANCESCHI1991; Klimas et al., Reference KLIMAS, SALVATO, MORGAN and FLETCHER1990; Hatam et al., Reference HATAM, SCHUVAL and BONAGURA1994). This assay can be applied in immunological avian studies to investigate the effect of immunomodulators on the immune system and for general health status. Monitoring NK cell activity of poultry flocks helps in surveillance programs to maintain the general health of poultry flocks and to discover any outbreaks of diseases related to abnormal ranges of NK cell activity.