


I. INTRODUCTION
Unlicensed operation on the underutilized spectrum bands has attracted a great interest in the recent years as the demand on wireless spectrum has increased. Federal Communications Commission (FCC) in the USA has led the way by developing specifications for secondary (unlicensed) utilization of the TV bands [1, 2]. Meanwhile, similar work has been carried out in Europe by the Electronic Communications Committee and Ofcom in the UK [3, 4]. The favorable signal propagation conditions, together with relatively low utilization after the digitization of the TV transmissions, make the TV bands attractive for secondary use.
Spectrum sensing has been widely considered as the key enabler for the unlicensed operation [Reference Ghasemi and Sousa5–Reference Haykin, Thomson and Reed7]. It provides protection for the licensed users and finds the unutilized frequencies for the secondary users. A typical spectrum sensor consists of an radio frequency (RF) receiver front-end followed by a signal detector that provides the information about the state of the spectrum. Typically the detection is performed in digital domain utilizing either the conventional energy detector [Reference Urkowitz8] or the cyclostationary feature detector [Reference Dandawate and Giannakis9–Reference Kosunen, Turunen, Kokkinen and Ryynänen11].
The sensitivity requirement of the sensor, i.e. the minimum received signal levels at which the primary users must be detected, turn out to be rigorous, resulting from the well-known hidden node problem [Reference Akyildiz, Lee, Vuran and Mohanty12]. Accomplishing these requirements is challenging especially in small-scale mobile devices, where the lack of high quality embedded antennas (for ultra high frequency (UHF) frequencies) and the noise emitted by the device itself deteriorates the sensitivity [Reference Kallioinen13]. Targeting the high sensitivity may increase the number of false detections on unoccupied channels via non-linearities in the receiver front-end. This limits the secondary users’ ability to utilize the white space efficiently. The experiments in [Reference Vääräkangas, Kallioinen, Pärssinen, Turunen and Ryynänen14] show that in the presence of a sufficiently strong signal on one channel, the number of false detections increase on several neighboring channels.
Prior work on the effects of receiver non-linearity on spectrum sensing has been presented by Rebeiz et al. in [Reference Rebeiz and Cabric15–Reference Rebeiz, Shahed Hagh Ghadam, Valkama and Cabric17]. They analyze the degradation in detection performance in case of both energy detection and cyclostationary feature detection for the most common single-carrier modulations. They also propose digital signal processing methods for mitigating these effects by estimating the interferer power and/or modulation type, and then by either compensating for the resulting intermodulation (IM) products prior to detection, or by adjusting the sensing time and threshold according to the level of interference.
The linearity requirements for the spectrum sensing receiver, however, have not been widely addressed in the literature. In [Reference Marshall18, Reference Mahrof, Klumperink, Haartsen and Nauta19], the linearity requirements for cognitive radio receivers are considered for the communication mode. It is proposed that the linearity requirements could be relaxed if the location of the interferers were known and the operation frequency was selected accordingly to avoid interference. However, these studies do not consider the linearity requirements from the spectrum sensing point of view, which leads to higher linearity requirements, as will be shown in this work.
In order to provide further insight on the receiver linearity requirements in spectrum sensors in cognitive radio environment, this work demonstrates the effects of the radio receiver non-linearity on the detection performance of the spectrum sensor. Theoretical background is provided to explain how the signals in the neighboring channels induce false detections via receiver second- and third-order non-linearities. The linearity requirements are then derived for the receiver front-end as a function of the desired detection sensitivity. Both energy- and cyclostationary feature detectors are considered with the orthogonal frequency-division multiplexing (OFDM)-modulated digital video broadcasting – terrestrial (DVB-T) signal as an example. Moreover, it will be shown that the existence and strength of cyclostationary features in the IM products of two OFDM signals depend on their relative symbol phase. This makes cyclostationary feature detectors more robust against false detections in the face of IM between multiple interferers. The results are verified with measurements by utilizing a radio receiver with spectrum sensing capabilities [Reference Kallioinen13].
This paper is organized as follows: Section II introduces the non-linear system model of the spectrum sensor. Section III analyses the probability of false detections for both energy and cyclostationary feature detection, and conducts the linearity requirements for the receiver front-end. Theoretical results are verified with practical measurements and the results are presented in Section IV. Finally, conclusions are given in Section V.
II. NON-LINEARITY IN THE RF RECEIVER
The model of the spectrum sensor utilized in this work is presented in Fig. 1. First, a preselect filter is applied to pass through a number of wideband channels, each of which has bandwidth B. A direct conversion receiver then transfers the channel at the local oscillator (LO) frequency down to the baseband and filters out the adjacent channels. The baseband signal is digitized and the spectrum sensing algorithms are implemented in the digital signal processing domain. Oversampling is utilized in order to enable digital filtering of the adjacent channels, which are not sufficiently attenuated by the analog filter.
The system model of the spectrum sensing receiver.

As all radio receivers, the receiver chain of Fig. 1 is not purely linear. The non-linear transfer function is typically modeled with power series as
 $${v_{out}} = {\alpha _0} + {\alpha _1}{v_{in}} + {\alpha _2}v_{in}^2 + {\alpha _3}v_{in}^3 + \ldots, $$
where α-terms are the coefficients of different orders of non-linearity. The two-tone excitation, i.e. two sinusoids at frequencies f 1 and f 2, produces a number of IM products, some of which may end up in the passband of the receiver. Especially interesting are the second-order IM product (IM2) which appears at frequency f 2 − f 1 and the third-order IM products (IM3) that are generated at frequencies 2f 2 − f 1 and 2f 2 − f 1.
The linearity performance of a receiver is determined with the well-known second- and third-order input intercept points (IIP2, IIP3), i.e.
 $${\rm IIP2} = {P_{in}} + ({P_{in}} - {P_{IM2}}) = 2{P_{in}} - {P_{IM2}},$$
and
 $${\rm IIP3} = {P_{in}} + \displaystyle{{{P_{in}} - {P_{IM3}}} \over 2} = \displaystyle{{3{P_{in}} - 2{P_{IM3}}} \over 2}.$$
Here P in is the input power of a single tone, and P IM2 and P IM3 represent the power of the IM products as referred to the input. In order to use the measured IIP2 and IIP3 in the system model, they are related to the α-coefficients through
 $${\rm iip2} = \displaystyle{{ \vert {\alpha _1} \vert} \over { \vert {\alpha _2} \vert}}, $$
and
 $${\rm iip3} = \sqrt {\displaystyle{{4 \vert {\alpha _1} \vert} \over {3 \vert {\alpha _3} \vert}}}, $$
where iip2 and iip3 are given as absolute values. It must be noted that (2) and (3) are specified for two-tones as the input, and therefore cannot be used directly for wideband signals.
Figure 2 illustrates the frequency content of the non-linear process when the two-tone excitation is replaced with two wideband signals. The second- and third-order non-linear products result from superposition of each point-frequency of the wideband signals interacting with all the others. In order to distinguish non-linear products of a single wideband signal from non-linear products of the two wideband signals, the former are designated as the self-modulation products XM2 and XM3, whereas the latter are the IM products IM2 and IM3. Both second- and third-order components have a curved shape and their bandwidths are two and three times the bandwidth of the input signal, respectively.
Self-modulation (XM) and intermodulation (IM) products of two wideband signals, S 1 and S 2, at frequencies f 1 and f 2, respectively.

From the spectrum sensing point of view, the IM and self-modulation products are a potential source for false detections. A single interfering signal that is present at the receiver input generates the self-modulation products through both the second- and third-order non-linearity. Especially, the XM2 product always falls directly down to the received channel, independent of the location of its source in frequency. As regards the XM3 product, it may affect the detection on the two channels that are adjacent to the signal itself. However, in practice also the primary transmitters leak signal energy into these adjacent channels, the maximum amount of which is typically specified by the transmit spectrum mask. Therefore, regardless the linearity of the receiver, it may not be viable to perform extremely sensitive detection on these channels if the transmitter leakage is already strong enough to generate the false detections. Hence, transmitter linearity in normal operation is also of essence not only to guarantee possible primary reception but also to avoid false detections in sensing.
The generation of the IM products IM2 and IM3, on the other hand, requires the presence of two relatively strong interferers. The location of the IM3 product depends on the location of the interferers and it falls down to the received channel if the outermost interferer is located approximately twice as far as the innermost interferer. The IM2 product typically falls out of the received band unless the interfering signals are very close to each other in frequency.
The IIP2 and IIP3 are specified for two-tone inputs, and therefore the total power of the non-linear products of wideband signals can not be calculated directly using (2) and (3). Study [Reference Li, Rabaey and Sangiovanni-Vincentelli20] shows that the total power of the wideband IM3 product is actually larger than the power of a IM3 product of two-tones with the same input power. For OFDM signals the difference is around 3–3.5 dB, depending on the subcarrier modulation and the number of subcarriers [Reference Mahrof, Klumperink, Haartsen and Nauta19]. On the other hand, total energy spans over two or three channels, and therefore only portion of it ends up inside the received bandwidth B. The difference between the power of the two-tone IM product and the part of the wideband IM product that ends up in the received channel can be obtained by simulation. As a result, (2) and (3) can be used also for wideband signals by adding the difference (Δ XM2, Δ XM3, Δ IM2, or Δ IM3) to P IM2 and P IM3. The wideband effect and the bandwidth limitation tend to cancel each others out, and therefore the typical values of the Δ-factors are small.
III. SENSING IM PRODUCTS
The main objectives of spectrum sensing are to detect (and thus protect) the signals of the primary systems and to provide a predetermined (low) false alarm rate on unoccupied channels. The sensitivity (S) specification of the spectrum sensor denotes the minimum power level of the received signal where the signal must be detected with sufficient probability. The hidden node problem [Reference Akyildiz, Lee, Vuran and Mohanty12] and other factors of uncertainty in the signal propagation conditions typically result in very high sensitivity requirements for the spectrum sensor. For example, the FCC requires that the Advanced Television Systems Committee (ATSC) signals are detected from as low as −114 dBm from the 6 MHz channel using a 0 dBi antenna [1]. In Europe, Ofcom has proposed −120 dBm as the sensing threshold for the DVB-T signal in the 8 MHz channel [4]. These requirements translate into approximately −8 and −15 dB in signal-to-noise ratio (SNR), respectively. In addition, some margin has to be included for the losses in the antenna and for the noise that is generated by the receiver, as illustrated in Table 1. It is clear that the sensing receiver has to operate deep in the negative SNR regime, and therefore has to rely heavily on the gain that is available from the signal processing.
SNR budget for the detector.

A) False detections in energy detection
Let us consider a simple energy detector that measures the total energy on the received channel. The power of the IM2 and IM3 products that fall on that channel can be solved from (2) and (3) as a function of the power of the interferer and the linearity of the receiver as
 $${P_{XM2}} = 2{P_{in}} - IIP2 + {\Delta _{XM2}},$$
 $${P_{IM3}} = 3{P_{in}} - 2^{\ast}IIP3 + {\Delta _{IM3}}.$$
Here, the Δ-factors are included to compensate for the wideband effect and to represent the proportion of the power that falls down to the received channel (as discussed in Section II).
In order to avoid the false detections, the power of the IM products has to be smaller than the sensitivity of the spectrum sensor. This is basically analogous to the interference scenarios in the traditional cellular receivers with the exception that the sensitivity level in this case is substantially lower. The minimum IIP2 and IIP3 can be written as
 $$IIP{2_{min}} = 2{P_{in}} - {S_{pfa}} + {\Delta _{XM2}},$$
 $$IIP{3_{min}} = (3{P_{in}} - {S_{pfa}} + {\Delta _{IM3}})/2.$$
Here, S pfa is the detector sensitivity level that produces the desired (small) amount of false detections, and is lower than the sensitivity level S that is required for the primary user protection.
Figure 3 presents the required IIP2 and IIP3 as a function of the power of the interfering signal. Because exact values of the Δ-factors are dependent on the signal characteristics and are typically quite small, they are neglected in this plot. In order to prevent a −30 dBm signal from generating false detections in a detector with S pfa = −120 dBm, the IIP2 and IIP3 of the receiver must be better than 60 and 15 dBm, respectively. The −30 dBm level that is used in this example can be justified by the results in [4]. The study shows that the received signal strength of DVB-T transmission in UK is greater than −30 dBm in approximately 15% of the studied locations. The field measurement conducted in Finland [Reference Vääräkangas, Kallioinen, Pärssinen, Turunen and Ryynänen14] also show similar signal power levels.
The required linearity (IIP2 & IIP3) as a function of the power of the interferer for various detector sensitivity (S) levels.

Previous discussion shows that the linearity requirements are stringent, and that is due to the high sensitivity that is required of the detector. Depending on the actual interfering signal power levels, the resulting IIP2 requirements are tough for the state-of-the-art wideband receivers, but not impossible [Reference Pärssinen21, Reference Fujian, Pui-In and Martins22]. The IIP3 requirements may be out of reach at present, but on the other hand the probability of having two sufficiently strong interferers with proper relative frequency offset may be small enough to allow some relaxation in the IIP3 specification. Nevertheless, the energy detector is prone to non-linearity in the receiver front-end, which generates false detections, and thus prevents the secondary user from utilizing the white space efficiently.
B) False detections in cyclostationary feature detection
The cyclostationary feature detection is based on estimation of the conjugate cyclic autocorrelation function (CCAF) [Reference Dandawate and Giannakis9]
 $${\hat R_{xx^{\ast}}}(\alpha, \tau ) = \displaystyle{1 \over N}\sum\limits_{n = 0}^{N - 1} x[n]{x^{\ast}}[n - \tau ]{e^{ - j2\pi \alpha n}},$$
where x[n] is the complex-valued input signal, α is the cyclic frequency, τ is the autocorrelation delay, and N is the number of received samples. If the cyclostationary feature exists, then the expectation of the CCAF is non-zero for some values of α and τ. For OFDM signals, one source of cyclostationarity is the cyclic prefix (CP) in front of each OFDM symbol. If the length of the fast Fourier transform (FFT) that is used to generate the OFDM symbol is N FFT and the length of the CP is N CP , then the cyclostationary feature exists with delays τ = ±N FFT at cyclic frequencies α = ±n/(N FFT + N CP ), where n = 1, 2, 3…. When the signal is not present, and the received channel contains only additive white Gaussian noise, then the expected value of the CCAF is zero for all non-zero cyclic frequencies. A constant false alarm test can be designed to test whether the cyclostationary feature is present or not [Reference Dandawate and Giannakis9].
The detection of the non-linear products requires, in addition to the sufficient power level, that the non-linear products contain the same features as the original signal. In order to understand why the features are preserved in the non-linear process, let us first consider the expected value of the autocorrelation sequence in (10) for an OFDM signal x 1. This can be expressed as
 $$\langle {x_1}[n]x_1^{\ast} [n - \tau ]\rangle = \left\{ {\matrix{ {\langle {x_1}[n]x_1^{\ast} [n]\rangle,} & {{x_1}[n] \in CP} \cr {0,} & {{x_1}[n] \notin CP.} \cr}} \right.$$
The expected value is non-zero only for signal samples that are part of the cyclic prefix, which are multiplied with the delayed conjugate copies of themselves. The expected value is zero for the signal samples outside the CP because the subsequent samples are statistically independent. In a continuous stream of OFDM symbols the non-zero portion repeats periodically and enables the detection as illustrated in Fig. 4.
Two OFDM signals in different phase and the expected values of the autocorrelation sequences.

The second- and third-order self-modulation products of x
1 consist of terms of the form
 $x_1^2 $
and
 $x_1^3 $
, respectivelyFootnote
1
. The non-linear process is time-invariant, and therefore two signal samples that have the same value but are separated in time will be equal also after the non-linear process. Therefore, the periodicity of the autocorrelation sequence, and thus the cyclostationary feature, is preserved through the self-modulation process.
Next, let us consider the IM2 products of two OFDM signals x 1 and x 2. It is assumed that x 1 and x 2 share the same signal structure, but the their samples are independent from each other. It follows that if both x 1[n] = x 1[n − τ] and x 2[n] = x 2[n − τ] for some n, then also x 1 x 2[n] = x 1 x 2[n − τ] for that n. If the CP's of x 1 and x 2 are aligned in time, i.e. the signals are in the same phase, then the previous conditions holds for all samples that are part of the CP's of x 1 and x 2. As a consequence, the expectation of the autocorrelation sequence of x 1 x 2 has the same form as that of x 1 and x 2. However, if there is a phase shift between the two signals, then x 1 x 2[n] equals x 1 x 2[n − τ] only for n that belongs to the intersection of the two CPs as illustrated in Fig. 4.
In case of partially overlapping CPs, the periodicity, and thus the cyclic frequency, is still the same, but the width of the non-zero portion is reduced. This reduces the probability of detection because the strength of the feature depends on the proportion of the correlating and non-correlating parts of the autocorrelation sequence. The feature is lost when the phase offset exceeds the length of the CP as illustrated in Fig. 5. However, the false detections reappear at offsets around the OFDM symbol length and its multiples due to the periodicity of the signal structure in a constant stream of OFDM symbols.
Normalized factor for probability of detection of an IM product of two OFDM signals as a function of phase offset.

In summary, the non-linear products of a single OFDM signal (XM2, XM3) always contain the same cyclostationary feature that originates from the CP. This is also true for the IM products (IM2, IM3) of two similar OFDM signals when the CPs overlap in time. In the latter case, the probability of detection is highest when the two signals are in phase, and drops to zero when the offset exceeds the length of the CP. Let us approximate that inside this region, the probability of detection changes linearly as a function of the phase offset. Furthermore, let us assume that phase offset is random and uniformly distributed over the length of the OFDM symbolFootnote 2 . With these assumptions, the average probability of false detection is reduced by a factor σ that is obtained by integrating over one OFDM symbol in Fig. 5
 $$\sigma = \displaystyle{1 \over {1 + {N_{FFT}}/{N_{CP}}}}.$$
For typical ratios 4 and 8 for N FFT /N CP , the σ is 0.20 and 0.11, correspondingly. The cyclostationary feature detector is therefore more robust against IM2 and IM3 products than the energy detector, for which the mutual phase of the two signals does not affect the probability of false detections.
IV. EXPERIMENTAL RESULTS
The theoretical results were verified in measurements with a cyclostationary feature detector and DVB-T signals. The spectrum sensor platform, shown in Fig. 6, contains a commercial direct-conversion RF receiver for the UHF band. The received signal is sampled with a high-speed analog-to-digital converter (ADC) with programmable sampling rate up to 80 million samples per second (MSPS). This allows oversampling with ratio of 4 with respect to the real baseband sample rate, and therefore enables the use of digital decimation in order to improve the attenuation of the adjacent channels. The decimator, the detector logic, and controls for the front-end chips were implemented on an field-programmable gate array (FPGA). A personal computer (PC) running Matlab was used to control the spectrum sensor in laboratory measurements. Anritsu MG3700a vector signal generator was utilized to generate the RF signal to the antenna connector.
The spectrum sensor hardware consists of commercial RF front-ends, high-speed analog-to-digital (AD) converters and an FPGA for digital signal processing.

A) Spectrum sensor performance
The performance of the spectrum sensor was measured in an electromagnetic (EM)-shielded laboratory room. The signal under detection is an OFDM signal, which is similar to what is employed in DVB-T systems. The signal properties are summarized in Table 2. The entire system was also modeled in Matlab, including the non-linearity in the receiver (as presented in Fig. 1), and the simulation results are provided for comparison.
OFDM signal parameters.

The probability of detection was evaluated on the UHF channel #47 (682 MHz). Detection time was set to 57 ms and the probability of detection was calculated from 500 consecutive detections. The detection was made from the cycle frequency α = 1/(8192 + 1024) with the autocorrelation delay τ = 8192. The detector threshold was set to yield the constant false alarm rate of 5%Footnote 3 . Both measured and simulated probability of detection are presented in Fig. 7. The measurement shows that S 90% is reached when the received signal power is −114.5 dBm, which is almost 10 dB below the thermal noise floor. The simulation utilized a noiseless receiver, explaining the gap between measured and simulated curves. The difference in SNR is approximately 5 dB, which is reasonably close to the measured 4.5 dB noise figure (NF) of the receiver.
Measured probability of detection of a DVB-T signal with 57 ms detection time and 5% false alarm rate.

In addition, the linearity of the receiver was measured and the resulting IIP2 and IIP3 were used in the subsequent simulations. The IIP2 of the receiver is 33 dBm, when measured with two carriers at an offset of three channels. The IIP3 is −10 dBm, when the carriers are placed approximately three and six channels away. The performance of the spectrum sensor is summarized in Table 3.
The performance summary of the spectrum sensor.

Finally, the frequency response of the receiver at the output of the ADC was measured and is presented with the solid line in Fig. 8. Because the detector can pick up the signal from as low as −120 dBm, the adjacent channels must be attenuated adequately to prevent false detections as a result of aliasing. For example, in order to reject adjacent channel signals up to −30 dBm, the required attenuation would be in the order of 90 dB. This is achieved with the combination of oversampling and decimation. The overall frequency response that includes the simulated frequency response of the digital decimator is presented with the dashed line in Fig. 8. The attenuation on the fourth and fifth adjacent channels around the 36 MHz offset is still limited as the aliasing occurs already in the ADC.
Measured frequency responses at the output of the ADC and after the digital decimator.

B) The false detections due to a single interferer
The following measurement illustrates the false detections due to a IM2 product. The probability of false detection is measured as a function of the power of an interferer that is located on channel #50, i.e. three channels away from the detector. Inserting the measured IIP2 of 33 dBm, simulated Δ XM2 of −0.7 dB, and P XM2 equal to the detector sensitivity S 90% = −114.5 dBm into (6) lets us expect that the IM2 product yields the 90% probability of false detection when the interferer power equals −40.4 dBm. The measured probability of false detection is presented in Fig. 9 and it matches with both the theoretical and simulated results.
Measured false detections on channel #47 as a function of the power of the interferer on channel #50.

The false detections due to the second-order non-linearity compromise the performance of the spectrum sensor especially because the effect is independent of the absolute frequency of the interferer. The spectral distance, over which the interferer may induce the false alarms, is limited only by the bandwidth of the receiver. In other words, in this case a single interfering signal with power greater than −40 dBm would cause 100% false alarm rate on all channels in its vicinity.
The effect of single interferer degrading the sensing performance over multiple channels is illustrated in the next measurement. The interfering signal is now located on channel #47 and the detector sweeps channels #48–57. Figure 10 presents the probability of false detection on the 10 channels for four signal power levels. In case of signal power of −65 dBm, all the adjacent channels are correctly identified as unoccupied most of the time. Only the first adjacent channel, i.e. #48, is showing slightly higher amount of false detections than the 5% theoretical false alarm rate. As the signal power is increased to −55 dBm, the false alarm rate at the channel #48 increases to 100%, while all the other channels still produce correct result. Increasing the signal power further to −45 dBm starts to increase the amount of false alarms on all the other channels as well. Channel #51 shows higher probability of false detection than its neighboring channels due to inadequate filtering as expected. Finally, when the signal power is increased to −40 dBm, the detections from all channels yield a 100% false alarm rate, and the spectrum sensor fails to find any white space although none of the observed channels are truly occupied.
Measured probability of false detection on 10 unoccupied channels, when interferer is on channel #47.

The IIP2 of the utilized receiver is not that great and modern wideband RF integrated circuits (RFICs) can perform better than this. However, as can be seen from Fig. 3, a 20 dB increase in IIP2 improves the blocker tolerance only by 10 dB. This would shift the curves in Fig. 9 to the right by 10 dB. In order to prevent any false detections from blockers up to −30 dBm, an IIP2 of 65 dBm is required.
C) The effect of the phase offset between two interferers
Next, the false detections due to IM3 product of two OFDM signals is considered. Two signals with identical OFDM symbol structure, but independently generated data symbols, are placed on channels #50 and 53 and the false detections due to the IM3 product at channel #47 are observed. The expected interferer power level from (7) for 90% probability of false detection is −45.5 dBm (Δ IM3 = 1.7 dB). The simulation results presented in Fig. 11 match well with the calculation. This shows that the cyclostationary feature exists in the IM3 product and that the strength of the feature is practically the same than in the original signal.
Probability of false detection on channel #47 when two interferers are on channels #50 and53.
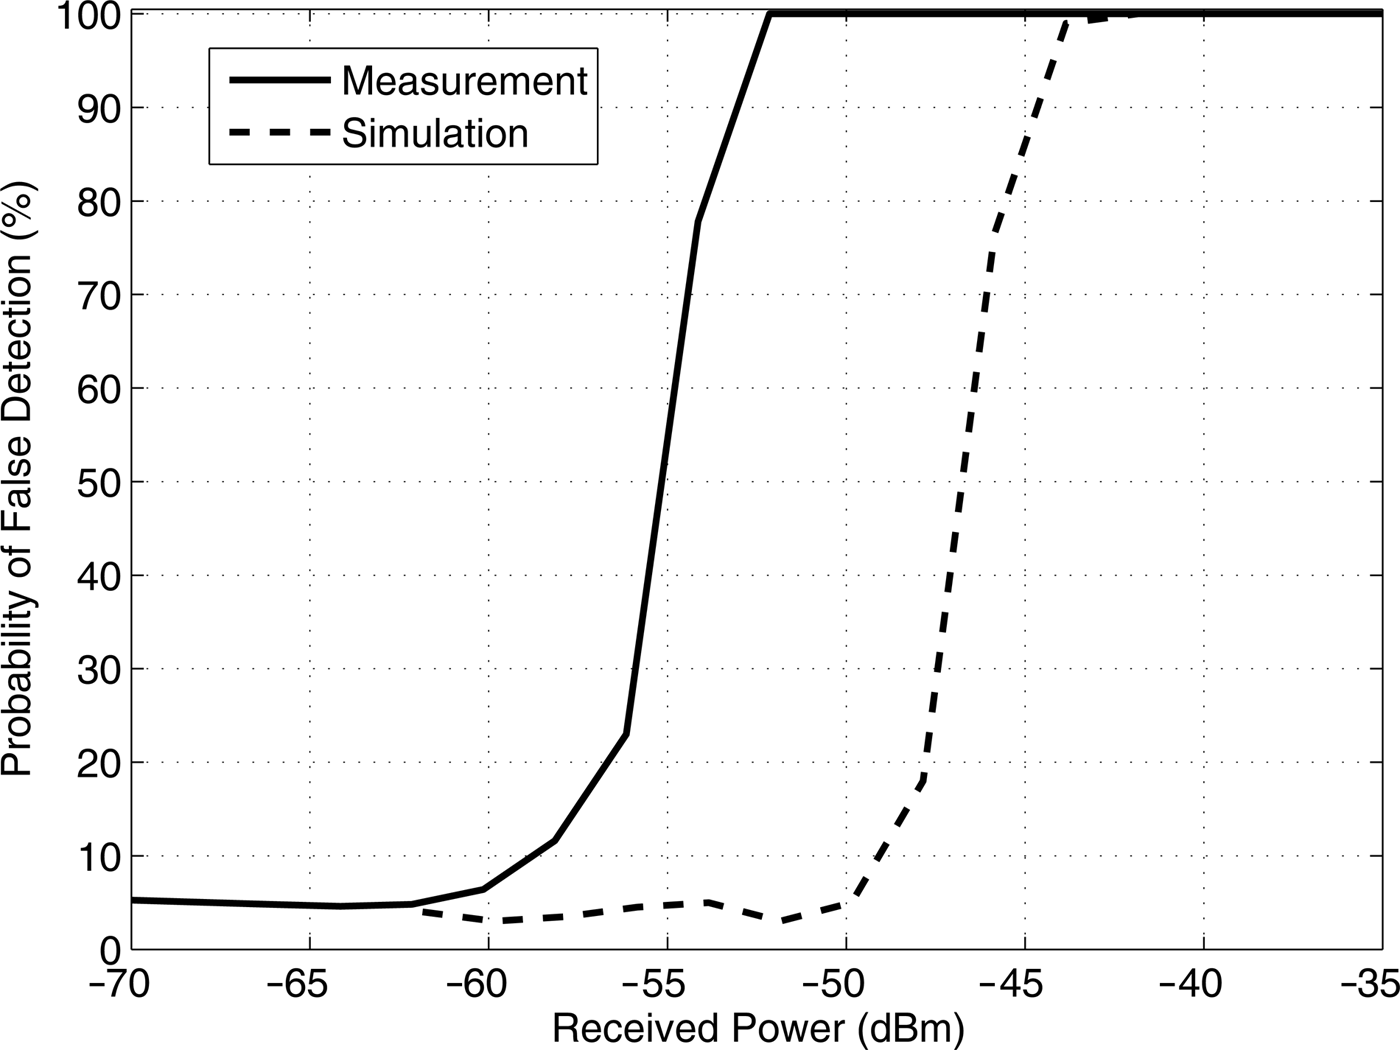
The false detections were discovered also in a practical measurement, but in this case they appear at lower received power levels than expected. This is partly because the IIP3 is measured using two tones and in a practical receiver the effective IIP3 in case of two wideband signals may not be as high. On the other hand, there are limitations in the measurement setup that may also affect the accuracy of the measurement. In order to be able to control the relative baseband phase of the two signals, a dual-channel vector signal generator was employed to produce the two 8 MHz signals with 24 MHz frequency offset. As a result, the spectrum of the output signal is not quite ideal and may, together with the limitations of the practical receiver, affect the measurement result.
Nevertheless, by altering the phase offset between the two signals, it can be shown that the false detections are a result of the IM between the two signals. For this measurement the power of both signals is fixed to −53 dBm to yield 90% probability of false detection. Figure 12 shows the measured false detections as a function of the phase offset between the two interferers. The phase offset is normalized to the OFDM symbol length. Starting from the zero offset, the false detections start to decrease as the phase offset increases, and reach the statistical probability of false alarm when the offset exceeds the length of the cyclic prefix, i.e. 1024/(8192 + 1024) = 0.11. The false detections reappear at offsets around multiples of the OFDM symbol length. This shows that the cyclostationary feature is preserved as long as the cyclic prefixes of the two interferers overlap, and the relative strength of the feature depends on the amount of the overlap.
Measured probability of false detection due to IM3 product of two interferers as a function of the phase offset between the two signals.

The requirement that the two signals must be roughly in the same phase makes the cyclostationary detector less prone to false detections from IM3 products. This, together with the original assumption that the two interferers must exist with high enough power and proper frequency offset, reduces the overall probability of false detections. Consequently, some relaxation can be allowed in the IIP3 specification, which would be otherwise practically impossible to achieve.
V. CONCLUSION
In this paper we have analyzed the effects of receiver non-linearity on the performance of the most commonly utilized signal detectors in cognitive radio systems. The analysis covers both self-modulation products of a single OFDM signal and IM products of two OFDM signals, and also their contribution to the probability of false detections. As a result, the the derivation of the linearity requirements for the spectrum sensing receiver in the cognitive radios is introduced. The derived results were verified with measurements, demonstrating the influence of the non-linearities in a typical cyclostationary spectrum sensor. The presented linearity requirements, that result from high sensitivity of the spectrum sensor, exceed normal reception conditions and are not trivial for the state-of-the art technology. The IIP2 requirement is strict in a sense that even a single interferer compromises the white space on all other channels via second order non-linearity. The requirement for the IIP3, on the other hand, may be relaxed especially when the cyclostationary feature detector is employed. This is because the false detections via third-order non-linearity occur mainly in the presence of two relatively strong interferers and only on limited number of channels. Moreover, in case of the cyclostationary feature detector, these false detections occur only if the interfering OFDM signals are roughly in the same phase. Therefore, the cyclostationary feature detectors are superior to energy detectors in the face of IM products from multiple interferers.
 Vesa Turunen was born in Uusikaupunki, Finland, in 1982. He received his M.Sc. (Tech) degree in Microelectronic Circuit Design from the Department of Electrical and Communications Engineering, Helsinki University of Technology, Espoo, Finland, in 2007. He is presently pursuing a D.Sc.(Tech) degree at the School of Electrical Engineering, Aalto University, Espoo, Finland. His interests are in the design and implementation of DSP algorithms and digital circuits for RF transceivers.
 Marko Kosunen received his M.Sc., L.Sc., and D.Sc. (with honors) degrees from Helsinki University of Technology, Espoo, Finland, in 1998, 2001, and 2006, respectively. He is presently a Senior Researcher at Aalto University, Department of Micro and Nanosciences. His expertise is in implementation of the wireless transceiver DSP algorithms and communication circuits. He is presently working on implementations of cognitive radio spectrum sensors, digital intensive transceiver circuits, and medical sensor electronics.
 Sami Kallioinen was born in Hollola, Finland, in 1972. He received his M.Sc. degree in Electrical Engineering from the Helsinki University of Technology (HUT), Finland, in 2001. From 1997 to 1999, he was with Micronas, where he focused on IC design tools. From 1999 to 2011, he was at Nokia Research Center, where he worked as a Senior Researcher. From 2011 to 2014, he has been with Renesas Mobile and Broadcom as a Senior RFIC Engineer. Presently he is working at Nokia Technologies with sensor systems as a Senior Engineer. His research interests include RF converters, and analog and mixed-mode integrated circuits for multi-standard wireless communication systems such as the cognitive radio, and also analog front-ends of sensor ICs.
 Aarno Pärssinen received his D.Sc. degree from the Helsinki University of Technology, Finland, in 2000. From 2000 to 2011 he was with Nokia Research Center, Helsinki, Finland where he served as a member of Nokia CEO Technology Council from 2009 to 2011. From 2011 to 2013, he was at Renesas Mobile Corporation and then joined Broadcom as part of business acquisition until September 2014. Since September 2014 he has been with University of Oulu, Centre for Wireless Communications, Finland where he is presently a Professor. His research interests include wireless systems and transceiver architectures for wireless communications. Aarno Pärssinen has authored and co-authored one book, one chapter of a book, more than 50 international journal and conference papers and holds several patents. He serves as a member of the technical program committee of International Solid-State Circuits Conference since 2007 and he is presently the chair of the wireless subcommittee.
 Jussi Ryynänen was born in Ilmajoki, Finland, in 1973. He received his M.Sc. and Doctor of Science degrees in Electrical Engineering from the Helsinki University of Technology (HUT), Helsinki, Finland, in 1998, and 2004, respectively. He is presently a Professor in the Department of Micro- and Nanosciences, Aalto University School of Electrical Engineering. His main research interests are on integrated transceiver circuits for wireless applications. He has authored or coauthored over 100 refereed journal and conference papers in the areas of analog and RF circuit design. He holds several patents on RF circuits. He is presently a member of the technical program committee of the IEEE International Solid-State Circuits Conference and IEEE European Solid-State Circuits Conference.



