Introduction
Al–5.8Cu–0.3Mn–0.2Mg alloy (hereinafter referred to as Al–Cu–Mn alloy) has been widely used in aerospace, military, transportation, and other fields due to its low density, high strength, high toughness, and good weldability [Reference Kai, Tian, Wang and Chen1, Reference Bai, Qiu, Xue, Zhang and Jiang2]. The Al–Cu–Mn alloy is a heat-treatable reinforced aluminum alloy [Reference Hu, Baskes, Stan and Chen3, Reference Li and Chen4]. The nanoscale θ′ precipitates which can effectively hinder the dislocations motion are the main strengthening phases of the Al–Cu-based alloys [Reference Yang, Gao, Zhang, Nie and Liu5, Reference Bourgeois, Dwyer, Weyland, Nie and Muddle6]. However, at high temperatures, the nanoscale θ′ precipitates will be significantly coarsened, resulting in a significant decrease in the strength of the Al–Cu–Mn alloy, thereby limiting the application of Al–Cu–Mn alloy at high temperatures [Reference Muratoğlu and Aksoy7, Reference Yao, Xia, Qiu and Jiang8, Reference Tian, Zhao, Zhang, Qiu and Jiang9]. Therefore, many scholars pay more attention to the improvement in the high-temperature tensile properties of Al–Cu-based alloys.
Since ceramic particles are generally stable at high temperature, the introduction of ceramic particles, such as TiC [Reference Tian, Zhao, Zhang, Qiu and Jiang9], SiC [Reference Zhang, Qiu, Wang and Jiang10], ZrB2 [Reference Kai, Zhao, Wang, Wang and Mao11], and TiB2 [Reference Du, Gao, Wu, Lü and Zhou12], etc., has been proved to be an effective strategy for improving the elevated temperature properties of the Al–Cu-based alloys. However, the ceramic particles are easily aggregate, and the wettability of the aluminum melt to the ceramic particles is poor, which makes the preparation of ceramic particle reinforced Al–Cu-based composite difficult.
Adding alloying elements such as Ge [Reference Ringer, Prasad and Quan13], Ce [Reference Xiao, Wang, Ding and Yang14], Sc [Reference Yang, Zhang, Shao, Wang, Cao, Zhang, Liu, Chen and Sun15], and Ag [Reference Xiao, Pan, Lu, He, Li and Liang16] to the aluminum melt to form some high-temperature stable intermetallic compounds is another way to improve the high-temperature properties of the alloy. This method overcomes the problems of poor dispersibility and wettability of the ceramic particles in aluminum melt. Grain refinement can refine the θ′ precipitates, so it can also improve the high-temperature strength to some extent. But it cannot be used as the main strengthening mechanism at high temperatures [Reference Wang, Gao, Zhang, Nie and Liu17].
In this paper, we desire to find some other effective alloying elements to improve the high-temperature properties of the Al–Cu–Mn alloy. It has been reported that Mo was added as a microalloying element to the Al–Mn [Reference Liu, Ma and Chen18] and Al–Si [Reference Farkoosh, Chen and Pekguleryuz19, Reference Shaha, Czerwinski, Kasprzak, Friedman and Chen20]-based alloys to improve the high-temperature properties of these alloys. The reasons for strengthening were summarized as follows: the low diffusivity of Mo in Al made it difficult to coarsen the Mo-containing precipitates at high temperatures; the Mo-containing precipitates could prevent the coarsening of the other reinforcement phases at high temperatures.
It has been proved that the Al–Zr alloys can be used at high temperatures for the following reasons: the solid solubility of Zr in Al matrix is very low, so the Zr-containing precipitates can precipitate in the process of aging of dilute Al–Zr alloys; the low diffusivity of Zr in the aluminum matrix makes the L12-Al3Zr precipitates that are coherent with α-Al very stable up to 748 K [Reference Knipling, Dunand and Seidman21]. Adding a spot of Zr to the aluminum alloys can also resist the recrystallization of the deformed aluminum alloys [Reference Knipling, Dunand and Seidman22]. However, the Al3Zr precipitates tend to segregate during solidification, resulting in the formation of the precipitates free zone (PFZ) and the decrease in its resistance to recrystallization [Reference Robson and Prangnell23]. Aiming at these shortcomings, researchers added a small amount of Y to the Al–Zr alloy. The results indicated that Y can significantly accelerate the precipitation of L12-Al3Zr and form Al3(Zr, Y) precipitates, thereby increasing the number density of precipitates [Reference Zhang, Gao, Kuai, Han, Wang, Sun, Gu and You24, Reference Gao, Feng, Wang, Gu, Zhang, Wang and Sun25]. Furthermore, the primary Al3Zr particles can also act as the heterogeneous substrates of α-Al to refine the aluminum alloys [Reference Wang, Qiu, Liu, Taylor, Easton and Zhang26].
The above analyses show that Mo, Zr, and Y have the potential to improve the high-temperature properties of the aluminum alloys. Thus, in this study, we added Mo, Zr, and Y to the Al–Cu–Mn alloy to improve its high-temperature strength. The microstructure changes of the Al–Cu–Mn alloy after adding Mo, Zr, and Y microalloying elements were studied, and the strengthening mechanisms were analyzed in detail.
Results
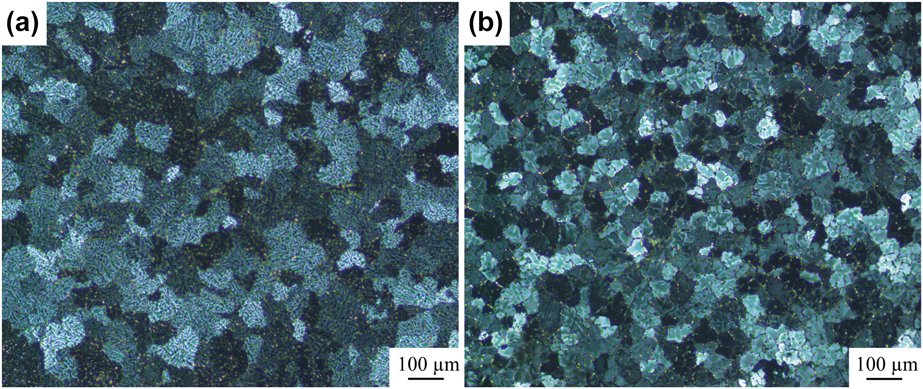
The microstructures of the as-cast alloys are shown in Fig. 1. It can be seen that compared with Fig. 1(a), the average grain size in Fig. 1(b) decreased from ∼100 to ∼58 µm. It has been proved that Mo has no effect on the grain size of aluminum alloys [Reference Liu, Ma and Chen18]. The content of Zr in alloy 2# (Al–Cu–Mn–0.2 wt% Mo–0.3 wt% Zr–0.2 wt% Y) is higher than its maximum solubility in aluminum, so the primary Al3Zr can form during solidification to refine grains [Reference Wang, Qiu, Liu, Taylor, Easton and Zhang26]. In addition, in aluminum alloy, the equilibrium partition coefficient (k 0 ≈ 0.02) and solubility of Y are very small, so in the process of solidification, the Y atoms will segregate in front of solid–liquid interface, resulting in the increase in the concentration fluctuation and constitutional undercooling [Reference Okamoto27, Reference Zhang, Gu, Tian, Gao, Wang and Sun28]. Therefore, the addition of Y element can decrease the dendritic arm spacing. When constitutional undercooling is large enough to stimulate nucleation, the grains will grow into equiaxed crystals rather than dendrites. So Y also can refine aluminum alloys to some extent [Reference Li, Wang, Wei and Zhu29].
Microstructures of the as-cast (a) Al–Cu–Mn (alloy 1#) and (b) Al–Cu–Mn–0.2 wt% Mo–0.3 wt% Zr–0.2 wt% Y (alloy 2#).
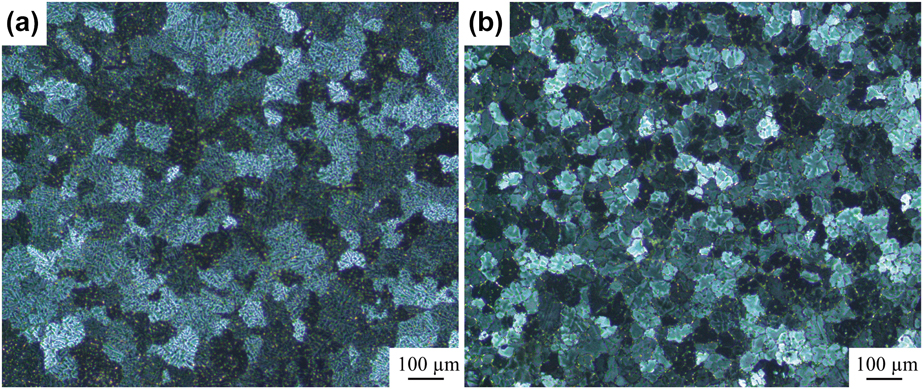
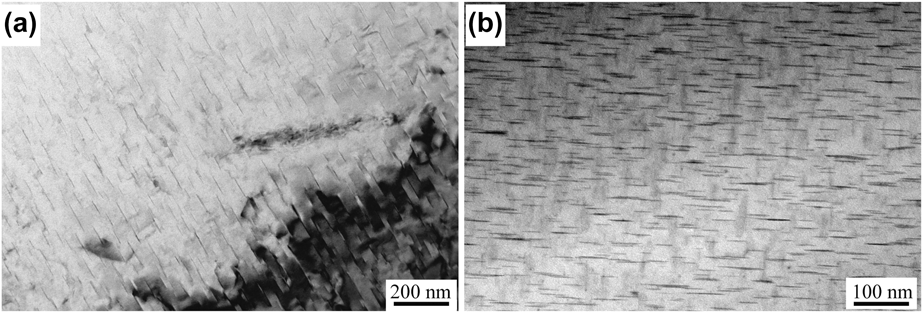
Figure 2 is the transmission electron microscope (TEM) images of the second phase particles in the T6-alloy 1# and T6-alloy 2#. Compared with Fig. 2(a), the average size of the θ′ precipitates in Fig. 2(b) decreases from ∼82 to ∼57 nm, and the number density of the θ′ precipitates is larger. In addition, the interparticle spacing in Fig. 2(b) is smaller than that in Fig. 2(a). It indicates that the addition of Mo, Zr, and Y can refine the strengthening phases and increase their number density, which is beneficial to the mechanical properties of the material [Reference Yao, Xia, Qiu and Jiang8, Reference Nie and Muddle30].
TEM images of θ′ precipitates in (a) T6-alloy 1# and (b) T6-alloy 2#.

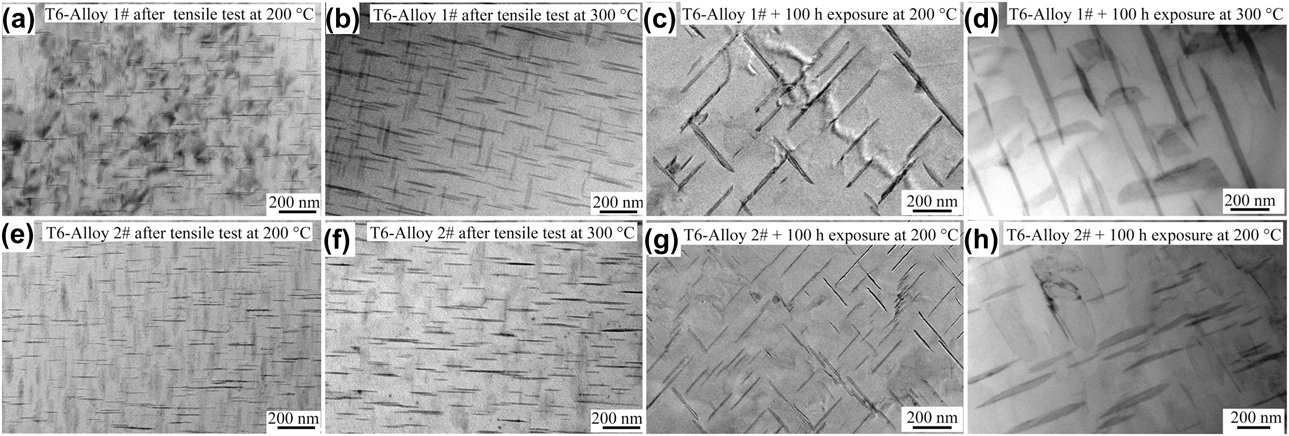
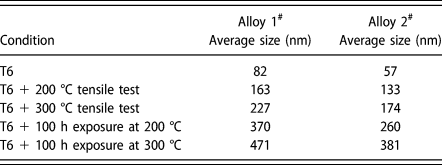
Figure 3 shows the TEM images of alloy 1# and alloy 2# at different conditions. The average sizes of θ′ precipitates at each condition are listed at Table I. Compared with T6-alloy 1# and T6-alloy 2# [Figs. 2(a) and 2(b)], the θ′ precipitates coarsen after high-temperature tensile tests or long-time exposure at high temperatures. While, at the same condition, the coarsening rates of θ′ precipitates in alloy 2# are slower than that in alloy 1#. The diffusion rate of the Cu atoms at high temperatures is higher than that at room temperature, so the θ′ precipitates coarsen at high temperatures. In addition, the applied stress can increase dislocation density, and the diffusion activation energy at the lattice defect is lower than that in the interior of the grains, so the applied stress can accelerate the diffusion of the Cu atoms, especially at high temperatures. Therefore, the average size of precipitates increases.
TEM images of θ′ precipitates in (a) T6-alloy 1# after tensile test at 200 °C, (b) T6-alloy 1# after tensile test at 300 °C, (c) T6-alloy 1# after 100 h exposure at 200 °C, (d) T6-alloy 1# after 100 h exposure at 300 °C, (e) T6-alloy 2# after tensile test at 200 °C (f) T6-alloy 2# after tensile test at 300 °C, (g) T6-alloy 2# after 100 h exposure at 200 °C, and (h) T6-alloy 2# after 100 h exposure at 300 °C.

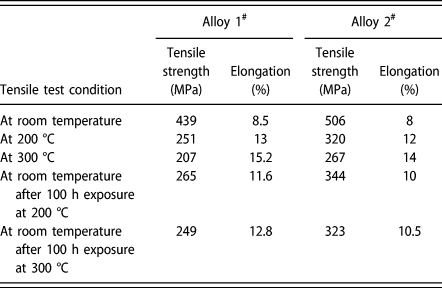
Average sizes of θ′ precipitates at each condition.

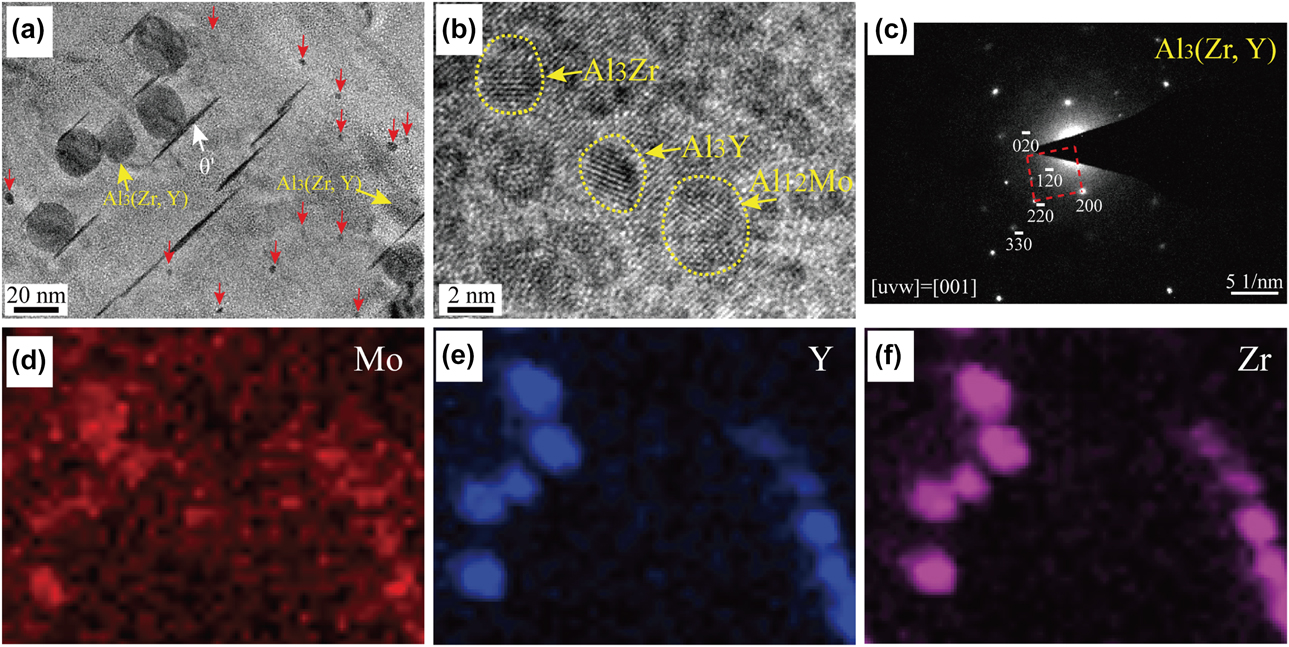
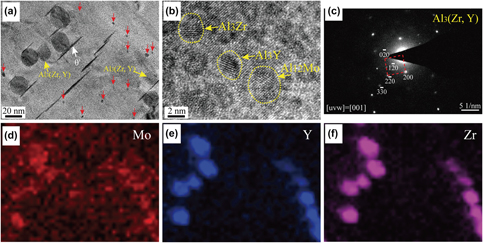
To investigate the existential state of Mo, Zr, and Y in the Al–Cu–Mn alloy, the TEM and high-resolution transmission electron microscope (HRTEM) images of T6-alloy 2# and the corresponding energy-dispersive spectroscopy (EDS) image mapping of Mo, Y, and Zr are shown in Fig. 4. Figure 4(c) is the selected area electron diffraction (SAED) pattern of the bigger globular precipitate, and the super-lattice spots corresponding to L12 precipitates are observed. Based on the EDS image mapping, SAED pattern, and the literatures [Reference Zhang, Gao, Kuai, Han, Wang, Sun, Gu and You24, Reference Gao, Feng, Wang, Gu, Zhang, Wang and Sun25, Reference Zhang, Gu, Tian, Gao, Wang and Sun28], it can be confirmed that these globular precipitates are L12-Al3(Zr, Y). In Fig. 4(a), it can be seen that in addition to the L12-Al3(Zr, Y) precipitates, there are some other precipitates with a diameter of 3–5 nm (marked with red arrows). Figure 4(b) shows the HRTEM image of the nanoprecipitates in T6-alloy 2#. The analysis results indicate that these nanoprecipitates are Al3Zr, Al3Y, and Al12Mo. It has been proved that at the initial stage of aging, the metastable L12-Al3Zr can precipitate. However, they can convert to stable D023-Al3Zr with time lapsing or at high temperatures [Reference Saha, Todorova and Zwanziger31, Reference Kikuchi, Yamazaki and Otsuka32, Reference Duan, Sun, Peng and Zhou33]. In this paper, most of Al3Zr and Al3Y in this paper are stable D023 and D019 structures rather than metastable L12 structure. Because the L12-Al3(Zr, Y) is more stable than L12-Al3Zr, some of the Al3(Zr, Y) phases still exist with L12 structure [Reference Zhang, Gao, Kuai, Han, Wang, Sun, Gu and You24, Reference Gao, Feng, Wang, Gu, Zhang, Wang and Sun25].
(a) TEM image of T6-alloy 2#, (b) HRTEM image of T6-alloy 2#, (c) SAED pattern of L12-Al3(Zr, Y), EDS image mapping of (d) Mo, (e) Y, and (f) Zr corresponding to (a).

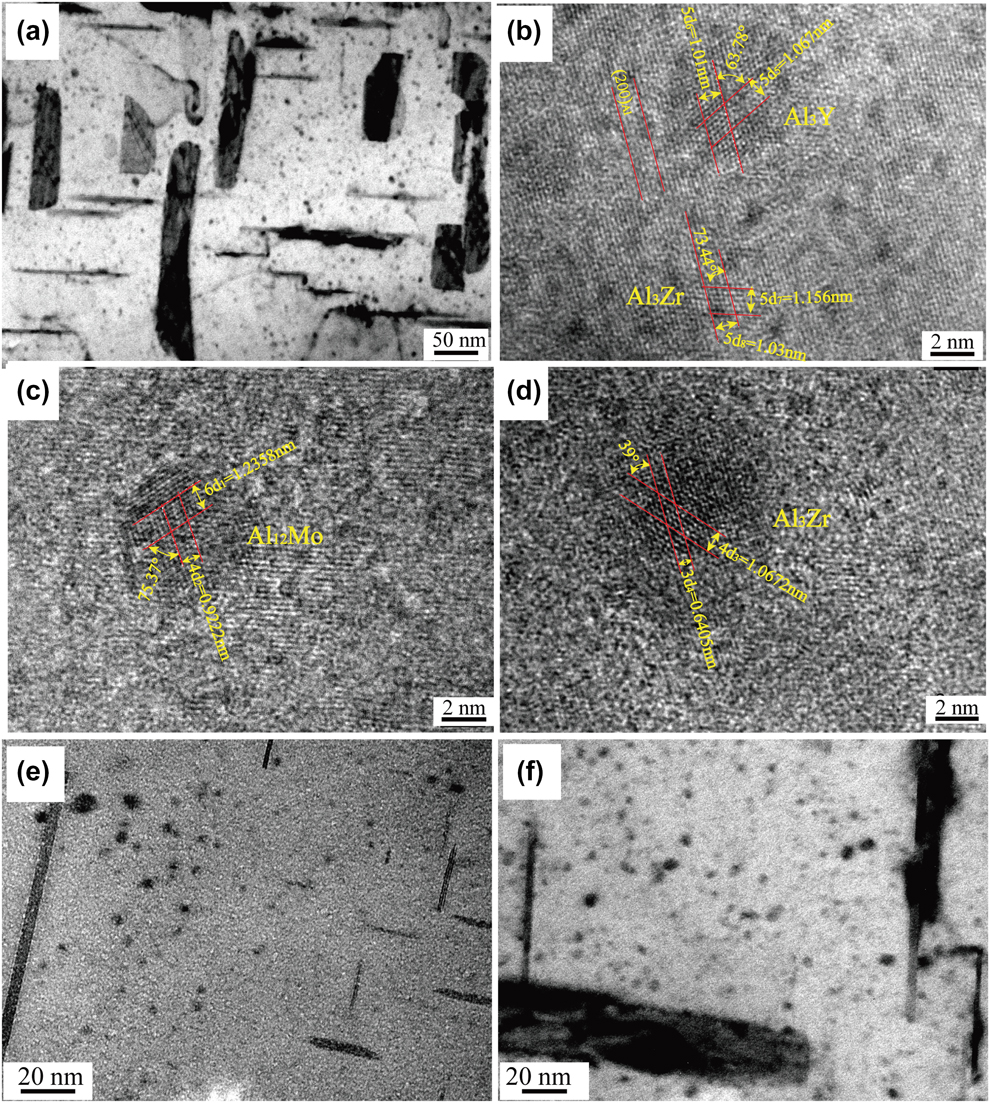
For the purpose of researching the stability of Mo-, Zr-, and Y-containing precipitates at 200 and 300 °C, the TEM images of the precipitates in alloy 2# at different conditions are shown in Fig. 5. In Figs. 5(a), it can be seen that after 100 h exposure at 200 °C, there are still many ∼5nm precipitates in the α-Al matrix. Figures 5(b)–5(d) are the HRTEM images of the nanoprecipitates. The analysis results indicate that these nanoprecipitates are Al12Mo, Al3Zr, and Al3Y precipitates. The HRTEM images show that these precipitates form coherent interfaces with α-Al, so the elastic strain fields can form around these precipitates. The elastic strain fields can interact with the dislocations to hinder the motion of dislocations.
(a) TEM image of the precipitates in alloy 2# after 100 h exposure at 200 °C, (b, c, and d) HRTEM images of the nanoprecipitates in (a), (e) TEM images of alloy 2# after tensile test at 300 °C, and (f) TEM images of alloy 2# after 100 h exposure at 300 °C.
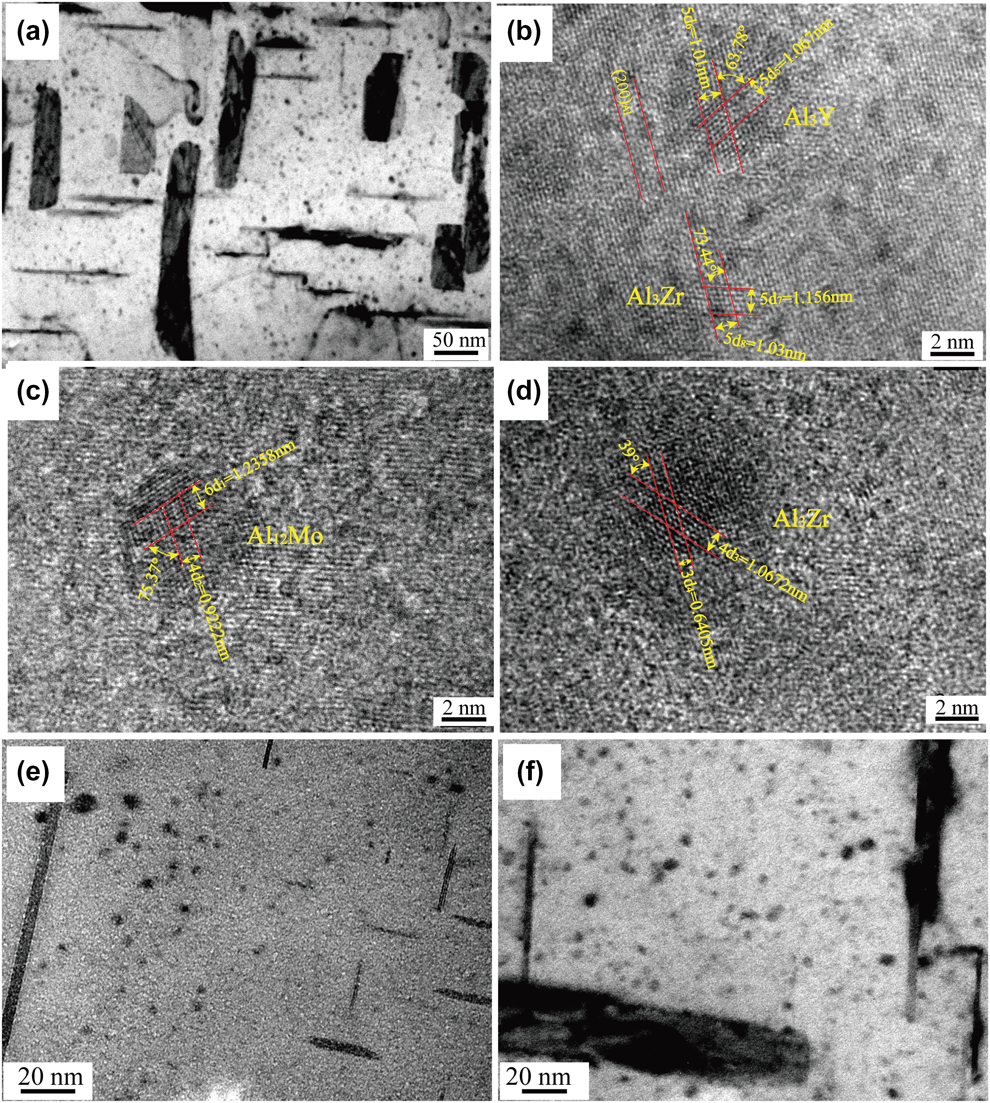
It can be noticed that compared with Fig. 4, the sizes of the Mo-, Zr-, and Y-containing precipitates did not grow significantly after long-time exposure at 200 °C. It is reported that the diffusivities of Mo and Zr in aluminum are 3.68 × 10⁻³¹ m2/s and 1.37 × 10⁻²⁸ m2/s at 200 °C, respectively [Reference van Chi, Bergner, Kedves and Beke34, Reference Mondol, Kashyap, Kumar and Chattopadhyay35]. The diffusion data of Y in aluminum has not been reported; however, Y and Sc are in the same group in the periodic table, so it can be speculated that they have the similar diffusivity [Reference Zhang, Gao, Kuai, Han, Wang, Sun, Gu and You24, Reference Fujikawa36, Reference Knipling, Dunand and Seidman37]. It is reported that at 200 °C, the diffusivity of Sc in aluminum is 4.16 × 10⁻²³ m2/s [Reference Mondol, Kashyap, Kumar and Chattopadhyay35], so it can be speculated that the diffusivity of Y in aluminum is also very low at 200 °C. The low diffusivity of Mo, Zr, and Y elements in aluminum makes it difficult to grow precipitates. Therefore, although the alloy 2# was kept at 200 °C for very long time, the sizes of Mo-, Zr-, and Y-containing precipitates did not change much.
Figures 5(e) and 5(f) shows the TEM images of Mo-, Zr-, and Y-containing precipitates in alloy 2# after tensile test at 300 °C and 100 h exposure at 300 °C. Compared with Figs. 4 and 5(a), there is no significant change in the size of the precipitate, indicating that the precipitate is still stable at 300 °C.
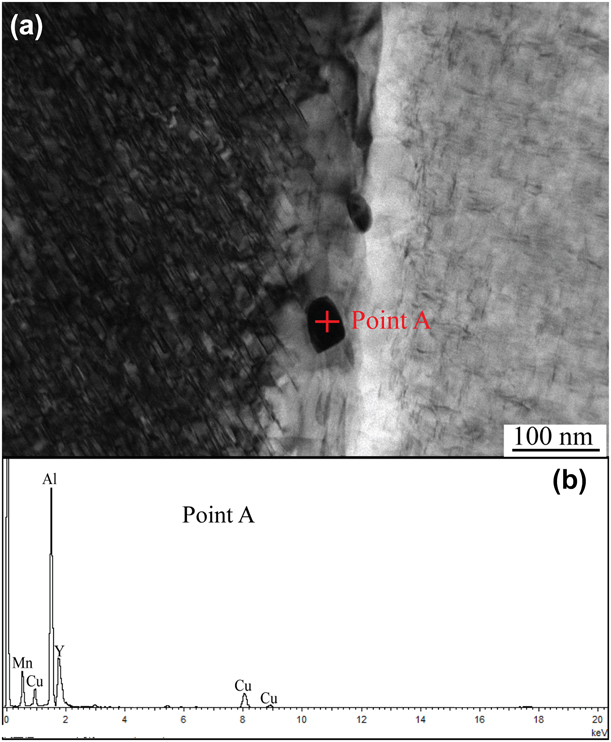
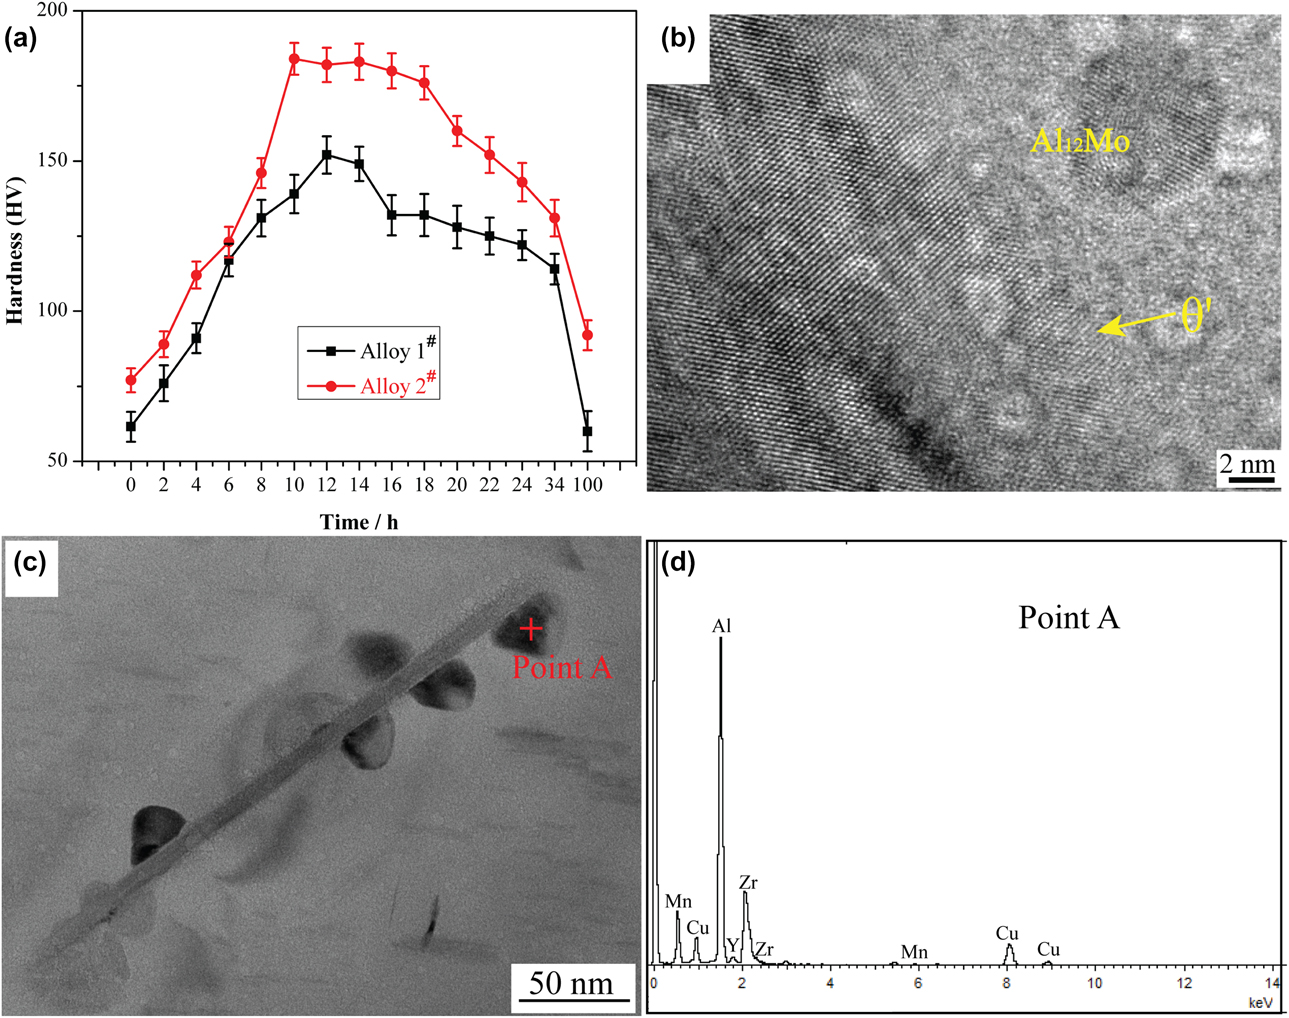
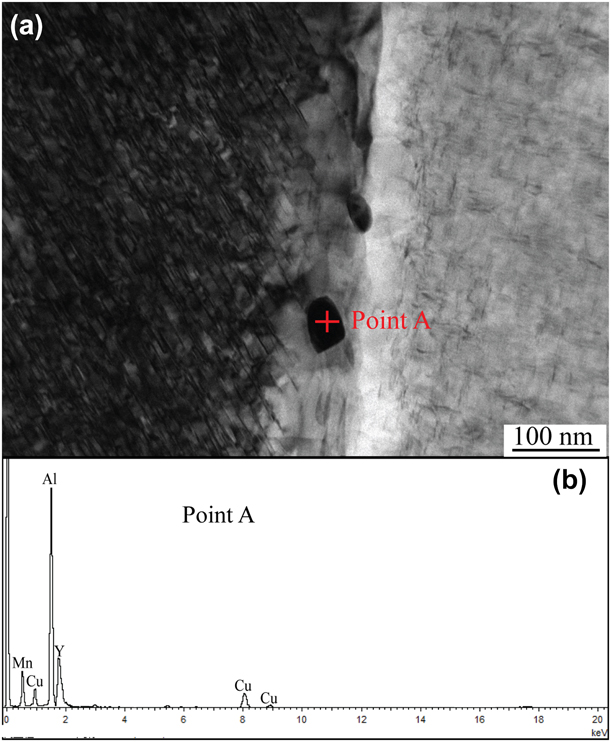
Figure 6(a) shows the TEM image at the grain boundary of T6-alloy 2#. It can be observed that there are several nanoparticles on the grain boundary. The EDS pattern analysis result [Fig. 6(b)] indicates that they mainly contain Al, Cu, Mn, and Y elements. Based on the Ref. Reference Zhang, Gao, Kuai, Han, Wang, Sun, Gu and You24, it can be speculated that these nanoparticles are primary Al3Y. However, the nanoparticle is smaller than the sampling area of the EDS, so it is possible that the EDS pattern also includes the Cu and Mn elements that are around the blocky phase. These primary Al3Y precipitates distributed on the grain boundaries can strengthen the grain boundaries by obstructing the motion of the dislocations [Reference Yao, Xia, Qiu and Jiang8], thereby improving the room- and high-temperature strength of the alloy.
(a) TEM image of Al3Y on the grain boundary of T6-alloy 2# and (b) EDS pattern of Point A.
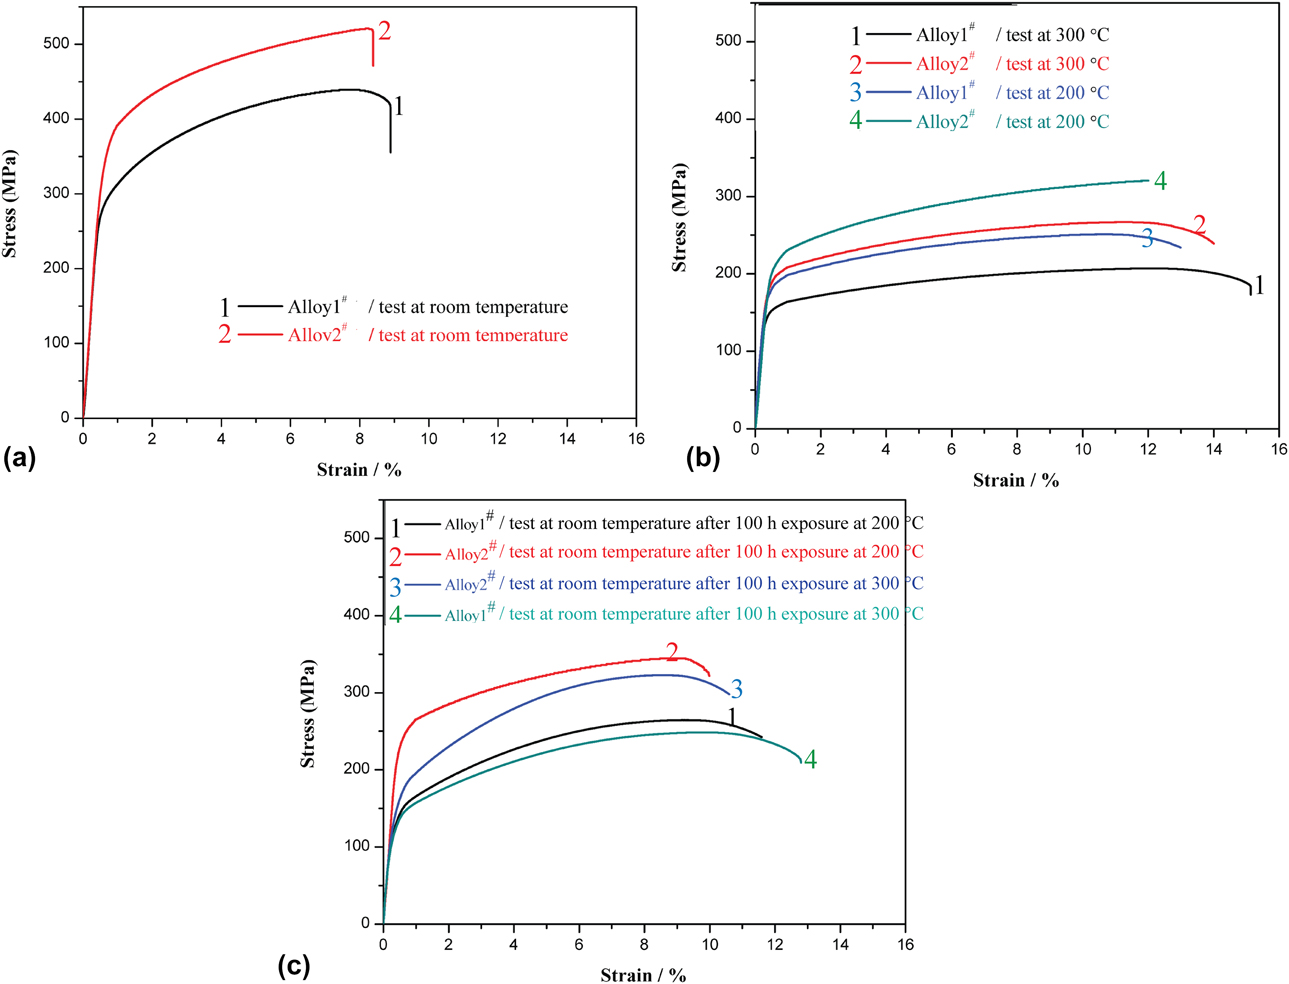
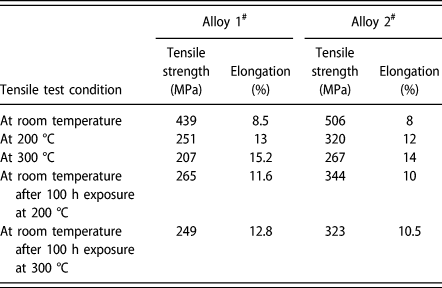
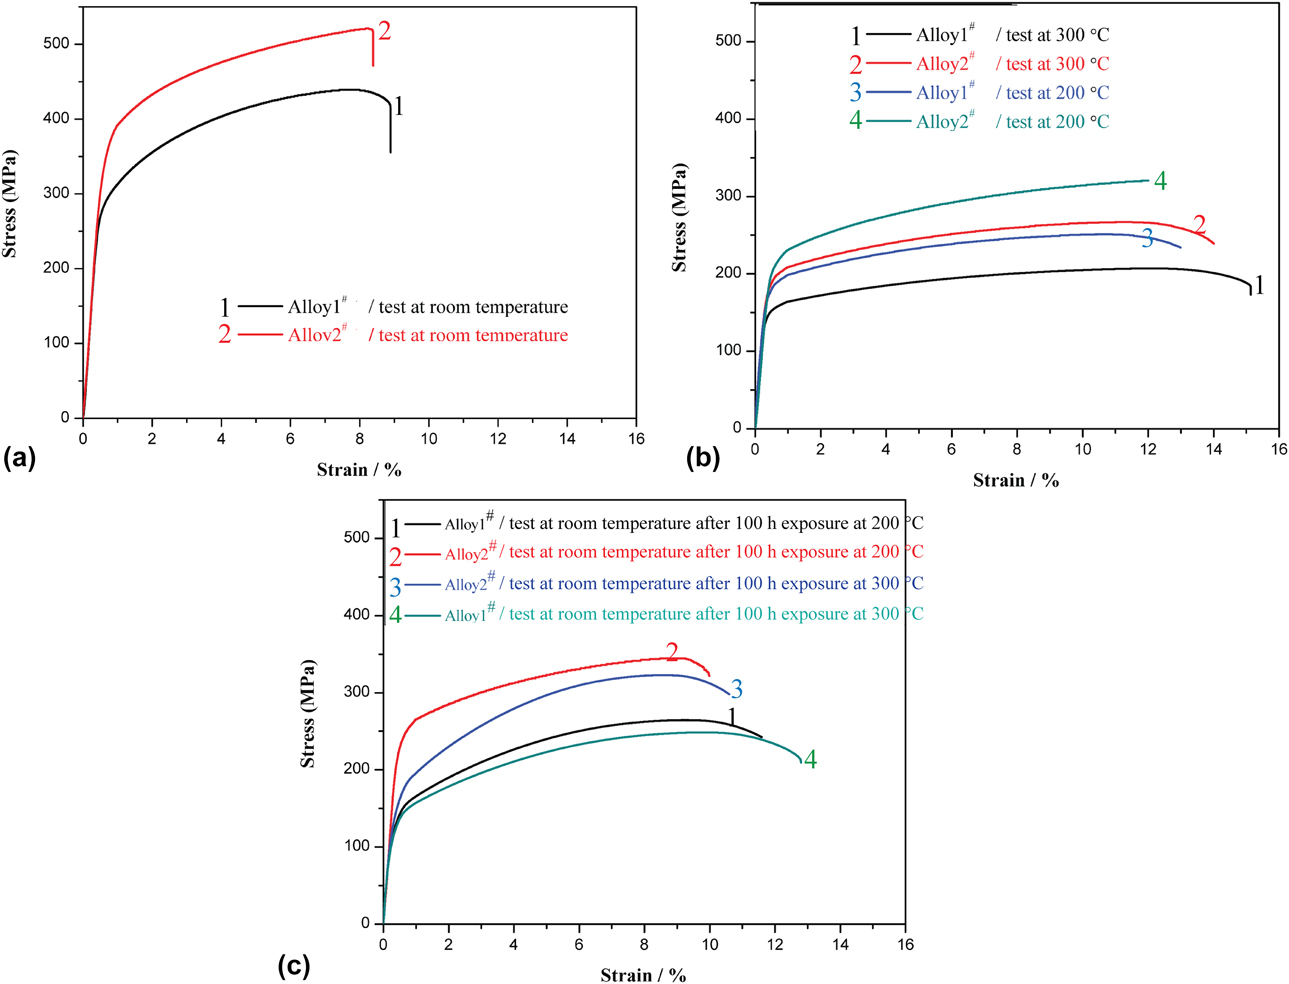
The stress–strain curves of alloy 1# and alloy 2# at each condition are shown in Fig. 7, and the corresponding tensile strength and elongation are listed in Table II. The tensile strength of alloy 2# was higher than that of alloy 1# at each condition. However, the elongation of alloy 2# decreased compared with alloy 1#. The addition of Mo, Zr, and Y reduced the average size of the grains and θ′ precipitates. The precipitation of L12-Al3(Zr, Y), Al3Zr, Al3Y, and Al12Mo increased the amount of the precipitates significantly. Therefore, the increase in strength can be attributed to grain refinement strengthening and dispersion strengthening. At the same time, the increase in the precipitates can also cause the decrease in plasticity. It has been proved that Zr and Y have the effect of grain refinement, which can reduce the casting defects of aluminum alloys [Reference Wang, Qiu, Liu, Taylor, Easton and Zhang26, Reference Li, Wang, Wei and Zhu29]. The decrease in casting defects is beneficial to plasticity, so although the elongation decreases to some extent, it is still at a high level. The addition of Mo, Zr, and Y can slow the coarsening rate of θ′ precipitates at high temperatures, thereby increasing the high-temperature strength of the Al–Cu–Mn alloy, but at the same time decreasing the elongation to some extent.
Stress–strain curves of alloy 1# and alloy 2#: (a) test at room temperature, (b) test at 200 and 300 °C, and (c) test at room temperature after 100 h exposure at 200 and 300 °C.
Tensile strength and elongation of alloy 1# and alloy 2# at each condition.
Discussion
Effect of Mo, Zr, and Y on aging behavior of Al–Cu–Mn alloy
Age hardening curves of alloy 1# and alloy 2# at 165 °C are shown in Fig. 8(a). The hardness of alloy 2# is much higher than that of alloy 1# during the whole aging process. Compared with alloy 1#, the time of alloy 2# (10 h) is shortened for reaching hardness peak, and the peak hardness of alloy 2# (184 HV) is higher. It indicates that the Mo-, Zr-, and Y-containing precipitates can accelerate the nucleation of θ′ precipitates. The hardness of the alloy 1# decreased obviously at 14 h, but for the alloy 2#, the hardness decreased prominently at 18 h. Therefore, the addition of Mo, Zr, and Y elements also can slower the growth kinetics of θ′ precipitates, thereby suppressing the growth of θ′ precipitates [Reference Yang, Zhang, Shao, Wang, Cao, Zhang, Liu, Chen and Sun15, Reference Mondol, Kashyap, Kumar and Chattopadhyay35, Reference Dorin, Ramajayam, Lamb and Langan38].
(a) Hardness of alloy 1# and alloy 2# at different aging time, (b and c) HRTEM and TEM images of alloy 2# after 100 h exposure at 200 °C, and (d) EDS pattern of Point A.
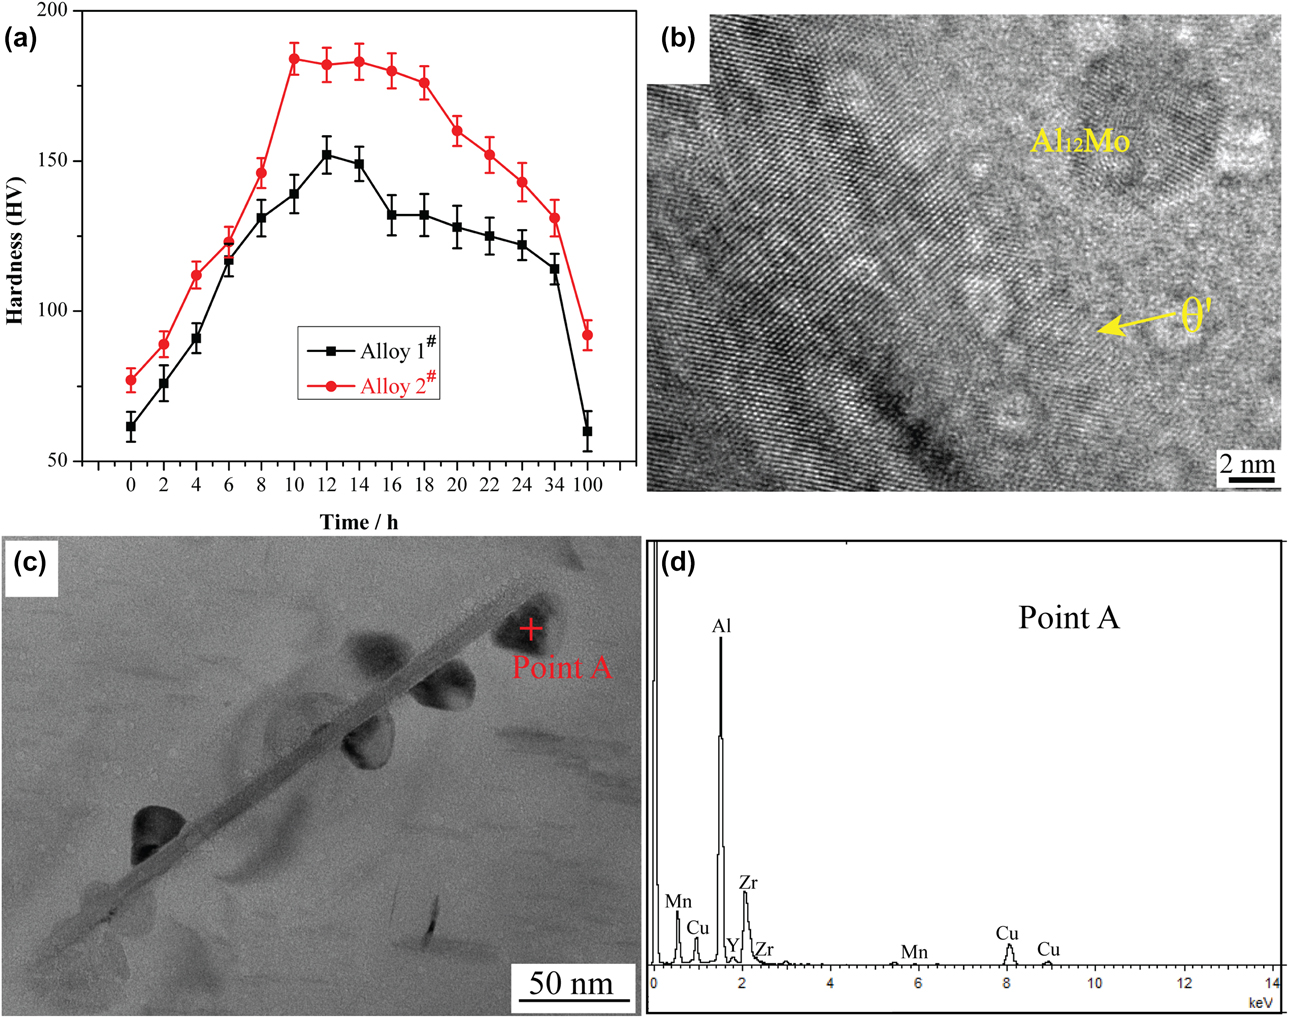
The analysis results of Figs. 8(b)–8(d) indicate that the Mo-, Zr-, and Y-containing precipitates can distribute around the θ′ precipitates, which suggests that the Mo-, Zr-, and Y-containing precipitates play an important role in accelerating the nucleation and hindering the growth of θ′ precipitates [Reference Yang, Zhang, Shao, Wang, Cao, Zhang, Liu, Chen and Sun15, Reference Liu, Ma and Chen18, Reference Mondol, Kashyap, Kumar and Chattopadhyay35, Reference Dorin, Ramajayam, Lamb and Langan38].
Strengthening mechanism analysis
In this paper, the strengthening mechanisms mainly include grain refinement strengthening, dispersion strengthening, and elastic stress field strengthening.
Grain refinement strengthening
Figure 1 indicates that the addition of Mo, Zr, and Y elements has the effect of grain refinement on the Al–Cu–Mn alloy. Grain boundaries increase with the decrease in grain size, and grain boundaries can serve as obstacles to dislocation motion, so grain refinement can effectively strengthen the alloy. However, at high temperatures, the obstruction of grain boundaries on the dislocation motion is weakened, resulting in the weakening of grain refinement strengthening effect [Reference Yao, Xia, Qiu and Jiang8, Reference Qin, Zhang and Chen39].
Elastic stress field strengthening caused by the difference in thermal expansion coefficient
The SAED pattern and HRTEM images in Figs. 4 and 5 reveal that L12-Al3(Zr, Y), Al12Mo (d (130) = 0.2306 nm), Al3Y (d (210) = 0.2020 nm), and Al3Zr (d (200) = 0.206 nm) can form coherent interface with α-Al (d (111) = 0.2338 nm, d (200) = 0.2025 nm), and the interface bonding is good. However, because the thermal coefficient of expansion of α-Al is different from that of Mo-, Zr-, and Y-containing precipitates, when the temperature is changed, the elastic stress fields will form around the precipitates. The elastic stress field can inhibit the dislocation motion, resulting in the improvement in high-temperature strength [Reference Vogt, Zhang, Li, Bonds and Browning40, Reference Gao, Wu, Lü, Duan and An41].
Dispersion strengthening
It has been proved that Orowan bypassing is the controlling mechanism for the precipitates larger than 2 nm [Reference Fuller, Seidman and Dunand42]. In this paper, the average size of Mo-, Zr-, and Y-containing precipitates is larger than 2 nm, so the strengthening mechanism also includes Orowan mechanism. The critical resolved shear stress (CRSS) increment (Δτp1) produced by the spherical Mo-, Zr-, and Y-containing precipitates can be calculated using the modified Orowan equation [Reference Nie and Muddle30, Reference Nie and Muddle43, Reference Ardell44, Reference Nie45]:
 $$\Delta {\tau _{{\rm{p1}}}} = {{Gb} \over {2\pi \sqrt {1 - \nu } }} \cdot {1 \over {\left( {{{0.779} \over {\sqrt f }} - 0.785} \right){d_{\rm{s}}}}} \cdot \ln {{\pi {d_{\rm{s}}}} \over {4b}}\quad ,$$
where G is the shear modulus of the aluminum matrix, ν is Poisson’s ratio, f is the volume fraction of precipitates, d s is the size of precipitates, and b is the Burgers vector of the dislocations. For the experimental alloy, G = 26.5 GPa, ν = 0.33, b = 0.286 nm, d s is about 5 nm. Since not all the Mo, Zr, and Y elements can precipitate, the admissible values of f are 0–0.01418. Therefore, the admissible values of Δτp1 are 0–134 MPa.
In addition, compared with the θ′ precipitates in alloy 1#, the volume fraction and aspect ratio of θ′ precipitates in alloy 2# did not change significantly. However, at the same condition, the number density of θ′ precipitates in alloy 2# was higher than that in alloy 1#, so the tensile strength of alloy 2# was higher than that of alloy 1#.
Conclusions
In this paper, Mo, Zr, and Y were used as microalloying elements to improve the high-temperature mechanical properties of the Al–Cu–Mn alloy. The effects of these microalloying elements on the microstructures and properties of the Al–Cu–Mn alloy were mainly in the following aspects: (1) the nanoscale L12-Al3(Zr, Y), Al3Zr, Al3Y, and Al12Mo precipitated, and they were stable at high temperature; (2) the θ′ precipitates were refined effectively, and at high temperatures, the coarsening rate of θ′ precipitates decreased; (3) the mechanical properties of the Al–Cu–Mn alloy at both room and high temperatures were significantly improved. And the strengthening mechanisms mainly include grain refinement strengthening, dispersion strengthening, and elastic stress field strengthening.
Methods
The Al–Cu–Mn (alloy 1#) and Al–Cu–Mn–0.2 wt% Mo–0.3 wt% Zr–0.2 wt% Y (alloy 2#) were melted using the electric resistance furnace at 750 °C. After being thoroughly stirred with a graphite rod, these two alloy melts were respectively cast into a preheated permanent mold to obtain the square ingots with a dimension of 20 × 10 × 120 mm. The as-cast ingots were solid solution treated at 520 °C for 24 h, followed by water quenching and then artificial aging at 165 °C for 14 h for T6-temper.
To explore the high-temperature properties and the thermal stability of the experimental alloys, the tensile tests were performed at five different conditions: at room temperature, at 200 °C, at 300 °C, at room temperature after 100 h exposure at 200 °C, and at room temperature after 100 h exposure at 300 °C. At least three samples were tested for each condition.
The optical microscopy (OM), scanning electron microscope (SEM) equipped with EDS, and TEM were used to observe the microstructures of the alloys. Before observing with OM, the mechanical polished samples were anodized with 25 g/L HBF4 for 2 min, and before observing with SEM, the mechanical polished samples were etched with 1% HF for 20 s. The TEM samples were prepared with precision ion polishing system.
Acknowledgments
This work is supported by the National Natural Science Foundation of China with No. 51871087, Innovation Team Project of Hebei Province with No. 180079, and Natural Science Foundation of Hebei Province with No. E2016202406 and International Science & Technology Cooperation Program of China with No. 2014DFA53020.