1. Introduction
The position of occupational pension funds in the UK has attracted much public and academic attention over the last 5 years. One reason has been the disclosure of much more information about the state of such funds as a consequence of the requirement that sponsoring companies should implement the requirements of the UK accounting standard FRS 17 (more or less identical to the international standard IAS 19) when preparing their annual financial statements. A second reason has been the implementation of the Pensions Act 2004, which gave substantial powers to the Pensions Regulator designed to ensure that defined benefit (DB) pension schemes are adequately funded and properly managed. In addition, the Act established the Pension Protection Fund as a compensation fund for occupational pensions.
Defined contribution (DC) pension schemes are little more than managed investment funds to which both employees and employers contribute, so that the implementation of FRS 17 has had a minimal impact on the nature of the information that is reported. The situation for DB pension schemes is very different. Such schemes create long-term liabilities for the pension fund and, potentially, for the sponsoring company. FRS 17 prescribes rules for the disclosure of DB liabilities in the sponsor's financial statements and balance sheet.
Under Section 75 of the Pensions Act 1995 if the sponsor of a DB scheme went into liquidation, any deficit in the pension scheme was treated as an unsecured debt of the sponsor to the scheme. However, the Act does not prescribe how the liabilities that give rise to the debt should be calculated. There have been two important changes under the 2004 Act and subsequent regulations. The first is that the powers given to the Pensions Regulator may be considered as moving the liabilities of DB pension schemes up in the order of seniority of creditors, both prior to liquidation and if a Financial Support Directive is issued after bankruptcyFootnote 2. The second is that liabilities must be assessed on a buy-out basis, i.e. the amount that an insurance company would have to be paid to take on responsibility for meeting the liabilities. These changes increase the cost of supporting unfunded pension liabilities and this is reinforced by the adoption of a risk-based system of levies to fund the Pension Protection Scheme, a compensation scheme.
In the remainder of this paper I will focus exclusively on DB pension schemes. In order to avoid repeated use of the phrase ‘defined benefit’, all general references to pension schemes are restricted to DB schemes unless explicitly stated otherwise.
The situation of the pension schemes operated by regulated utilities is somewhat more complicated. Many of the companies provide essential services and they are regulated because they are natural monopolies. Thus, if an operator goes into liquidation the business does not close down but will be transferred to a successor. In European and UK law, this constitutes a transfer of an undertaking and is covered by the provisions of regulations made under the Transfer of Undertakings (Protection of Employment) Acts – referred to as TUPE regulations. Prior to the enactment of the Pensions Act 2004 the UK's TUPE regulations did not cover accumulated pension rights, though EU legislation did. Since 2004, accumulated pension rights are protected following a transfer of an undertaking.
The key issue is what would happen if a regulated utility goes into bankruptcy with an under-funded pension scheme. Regulators have powers to appoint a Special Administrator to operate the business and eventually to transfer it to a new owner/operator. In principle, this process could result in losses for all unsecured creditors including the pension fund. But, since the business would continue, it is at least arguable that pension rights are covered by TUPE regulations, in which case any losses in administration would fall on non-pension creditors. Uncertainty about the outcome of administration will increase the cost of capital for utilities with substantial pension deficits. In practice, regulators have chosen to protect most creditors by transferring both debts and pension liabilities to the new operator and ensuring that the operator has sufficient revenues to cover these debtsFootnote 3.
A large portion of the pension scheme liabilities of regulated utilities originate from the period when the companies were public enterprises. Most of the schemes have been closed to new members, but contributions are still being made for current service of employees who worked for the utilities when they were still public enterprises. Further, the major part of the liabilities of these pension schemes relate to pension rights accumulated while the sponsor was a public enterprise. As a consequence, the commitments made to staff and pension schemes of former public enterprises prior to utilities being privatised or established as independent businesses constrain the measures that can be taken to address their pension deficits. In most cases, existing staff were guaranteed that future pension rights would be maintained for as long as they worked for the company, while some form of Crown guarantee was given with respect to pension liabilities if the entities were to become bankrupt. These guarantees are explicit for the successors to the former Post Office pension scheme – British Telecom (BT) and Royal Mail – but are regarded as potentially relevant by other regulated utilities.
As a final consideration, many (but not all) utility regulators have an obligation to set tariffs in a manner that ensures that an efficient operator is able to finance its business – i.e. to cover its operating costs plus the cost of the capital required to provide the regulated service as well as to fund any new investment. Hence, regulators have to balance the potential increase in the cost of capital if they insist that shareholders and non-pension creditors should bear some or all of the risks associated with pension deficits against the impact on regulated tariffs of allowing utilities to pass the cost of covering pension deficits on to customers. Most regulators have opted to allow regulated companies to recover the cost of deficit top-up payments to their pension schemes through tariffs on the grounds that this will minimise the cost of capital required to fund new investmentFootnote 4.
The practical consequence of these factors is that the customers of regulated utilities underwrite their pension schemes. There is no legal guarantee and pension schemes will certainly have priority over shareholders in the event of bankruptcy. On the other hand, the need to ensure new investment in capital-intensive businesses means that shareholder returns cannot be reduced significantly to fund pension deficits, especially if those deficits reflect historic under-funding of pension schemes within the public sector. Hence, regulators ought to be very concerned about the nature of the liabilities of the pension schemes operated by the companies that they regulate. I do not mean to imply that regulators have neglected this matter, but the difficulty that they face is that the liabilities reported in most company financial statements are grossly misleading.
Much of the problem can be traced back to the inconsistent manner in which pension deficits are valued and reported for different purposes. The trustees of pension schemes are required to prepare actuarial valuations every 3 years using appropriate actuarial assumptions as a basis for assessing future funding rates. The Pension Regulator is required to consider what pension deficits would be if companies were to go into liquidation, which focuses attention on the buy-out value of pension liabilities. Finally, company law and accounting standards mean that companies are required to follow the valuation assumptions laid down in FRS 17 (Accounting Standards Board, 2000)/IAS 19 (International Accounting Standards Board, 2003) in reporting pension costs and liabilities in their financial statementsFootnote 5. The various methods of valuation combine market valuation and discounted cash flow or present value calculations in ways that differ and may be internally inconsistent. Even under the best of conditions, the results of the different valuations are likely to differ and there are strong incentives for unconscious or conscious biases entering into the elements of the calculations.
In practice, both utilities and their regulators have tended to rely primarily on financial statements prepared in accordance with FRS 17 (or SSAP 24 before that) in deciding upon the level of current and top-up contributions to pension schemes. Unfortunately, as discussed below, there are good reasons to believe that FRS 17 valuations understate pension liabilities by a substantial margin, especially when compared with their buy-out values. This state of affairs can persist because it is often difficult to establish what the market buy-out value would be for the liabilities of a large pension scheme, so that buy-out values have to be estimated on a present value basis similar to FRS 17 but with different parameters. Hence, regulators are faced with the prospect of adjudicating between different valuations, while the utilities point to the difficulties of reporting different information in their regulatory accounts and their financial statements.
So long as the estimated buy-out values of pension liabilities are higher than FRS 17 valuations it is convenient for both parties to adopt FRS 17. Unfortunately, this is simply storing up problems for the future. If investors or lenders paid more attention to pension deficits, then the cost of capital for utilities with substantially under-funded pension schemes would be higher, but there is little evidence that this has happened – Cooper (Reference Cooper2009) . Further, the reliance on the Capital Asset Pricing Model (CAPM) by UK regulators when estimating the cost of equity – rather than a dividend discount model – is biased against recognition of the impact of pension deficits on the cost of capital.
In the remainder of this paper, I will examine the assumptions that have been adopted by utilities in applying FRS 17 to value their pension deficits and then examine how these deficits might change if a buy-out basis for valuing pension liabilities were used instead. Since it is not possible to obtain market buy-out values, I have constructed estimates of buy-out values on a present value basis using assumptions about the time profile of future pension cash flows. With this information it is possible to estimate the increase in regulated revenues that would be required to cover current service costs and eliminate pension deficits over a period of 10 years if a buy-out basis of valuation were adopted.
2. The conceptual framework for measuring pension liabilities
There have been extensive and sometimes heated arguments about the way in which the ‘fair value’ of DB pension liabilities should be measured. The heat is generated by the fact that technical assumptions can make a very large difference to the present value of past commitments to pay DB pensions in future. Much of the debate has focused on the rate at which future liabilities should be discounted in deriving their present value. But, any economist with an interest in inter-temporal risk analysis – e.g. the theory of investment appraisal or natural resource management – would conclude that large parts of the debate have been grounded on implicit assumptions that are known to be incorrect in all but a very limited range of circumstances. For example, standard models of investment under risk show that the expected present value of a risky project will only be equal to the present value of the mean outcome at a risk-adjusted discount rate, even without risk aversion, for very specific distributions of risk – Dixit and Pindyck (Reference Dixit and Pindyck1994) .
There are different ways of thinking about pensions and the emphasis has shifted over time. From one perspective, which I will refer to as the public pension model, a pension is a form of deferred but risk-free compensation. The employer buys a deferred annuity that will be paid once the employee reaches a specified retirement age. It follows that the employee is not an investor in the pension fund and does not expect to bear any of the risks associated with, for example, the future return on pension assets or the length of time for which the annuity will be paid. The corollary is that pension schemes operate, in effect, as insurance companies and their liabilities should be treated in the same way. An alternative approach is that the deferred compensation is not risk-free but takes the form of a bond-like investment in the company sponsor that will be paid out on pre-determined terms so long as the company does not default. Historically, this is a development of the private pension model in which company pensions were not fixed annuities but were closer to being gratuities paid at the discretion of shareholders.
There are merits in both perspectives, but the public pension model is more relevant to utilities as former public enterprises and it corresponds to the assumptions that underpin most UK legislation on occupational pensions – for example, the use of buy-out valuations in assessing the liabilities of a pension scheme on liquidation of the sponsor. This model implies that pension rights are risk-free and that, as a consequence, they should be discounted at the risk-free rate of return – Novy-Marx and Rauh (Reference Novy-Marx and Rauh2009) . As Novy-Marx & Rauh point out, the primary reasons for adopting a higher discount rate are that (a) employers might renege on the promises that they have made or (b) there is uncertainty about the future level of payments. Ethically, it does not seem reasonable that either regulators or regulated utilities should adopt a discount rate that is higher than the risk-free rate on the first of these grounds, and so I will set aside this argument.
This leaves the uncertainty about future pension payments. There are two important sources of such uncertainty – future rates of inflation when pension payments have to be adjusted to maintain their real value, and adjustments to current pension liabilities as a result of future wage increases or changes in actuarial parameters such as early retirement and mortality rates. I have dealt with the first type of uncertainty by examining liabilities in real terms – in 2008 constant prices – and applying the real risk-free rate of return on the basis that pension funds can, in principle, choose to invest in index-linked bonds.
The second type of uncertainty may be addressed by adopting a buy-out perspective. Few insurance companies are willing to take the risk of adjustments to pension rights due to future wage increases for reasons of moral hazardFootnote 6. So, for a buy-out to be feasible the pension scheme must be thought of as being wound up with no future accrual of pension rights and no adjustment to the real value of pension rights that have accrued up to the date of winding up. In other words, under a classic final salary scheme the pension payable to a current member used in the calculation of pension liabilities is the number of years of service at the date of valuation X pensionable wage at the date of valuation X pension accrual factor. The buy-out value of this obligation may then be estimated using standard actuarial assumptions about mortality rates before and after retirement, etc.
Both actuarial and FRS 17 valuations make provision for future adjustments in pension rights and uncertainty about actuarial parameters, but we should clear about the direction of such provisions. Once a buy-out valuation has been established on the basis described, the additional sources of uncertainty must increase the buy-out valuation as any insurance company would expect to be compensated for bearing the risks associated with the uncertainty about future pension payments. The implication is that the appropriate rate of discount should be lower than the risk-free rate. Hence, the valuations of pension liabilities presented below will underestimate the actual cost of insuring the liabilities.
There is a separate reason for adopting this approach. As a general rule, actuarial valuations focus on the level of future contributions that may be required to sustain the fund. Thus, the liabilities of the fund are based on an assumed real rate of increase in the average level of wages paid to current members of the scheme. One consequence is that it is necessary to make explicit assumptions about the rate at which existing members will leave their jobs before retirement, i.e. converting from current membership to deferred membership. Unless real wage growth is very low, changes in these assumptions can have a significant impact on the level of future liabilities. However, it is counter-intuitive from an accounting perspective that ‘fair values’ should depend on assumptions about future behaviour that may be affected by the decisions of the sponsor.
To summarise, the present value of future pension payments for pension schemes is calculated on the following assumptions:
(A) All of the calculations are expressed in real terms. By law, deferred pension rights and pensions in payment are adjusted in line with inflation (measured by the RPI) subject to a capFootnote 7.
(B) The liabilities of the pension scheme are valued on the basis that it is closed completely on the date of valuation.
(C) A final simplification is to set aside adjustments for early retirements and differential pension ages, pension payments to dependents, and similar features. So long as the relevant adjustments are actuarially fair on average, they do not make any difference to the aggregate position of a pension fund though they may redistribute benefits between members – e.g. pensioners with eligible dependents do better than single pensionersFootnote 8.
Under these assumptions, we can write the present value of the liabilities of the pension fund at date t as the sum of three components – for current members (L c), deferred members (L d) and retired members receiving pensions in payment (L r).
Current members:

Deferred members:

Retired members:
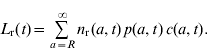
In these equations: (i) a denotes age and R is the default retirement age, (ii) nx(a, t) is the number of members of age a at date t in category x, (iii) sx(a,t) is the average length of accumulated service for members of age a at date t in category x, (iv) wx(a, t) is the average current or deferred wage for members of age a at date t in category x, (v) p(a, t) is the average pension paid to retired members of age a at date t, (vi) c(A, T) is the expected cost of buying an annuity paying £1 per year for a member of age A (A⩾R) at date T (T⩾t), (vii) δ is the real risk-free rate of return, and (viii) ρ is the pension right earned per year of service expressed as a fraction of the current wageFootnote 9.
The essential idea underpinning these equations is that at the valuation date either (a) the pension scheme has to put aside funds to purchase annuities for the accumulated pension rights of current and deferred members when they reach retirement age or (b) it has to purchase annuities to cover the pensions in payment to retired members for the remainder of their lives. The cost of purchasing annuities in future is discounted at the real risk-free rate of return since stripping out inflation implies that the money that is set aside should be invested in index-linked bonds. In this way, the present value of the pension liabilities is independent of uncertainty about future rates of inflation.
The cost of buying annuities that would cover pensions in payment (L r) is directly based on market evidence and should correspond more or less exactly to the payment that an insurance company would require in return for taking over the current pension liabilities of the pension fund. The same should be true for the cost of existing deferred pensions (L d) and pension liabilities for current members (L c) as the latter are treated as if they are converted to deferred pensions at the date of valuation. In practice, the market in future annuity rates appears to be very thin and insurance companies are reluctant to take on the risks involved. This is slightly surprising because insurers companies can invest in 50-year index-linked government bonds, which would remove most of the risks over future rates of return and inflation. What is left is mortality or longevity risk that insurers may be reluctant to absorb over a period of more than 50 years.
A pension scheme is or should not be regarded as a profit centre for its sponsor, especially for regulated utilities. Thus, the cost of self-insuring annuities to cover pensions in payment ought to be calculated on an actuarially fair basis using the risk-free rate of return if the sponsor of the pension schemes – or its regulator – is risk neutral. If it is not risk neutral, then it may choose to hedge the risks associated with annuity payments – perhaps by buying longevity swaps or by arranging a buy-out of the liabilities. In either case, the cost of insurance will increase the cost of buying annuities to cover current pensions in payment. The same logic applies to deferred pension rights but with an additional adjustment in the case of risk-averse sponsors for the risks associated with the length of time between the date of valuation and the date when deferred pensioners choose to exercise their pension rights.
In either case, the minimum values for (a) the current annuity rates c(a, t) in equation (3), and (b) the deferred annuity rates c(R,t+R−a)/(1+δ)R−a−1 in equations (1) and (2) must be a set of actuarially fair rates calculated using the risk-free real rate of return. By using these minimum values we can establish a lower bound for the value of the pension liabilities for the utilities studied. It may be argued that either the companies or their regulators are or ought to be risk average, in which case the estimates of the present values of pension liabilities reported below are too low, which will reinforce many of the conclusions that follow from the analysis.
All companies are required to report the current service cost incurred as a consequence of additional years of service for current members of the pension scheme. Assuming that the number of current employees remains constant, the cost of an extra year of service for all current employees of ages a <R−1 may be calculated from:
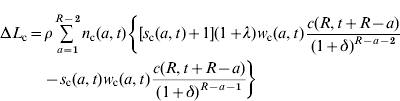
in which λ is the growth in the average level of real wages, i.e. w c (a, t+1)=(1+λ)w c (a, t). The formulation shows that the cost of offering a DB pension increases as employees become older because the discount factor applied to the cost of the annuity falls as their age increases. However, the increase is much less than is generally assumed because the real discount rate δ is likely to be very low and the future annuity rate depends solely on the employee's date of retirement. The other component of the increase in liabilities is depends on terms of the form λs c(a, t)w c(a, t)+(1+λ)wc(a, t). The first element reflects the increase in the cost of pension rights that have accrued up to year t as a result of any increase in average real wages (for λ>0), while the second is the straightforward accumulation of an additional year of service in year t+1 at the current wage.
3. How do regulated utilities measure their pension deficits?
While FRS 17 specifies a general framework for dealing with pension assets and liability, it does not attempt to prescribe all of the details. In practice, there are important differences between companies in the manner in which the standard is applied. Further, there are features of the actuarial assumptions that are difficult to reconcile with the general principles laid out in the standards. Hence, this section examines the actual practices followed by utilities in managing their pension funds and reporting their pension deficits. The quantitative analysis is based on a database of information extracted from the annual reports of more than 50 quoted and unquoted regulated utilities operating in the United Kingdom for financial years ending in 2004 to 2009. Details of the data are given in Appendix 1, but it is worth noting the following key points.
(A) Most regulators require that the companies which they regulate should report financial data for years ending on 31 March. However, in some cases, it is only possible to extract financial information from the accounts of parent companies with financial years ending on 31 December. In the present analysis, figures from the balance sheet at either 31 December 2008 or 31 March 2009 are referred as 2009 assets or liabilities, while figures from the income statement for 2008 or 2008–09 are referred to as 2008 revenues, expenses, etc. In a very small number of cases companies have changed their accounting years during the period examined, so that balance sheet dates have shifted from March to December or vice versa and the income figures refer to 9-month or 15-month periods. I have converted the figures from the income statement to annual equivalents, but I have not attempted to adjust any of the balance sheet figures.
(B) Reporting practices have changed over time. Under FRS 17 companies were required to report their pension assets and liabilities in accordance with the new standard for financial periods starting on or after 1 January 2005. There were transitional provisions for disclosure prior to full implementation of the standard, but some companies did not provide any relevant information in their reports for years up to 2004–05. Further, the nature of the information provided and the units for which it is provided has evolved as companies have complied with the requirements of FRS 17 in different ways. Since retrospective information is almost always given for at least 1 year, it is generally possible to obtain balance sheet figures for the periods 2004 to 2009 and income statement figures for 2003 to 2008. Exceptions include the gas distribution companies divested by National Grid in mid-2005.
(C) Few companies provided concrete details on their assumptions about life expectancy before 2007. Even now the information given in annual reports is sometimes incomplete and may be specific to the circumstances of the pension scheme which can complicate comparisons between schemes. Since the standard retirement age varies across schemes (and may change), companies tend to report life expectancy from the standard retirement age for their scheme. I have adjusted life expectancies to a standard retirement age of 65 using projected cohort life expectancies for 2008 and 2028 published by the Office of National StatisticsFootnote 10.
There are differences in emphasis between the accounting standards. IAS 19 states that the financial assumptions used in valuing pension assets and liabilities should be based on ‘market expectations, at the balance sheet date, for the period over which the obligations are to be settled’ – Introduction, paragraph 6(e). FRS 17 lays more emphasis on market conditions at the balance sheet date – paragraphs 23–26 – but subject to the requirement that the objective is to produce the ‘best estimate of future cash flows that will arise under the scheme liabilities’ – paragraph 23. In practice, companies have tended to ignore the general guidance in IAS 19, relying instead on economic and other parameters estimated at the balance sheet date. This is unfortunate: it leads to considerable period-to-period variation in the basis on which pension liabilities and costs are calculated that does not reflect real changes in the prospects for pension cash flows over the life of the scheme.
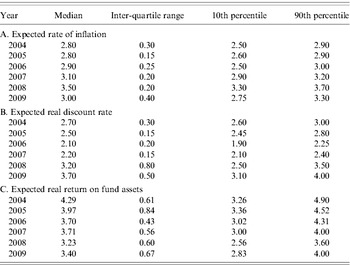
Table 1 shows the evolution of assumptions about inflation, the real discount rate and real returns on assets from 2004 to 2009 for the sample of utility pension schemes. I have focused on the real discount rate and real rates of return because the effective indexation of most liabilities means that it is convenient to examine movements in the real value of liabilities over time.
Distribution of economic assumptions used by utility pension funds

Source: Author's calculations using data described in Appendix 1.
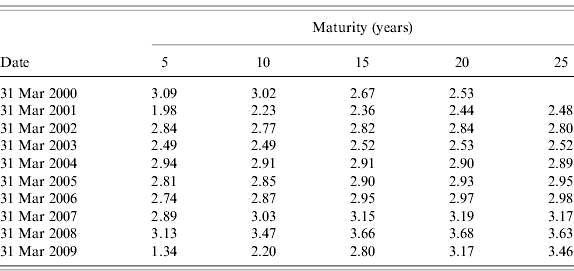
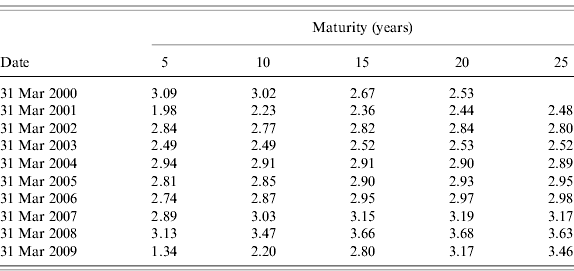
It is particularly striking that the median of the assumed rate of inflation increased from 2.8% in 2004 and 2005 to 3.5% in 2008Footnote 11. It is not difficult to identify the source of this change. Table 2 shows how the curve of implied inflation rates calculated by the Bank of England from the yield curves for nominal and index-linked gilts has shifted from 2000 to 2009. Until 2009, the expected rate of inflation used by pension funds has tracked the implied rate of expected inflation from 10-year gilts, but there was a sharp change in 2009. However, the implied rate of inflation may not be a reliable source of information about inflation expectations. The Bank of England's notes on the yield curve warn of the difficulties – in particular, illiquidity in markets for certain maturities and types of bonds and the assumption that the inflation risk premium is zeroFootnote 12. For example, the implied rate of inflation can differ significantly across types of bonds at a particular dateFootnote 13.
Average implied rates of expected inflation derived from yields on gilts (%)
Source: Bank of England yield curves and expected inflation.
Quite apart from technical concerns, there is a larger objection to the basis used to obtain the valuation assumptions. The key parameter in valuing pension liabilities is the real rate of discount used to calculate present values – shown in Part B of Table 1. This is derived from the nominal discount rate, obtained from corporate bond rates, and the expected rate of inflation. The primary indices of corporate bond rates only extend to maturities of 10 years, and so it is consistent to use inflation expectations over 10 years to match the corporate bond information. The consequence is that the median value of the real discount rate has varied from 2.1–2.2% in 2006–07 to 3.7% in 2009. Such changes have a huge impact on the estimated value of pension liabilities over a period of 2–3 years.
However, both FRS 17 and IAS 19 are quite explicit in stating that the assumptions used in arriving at fair values for pension liabilities should reflect expectations over the full life of the pension scheme – i.e. for a period of 50–60 years, not 10 years. There is no justification in the standards for using changes in market values for medium term assets as the basis for valuing pension liabilities. Material changes in assumptions should only be based on clear evidence that there has been a genuine change in expectations about very long-term returns and discount rates.
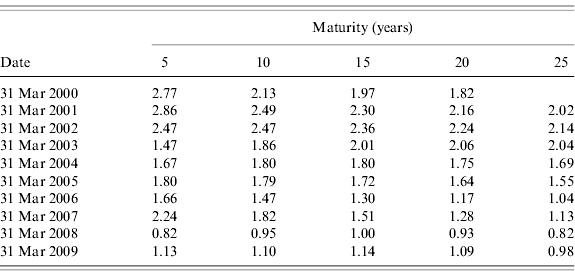
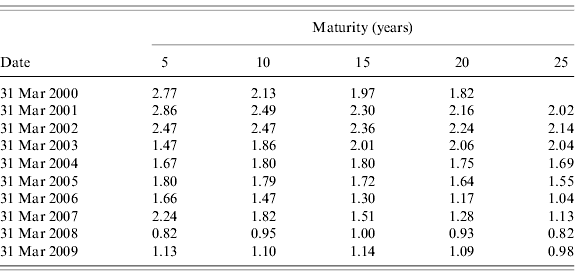
In Section 2, it was argued that the real discount rate used to calculate pension liabilities should be the real risk-free rate of return. Table 3 shows the Bank of England's yield curve for the real return on index-linked gilts for maturities for 5–25 years. Focusing on the long end of the spectrum it is clear that the risk-free return on for long maturities has fallen from about 2% in the early years of the decade to little more than 1% over the last 4 years. The average value for a 25-year maturity over 2001–09 was 1.49%.
Real return on index-linked gilts (%)
Source: Bank of England yield curves and expected inflation.
It is sometimes argued that the yields on index-linked gilts have been pushed down to artificially low levels by the conjunction of increased demand from pension funds and limited supply because the Debt Management Office (DMO) has failed to increase the supply of index-linked bonds in response to the shift in the market. This may be correct as a description of the factors underpinning the decline in the real return, but nonetheless the demand for insurance against inflation risk appears to have increased and would be even higher if pension funds were to value their liabilities properly. Thus, there can be little justification for adopting a discount rate that is significantly higher than 1% in real terms in current circumstances. The much higher figures for the expected real discount rate shown in Section B of Table 1 are clearly too high, even at the 10th percentile, and lead to a substantial under-estimation of the true scale of pension liabilities.
The calculation in the sections that follow are based primarily on the real discount rate, but it may be helpful to provide a nominal discount rate for comparison with the rates reported in financial statements. The simplest basis is to rely on the Bank of England's inflation target. Over 20 years from 1989 to 2008, for which the Office of National Statistics publishes comparative figures, the average difference between 12-month inflation measured by the Retail Prices Index (RPI) and by the consumer price index (CPI) has been 0.87 percentage points. On this basis, the middle of the Bank of England's target range for inflation – a CPI figure of 2% – would translate to an expected rate of RPI inflation of roughly 2.9%. If this is used to convert real to nominal rates over the long term, the nominal discount rate would be 4% based on recent yields on long-dated gilts or 4.5% for the average yield over the last decade.
There is one other point that is worth noting. The Department of Work and Pensions has introduced regulations that will link future adjustments in public pensions to the CPI rather than the RPI. The trust deeds for some company pension schemes permit them to follow this change and this has prompted comments which suggest that the pension deficits of companies will be reduced as a consequence. This is an illustration of a tendency to game the rules prescribed under FRS 17. The logic is that corporate bond rates are not affected, whereas the expected rate of increase of pension payments will be lower so that the effective real discount rate will rise, thereby reducing the estimated value of pension liabilities.
These comments entirely ignore the larger picture. The DMO, acting for the Treasury, has a duty to finance government debt at the lowest cost. It is also the dominant supplier of inflation insurance. The change discussed will shift the demand for inflation insurance from RPI-linked bonds to CPI-linked bonds. Hence, the DMO would be failing in its responsibilities if it does not switch the basis of inflation indexation from the RPI to the CPI for the majority of future bond issues. Without question, the change that has been announced will reduce public pension costs and future borrowing costs. However, there is no evidence that the shift will increase the real discount rate that ought to be applied when valuing corporate pension liabilities.
Apart from the real discount rate, the other key variable in assessing pension liabilities is the assumed life expectancy at retirement. It is well known that life expectancy has been increasing more rapidly than previously anticipated, but it is important to put the impact of greater life expectancy in context. With a real discount rate of 2.9% an increase in average life expectancy of 1 year in life expectancy at retirement has a weight of 0.56, while a similar increase in life expectancy for someone who will retire in 20 years time has a weight of 0.31. However, with a real discount rate of only 1%, the weights are 0.82 and 0.67, respectively. This is why the correct level of the real discount rate is so important, because it reinforces the impact of other changes in actuarial assumptions that may be required.
Less than one half of the pension schemes in the sample report usable information on their assumptions concerning life expectancy. Median life expectancy for males at age 65 increased from 20.3 years in 2007 to 21.5 years in 2009, accompanied by a reduction in the inter-quartile range from 2.0 years to 1.55 years. In parallel, median life expectancy for males at age 65 in 20 years time increased from 21.4 years in 2007 to 23.1 years in 2008, implying that the trend increase in life expectancy was expected to continue. Only one-third of scheme provide details of their assumptions for both males and females, but the broad pattern is to assume that the gap between male and female life expectancy will decrease slowly to about 2.0 years in 20 years time. The overall impact of the revised assumptions is equivalent to an increase of 0.9 to 1.0 years in weighted average life expectancy at retirement for pension scheme members. As a crude upper bound, this change increases pension liabilities in real terms by about 3.6% for a real discount rate of 3% or about 4.5% for a real discount rate of 1%Footnote 14. As a comparison, reducing the real discount rate from 3% to 1% increases pension liabilities by about 20%.
The valuation of pension liabilities and deficits is not directly affected by the assumptions made about the real return on equities and fund assets overall, but it does affect any assessment of whether the level of contributions is adequate. In this respect, it is interesting to note a minor irony in the assumptions made by pension funds. For a market portfolio, the capital asset pricing model implies that:

The classic London Business School (LBS) study by Dimson et al. (Reference Dimson, Marsh and Staunton2001) suggests that for the UK the ex-post equity risk premium (ERP) relative to bonds has an arithmetic mean of 5.6% and a geometric mean of 4.4%. Their estimate for the full sample of world markets is somewhat higher with an arithmetic mean of 6.7%. However, they suggest that a forward-looking estimate of the ERP should be lower than the ex-post outcome and adopt a range of 4–5%. Regulatory precedent in the UK implies a range of 3.5–4.5%, though regulators in the US and Australia have generally adopted higher estimates of the ERP in the range 5–7%. In contrast, the ERP for the median assumptions made by pension funds was about 2.2% throughout the period 2004–09.
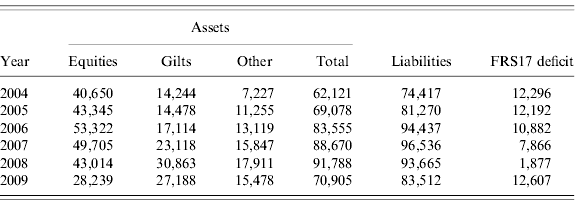
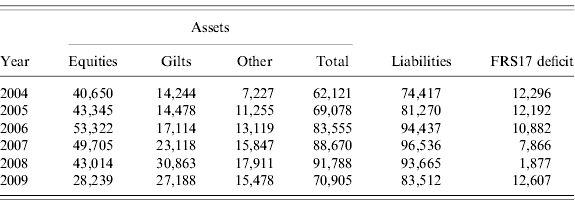
The assumptions imply a mispricing of the risks of investing in equities relative to gilts, especially index-linked gilts. The consequence is that the pension funds hold a large share of their assets in equities and undervalue the true cost of their liabilities. Table 4 shows the composition of the assets of the pension schemes for regulated utilities as well as the reported value of liabilities, all expressed at 2008 prices. The share of gilts in total assets has increased from 23% in 2004 to 38% in 2009. But in terms of risk management it is more interesting to examine equity holdings relative to total liabilities – even on a basis that underreports the latter. This declined from 55% in 2004 to 52% in 2007 and then to 40% in 2009 – largely because of the decline in the stock market over 2008–09.
Reported assets and liabilities for all regulated utilities (£ million at 2008 prices)
Source: Author's calculations using data described in Appendix 1.
Much of the apparent improvement in the aggregate FRS 17 deficit from £7.87 billion in 2007 to £1.88 billion in 2008 was due to the net impact of revised actuarial assumptions that reduced total liabilities by 6.6%, whereas allowing for inflation alone would have increased them by 3.8–4.0% depending on the exact date of valuation. The net impact of the changes in actuarial assumptions on liabilities was at least £7.4 billion, significantly larger than the magnitude of the reduction in the aggregate deficit.
The central point that comes out of this examination of the actuarial assumptions made by the pension schemes operated by regulated utilities is that the real level of the discount rate that they use is much too high. Considerations of the nature of pension liabilities and the evidence on the real risk-free rate of return in the UK point to a real discount rate of about 1% in 2008–09, whereas the median real discount rate adopted by the pension schemes in 2009 was 3.7%. A second observation, which is a corollary of the first, is that the share of equities in pension scheme assets seems to be rather high, given their own assumptions about the relative returns on equities and gilts. Even with a risk-free real return of 1%, the assumed nominal return on equities is less than the level that would be consistent with most reasonable estimates of the ERP. If the risk-free real rate of return is considerably higher than 1%, as implied by the discount rate used by most pension schemes, then the expected return on equities is far too low relative to the returns on government and good quality corporate bonds to warrant investing pension scheme assets in equities rather than bonds.
4. Recalculating pension liabilities and deficits
Since the assumptions adopted by the regulated utilities in the sample do not provide a reliable basis for assessing the condition of their pension funds, it is necessary to recalculate the present value of future pension obligations. The adjusted estimates are approximations that take account of explicit assumptions about future pay increases, life expectancy and assume that changes in other actuarial parameters have not had a material impact on reported liabilities.
The starting point of the analysis is the profile of future pension payments reported by BT as one of the largest utilities in the sample. In its Annual Report for 2008 the company shows its expected pension obligations at 31 March 2008 for financial years starting in 2008, 2009, … . The profile shows that expected payments increase from about £1.5 billion in 2008–09 to about £3.5 billion in the years 2029–31 and declines from 2031 onwardsFootnote 15. After conversion from nominal to real terms the time profile may be approximated by a truncated normal density function with a maximum in 2021–22. As an alternative I have also used negative binomial and Weibull density functions to approximate the real profile of BT's pension obligationsFootnote 16.
This profile applies to a pension scheme that was closed to new members in 2001 and had a normal retirement age of 60. The scheme is therefore fairly mature in the sense that calculations of life expectancy for new members or members aged 40 or less are not major factors in determining the scheme's liabilities. It should be noted that the maximum level of future payments in real terms occurs about 20 years after the scheme was closed to new members. It is likely that the peak of future pension payments will be later for pension schemes that are still open to new members or which were closed more recently than the BT pension scheme (BTPS). A simple rule of thumb is to assume that the peak will occur 20 years after closure or in 2028–29, whichever is later.
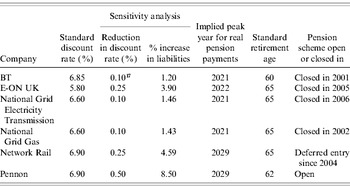
It is possible to test this assumption. A small number of pension schemes report the sensitivity of their pension liabilities to changes in certain key assumptions. While the nature of the sensitivity test is not uniform, all of them show how liabilities would increase/decrease for some decrease/increase in the discount rate – usually between 0.1 and 0.5 of a percentage point. Assuming that the distribution of future real obligations can be approximated by a truncated normal with the same standard deviation as that for the BT scheme it is possible to calculate the mean of the underlying normal distribution that would generate the reported sensitivity outcome. The results are shown in Table 5. They show that pension schemes which are open to new members are likely to have a later peak for the real value of expected pension payments than those which have been closed for some period. However, the simple rule of thumb may not be reliable. For this reason, I have examined two alternative variants:
Variant A – The peak of the real payment profile will occur in 2022 for all companies.
Variant B – The peak of the real payment profile will occur 20 years after the scheme is closed to new members or in 2029, whichever is earlier.
Sensitivity analysis of pension liabilities

Source: Author's calculations using data described in Appendix 1.
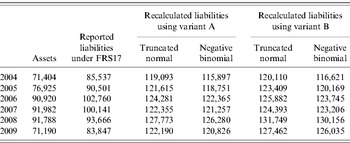
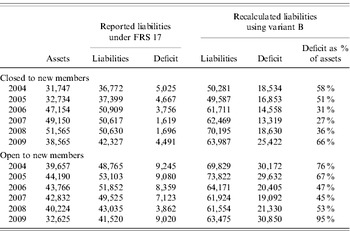
These variants provide a reasonable basis for assessing how far different assumptions about the profile of pension payments affect the overall pension liabilities of the companies in the sample. The results of recalculating the pensions liabilities for regulated utilities using the standard assumptions for inflation and the discount rate discussed in the previous section are shown in Table 6. To allow comparisons across time all money values have been converted to March 2008 prices using the RPI. The differences between the estimates of liabilities recalculated using the truncated normal and negative binomial distributions are well within the likely errors of estimation. Variant B (assuming that the peak of the payment profile is 20 years after the closure of the pension scheme) yields somewhat higher estimates of the liabilities but is, in my view, a more appropriate assumption. Hence, the remainder of the analysis will focus on liabilities estimated using Variant B and the truncated normal distribution.
Pension assets and liabilities for regulated utilities (£ million at March 2008 prices)

Source: Author's calculations using data described in Appendix 1.
If one were to rely on estimates of pension deficits calculated using FRS 17, it would appear that the aggregate pension deficit for regulated utilities narrowed from £13.5 billion in 2005 at 2008 prices to £1.9 billion in 2008. Further that aggregate figure is entirely due to the deficit in a single scheme – Royal Mail Holdings (RMH), which had a deficit of £2.9 billion in 2008. The picture provided by the recalculated liabilities is very different. The aggregate deficit for all regulated utilities in 2008 was £46.5 billion and total pension liabilities were about 144% of total pension assets. The overall pension deficit narrowed marginally from 2005 to 2008 and then increased to £56.3 billion in 2009. Changes in the overall pension deficit have largely been driven by changes in the value of pension assets and the increase from 2008 to 2009 shows how vulnerable pension funds are to short-term movements in stock market and other asset valuations.
In parallel with the decline in asset prices, there are significant year-to-year fluctuations in the present value of liabilities, largely because companies adjusted their assumptions about current and future life expectancy. It is difficult to ensure that adjusted estimates of pension liabilities treat life expectancy in a consistent manner, because many companies provide very partial or no relevant information. Increasing the estimates of current and future life expectancy has three effects on the profile of future pension payments in real terms.
(A) The peak level of pension payments will be greater relative to its value in 2008 because more retired members will survive to draw their pensions.
(B) The date of the peak may be pushed forward in time, though generally by a fairly small amount.
(C) The standard deviation of the distribution will be increased because retired members (or their dependents) will, on average, draw their pensions for more years.
These effects may be captured by assuming that the mean and the standard deviation of the truncated normal distribution used to model the future pension profile both increase with life expectancy. Since the starting level of payments is kept constant, this change has the effect of increasing the peak payment and extending the period until, say, the profile of pension payments falls to 10% of the peak level. The sensitivity tests reported by the companies in Table 5 are broadly consistent with the assumption that mean and standard deviation of the truncated normal distribution increase by the same percentage as the increase in life expectancyFootnote 18.
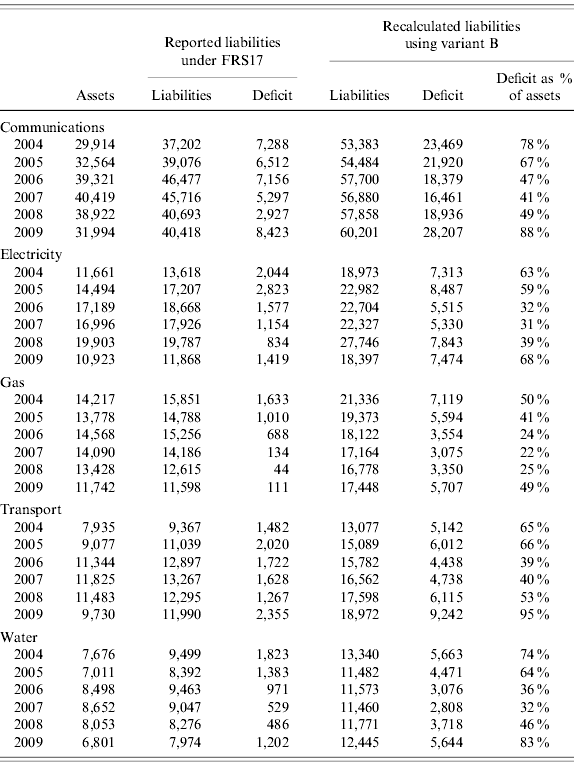
Table 7 breaks down the aggregate figures by sector. Expressed as a percentage of total pension assets, the recalculated pension deficits fell from 2004 to 2007 but increased sharply in 2009. The relative magnitude of pension deficits is greatest for transport, while it is lowest for gas.
Pension assets, liabilities and deficits by sector (£ million at March 2008 prices)
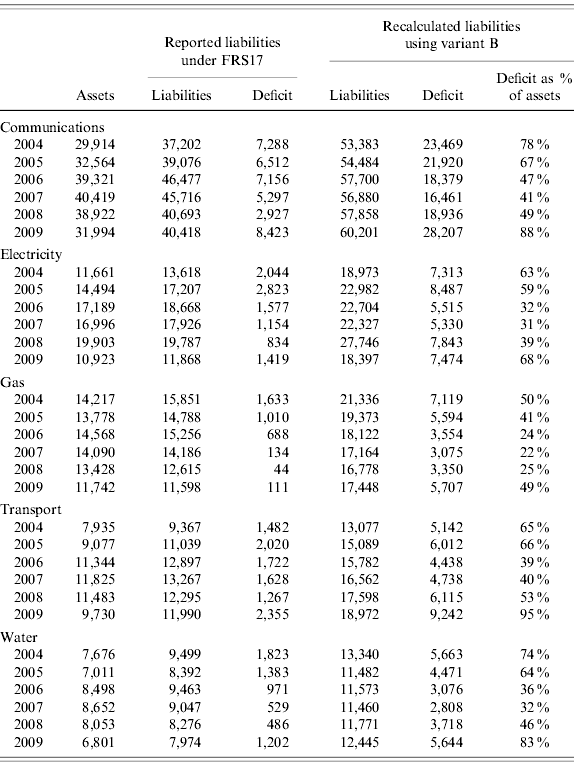
Source: Author's calculations using data described in Appendix 1.
Table 8 shows that the relative magnitude of pension deficits is greatest for pension schemes that remain open to new members. If data for all years are pooled, an analysis of variance shows that the funding ratio (defined as the ratio of assets to recalculated liabilities) is consistently lower for schemes in the public sector such as Royal Mail and Scottish Water, which are also more likely to remain open. After controlling for the difference between public and private schemes, there is evidence that the decision to close schemes is driven by the funding ratio. Schemes that have been closed for less than 5 years are more under-funded than both (a) schemes that have been closed for more than 5 years and (b) schemes that remain open.
Pension assets, liabilities, and deficits by pension fund status (£ million at March 2008 prices)

Source: Author's calculations using data described in Appendix 1.
5. What is required to eliminate the pension deficits?
The total value of regulated revenues for the utilities in the sample was £56.2 billion in 2008–09, very close to their total pension deficit in 2009. Thus, any attempt to eliminate the pension deficit in a short period of time would imply a massive adjustment either to regulated prices or to the return on capital for the companies. The standard approach of the Pension Regulator is that companies should implement actions to eliminate their pension deficits over a period of 10 years, and so I will use this as a reference point in considering the options open to the companies and regulators.
However, it is not sufficient to consider only the additional contributions required to eliminate the existing deficit. The reported costs of pension rights which accrue as a result of current years of service are understated by the use of a real discount rate that is too high. Again, it is not possible to compute an exact adjustment to the current service cost, but the following procedure is used to estimate adjusted service costs.
• Active members of the pension scheme in year T are distributed evenly over ages from 25+T−T c to normal retirement age R, where T c is either (a) the year in which the scheme was closed to new members, or (b) T for schemes that have not closed.
• After retirement at age R, mortality is calculated using standard life tables adjusted for the life expectancy at retirement for active members with 20 years until retirement reported in the company's FRS 17 disclosureFootnote 19.
• Calculate the average service costs per £1,000 of salary for both the FRS 17 real discount rate and the risk-free real discount rate assuming (a) a one-sixtieth pension accrual and (b) actuarially fair adjustments for lump-sum payments and early retirement.
• The adjustment factor applied to the total service cost (=current service cost for the employer+employee contributions) is the ratio of the average service cost for the risk-free discount rate divided by the average service cost for the FRS 17 real discount rate.
• Finally, the adjusted service cost for the employer is obtained by deducting employee contributions from the adjusted total service cost.
This procedure is only an approximation but it should provide a reasonable estimate of the magnitude of the adjustment to current service costs to reflect a more appropriate discount rate. For 2008, the unweighted average ratio of adjusted service cost to reported current service cost was 1.84 with a range from 1.37 to 2.20, while for 2009 the average adjustment factor increased to 2.24 with a range from 1.54 to 2.76. Increasing current service costs by more than 100% makes a considerable difference to any assessment of the adequacy of current contributions to cover the long run costs of accrued pension rights.
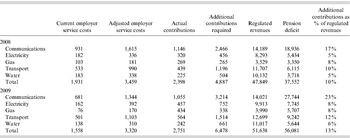
Table 9 shows the extent of the additional contributions required to cover both adjusted service costs and to eliminate the existing deficits. The first two columns compare reported and adjusted service costs for the employer, while the third column shows the actual contributions paid by employers in the two years, including top-up contributions. For gas and electricity, the actual contributions were sufficient to cover adjusted service costs, but overall the top-up contributions were less than the gap between reported and adjusted employer service costs. This means that the pension deficits were actually getting worse, even before any actuarial losses due to low investment returns.
Additional contributions to cover service costs and eliminate pension deficits (£ million at March 2008 prices)

Source: Author's calculations using data described in Appendix 1.
The figures show that the additional contributions required amounted to 17% of regulated revenues for communications in 2008 and 23% in 2009. For other sectors, the additional contributions were 5–10% of regulated revenues in 2008 and 6–12% in 2009. Such extra contributions would imply significant initial increases in tariffs or other charges. An alternative approach might be to adjust the X factors for each sector so as to mitigate the immediate impact of higher pension contributions, but this is unlikely to be sufficient for communications or transport because of the shortfall of actual contributions relative to adjusted service costs.
6. How should regulators deal with the pension liabilities of regulated utilities?
The fundamental feature of present arrangements for funding the pension schemes of regulated utilities in the UK is that they imply a classic one-sided option on the future performance of equities, primarily in the UK. Pension liabilities are substantially understated while pension assets are heavily allocated to high-risk investments. If the future return on equities is above the historical average, then the gamble may turn out well without any action being required to make up for a potential shortfall in assets and contributions to cover pension liabilities. However, a much more likely outcome is that the pension funds will have to be shored up at some point by some combination of higher current contributions and lump-sum payments.
The situation of RMH illustrates some of the regulatory issues that arise. Despite intermittent efforts by Postcomm, the government as its owner has been unwilling to allow RMH the commercial freedom to take the actions that would be required to scale down the magnitude of its pension liabilities. RMH might be able to generate more funds to cover its pension deficit if it were allowed to increase its charges for monopoly services by a large amount, but at the risk of substantially accelerating the decline in demand for those services. Instead, the Government has opted to underwrite RMH's pension deficit, though this has been challenged as improper state aid. But this does not resolve all or even most of the regulatory issues. For example, should regulated revenues be set to cover only current service costs or should RMH continue to make some contribution to the historic deficit? Is the public guarantee limited to the pension deficit assessed at date X? If so, how should it be valued? What happens if, for example, the Post Office Pension Scheme continues to invest heavily in equities and the future returns turn out to be lower than expected? Arguably, the same remarks apply to Transport for London and Network Rail, even though their deficits are much smaller, because of their dependence on various forms of public subsidy.
The central issue is a specific variant of a longstanding debate among specialists in pension economics and finance as laid out in Sutcliffe's paper on the cult of equities for pension funds – Sutcliffe (Reference Sutcliffe2005) . We know that the expected real return on a portfolio of investments with a large equity component will be much greater than the risk-free real rate of return. For a pension scheme with a strong and risk-neutral sponsor, there may be valid reasons for taking advantage of the higher expected returns on equities. However, not all sponsors are strong and many are certainly not risk-neutral when making decisions about their net pension liabilities, so they may choose to reduce or off-load their pension risks either by adopting low-risk investment strategies or by transferring the risks to an insurance company through a buy-out. The problem is that this option will crystallise any pension deficit and may not be feasible unless the sponsor has – or can borrow – the funds to top-up the scheme to eliminate the deficit.
The question for regulators is how they should address this choice. If, as I have argued, the practical situation is that a large portion of pension risks for regulated utilities will be borne by customers, then the regulator's job is to represent the interests of customers as residual sponsor. One view is that (a) customers, as a group, ought to be risk-neutral, and (b) they will apply a discount rate to future tariff increases that is much higher than the risk-free rate of discount. In that case, doing the minimum necessary to fund pension deficits on the assumption that utility pension schemes continue to invest heavily in equities might be the best option. Even then, there is a problem of time inconsistency in regulatory behaviour that may worry the shareholders and lenders of utility operators. Regulatory risk in the UK is not zero as regulators do not have a good record of honouring implicit or explicit commitments made in the past. There are many examples outside the pension sphere of decisions that reduce the return on past investments by changes in regulatory rules. Hence, even if regulators were to take the view that the residual sponsor is risk neutral, shareholders and lenders may wish to factor risks associated with a utility's pension scheme into account when making investment decisions.
An alternative view is that it is neither the job nor in the interests of utility customers to underwrite options on equity market returns via utility pension schemes, especially when there is uncertainty about how the liabilities will be distributed in the event that the options are called. From this perspective, there may be an immediate cost involved in crystallising and gradually resolving existing pension deficits, but this has to be set against a reduction in the cost of capital if the risks associated with pension deficits are recognised and addressed.
From either viewpoint it is hard to see what merit there could be in failing to base decisions on a better measure of pension deficits than that provide by FRS 17. I have argued that the minimum buy-out value of pension liabilities will be equal to future pension payments discounted at the risk-free rate of return. At the very least, utility regulators ought to require the companies that they regulate to report their pension deficits on this basis. It would be even better if it were possible to obtain and report useful market buy-out valuations, but this may be difficult for large schemes. If uncertainty about how existing pension deficits will be addressed in future has the effect of increasing the cost of either equity or borrowing for utilities, then regulators ought to consider whether it is in the interests of customers to reduce or eliminate such uncertainty.
Appendix 1. Sources of data
The data compiled for the analysis in this paper were extracted from the statutory Financial Statements for regulated entities or their parent companies for years ending on or after 31 December 2004. The requirement to account for company pension schemes in accordance with FRS 17 came into effect for financial years beginning on or after 1 January 2005 but companies were required to provide transitional information for prior years even when they did not reflect movements in pension liabilities and assets in their balance sheet and income statement. In practice, most companies included some but not complete information on the implications of adopting FRS 17 in their financial statements for the financial year starting in 2004. Further, many companies included retrospective information for 2004 – or 2004–05 – in their first set of financial statements that implement FRS 17.
The population of companies covered for this analysis has been defined as regulated networks and/or operators in communications, electricity, gas, water and transport. In all of the cases examined, regulated companies operate with financial years ending in December or March. Thus, it is possible to compile relatively complete figures on pension valuations for the end of years from December 2003 or March 2004 (referred to as 2004) to December 2008 or March 2009 (referred to as 2009). This gives six annual observations (subject to changes in the end of the company's financial year) of the state of pension funds plus five observations of flows identifying how the balances changed from beginning to end of the year. Company splits or mergers – e.g. the sale by National Grid Transco of four gas distribution networks or the take-over of Mid-Kent Water by South East Water – complicate the sample. In the case of mergers, it is common for the merged entity to report separate information for the component entities.
In the transport sector, there is a case for including the rail operations of companies like National Express, Stagecoach, Go-Ahead Group and First Group in the sample. However, there are two complications. One is that most of the companies do not break down the contributions of their rail operations to the aggregate company figures for pension assets and liabilities. It is possible to examine the accounts for franchise subsidiaries, but the information provided is often rather sparse. The second difficulty is that special accounting provisions are required to deal with pension deficits or surpluses for franchises of limited duration. Each train franchise has a specific section of the Railways Pension Scheme (RPS). At the beginning of its franchise the train operating company takes on an obligation to fund any initial deficit for the franchise section over the life of the franchise and takes this into account when bidding for the franchise. This leads to the inclusion of substantial changes in pension assets and liabilities at the beginning and end of franchises together with annual franchise adjustments as inherited surpluses or deficits are written down. What one would really want is a record of the evolution of pension assets and liabilities for each franchise, but this is hard to construct because of changes in franchise operators.
Network Rail's decision to bring most maintenance in-house in 2003–04 means that the Network Rail section is the largest active section of the RPS. The second-largest active section is DB Schenker Rail (formerly EWS Railways), the rail freight operator which is not regulated. Many of the larger sections in the RPS cover contractors, service providers and non-regulated operators – e.g. Eurostar and Freightliner. The pension assets for the RPS sections covering franchised train operating companies amounted to £4.87 billion at the end of 2007 as compared with £3.55 billion for the Network Rail section. Since the RPS operates through an investment pool, it is unlikely that the circumstances of the train operating company sections is significantly different from that of Network Rail, which may be taken as representative of the regulated operating companies.
A separate problem concerns the reporting arrangements for parent companies and their subsidiaries. In the electricity sector, 13 of the 14 electricity distribution companies are owned by six companies – CE Electric, EDF, E-ON, Scottish & Southern, Scottish Power (now Iberdrola), and Western Power Distribution (WPD) – while Electricity North West (formerly United Utilities Electricity) is the only independent distribution company. In most cases, the pension schemes have been merged, either as sections of the Electricity Supply Pension Scheme (ESPS) for longstanding members or in new company-wide schemes. Some distribution subsidiaries – or their parent companies – provide separate information on their pension assets and liabilities, but more usually it is only possible to obtain information for the merged ESPS sections or company-wide pension schemes. The situation is similar for some of the water companies, though this applies to water only companies (WOCs) rather than the water and sewage companies (WASCs). Mergers mean that Veolia Water UK owns three WOCs – although the combined entity is dominated by Three Valleys Water – while South East Water has incorporated Mid-Kent Water.
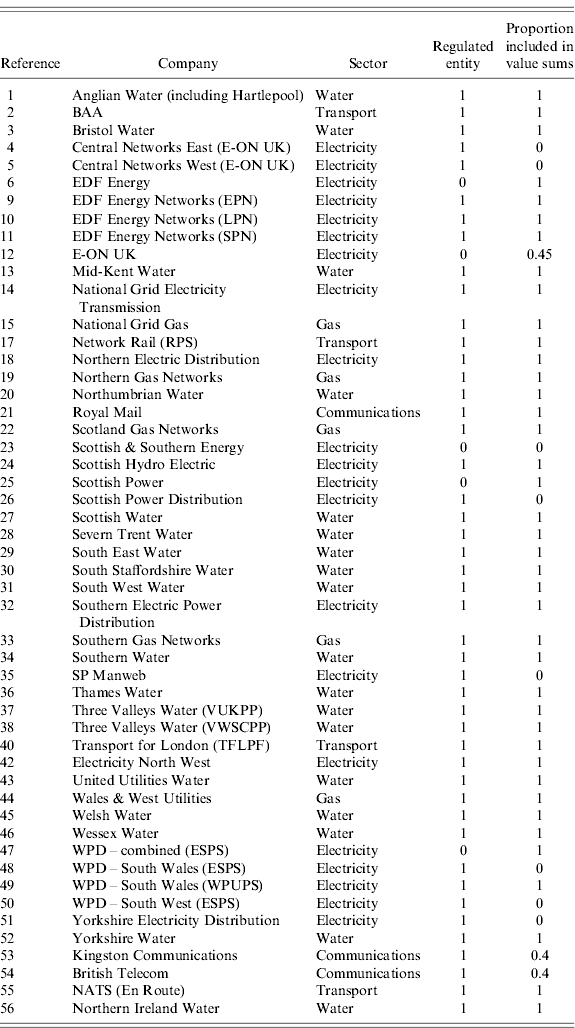
Since regulators must deal with regulated entities rather than their parent companies the database includes both the separate regulated units and their parent companies. Because several of the WOCs are very small, the database excludes companies with pension assets of less than £50 million. Each entry in the database is identified by (a) whether it refers to a regulated entity, and (b) whether it is included in the sums of pension assets and liabilities. This permits the construction of different samples that are used to examine the assumptions made by regulated entities and the aggregate values of pension assets and liabilities for all the companies in a sector or in the whole sample.
Two telecommunications companies required special treatment. The key concern focuses on BT which operates a regulated business – largely now under the Openreach name – as well as a variety of non-regulated businesses. The boundary between BT's regulated and non-regulated businesses has been gradually shifting as Ofcom has relaxed the regulatory controls applied to line rentals, etc. Since BT has the largest pension fund of any regulated or partly regulated company, it cannot be omitted from the sample. Equally, including the whole of BT's pension fund in the totals would give a misleading impression when constructing aggregates for all regulated companies. The assumption adopted to deal with this problem is that 40% of BT's pension fund should be treated as being linked to its regulated business and the remainder to its non-regulated business. This is a conservative assumption since Openreach employees accounted for 43% of BT employees excluding BT Global Services in March 2008. The main BTPS was closed in 2001, while BT Global Services is a business that has grown rapidly (partly by acquisition) since that date. Hence, it is very likely that Openreach and other regulated BT activities account for more than 50% of the membership and liabilities of BTPS. Kingston Communications is a much smaller company than BT, but it is in a very similar position with regulated and non-regulated activities. Again, it has been assumed that 40% of Kingston's pension fund should be allocated to the regulated business.
A similar exercise is necessary for E-ON UK's regulated distribution business – Central Networks. The annual accounts of the two distribution companies – Central Networks East and Central Networks West – do not provide separate information on their sections of the ESPS but simply refer to the E-ON UK accounts. At the end of 2004, the last year for which E-ON provides disaggregated information, the two Central Networks sections of ESPS accounted for about 45% of the total assets of the four E-ON sections of ESPS. I have assumed that this share can be applied to later years. Further, the regulated revenue for E-ON UK used in the analysis is based on the revenues of the company's distribution businesses and excludes revenues from its generation and supply businesses.
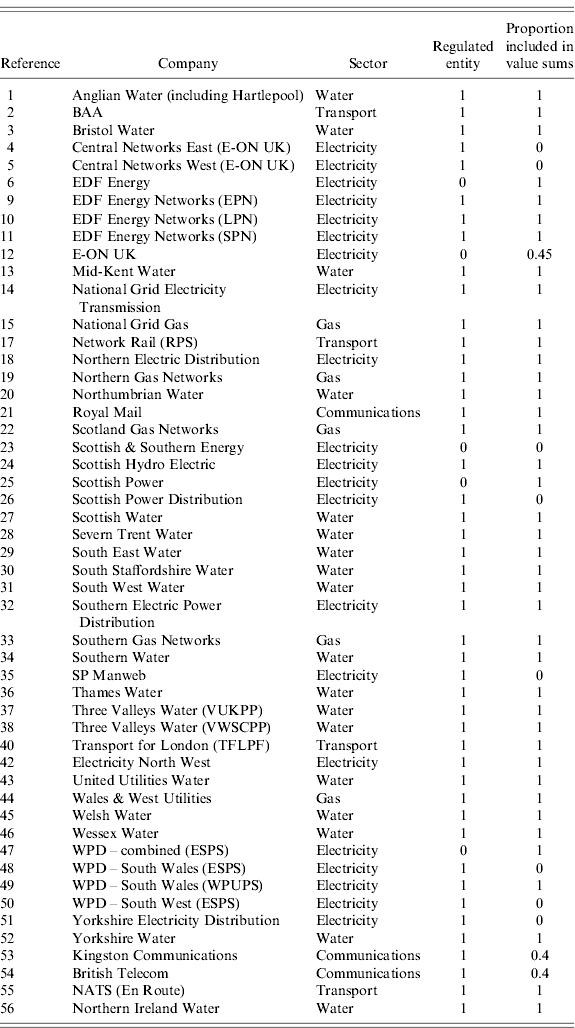
The table below lists the companies included in the database for the year 2008. There are multiple entries for WPD and its subsidiaries because it operates two significant pension schemes, one a combined section of ESPS, the other inherited when it took over the electricity distribution business in South Wales from Hyder. Similarly, Veolia Water UK – represented by Three Valleys Water – has two separate pension schemes, one a company scheme and the other a section of the former Water Supply Companies Pension Plan.
The final company in the list is Northern Ireland Water that was added for the year 2008–09 only. This is a special case because the company's pension fund was, in effect, established during 2008–09 for those members of the company's staff who exercised an option to transfer their pensions from the Northern Ireland civil service pension scheme to the new scheme.
Companies included in the database for the year 2009