Introduction
Bilinguals’ extensive experience with two systems for organizing acoustic and articulatory space presents a uniquely complex instantiation of a general problem in speech perception. Namely, the same acoustic material may be compatible with many interpretations, and the same phonological entities may vary acoustically depending on an enormous range of factors. For bilinguals, this many-to-many mapping between acoustic material and phonological representations may play out in different, partially overlapping, or directly conflicting ways in their two language systems.
There is, of course, ample evidence that what may correspond to two systems in a bilingual's experience is not entirely separate in the mind. Interactions in phonetic category structure (Flege, Reference Flege, Schiller and Meyer2003, Reference Flege2007), prosody (Dupoux, Pallier, Sebastián-Gallés & Mehler, Reference Dupoux, Pallier, Sebastián-Gallés and Mehler1997), and phonotactics (Altenberg & Cairns, Reference Altenberg and Cairns1983; Anisfeld, Anisfeld & Semogas, Reference Anisfeld, Anisfeld and Semogas1969; Cohen, Tucker & Lambert, Reference Cohen, Tucker and Lambert1967; Ernestus, Kouwenhoven & van Mulken, Reference Ernestus, Kouwenhoven and van Mulken2017) countenance substantial permeability of sound systems. This can lead to interference, but also to enhanced perception of phonetic contrasts, accented speech (Bent & Bradlow, Reference Bent and Bradlow2003; Chang, Reference Chang2016; Chang & Mishler, Reference Chang and Mishler2012; Hanulíková & Weber, Reference Hanulíková and Weber2012), and word segmentation (Hanulíková, Mitterer & McQueen, Reference Hanulíková, Mitterer and McQueen2011; Weber & Cutler, Reference Weber and Cutler2006) compared to monolinguals. Most of this work has focused on how the L1 influences the L2, but there is also evidence for L2 effects on the L1 (Caramazza, Yeni-Komshian & Zuriv, Reference Caramazza, Yeni-Komshian and Zurif1974; Flege & Eefting, Reference Flege and Eefting1987; Namjoshi, Tremblay, Spinelli, Broersma, Martínez-García, Connell, Cho & Kim, Reference Namjoshi, Tremblay, Spinelli, Broersma, Martínez-García, Connell, Cho and Kim2015; Tice & Woodley, Reference Tice and Woodley2012). Nonetheless, bilinguals are also remarkably good at maintaining the distinctness of language-specific sound patterns (Fowler, Sramko, Ostry, Rowland & Hallé, Reference Fowler, Sramko, Ostry, Rowland and Hallé2008; Gonzales & Lotto, Reference Gonzales and Lotto2013).
What, then, is the nature of bilinguals’ phonological systems, and how do they navigate both the overlap and distinctness of the two source systems? The evidence for both permeability and separateness suggests that bilinguals possess neither a single system nor two separate systems, but rather a hybrid system (Cook & Wei, Reference Cook and Wei2016; Goldrick, Putnam & Schwarz, Reference Goldrick, Putnam and Schwarz2016; Hall, Cheng & Carlson, Reference Hall, Cheng and Carlson2006; Otheguy, García & Reid, Reference Otheguy, García and Reid2015) in which corresponding structures across languages may be separate but linked, although how this plays out across specific structures and contexts is not yet clear. The present study seeks to shed light on this linkage by exploring its consequences for bilinguals’ speech perception when abstract constraints on sound sequences lead to conflicting interpretations of the same acoustic material.
This question will be explored by examining Spanish–English bilinguals’ perception of word-initial [s]-consonant clusters (#sC). These clusters are impossible in Spanish, and foreign loanwords with #sC are obligatorily adapted via [e] prothesis, e.g., snob was adopted as esnob. In English, however, words beginning with #sC are abundant. This conflict in phonotactic patterning may lead bilinguals to perceive #sC clusters differently, compared to Spanish monolinguals.
Spanish monolinguals tend to perceive #sC sequences as if they were #esC. They report hearing [e], but not other vowels, preceding #sC (Cuetos et al., Reference Cuetos, Hallé, Domínguez and Segui2011), and they have greater difficulty discriminating #VsC stimuli with a short initial vowel from identical stimuli bearing a robust [e], vs. a robust [a] (Carlson et al., Reference Carlson, Goldrick, Blasingame and Fink2016). Moreover, in lexical decision they readily accept #esC words missing their initial vowel, e.g., [skwela] for escuela “school”, but not words missing other initial vowels, e.g., [spiɾina] for aspirina “aspirin” (Hallé, Segui, Dominguez & Cuetos, Reference Hallé, Segui, Dominguez, Cuetos, Jaichenco and Sevilla2013), a finding that extends even to visual word processing (Hallé, Dominguez, Cuetos & Segui, Reference Hallé, Dominguez, Cuetos and Segui2008). This mirrors perceptual illusions observed in other languages (Dupoux, Kakehi, Hirose, Pallier & Mehler, Reference Dupoux, Kakehi, Hirose, Pallier and Mehler1999; Pitt, Reference Pitt1998; Polivanov, Reference Polivanov1931), where listeners perceive sound sequences that are unrepresentable in their phonology as the most likely representable alternative (Berent & Lennertz, Reference Berent and Lennertz2010; Berent, Lennertz & Rosselli, Reference Berent, Lennertz and Rosselli2012; Berent, Lennertz, Smolensky & Vaknin-Nusbaum, Reference Berent, Lennertz, Smolensky and Vaknin-Nusbaum2009; Berent, Steriade, Lennertz & Vaknin, Reference Berent, Steriade, Lennertz and Vaknin2007; Kabak & Idsardi, Reference Kabak and Idsardi2007). Careful manipulation of coarticulatory features (Dupoux, Parlato, Frota, Hirose & Peperkamp, Reference Dupoux, Parlato, Frota, Hirose and Peperkamp2011) and similarity to lexical items (Dupoux, Pallier, Kakehi & Mehler, Reference Dupoux, Pallier, Kakehi and Mehler2001; Hallé et al., Reference Hallé, Segui, Dominguez, Cuetos, Jaichenco and Sevilla2013) confirms the phonological nature of these illusions. However, the specific percept can also be shaped by acoustic details (Davidson, Reference Davidson2011; Davidson & Shaw, Reference Davidson and Shaw2012), perceptual compensation (Gaskell, Reference Gaskell2001), other phonological processes (Durvasula & Kahng, Reference Durvasula and Kahng2015), and similarity to known lexical items (Ganong, Reference Ganong1980; Samuel, Reference Samuel1981).
Unlike monolinguals, early Spanish–English bilinguals, especially those dominant in English, are unlikely to report hearing [e] when no vowel is present, and they are less susceptible than monolinguals to the effects of perceptual repair on auditory discrimination (Carlson et al., Reference Carlson, Goldrick, Blasingame and Fink2016). This apparent weakening of the perceptual illusion may reflect interacting phonotactic systems, but it could simply be that the early bilinguals never acquired the illusion. Evidence that conflicting phonotactic patterns can jointly influence perception is also found in Japanese–Brazilian Portuguese bilinguals, but only in explicit vowel identification, and not in a more implicit test of perception (Parlato-Oliveira, Christophe, Hirose & Dupoux, Reference Parlato-Oliveira, Christophe, Hirose and Dupoux2010), making the nature of any interaction between phonotactic systems unclear.
What happens in late Spanish–English bilinguals, who encounter English phonotactics after acquiring a stable Spanish system? Most saliently, their English strongly reflects filtering through Spanish [e]-prothesis, e.g., school is treated as [eskul], in both production (Abrahamsson, Reference Abrahamsson1999; Carlisle, Reference Carlisle1991, Reference Carlisle1999; Daland & Norrmann-Vigil, Reference Daland and Norrmann-Vigil2015) and perception (Freeman, Blumenfeld & Marian, Reference Freeman, Blumenfeld and Marian2016). However, they nonetheless rapidly develop awareness that #sC clusters are possible in English (Altenberg, Reference Altenberg2005), and can learn the relative well-formedness of different #sC clusters (Lentz & Kager, Reference Lentz and Kager2015). L1 filtering therefore does not altogether prevent learning of conflicting phonotactic patterns, allowing the possibility of changes in late bilinguals’ L1 Spanish speech perception. This prediction is borne out by auditory discrimination data (Carlson, published online April 9, 2018). Late bilinguals, like early bilinguals, outperformed monolinguals slightly, but more substantial effects occurred in response times. Late bilinguals were slower when the two phonotactic systems conflicted directly, i.e., when the Spanish illusion was expected to render the stimuli maximally confusable, and this effect was larger for bilinguals currently immersed in English, but completing the experiment in Spanish.
It makes sense to attribute these changes in Spanish speech perception to knowledge of the English pattern, but how exactly would this work? On the one hand, experience hearing English #sC words may allow even late bilinguals to retune their perception of acoustic #sC sequences in favor of the veridical percept, during intense contact with English, e.g., immersion (Carlson, published online April 9, 2018). On the other hand, the now massive evidence for co-activation of two systems in bilinguals at all levels of linguistic structure (e.g., Hartsuiker, Pickering & Veltkamp, Reference Hartsuiker, Pickering and Veltkamp2004; Kroll, Bobb & Wodniecka, Reference Kroll, Bobb and Wodniecka2006; Kroll & Gollan, Reference Kroll, Gollan, Goldrick, Ferreira and Miozzo2014; Lauro & Schwartz, Reference Lauro and Schwartz2017) suggests that changes to L1 speech perception may reflect real-time interaction between the two systems. Given a view of speech perception that involves the evaluation of multiple candidates against both incoming information from the environment and the expectations of the perceiver (Apfelbaum, Bullock-Rest, Rhone, Jongman & McMurray, Reference Apfelbaum, Bullock-Rest, Rhone, Jongman and McMurray2014; Apfelbaum & McMurray, Reference Apfelbaum and McMurray2014; Feldman, Griffiths & Morgan, Reference Feldman, Griffiths and Morgan2009; Kleinschmidt & Jaeger, Reference Kleinschmidt and Jaeger2015; Norris, McQueen & Cutler, Reference Norris, McQueen and Cutler2016), bilinguals’ perception of #sC would reflect competition between #esC, consistent with Spanish phonotactics, and the veridical percept made available through English phonotactics.
We are now in a position to state a more specific hypothesis concerning late Spanish–English bilinguals’ perception of #sC. Namely, while they learn to perceive #sC veridically, this does not displace the Spanish-like perceptual illusion. Rather it provides a new phonetic representation for the same acoustic material, affecting speech perception by introducing competition between alternative representations (rather than from relaxation or retuning of category boundaries, cf. Gonzales & Lotto, Reference Gonzales and Lotto2013; Llanos & Francis, Reference Llanos and Francis2017). That is, Spanish–English bilinguals may represent acoustic #sC as either #esC or as #sC, while only #esC is possible for Spanish monolinguals.
If this is true, then manipulating the degree of competition between the Spanish- and English-like competitors over the short term, by activating English, inhibiting Spanish, or both (Antoniou, Best, Tyler & Kroos, Reference Antoniou, Best, Tyler and Kroos2010, Reference Antoniou, Best, Tyler and Kroos2011; Dijkstra, van Jaarsveld & ten Brinke, Reference Dijkstra, van Jaarsveld and ten Brinke1998; Lauro & Schwartz, Reference Lauro and Schwartz2017), should lead to changes in the strength of the Spanish perceptual illusion (cf. Athanasopoulos, Bylund, Montero-Melis, Damjanovic, Schartner, Kibbe, Riches & Thierry, Reference Athanasopoulos, Bylund, Montero-Melis, Damjanovic, Schartner, Kibbe, Riches and Thierry2015; Chang, Reference Chang2012, Reference Chang2013; Grosjean, Reference Grosjean1989; Grosjean & Miller, Reference Grosjean and Miller1994; Olson, Reference Olson2013; Sancier & Fowler, Reference Sancier and Fowler1997). If not, then the illusion should be stable over the short term.
To manipulate the degree of competition between English and Spanish in the present experiment, late Spanish–English bilinguals performed tasks (which did not involve listening to speech) either in English (henceforth the English-switch group) or Spanish (the no-switch group) immediately before completing speech perception tasks in Spanish. The focus was on late bilinguals to ensure that a stable L1 system had been established prior to learning English, and the bilinguals were currently residing in a Spanish-dominant environment, to minimize baseline contact with English. Similar short-term manipulation of language context has been shown to modulate crosslinguistic competition in lexical processing (Elston-Güttler & Gunter, Reference Elston-Güttler and Gunter2008; Elston-Güttler, Gunter & Kotz, Reference Elston-Güttler, Gunter and Kotz2005) and speech production (Balukas & Koops, Reference Balukas and Koops2015; Goldrick, Runnqvist & Costa, Reference Goldrick, Runnqvist and Costa2014; Olson, Reference Olson2016a, Reference Olson2016b; Simonet, Reference Simonet2014).
This manipulation was carried out in two experiments, using auditory discrimination (Carlson, published online April 9, 2018; Carlson et al., Reference Carlson, Goldrick, Blasingame and Fink2016) and auditory lexical decision (Dupoux et al., Reference Dupoux, Pallier, Kakehi and Mehler2001; Hallé et al., Reference Hallé, Segui, Dominguez, Cuetos, Jaichenco and Sevilla2013) to explore how bilinguals’ perception of #sC plays out under different processing demands and decision criteria. In discrimination, stimuli are compared directly, whereas lexical decision tests the acceptability of single stimuli as tokens of known lexical items. This contrast in task conditions may further modulate the role and relevance of the veridical percept, shedding further light on how bilinguals navigate their interacting phonotactic systems.
Experiment 1: AX discrimination
Methods
Participants
Thirty-two late Spanish–English bilinguals (mean age 25.5 years sd = 6.8) were recruited at the University of Granada, Spain, through flyers posted on campus.Footnote 1 The data from the 14 Spanish monolinguals in Carlson et al. (Reference Carlson, Goldrick, Blasingame and Fink2016), which were collected in the same location using the same materials, were used as the monolingual baseline. The monolinguals likely had taken English classes in school, but had little experience or ability to use it.Footnote 2 Sample size was determined on the basis of prior studies using similar methods (e.g., Carlson et al., Reference Carlson, Goldrick, Blasingame and Fink2016).
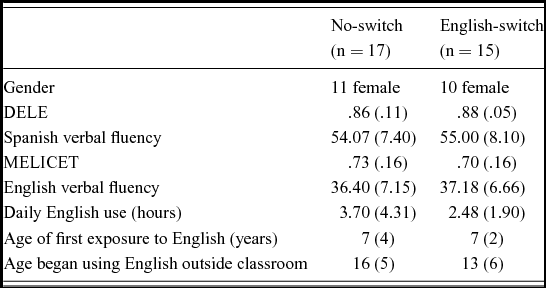
Language proficiency was assessed using cloze tests adapted from the DELE (Spanish; Ministry of Education, Culture, and Sport of Spain, 2006) and MELICET (English; English Language Institute, 2001), and verbal fluency tasks in both languages. For the latter, participants had 30s to produce as many words as possible in each of a series of categories (clothing, animals, furniture, and fruits), scored as the total number of unique, category-appropriate words produced. Participants also completed a language background questionnaire (Li, Zhang, Tsai & Puls, Reference Li, Zhang, Tsai and Puls2014).
The late bilinguals were first exposed to English in school around age 7, but this was probably also the case for the monolinguals, who grew up in the same school system. The age at which the bilinguals first began using English outside the classroom (around age 14) is therefore probably a better measure of when they learned to use English.
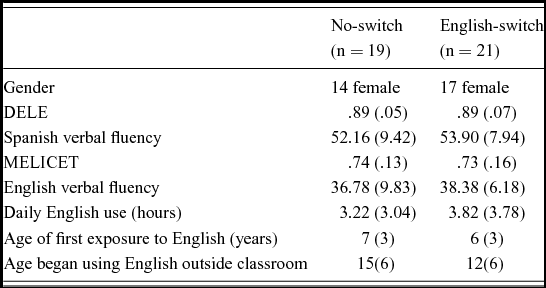
Proficiency scores, self-reported daily English usage, and age of acquisition statistics are shown in Table 1. No group differences emerged on any of these measures (all p > .18).
Participant characteristics (mean (sd)) for bilinguals in Experiment 1.

Materials
Two discrimination paradigms are commonly used to study perceptual illusions such as the one examined here, AX and ABX. AX was chosen here, for several reasons. First, it allows direct comparison with the results of Carlson et al. (Reference Carlson, Goldrick, Blasingame and Fink2016) and Carlson (published online April 9, 2018), whose materials were adopted here. Second, AX can be configured to focus on fine acoustic differences (as described below). Although word-sized stimuli such as in this study may increase difficulty, making participants more likely to encode acoustic detail via phonetic categories (Davidson & Shaw, Reference Davidson and Shaw2012), this encoding is required in ABX, due to the memory demands of comparing three stimuli. AX thus provides a better test of how the availability of different phonetic representations changes the interplay of acoustic detail and phonetic representation, which is the primary focus here.
One criticism of AX is that listeners may apply different thresholds for detecting differences, making it hard to distinguish participants’ ability to discriminate from their willingness to ignore the difference. However, the goal here is not to determine whether bilinguals can detect the relevant acoustic details (changes relative to the monolingual baseline would imply that they can), but rather how they balance acoustic correctness (favored by English), with linguistic correctness in Spanish (the language of the task), with the prediction that bilingualism and recent English use will boost the importance of acoustic correctness.Footnote 3
Participants were told that they would hear pairs of possible Spanish words and asked to decide whether they were “identical” or not. The pseudowords had the form VsCid. The V was either [e] (the default prothetic vowel) or [a] (the next most common vowel in this position), and the C was one of those that follow #Vs in existing Spanish words, [b, d, g, p, t, k, f, m, n, l], resulting in 10 pairs of pseudowords differing only in their initial vowel, e.g., [aspið], [espið]. The pseudowords were recorded by a female native speaker of Mexican Spanish, with Spanish pronunciation (e.g., spirantization of final /d/ and final stress).Footnote 4 Stimuli from only one speaker were used in order to focus attention on acoustic detail as much as possible.
Two stimuli were created from each pseudoword by removing a portion of the initial vowel, leaving either 10 periods of phonation (about 40 ms, just under half its original duration), or 2.5 periods. Thus, in half the stimuli the initial vowel was long enough to be unambiguous, and in half it was too short to reliably determine its quality, or even to unambiguously distinguish it from a cough or other non-speech sound. Stimuli with the initial vowel completely removed were not included, because the bilinguals in Carlson et al. (Reference Carlson, Goldrick, Blasingame and Fink2016) showed little evidence of perceiving an illusory vowel when no vocalic material was present, and to avoid making the task too long or complicating comparison with the earlier results.
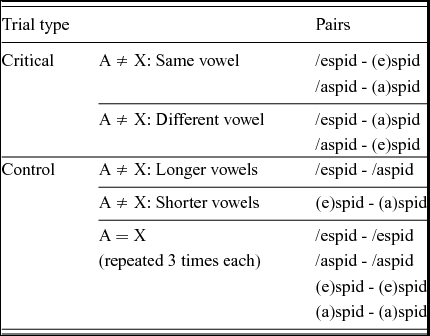
This yielded 10 sets of 4 stimuli sharing the same consonant following [s]. On each trial two stimuli from the same set were presented, such that the only differences involved the quality ([a] or [e]) and/or duration of the initial vowel (longer vs. shorter).Footnote 5 Since there are 6 ways to select two different stimuli from each set, and two ways of ordering each pair, this resulted in 120 AX trials in which the two stimuli were acoustically different. In an additional 120 trials, each of the 40 stimuli was paired with itself 3 times, such that exactly half the trials contained acoustically identical stimuli. The order of trials was randomized by participant. This, together with the generally subtle differences between stimuli and a brief ISI (250 ms, cf. Davidson, Reference Davidson2011) was designed to focus attention on detecting fine acoustic differences. Table 2 provides an example of the trials generated from one of the sets.
Example of trials generated from one set of stimuli sharing the same post-[s] consonant. The forward slash, /espid, indicates the longer (half-length) vowel, and parentheses around the vowel, (e)spid, indicates the shorter vowel. A ≠ X pairs were presented in both orders, and A = X pairs were presented 3 times each, in order to achieve equal proportions of A = X and A ≠ X trials.

The critical AX pairs were the 80 trials in which the duration of the initial vowels differed, because this allows us to determine whether the shorter vowel is more difficult to discriminate from the longer [e] (the longer-[e] pairs) than from the longer [a] (the longer-[a] pairs), as predicted by Spanish phonotactics. The remaining trials served as controls, indicating baseline performance when discrimination was expected to be easy (the 20 pairs with longer vowels of contrasting quality), difficult (the 20 pairs with shorter vowels of contrasting quality), or impossible (the 120 acoustically identical pairs).
Each trial began with a centered fixation (+), with the first stimulus played concurrently on studio quality headphones at a comfortable level. A 250 ms pause preceded the second stimulus. Participants responded on a button box, followed by a 500 ms blank screen before the next trial. Response times (RTs) were measured from the onset of the second stimulus, i.e., the locus of the experimentally manipulated initial vocalic material. The first 16 trials were considered practice.
Procedure and prior language context manipulation
The experimenter was a near-native speaker of Castilian Spanish and native speaker of American English. Interaction occurred in the language of whichever task was current. Participants gave informed consent in Spanish. To manipulate prior language context, with half the bilinguals (the English-switch group, randomly assigned), the experimenter then switched to English, and participants completed the MELICET and English verbal fluency task. With the no-switch group, interaction remained in Spanish, and participants completed the DELE and Spanish verbal fluency. This took 10–15 minutes. All participants followed the experimenter's language choice for incidental interaction at all times.
After this, the experimenter signaled a switch back to Spanish (for the English-switch group) and the AX task began. Subsequently, participants completed the DELE/MELICET and verbal fluency in the other language, followed by the background questionnaire. Testing occurred in a quiet room at the University of Granada.
Predictions
Spanish phonotactics should cause the shorter vowel to be perceived as [e], leading to more “same” responses on longer-[e] pairs vs. longer-[a] pairs. Knowing English, however, is expected to allow bilinguals to perceive the shorter vowel items more veridically, facilitating discrimination of the longer-[e] pairs (Carlson et al., Reference Carlson, Goldrick, Blasingame and Fink2016). If this effect reflects competition between veridical (English-like) and repaired (Spanish-like) phonetic representations, and not merely the retuning of speech perception in an English-dominant environment, then activating English via the verbal fluency and cloze tasks should also lead to longer response times for longer-[e] pairs in the English-switch group, as it did for the bilinguals immersed in English (Carlson, published online April 9, 2018), and possibly greater accuracy for longer-[e] pairs. In addition, the effects of switching from English might decay during the task, as has been found for lexical access (Elston-Güttler & Gunter, Reference Elston-Güttler and Gunter2008; Elston-Güttler et al., Reference Elston-Güttler, Gunter and Kotz2005), leading to changes in group differences as a function of trial number.
Results
Prior to analysis, 74 trials with RTs longer than 4000 ms were removed from the bilinguals’ data (1% of the data). There were no trials with RT < 200 ms, so no lower cutoff was applied.
Accuracy
Since accuracy is a binary dependent variable, it was analyzed using mixed effects logistic regression, fit using the lme4 package in R (Bates, Maechler, Bolker & Walker, Reference Bates, Maechler, Bolker and Walker2015; R Core Team, Reference Core Team2016). Significance was assessed via leave-one-out model comparison using likelihood-ratio tests.
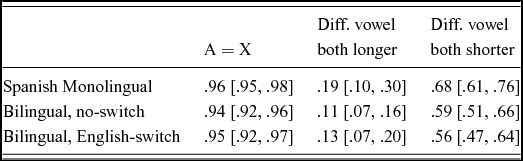
The participant groups (monolingual, no-switch bilingual, English switch bilingual; henceforth languageGroup) were first compared on the three subsets of control trials (see Table 2). Mean rates of same responses are shown in Table 3. All groups were near ceiling when the A and X were acoustically identical, and discrimination was uniformly accurate (few same responses) when both stimuli had longer vowels of different quality, where discrimination was expected to be easiest. Separate mixed-effects logistic regressions for these control trial types revealed no differences between groups (all p > .15).Footnote 6 For control trials with two shorter vowels of different quality, where discrimination was expected to be difficult, monolinguals responded same at a higher rate than chance, and bilinguals responded approximately at chance. This group difference was significant (in a mixed-effects logistic regression, β = −0.50, SE = 0.24, χ2(1) = 4.23, p = .040).
Proportion of same responses for control AX trials, with 95% CIs computed by nonparametric bootstrap.

In the analysis of the critical trials the fixed effects of primary interest were longerV (longer-[a] vs. longer-[e] pairs) and languageGroup (monolingual, no-switch bilingual, English-switch bilingual). LongerV tested the discriminability of the shorter vowels from each longer vowel, i.e., the strength of Spanish perceptual repair, and its interaction with languageGroup tested whether bilingualism or recent English use modulated the strength of the perceptual repair. An additional factor (matchingV) was added to capture sensitivity to slight acoustic differences in AX pairs with differing initial vowel qualities (see Table 2), which led to better discrimination of these pairs (see Table A1), but its interactions with longerV and languageGroup were not significant (all p > .20), and as it does not bear directly on the perceptual illusion, it is not commented on further. To probe for short-term decay of the English-switch effect, trialNumber (as a continuous variable) and its interactions with longerV and languageGroup were explored but no significant effects or interactions emerged (all p > .12) and it was omitted from the final model. Effects of the consonant following the [s] were explored visually, but no salient trends emerged. The maximal random effects structure by-participant was included. Complete estimates of the fixed effects, and further details about the coding of predictors and the random effects structure are reported in Appendix A, Table A1.
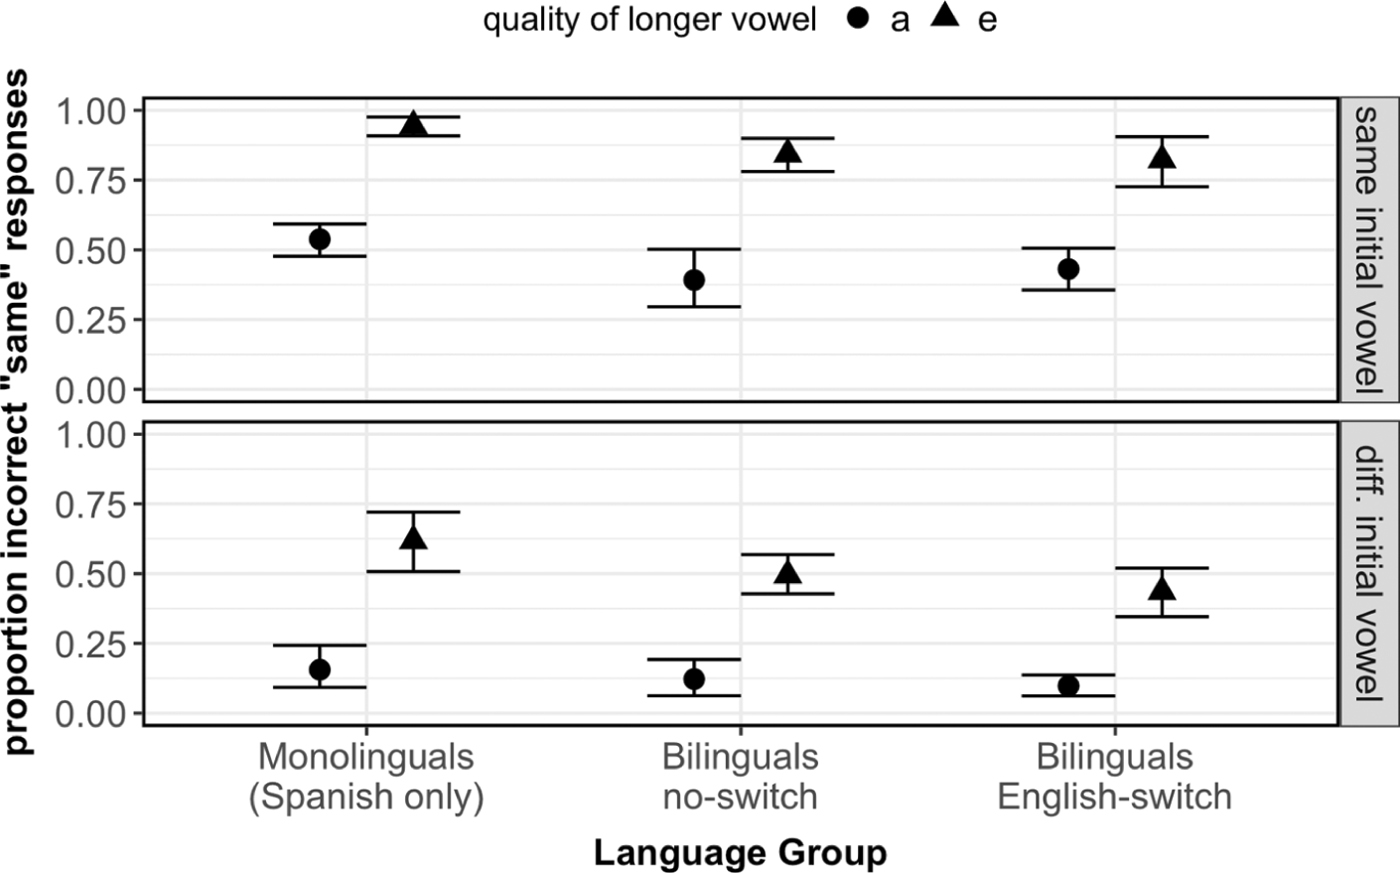
Accuracy on the critical pairs is shown in Figure 1. Note that the y-axis shows the proportion of same responses, i.e., when participants failed to discriminate the pair. Discrimination accuracy was substantially worse (more same responses) when the longer vowel was [e], compared to [a], confirmed by the significant main effect of longerV (β = 2.38, SE = 0.15, χ2(1) = 93.37, p < .0001). Bilinguals discriminated the critical pairs better overall than monolinguals, confirmed by the significant effect of bilingualCode (β = −0.74, SE = 0.22, χ2(1) = 10.19, p = .001), but while the size of the longerV effect was numerically smaller for bilinguals, the interaction of bilingualCode with longerV did not reach significance (β = −0.49, SE = 0.31, χ2(1) = 2.41, p = .12). No differences were found between the no-switch and English-switch groups (all p > .38).
Proportion of incorrect same responses to critical AX pairs, with 95% CIs computed by nonparametric bootstrap. Top panel shows pairs with the same initial vowel quality, which are acoustically identical apart from the duration of the vowel, and the bottom panel shows pairs with a different initial vowel.

Response time
RTs were analyzed using linear mixed effects regression, using the same model structure as the accuracy results. RTs were negative reciprocal transformed (x1000), which better approximated a normal distribution than a log transformation, as confirmed by inspection of q-q plots. Acoustically correct and incorrect responses were analyzed in separate models, but no effects or interactions of longerV were found for incorrect responses, and they will not be considered further. As above, effects of trialNumber were explored. A significant main effect of trialNumber emerged, whereby participants responded more quickly as the task progressed, but it did not interact with other predictors (all p > .17) and only the main effect was retained. Complete fixed effects for both models are given in Appendix A, Table A2.
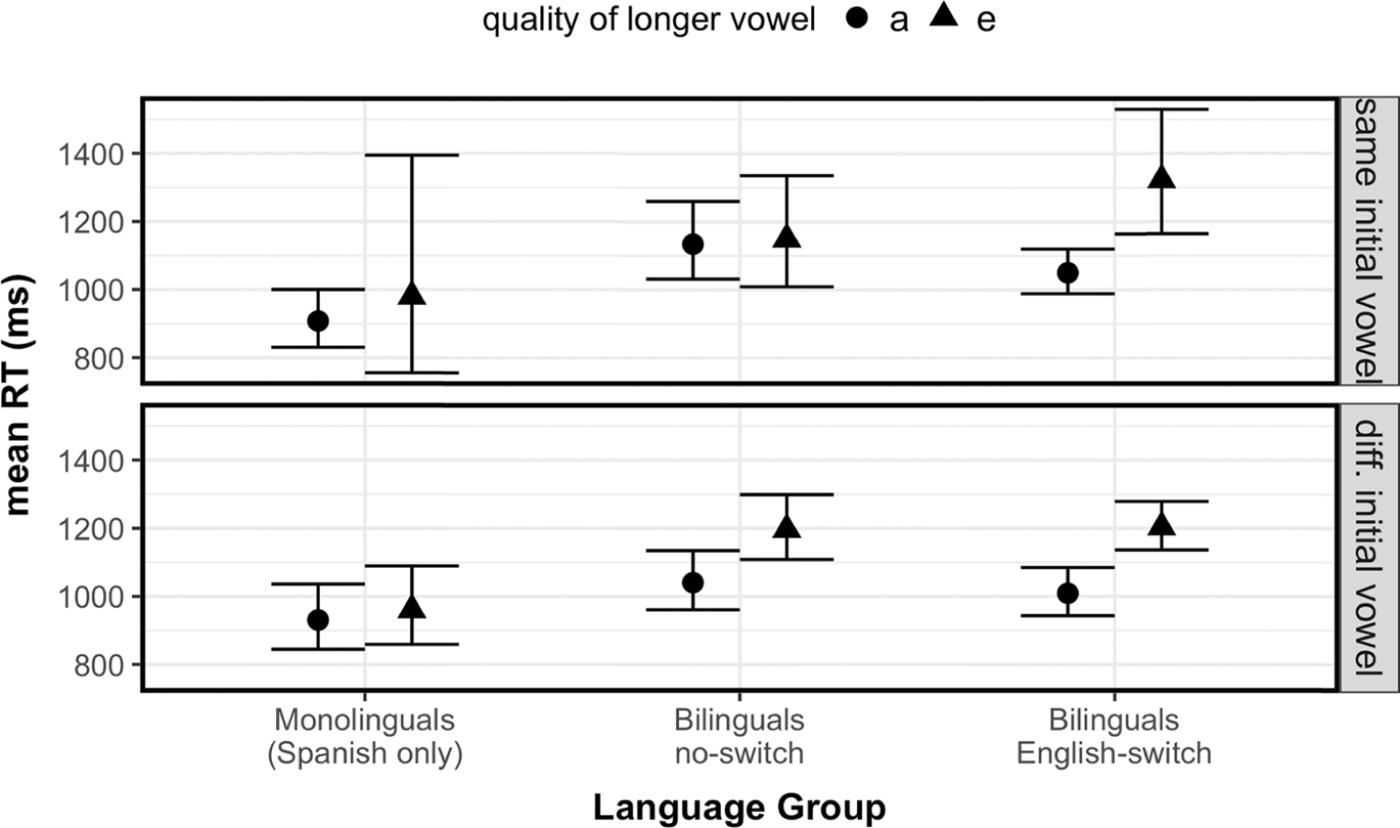
Mean RTs for correct responses (where participants correctly discriminated the stimuli) are shown in Figure 2. A three-way interaction of longerV by bilingualCode by matchingV (β = 0.24, SE = 0.09, χ2(1) = 6.62, p = .010), and a two-way interaction of longerV by priorLangCode (β = 0.08, SE = 0.04, χ2(1) = 3.90, p = .048) were found. To unpack these interactions, consider first the monolingual vs. bilingual results. For monolinguals, the completely overlapping CIs reveal no influence of the longer vowel's quality on correct RTs, but bilinguals consistently responded more slowly when the longer vowel was [e], except for the no-switch group's responses when the initial vowels in the pair were the same. Separate models of the monolinguals’ and bilinguals’ data (with Bonferroni-corrected α = .025 for two comparisons) confirmed the lack of a longerV effect for monolinguals (β = 0.08, SE = 0.07, χ2(1) = 1.32, p = .25), and a significant longerV effect for bilinguals (β = 0.10, SE = 0.02, χ2(1) = 21.26, p < .0001).
Mean RT (in milliseconds) for correct different responses, with 95% CIs. Top panel shows critical AX pairs with the same initial vowel quality, which are acoustically identical apart from the duration of the vowel, and bottom panel shows pairs with a different initial vowel.

Turning to the comparison between the two bilingual groups, separate models (with Bonferroni-corrected α = .025) for the English-switch and no-switch groups showed a highly significant longerV effect in the English-switch group (β = 0.15, SE = 0.03, χ2(1) = 17.96,p < .0001), but none in the no-switch group (β = 0.06, SE = 0.03, χ2(1) = 4.72, p = .030). However, despite the nonsignificant three-way interaction of longerV by priorLangCode by matchingV in the full model (p = .25), inspection of the CIs in Figure 2 suggests that the two bilingual groups differed from each other primarily on pairs with matching initial vowels.
To summarize, bilinguals responded more slowly overall in the AX task, and when they correctly discriminated the critical pairs, they were slower to discriminate longer-[e] pairs than longer-[a] pairs, with a larger effect being observed when the English proficiency tasks were given immediately prior to the AX task.
Discussion
The two dependent variables in Experiment 1 tell somewhat different stories about the influence of English on Spanish–English bilinguals’ perception of #sC. The accuracy results suggest a stable illusory vowel effect across all groups, reflected in substantially poorer discrimination when the longer vowel was [e]. Bilinguals’ small, generalized improvement in discrimination may simply reflect greater caution or attention to acoustics (consistent with their overall slower performance and superior discrimination of the control trials with two short vowels). In contrast, RTs revealed significant effects of bilingualism and immediate prior use of English on listeners’ sensitivity to the longer vowel's quality. Interestingly, it was the bilinguals, primarily in the English-switch group, whose RTs depended on the longer vowel's quality, being slower when it was [e].Footnote 7
Experimentally introducing a brief interval of L2 English use in an otherwise Spanish-speaking environment thus produced the same results that Carlson (published online April 9, 2018) found for bilinguals during English immersion. This provides strong experimental evidence for the hypothesis that these effects reflect coactivation of the English and Spanish systems in real-time processing, and not merely retuning of perception through long-term exposure to English.
Let us consider how the slower responses to longer-[e] pairs observed in the English-switch group support this conclusion. First, the presence of an effect shows that the bilinguals, particularly after using English, are sensitive to the subtle distinction in vowel length on these trials, even if it does not impact their final decisions. The lack of an RT effect in the monolinguals does not necessarily mean that they could not detect the difference, but, if they could, they appear to have ignored it completely.
Moreover, (as Carlson, published online April 9, 2018, points out) what makes the longer-[e] pairs special is that Spanish and English phonotactics point to conflicting responses in this task, suggesting that competition drives the present findings (cf. Altenberg & Cairns, Reference Altenberg and Cairns1983; Goldrick et al., Reference Goldrick, Runnqvist and Costa2014). To see how this plays out, consider how each phonotactic system contributes to perception of the stimuli with shorter initial vowels. In Spanish, it is impossible to represent the stimulus as #sC, and the vowel is overwhelmingly more likely to be [e] than [a]. In English, however, #sC is also possible and, if anything, more likely, since #VsC is relatively infrequent in English (Carlson et al., Reference Carlson, Goldrick, Blasingame and Fink2016). When the longer vowel is [a], there is no conflict – neither #esC nor #sC matches #asC, and both languages support discrimination. When the longer vowel is [e], however, Spanish favors a same response, while English favors discrimination.
Bilinguals’ slower responses when correctly discriminating longer-[e] vs. longer-[a] pairs can thus be interpreted as reflecting the need to resolve competition between the responses associated with language-specific representations of the short vowel stimulus, and not merely an improved ability to attend to acoustic detail.Footnote 8 This resembles results showing that bilinguals recognize interlingual homographs more slowly in unilingual lexical decision, when real but non-target language words must be rejected, but more quickly in bilingual lexical decision, where words in either language are to be accepted (Dijkstra et al., Reference Dijkstra, van Jaarsveld and ten Brinke1998). The parallel is that responses are fast when both languages point to the same response, and slow when they lead to conflicting responses.
Why, then, would this competition not also reduce the dependence of bilinguals’ discrimination accuracy on the longer vowel's quality? The answer is that competition does not so much weaken the perceptual illusion as activate an alternative representation in parallel, and given the ambiguity of the AX task (where participants’ thresholds for detecting difference may differ), and the ambiguity of the shorter-vowel items (where too little vocalic material was present to unambiguously indicate the presence of a vowel), either representation could be construed as correct. Nonetheless, in a task explicitly identified as being in Spanish, with phonetically Spanish stimuli, the linguistically appropriate alternative is #esC, and competition from #sC was apparently not enough to prevent the bilinguals from choosing #esC. This suggests an interesting prediction for future research. Namely, if participants were less certain that the stimuli were supposed to be Spanish, e.g., if they were recorded with an English accent, or with a mixture of Spanish- and English-like phonetic features (cf. Gonzales & Lotto, Reference Gonzales and Lotto2013), bilinguals’ responses would depend on what language they thought they were listening to.
Experiment 2
If bilinguals represent the same acoustic material in two contrasting ways simultaneously, how might this affect performance in a task where the illusion is useful, e.g., when it can restore a missing or distorted sound (Spinelli & Gros-Balthazard, Reference Spinelli and Gros-Balthazard2007)? Experiment 2 addresses this question using a lexical decision task (LDT) in which Spanish #VsC words are sometimes presented with their initial vowel removed. Monolinguals’ behavior when the missing vowel matches vs. mismatches the illusory [e] will be taken to indicate the strength of prelexical repair of reduced speech tokens (see above; Dupoux et al., Reference Dupoux, Pallier, Kakehi and Mehler2001; Hallé et al., Reference Hallé, Segui, Dominguez, Cuetos, Jaichenco and Sevilla2013), providing a baseline against which to assess the effects of knowing and recently using English.
Methods
Participants
Fourteen functional Spanish monolinguals (7 female) and 40 Spanish–English bilinguals were recruited in Granada, Spain as in Experiment 1 (mean age 23.4 years, sd = 3.04).Footnote 9 Bilinguals were assigned randomly to the English-switch or no-switch groups, as in Experiment 1. Sample size was determined on the basis of prior studies using similar methods (e.g., Dupoux et al., Reference Dupoux, Pallier, Kakehi and Mehler2001).
As in Experiment 1, the bilinguals completed the background questionnaire, DELE, MELICET, and English and Spanish verbal fluency tasks. Their mean scores, along with self-reported daily English usage are shown in Table 4. No differences were found between the two bilingual groups on any of these measures (all p > .13).
Mean (sd) proficiency and daily English usage for bilinguals in Experiment 2.

All participants had been exposed to English in school, but the functional monolinguals reported significantly lower skill in speaking, reading, and comprehending spoken English (all p < .0002), and none reported regular use of English. Participants reported no substantial knowledge of other languages except for 3 of the bilinguals, who had knowledge of Catalan or Gallego. They were retained, as above, but excluding their data did not change the pattern of results.
Materials
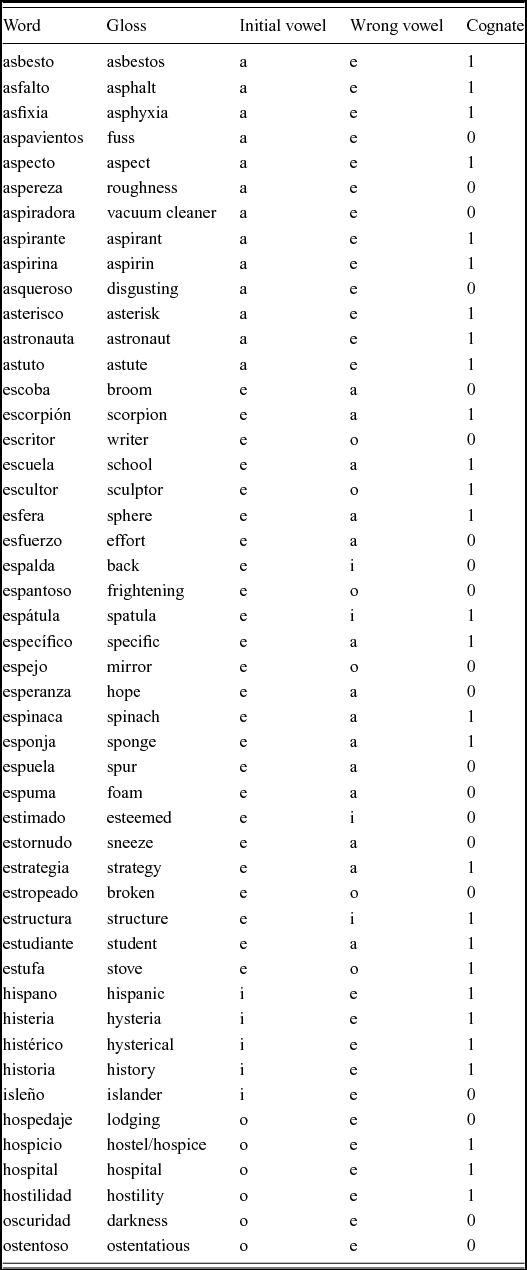
The critical words for the LDT were 48 Spanish words beginning with #VsC (listed in Appendix B). Half began with the Spanish default prothetic vowel /e/ (E-words) and half with /a, i, o/ (notE-words). Words beginning with #usC are rare in Spanish and were omitted. These words were randomly selected from among the 711 inflectional families with initial #VsC, occurring in SUBTLEX-ES (Cuetos Vega, Glez Nosti, Barbón Gutiérrez & Brysbaert, Reference Cuetos Vega, Glez Nosti, Barbón Gutiérrez and Brysbaert2011), with the following criteria. Words with initial stress (uncommon in #VsC words) multiple derivational affixes, and English loanwords (e.g., escáner, “scanner”) were excluded, but cognates and non-cognates were allowed and balanced as much as possible. Words with initial orthographic h, which is silent in Spanish, were allowed, since the task was purely auditory. The few cases where two #VsC words were highly similar apart from the initial vowel (e.g., escudo, oscuro, “shield”, “dark” differ only in the manner of articulation of one consonant) were also excluded. Upper and lower frequency cutoffs were fixed to ensure that the E and notE-words were all reasonably frequent and comparably distributed across the same overall frequency range. The consonants following /s/ were /p, t, k, f/, in similar proportion across E and notE-words, plus one word with /l/.
After testing, one item (asbesto, “asbestos”) was excluded because participants rarely accepted its intact form. Of the 23 remaining notE-words, 12 began with /a/, 5 with /i/, and 6 with /o/.Footnote 10 This represents a compromise between the goal of balancing the number of E vs. notE-words, and reflecting the proportions in the SUBTLEX-ES corpus (Cuetos Vega et al., Reference Cuetos Vega, Glez Nosti, Barbón Gutiérrez and Brysbaert2011), where 81% of #VsC words (collapsing across inflections) begin with /e/, 10% with /a/, and 4% each with /i, o/.
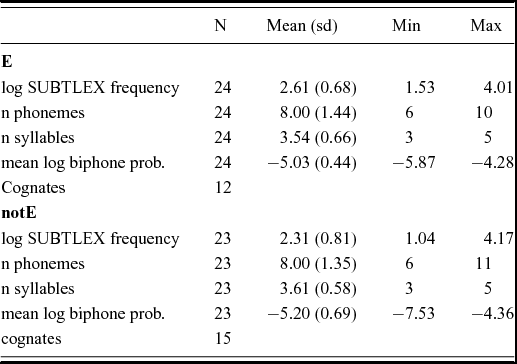
Table 5 summarizes the lexical properties of the critical words. Phonotactic probability was the average positional log biphone frequency (from Marian, Bartolotti, Chabal & Shook, Reference Marian, Bartolotti, Chabal and Shook2012), excluding the first biphone. This was done because initial /es/ is considerably more frequent than other initial #Vs sequences. Rather than being a confound, however, this reflects, and may help explain, the status of [e] as the default repair vowel in Spanish. It was therefore deemed preferable to ensure that the E and notE-words were otherwise comparable in phonotactic probability, as opposed to offsetting the high probability of initial /es/ by allowing much lower probability biphones later in the E-words. The stimuli were all nouns save 4 adjectives with initial /e/, 2 with /a/, and one each with /i, o/. All items were recorded by a male native Spanish speaker from northern Spain, who produced coda [s] reliably. Regional differences between Northern and Andalusian Spanish are not expected to impact the results because university students in Granada are familiar with other varieties used in Spain (particularly socially prestigious ones), and often produce coda [s] in formal contexts.
Descriptive statistics for critical lexical decision stimuli.

To test the effects of perceptual repair, the critical words were presented either intact, with the initial vowel removed (noVowel), or with a different initial vowel (wrongVowel). The noVowel versions were created by removing all material preceding the offset of periodic noise and applying a 40 ms linear ramp. This contrasts with Experiment 1, where a fragment of the vowel remained, but the goal here was not to determine if listeners could identify tokens produced without an initial vowel, but whether they would accept them as valid tokens of real words. No attempt was made to avoid coarticulatory traces of the initial vowel quality remaining on the [s] in the noVowel stimuli, though others have done so (e.g., Dupoux et al., Reference Dupoux, Pallier, Kakehi and Mehler2001). The linear ramp may attenuate any such traces, but it may also give the impression that a very quiet vowel may have preceded the [s]. Neither of these features, however, would lead to the predicted asymmetry of perceptual repair, whereby /e/ would be restored much more reliably than other vowels.
To create the wrongVowel versions, the entire #Vs sequence, up to the offset of aperiodic noise, was exchanged with one taken from a word with the opposite initial vowel and the same post-/s/ consonant, to maintain coarticulatory features on the /s/ associated with its neighboring segments. Thus, for example, astuto “astute” became [estuto], and espejo “mirror” became [ospexo].Footnote 11 To avoid unnatural differences in intensity between the spliced portions of the wrongVowel stimuli, all items were normalized to a mean intensity of 71dB (the mean of the original recordings) before splicing, and the stimuli were re-normalized after splicing. All acoustic manipulations were carried out using Praat (Boersma & Weenink, Reference Boersma and Weenink2018).
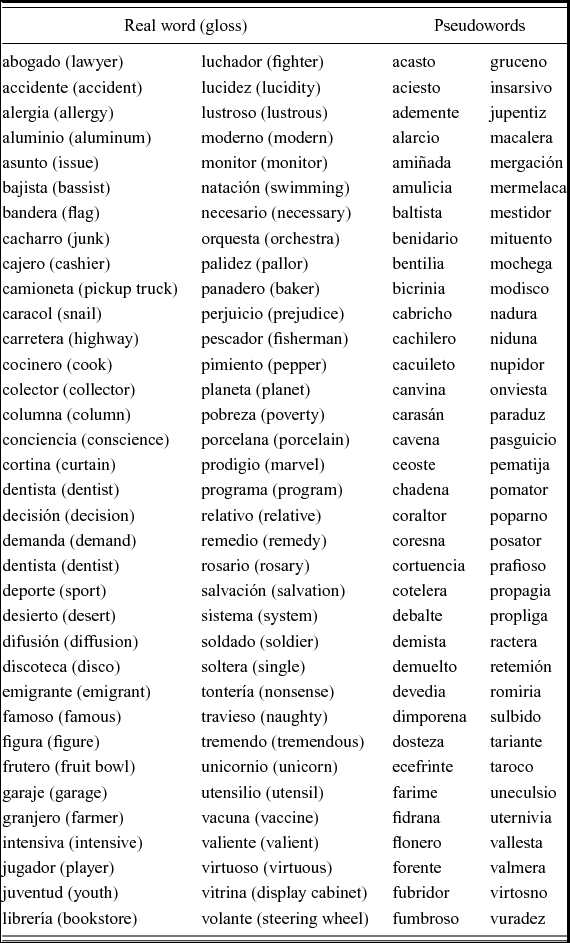
The three versions of each critical word (intact, noVowel, wrongVowel) were counterbalanced across participants, and presented along with 70 real and 70 pseudoword fillers (see Appendix B) in random order (always beginning with 6 fillers), for a total of 188 trials. Since the intact stimuli were all real words, and the wrongVowel stimuli were all pseudowords, there were equal proportions of unambiguously real and pseudowords. The noVowel stimuli are considered ambiguous. While technically pseudowords, the illusory [e] would accurately restore the original E-words, and render the notE-words as phonotactically legal pseudowords.
The 70 real fillers were similar to the critical items in frequency, length, phonotactic probability, syntactic category, and stress. The pseudowords were created by entering the real word fillers into Wuggy (Keuleers & Brysbaert, Reference Keuleers and Brysbaert2010), which creates pseudowords matched to the provided inputs. Pseudoword fillers were phonotactically legal in Spanish, so that phonotactics did not provide a strong cue to lexical status.
Participants were asked to decide as quickly and accurately as possible whether each stimulus was or was not a real word in Spanish, and responded on a button box. Each trial began with a 500 ms fixation, after which the stimulus was played on studio quality headphones at a comfortable level. After participants responded, or after 3000 ms, a 500 ms blank screen preceded the next trial. RTs were measured from stimulus onset.
Procedure
The same procedure was followed as in Experiment 1, with the LDT replacing the AX task.
Predictions
Monolinguals were expected to accept noVowel words more readily when the missing vowel matched the perceptual repair, [e], than when it did not, but the predictions for bilinguals are more complex. If perceptual repair is simply less robust for bilinguals, they may reject tokens such as [skwela] (for escuela) more often than monolinguals. The missing vowel might still be restored via comparison with lexical representations (e.g., Ganong, Reference Ganong1980; Samuel, Reference Samuel1981), but this should lead to slower and less reliable acceptance than perceptual restoration of the vowel, which occurs prelexically (Dupoux et al., Reference Dupoux, Pallier, Kakehi and Mehler2001).
However, since Spanish–English bilinguals are aware that #sC can occur in English (Altenberg, Reference Altenberg2005) and know that it is a frequent source of difficulty, they may treat #esC and #sC as phonotactic translation equivalents (cf. Hanulíková et al., Reference Hanulíková, Mitterer and McQueen2011). Moreover, when Spanish #esC words have English cognates, these tend to begin in #sC, e.g., especial, special, but other Spanish #VsC words have English cognates beginning with a similar vowel, e.g., aspirina, aspirin (Amengual, Reference Amengual2012, provides evidence that pronunciation can be affected by the presence of cognates). This pattern is strong enough that it could not be tightly controlled here (see Appendix B). Activation of English cognates such as special upon hearing the noVowel version of especial may therefore lead bilinguals to accept these items as much or even more than monolinguals.
Results
Prior to analysis, 29 trials with no response and 7 trials with RT < 400 ms were removed (< 1% of the data), leaving 2522 valid critical trials. This lower cutoff was higher than in Experiment 1 to ensure that most of the item had been heard prior to the response (in contrast, the AX decisions could be made as soon as the [s] began). No upper cutoff was applied, as trials timed out at 3000 ms, and few RTs approached this duration. RTs were negative reciprocal transformed (×1000), which approximated a normal distribution well based on inspection of q-q plots.
Word vs. nonword responses
The analysis of word vs. nonword responses focused on the noVowel trials (843 observations), because the central predictions concern the noVowel condition, and because performance was (unsurprisingly) at ceiling for the intact and floor for the wrongVowel stimuli, with mean accuracy in excess of 92%, with no apparent dependence on group or the initial vowel.
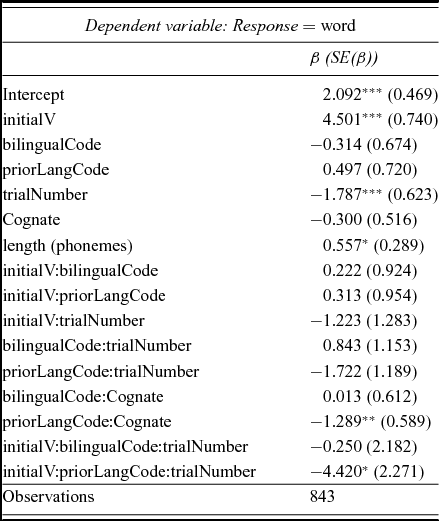
The likelihood of responding word was analyzed using mixed effects logistic regression. The fixed effects of interest were initialV (E vs. notE) and languageGroup (as above). To explore possible transient language switch effects, trialNumber and its interactions with initialV and languageGroup were included. To control for other lexical properties of the items, length (of the stimulus as presented, in phonemes), phonotactic probability, and log frequency (all z-scored), plus cognate status were explored, but only length and cognate status were retained based on likelihood ratio tests (p < .1, all other p > .4). Cognate status was allowed to interact with languageGroup, because it is expected to affect bilinguals more than monolinguals. Interactions involving cognate status and initialV were explored, but none emerged as significant (all p > .25), and they were discarded.
Random intercepts by participant and item were included, with by-participant slopes for initialV and trialNumber and by-item slopes for languageGroup and trialNumber. Random interaction terms yielded very large variance estimates, suggesting quasi-complete separation, and they were omitted. The estimates in the final model appeared to be reasonable, however, so we report the results here (complete fixed effects estimates and further details appear in Table C1, Appendix C), and pursue this issue below.
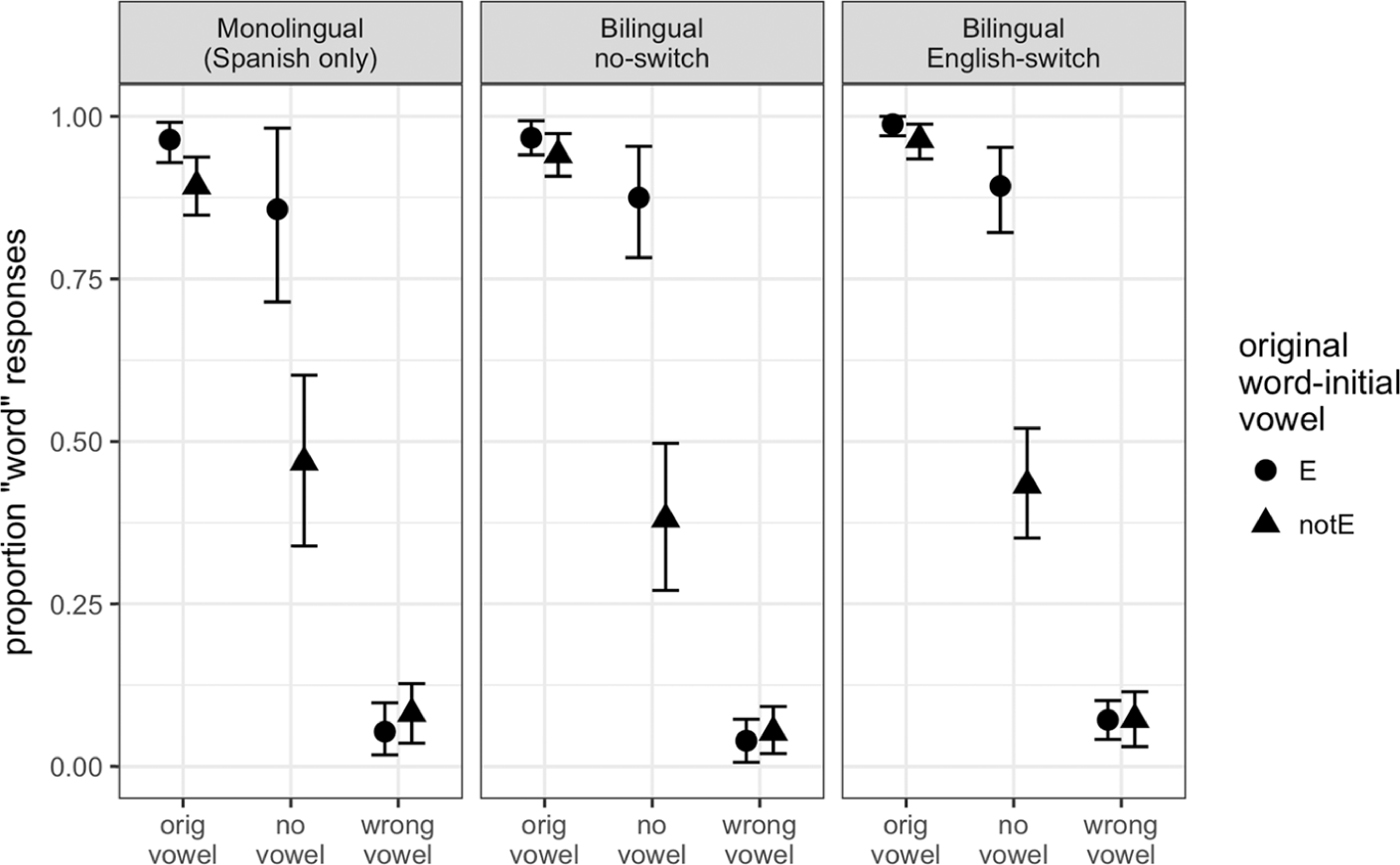
The proportions of word responses to the critical stimuli are shown in Figure 3 (including intact and wrongVowel items, for reference). Figure 3 shows that, in the noVowel condition, participants nonetheless readily accepted words missing their initial [e], e.g., [spexo] for espejo, but performed around chance when the missing vowel was of different quality, e.g., [spiɾina] for aspirina. This large difference is confirmed by the main effect of initialV (β = 4.50, SE = 0.74, χ2(1) = 43.85,p < .0001). The interactions of initialV with bilingualCode and priorLangCode were not significant (both p > .7), but a three-way interaction of initialV, priorLangCode and trialNumber emerged (β = −4.42, SE = 2.27, χ2(1) = 4.00, p = .046), suggesting a possible transient switch effect.
Proportion of word responses #VsC words presented intact, with the initial vowel removed, or with the initial vowel replaced with a different vowel, with 95% CIs computed by nonparametric bootstrap.

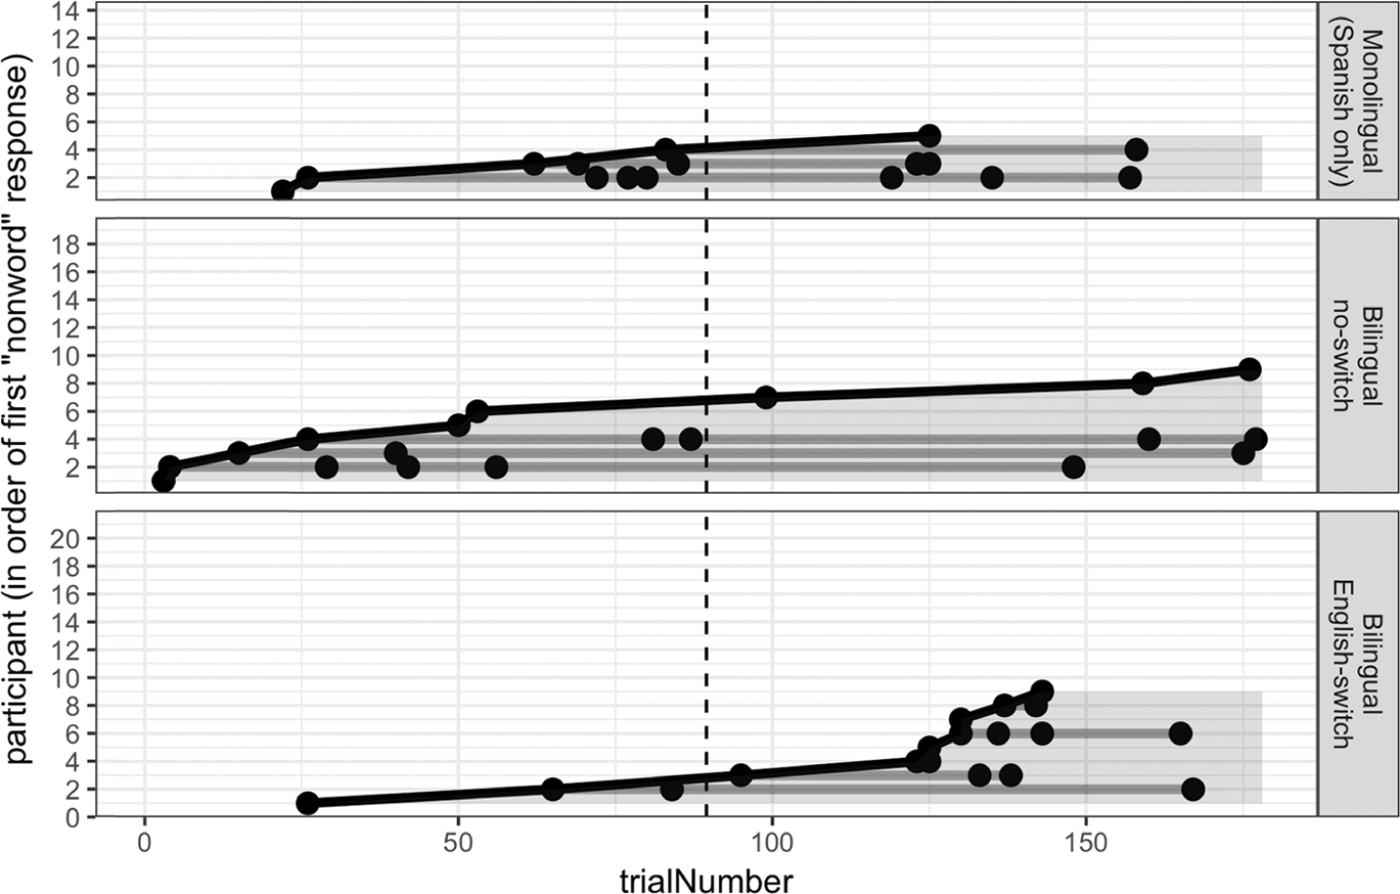
To unpack this interaction, a model was first fit to the notE-words only, which yielded no significant effects or interactions of trialNumber (all p > .13). However, a similar model fit to the E-words yielded unreasonably large estimates. This likely reflects quasi-complete separation, since well over half the participants completely ignored the absence of a word-initial [e], responding word every time to these items (proportions across groups were similar, 9/14 monolinguals, 10/19 no-switch bilinguals, and 12/21 English-switch bilinguals; note that the nonword responses that did occur were distributed evenly over 22 of the 24 E-words).
The possible trialNumber effects on E-word responses are thus explored graphically in Figure 4. Of the participants who ever answered nonword, monolinguals and no-switch bilinguals tended to do so early in the task, continuing to do so throughout, whereas English-switch bilinguals rarely did so until the last third of the task. While this should be taken cautiously, it nonetheless fits the expectation that any transient effects of prior language context would occur after switching back from English, and suggests an elevated tendency to accept stimuli with a missing [e] immediately after using English, which faded later in the task.
Nonword responses to #VsC words presented with no initial vowel, as a function of trialNumber, separated by participant and group. Each point is a nonword response; responses by the same participant are linked with a dark gray line. Height of shaded area shows the number of participants in each group to have responded nonword at least once, as a function of trialNumber. Height of each panel shows the total number of participants in each group. The dotted vertical line shows the midpoint of the task.

Response times
To explore the consequences of removing the initial vowel on response times, the analysis focused on the intact and noVowel conditions. WrongVowel trials, which all three participant groups consistently rejected, were excluded (though rejections were faster for E-words, e.g., [ospexo], from espejo “mirror”, than notE-words).Footnote 12 All responses were included (n = 1685), due to the ambiguous lexical status of the noVowel stimuli, but the highly uneven distribution of nonword responses across conditions (cf. Figure 3) prevented including Response as a predictor. However, refitting the model using only word responses yielded the same results.
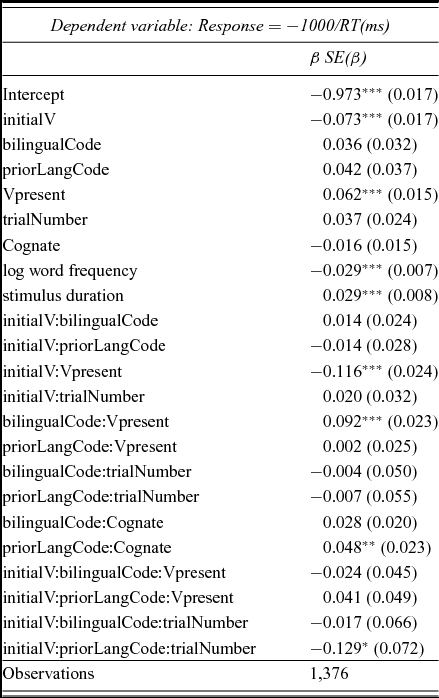
The model structure was the same as for word vs. nonword responses, except for the following changes. To capture differences between the intact and noVowel conditions, a two-level factor (Vpresent) was added and allowed to interact with initialV and languageGroup. The three-way interaction of initialVowel, priorLangCode, and trialNumber approached significance (β = −0.129, SE = 0.07, χ2(1) = 3.17, p = .075) and was retained (with its component two-way interactions), but interactions of trialNumber and Vpresent were not (all p > .23). Log word frequency was included as a covariate, and stimulus duration (z-scored) was substituted for length in phonemes, as a more direct way to control for the effects of stimulus length on RT (the same results are obtained either way). Complete fixed effects estimates and further details appear in Table C2 in Appendix C.
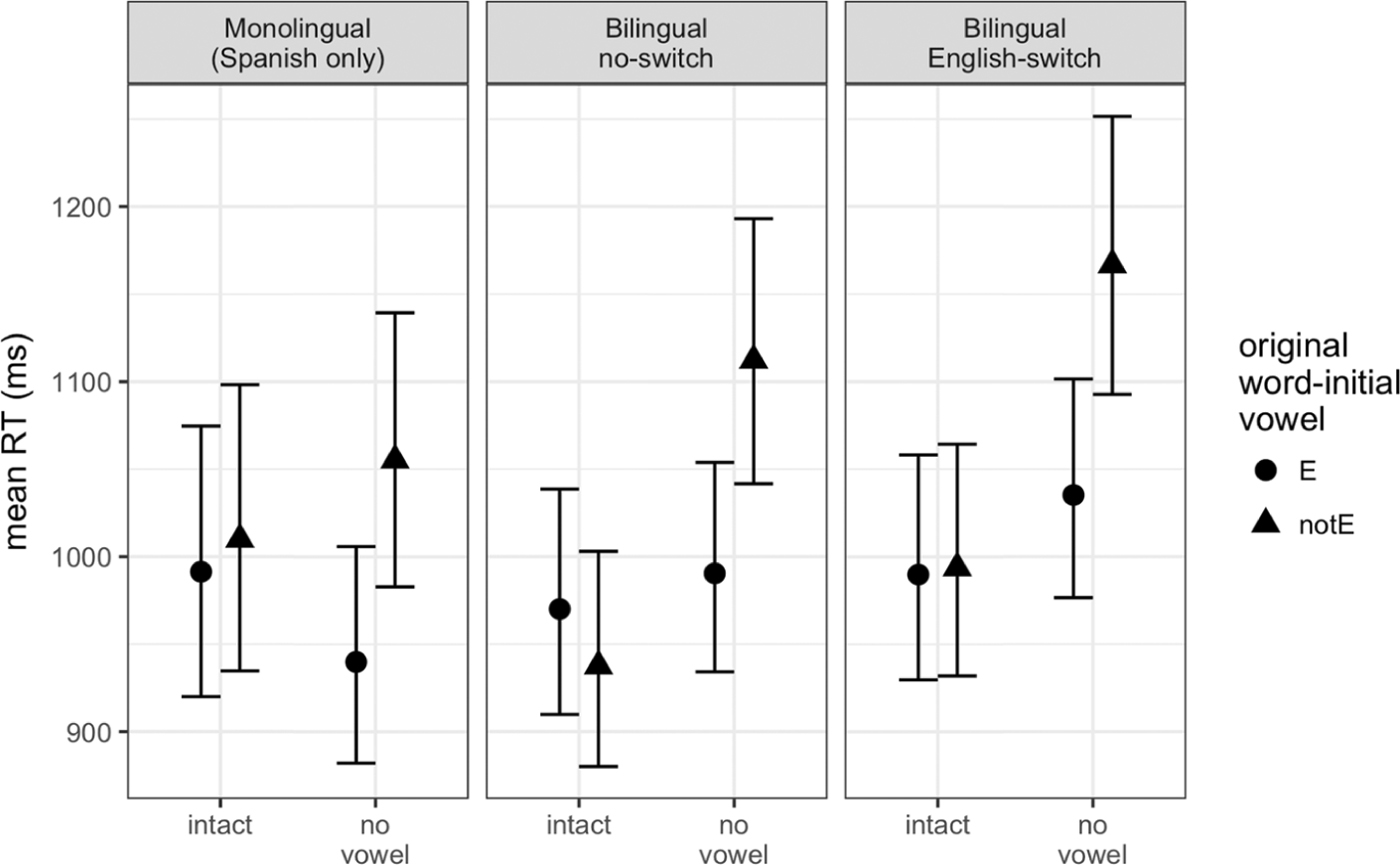
Figure 5 shows the estimated RTs to intact and noVowel stimuli. Crucially, removing the initial vowel affected monolinguals and bilinguals differently overall, reflected in the two-way interaction of Vpresent with bilingualCode (β = 0.09, SE = 0.02, χ2(1) = 14.26, p = .0002). Bilinguals were slower than monolinguals when the initial vowel was missing, as confirmed via post-hoc tests (β = 0.08, SE = 0.04, χ2(1) = 5.32, p = .021; Bonferroni-corrected α = .025) but bilinguals’ and monolinguals’ RTs to intact words did not differ (χ2 < 1)
Estimated RTs and 95% CIs (back-transformed to milliseconds) for intact and noVowel stimuli in Experiment 2, separated by the original vowel and languageGroup.

When words were presented intact, no dependence of RTs on the quality of the initial vowels was found, but in the noVowel condition, all groups responded faster to stimuli with a missing [e] than to those missing a different vowel. This is confirmed by a significant interaction between initialV and Vpresent (β = −0.12, SE = 0.02, χ2(1) = 19.50, p < .0001), and by a main effect of initialV in a model fit to only the noVowel results (β = −0.14, SE = 0.02, χ2(1) = 32.75, p < .0001). Additional post-hoc tests (Bonferroni-corrected α = .0125) were performed to confirm that removing the initial vowel led to slower responses in bilinguals for both E-words (β = 0.05, SE = 0.02, χ2(1) = 8.23, p = .004) and notE-words (β = 0.14, SE = 0.02, χ2(1) = 37.18, p < .0001). Removing the initial vowel did not change RTs for monolinguals, for either E or notE-words (both χ2 < 1).
Discussion
As in Experiment 1, bilinguals and monolinguals differed only slightly in their responses, but salient group differences were observed in RTs. Taking the similarities first, participants in all three groups largely ignored the absence of initial [e], accepting tokens like [skwela] (from escuela) nearly as frequently as [eskwela], but responding to [spiɾina] (from aspirina) at chance, and more slowly than to [skwela]. This, together with the large longerV effect on discrimination observed across groups in Experiment 1, shows that repair via [e]-prothesis is alive and well for Spanish–English bilinguals.
What, then, of the group differences? First, there appeared to be a transient enhancement of perceptual repair after switching to Spanish from English, whereby bilinguals were initially more likely to accept words missing their initial [e], but not other initial vowels. Though this occurred only for some participants, it bears out the prediction that transient effects would appear only in the English-switch group (Elston-Güttler & Gunter, Reference Elston-Güttler and Gunter2008; Elston-Güttler et al., Reference Elston-Güttler, Gunter and Kotz2005; Goldrick et al., Reference Goldrick, Runnqvist and Costa2014; Olson, Reference Olson2013). Second, removing the initial vowel slowed responses for bilinguals only, regardless of the original vowels’ quality. This strongly suggests that they detected the absence of the vowel even though they, like the monolinguals, accepted items missing an initial [e] consistently, and more than items missing a different initial vowel.
While bilinguals may have noticed the initial #sC sequences, they nonetheless accepted the noVowel items at a similar rate to monolinguals, suggesting that bilinguals found them to be both recognizable and acceptable as valid tokens of their intact counterparts. This may be due to a greater role for lexical repair, consistent with bilinguals’ overall slower responses to noVowel items, although the dependence of bilinguals’ responses and RTs on the quality of the missing vowel shows that bilinguals’ performance is also shaped by (prelexical) perceptual repair.
General discussion
In both experiments, then, bilinguals’ responses revealed robust, monolingual-like repair of #sC, but they responded more slowly in those conditions where Spanish and English phonotactics were in conflict. The acoustically accurate parse, #sC, thus appears to play a greater role in bilinguals’ processing than it does in monolinguals, although they ultimately reach the same decisions. There were, however, some differences across experiments. In discrimination, only bilinguals’ RTs were sensitive to the longer vowel's quality, with a stronger effect found after switching from English. In lexical decision, on the other hand, all groups were equally sensitive to the missing vowel's quality, and RTs were not affected by switching languages.
These differences could be methodological (e.g., missing vs. very short vowels), but they may also reflect how English interacts with varying task conditions. In lexical decision, the English-like representation would indicate a (phonotactically illicit) nonword regardless of the original vowel's quality, leading to a uniform processing cost for bilinguals and leaving the effect of the missing vowel's quality stable across groups. In discrimination, however, the impact of the English-like representation (#sC) would lead to competition between the acoustically and linguistically correct responses only for the longer-[e] pairs (see above), and thus to asymmetrical RT effects.
The difference in switching effects across tasks may also reflect the greater relevance of acoustic information in the discrimination task. Using English before this discrimination task may have made this information more accessible or salient. In lexical decision, on the other hand, the absence of other illicit items in the stimulus list may have downplayed the importance of acoustic detail. This may have suppressed switch effects, but it would not necessarily prevent them. This leads to the prediction that repeating the experiment with the addition of other illicit pseudowords should create an expectation that some of the nonwords will be phonotactically impossible (cf. Altenberg & Cairns, Reference Altenberg and Cairns1983), forcing bilinguals to decide whether to count an item like [skwela] as one of the illicit ones or not. This would enhance the competition between word and nonword responses, allowing switch effects to emerge. Conversely, competition could be weakened in discrimination by reducing response bias, e.g., in the ABX paradigm. Monolinguals should perform poorly on this task, but if bilinguals can at all detect the difference between #esC and #sC when required, then they should perform well, regardless of the preceding language context.
The present findings thus support the conclusion that hearing an acoustic #sC sequence appears to activate a wider range of candidate representations for bilinguals than for monolinguals. However, the important thing is not whether bilinguals are sensitive to the presence/absence of an initial vowel (the RT effects provide clear evidence that they are), but rather what listeners do with the acoustic variability they can detect, and how different linguistic and task conditions influence the activation and sifting of candidates during processing (Apfelbaum et al., Reference Apfelbaum, Bullock-Rest, Rhone, Jongman and McMurray2014; Apfelbaum & McMurray, Reference Apfelbaum and McMurray2014; Kleinschmidt & Jaeger, Reference Kleinschmidt and Jaeger2015; Norris et al., Reference Norris, McQueen and Cutler2016).
How might this work in the present case? Monolinguals and Spanish–English bilinguals alike know that Spanish words do not begin with #sC, and they also know that the most probable valid parse in Spanish is #esC, with the remaining probability mass divided primarily among the other vowel-initial possibilities. After all, Spanish was the bilinguals’ first and clearly dominant language, and they were currently residing in a more or less monolingual Spanish environment. The difference is in the treatment of #sC. For monolinguals, the veridical parse is not even representable in their phonotactic system, and it is thus unlikely to impact processing much, even if they notice the absence of the vowel. It is, however, representable for bilinguals, albeit in the non-target language, allowing it to impact processing in a way that it can't for monolinguals. One interesting consequence of this reasoning is that knowledge of the impossibility of #sC in Spanish may be different for bilinguals and monolinguals. In a sense, monolinguals may not actually know this constraint at all, they simply have no way of representing the unattested sequences. Bilinguals, however, can represent them (even at early stages of learning, Altenberg, Reference Altenberg2005), and can therefore identify them as structures that happen to be impossible in Spanish.
What happens next depends on the interplay of available representations and task demands. With no reason to expect that #sC sequences would be relevant to, or even occur in, lexical decision, bilinguals behaved like monolinguals; only a bit slower because they detected the vowel's absence. After encountering a few words with missing initial vowels, bilinguals might have become suspicious and revised their decision strategy, but while there was a hint of this in the English-switch group, more overt cues (e.g., other illicit nonwords) may be required to produce reliable changes in strategy. In discrimination, however, the robustness (duration) of the initial vowel was in focus from the beginning, and clearly relevant for discrimination. While the vowel was never completely absent, its brevity allowed room for doubt, supported by the representability of #sC. Bilinguals were slower where the ultimate response depended on how that doubt was resolved, and using English prior to the AX appears to have made the alternative resolution more salient, even though they reached similar decisions in the end.
Conclusion
The emerging story here is that experience with L2 English allows Spanish–English bilinguals to perceive #sC sequences veridically. The consequence, however, is not to prevent perception of the illusory vowel but rather to add an alternative to it, broadening the range of alternatives that participate in processing. This changes the interplay of acoustic information and phonotactic knowledge during speech perception and subsequent decision making, and this interplay evolves dynamically depending on the bilinguals’ current linguistic context.
This conclusion finds a natural explanation in the recent application of Bayesian reasoning to speech perception (Apfelbaum et al., Reference Apfelbaum, Bullock-Rest, Rhone, Jongman and McMurray2014; Apfelbaum & McMurray, Reference Apfelbaum and McMurray2014; Feldman et al., Reference Feldman, Griffiths and Morgan2009; Kleinschmidt & Jaeger, Reference Kleinschmidt and Jaeger2015; Norris et al., Reference Norris, McQueen and Cutler2016), where speech perception is thought of as an active cognitive process (Heald & Nusbaum, Reference Heald and Nusbaum2014), in which different sources of information can be re-weighted, and expectations based on prior knowledge adjusted to match current conditions, leading to an interesting possibility. While the present study did not directly test the role of listener expectations in the observed effects, a Bayesian approach suggests that this would be a fruitful direction in which to continue this research. Indeed there is already evidence that listeners adapt their perception of phonetic categories based on knowledge of a talker's bilingualism (Molnar, Ibáñez-Molina & Carreiras, Reference Molnar, Ibáñez-Molina and Carreiras2015; Samuel & Larraza, Reference Samuel and Larraza2015), or dialect background (Dahan, Drucker & Scarborough, Reference Dahan, Drucker and Scarborough2008; Hay, Drager & Warren, Reference Hay, Drager and Warren2010; Hay, Nolan & Drager, Reference Hay, Nolan and Drager2006; Kraljic, Brennan & Samuel, Reference Kraljic, Brennan and Samuel2008).
This points ultimately to the proposal that bilinguals not only know how to use the structures involved in each of their languages, but they also know how the two systems are related to each other, and this counterpoint allows for ways of using their languages that are not available to monolinguals (Cook, Reference Cook1992; Cook & Wei, Reference Cook and Wei2016; Hall et al., Reference Hall, Cheng and Carlson2006; Otheguy et al., Reference Otheguy, García and Reid2015). In a sense, it may be better to think of bilinguals not as balancing two systems, at the mercy of extra representations that compete for activation, but rather as having a measure of control over the porosity of their language systems, allowing them to process the same acoustic material adaptively based on current conditions. Looking forward, this may add crucial nuance to the holistic view of bilingualism advanced by researchers like Grosjean (Reference Grosjean1989), and to the idea that both languages are not only always active, but gradiently integrated (Goldrick et al., Reference Goldrick, Putnam and Schwarz2016) when bilinguals use language.
Appendix A Model details, Experiment 1, AX Discrimination
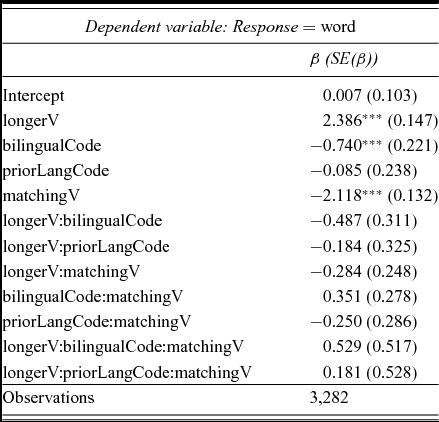
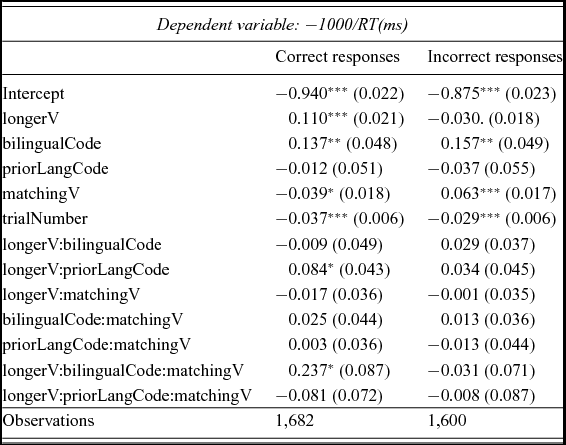
The fixed effects factors were coded as follows. LongerV, a binary factor encoding the quality of the longer vowel in each pair, was sum-coded as −0.5 for [a] and 0.5 for [e]. LanguageGroup, a 3-level factor, was coded using orthogonal contrasts. The first contrast (bilingualCode) compared monolinguals with bilinguals, and the second (priorLangCode) compared the English-switch and no-switch groups. MatchingV was coded as –0.5 (the quality of the initial vowels in each pair was the same) and 0.5 (different). TrialNumber (RT model only) was a continuous variable, scaled to a range of 1 and centered.
Fixed effects for response accuracy in Experiment 1. Positive values indicate higher likelihood of responding same. Significance assessed via likelihood ratio tests of individual coefficients.

Fixed effects for RT in Experiment 1. Units are in negative reciprocal milliseconds (x1000). Significance was assessed via likelihood ratio tests of individual coefficients.

The maximal random effects structure by-participants was used, i.e., random intercepts and slopes for longerV, matchingV, and their interaction. By-item effects were omitted because the items did not constitute a random sample, and the most important differences between items are captured in the fixed effects.
Both models were bootstrap validated, confirming the results reported here, and the residuals were checked, confirming normality, homoskedasticity, and independence.
Appendix B Stimuli used in Experiment 2, Lexical Decision
Critical stimuli used in the lexical decision task.

Filler stimuli used in the lexical decision task.

Appendix C Model details, Experiment 2, Lexical Decision
The quality of the original initial vowel, initialV, was sum-coded as −0.5 for notE and 0.5 for E. The factor languageGroup was coded as in Experiment 1 using orthogonal contrasts for bilingualCode and priorLangCode. TrialNumber was scaled to a range of 1 and centered, and Cognate was sum-coded as −0.5 for noncognates and 0.5 for cognates. Length (in phonemes) was z-scored. In the analysis of response times, Vpresent encoded the difference between intact (–0.5) and noVowel (0.5) items, Duration (in ms, z-scored) was substituted for Length, and log word frequency (z-scored) was added as a covariate.
In the analysis of word vs. nonword responses, random intercepts by participant and item were included, with by-participant slopes for initialV and trialNumber and by-item slopes for languageGroup and trialNumber. In the analysis of RTs, the by-item random effects referred to the original lexical item, regardless of the version presented, such that differences between the intact and noVowel versions are encoded via Vpresent in the fixed effects. By-participant and by-item slopes for Vpresent, initialV, languageGroup, and trialNumber, including their interactions, were included as justified by the design.
Both models were bootstrap validated, confirming the results reported here, and the residuals were checked, confirming normality, homoskedasticity, and independence.
Fixed effects for word vs. nonword responses in Experiment 2 (noVowel trials only). Positive coefficients indicate increasing likelihood of a word response. Significance was assessed via likelihood ratio tests of individual coefficients.

Fixed effects for RT in Experiment 2, word responses to intact and noVowel stimuli only. Significance was assessed via likelihood ratio tests of individual coefficients. Units are in negative reciprocal milliseconds (x1000).