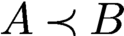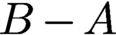


1 Introduction
When algorithms fail to produce correct results in real-world applications, we would like to know why they failed. Is it because of some mistakes in the experimental set-up, corrupted measurements, calibration errors or incorrect modelling assumptions, or is it due to a deficiency of the algorithm itself? If it is the latter, can it be fixed by a better initialization, a more careful tuning of the parameters, or by choosing a different algorithm? Or is a more fundamental modification required, such as developing a different model, including additional prior information, taking more measurements, or a better compensation of calibration errors? As our scientific experiments produce larger and larger datasets and we aim for faster and faster throughput, it is becoming increasingly important to address the aforementioned challenges in a systematic and principled manner. Thus, a rigorous and thorough study of computational algorithms, both from a theoretical and numerical viewpoint, is not a luxury, but is emerging as a vital ingredient of effective data-driven discovery.
The past decade has witnessed a surge in the systematic study of numerical algorithms for the famous phase retrieval problem, i.e. the problem of recovering a signal or image from the intensity measurements of its Fourier transform (Hurt Reference Hurt1989, Klibanov, Sacks and Tikhonravov Reference Klibanov, Sacks and Tikhonravov1995). In many applications we would like to acquire information about an object but it is impossible or impractical to measure the phase of a signal. We are then faced with the difficult task of reconstructing the object of interest from these magnitude measurements. Problems of this kind fall into the realm of phase retrieval problems, and are notoriously difficult to solve numerically. In this paper we will review recent advances in the area of phase retrieval with a strong focus on numerical algorithms.
Historically, one of the first important applications of phase retrieval is X-ray crystallography (Millane Reference Millane1990, Harrison Reference Harrison1993), and today this is still one of the most important applications. In 1912, Max von Laue discovered the diffraction of X-rays by crystals. In 1913, W. H. Bragg and his son W. L. Bragg realized that one could determine crystal structure from X-ray diffraction patterns. Max von Laue received the Nobel Prize in 1914 and the Braggs in 1915, marking the beginning of many more Nobel Prizes to be awarded for discoveries in the area of X-ray crystallography. Later, the Shake-and-Bake algorithm became one of the most successful direct methods for phasing single-crystal diffraction data, and opened a new era in research into mapping the chemical structures of small molecules (Hauptman Reference Hauptman1997).
The phase retrieval problem permeates many other areas of imaging science. For example, in 1980, David Sayre suggested extending the approach of X-ray crystallography to non-crystalline specimens. This approach is today known by the name of coherent diffraction imaging (CDI) (Miao, Charalambous, Kirz and Sayre Reference Miao, Charalambous, Kirz and Sayre1999). See Shechtman et al. (Reference Shechtman, Eldar, Cohen, Chapman, Miao and Segev2015) for a detailed discussion of the benefits and challenges of CDI. Phase retrieval also arises in optics (Walther Reference Walther1963), fibre optic communications (Kumar and Deen Reference Kumar and Deen2014), astronomical imaging (Dainty and Fienup Reference Dainty, Fienup and Stark1987), microscopy (Miao, Ishikawa, Shen and Earnest Reference Miao, Ishikawa, Shen and Earnest2008), speckle interferometry (Dainty and Fienup Reference Dainty, Fienup and Stark1987), quantum physics (Reichenbach Reference Reichenbach1944, Corbett Reference Corbett2006) and even in differential geometry (Bianchi, Segala and Volčič Reference Bianchi, Segala and Volčič2002).
In particular, X-ray tomography has become an invaluable tool in biomedical imaging to generate quantitative three-dimensional density maps of extended specimens at the nanoscale (Dierolf et al. Reference Dierolf, Menzel, Thibault, Schneider, Kewish, Wepf, Bunk and Pfeiffer2010). We refer to Hurt (Reference Hurt1989) and Luke, Burke and Lyon (Reference Luke, Burke and Lyon2002) for various examples of the phase problem and additional references. A review of phase retrieval in optical imaging can be found in Shechtman et al. (Reference Shechtman, Eldar, Cohen, Chapman, Miao and Segev2015).
Uniqueness and stability properties from a mathematical viewpoint are reviewed in Grohs, Koppensteiner and Rathmair (Reference Grohs, Koppensteiner and Rathmair2020). We just note here that the very first mathematical findings regarding uniqueness related to the phase retrieval problem are Norbert Wiener’s seminal results on spectral factorization (Wiener Reference Wiener1932).
Phase retrieval has seen a significant resurgence in activity in recent years. This resurgence is fuelled by:
-
(i) the desire to image individual molecules and other nano-particles;
-
(ii) new imaging capabilities such as ptychography, single-molecule diffraction and serial nanocrystallography, as well as the availability of X-ray free-electron lasers (XFELs) and new X-ray synchrotron sources that provide extraordinary X-ray fluxes (see e.g. Chapman et al. Reference Chapman, Fromme, Barty, White, Kirian, Aquila, Hunter, Schulz, DePonte and Weierstall2011, Neutze et al. Reference Neutze, Wouts, Van der Spoel, Weckert and Hajdu2000, Millane Reference Millane, Bones, Fiddy and Millane2006, Scapin Reference Scapin2006, Bogan et al. Reference Bogan2008, Miao, Ishikawa, Shen and Earnest Reference Miao, Ishikawa, Shen and Earnest2008, Dierolf et al. Reference Dierolf, Menzel, Thibault, Schneider, Kewish, Wepf, Bunk and Pfeiffer2010, Thibault et al. Reference Thibault, Dierolf, Menzel, Bunk, David and Pfeiffer2008);
-
(iii) the influx of novel mathematical concepts and ideas, spearheaded by Candès, Eldar, Strohmer and Voroninski (Reference Candès, Eldar, Strohmer and Voroninski2013a ) and Candès, Strohmer and Voroninski (Reference Candès, Strohmer and Voroninski2013b ), as well as deeper understanding of non-convex optimization methods such as alternating projections (Gerchberg and Saxton Reference Gerchberg and Saxton1972) and Fienup’s hybrid input–output (HIO) algorithm (Fienup Reference Fienup1982).
These mathematical concepts include advanced methods from convex and non-convex optimization, techniques from random matrix theory and insights from algebraic geometry.
Let x be a (possibly multi-dimensional) signal. Then, in its most basic form, the phase retrieval problem can be expressed as
 $$ \begin{align} {\text{Recover } x, \quad \text{ given } \ |\hat{x}({\boldsymbol{\omega}})|^2 = \biggl| \int_{T} x({\mathbf t}) \,{\mathrm{e}}^{-2\pi {\mathrm{i}} {\mathbf t} \cdot {\boldsymbol{\omega}}} \,{\mathrm{d}} {\mathbf t} \biggr|^2, \quad {\boldsymbol{\omega}} \in \Omega, } \end{align} $$
where T and
 $\Omega$
are the domain of the signal x and its Fourier transform
 $\hat {x}$
, respectively (and the Fourier transform in (1.1) should be understood as possibly multi-dimensional transform).
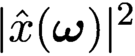
When we measure
 $|\hat{x}({\boldsymbol{\omega }})|^2$
instead of
 $\hat{x}({\boldsymbol {\omega }})$
, we lose information about the phase of x. If we could somehow retrieve the phase of x, then it would be trivial to recover x, hence the term phase retrieval. Its origin comes from the fact that detectors can often only record the squared modulus of the Fresnel or Fraunhofer diffraction pattern of the radiation that is scattered from an object. In such settings one cannot measure the phase of the optical wave reaching the detector, and therefore much information about the scattered object or the optical field is lost since, as is well known, the phase encodes a lot of the structural content of the image we wish to form.
Clearly there are infinitely many signals that have the same Fourier magnitude. This includes simple modifications such as translations or reflections of a signal. While in practice such trivial ambiguities are probably acceptable, there are infinitely many other signals sharing the same Fourier magnitude which do not arise from a simple transform of the original signal. Thus, to make the problem even theoretically solvable (ignoring for a moment the existence of efficient and stable numerical algorithms), additional information about the signal must be harnessed. To achieve this we can either assume prior knowledge of the structure of the underlying signal or we can somehow take additional (yet still phaseless) measurements of x, or we pursue a combination of the two approaches.
Phase retrieval problems are usually ill-posed and notoriously difficult to solve. Theoretical conditions that guarantee uniqueness of the solution for generic signals exist for certain cases. However, as mentioned in Luke et al. (Reference Luke, Burke and Lyon2002) and Fannjiang (Reference Fannjiang2012), these uniqueness results do not translate into numerical computability of the signal from its intensity measurements, nor do they concern the robustness and stability of commonly used reconstruction algorithms. Indeed, many of the existing numerical methods for phase retrieval rely on all kinds of a priori information about the signal, and none of these methods is proven to actually recover the signal.
This is the main difference between inverse and optimization problems: the latter focuses on minimizing the loss function while the former emphasizes minimization of reconstruction error of the unknown object. The bridge between the loss function and the reconstruction error depends precisely on the measurement schemes, which are domain-dependent.
Practitioners, not surprisingly, care less about theoretical guarantees of phase retrieval algorithms as long as they perform reasonably well in practice. Yet, it is a fact that algorithms do not always succeed. And then we want to know what went wrong. Was it a fundamental misconception in the experimental set-up? After all, Nature does not always cooperate. Was it due to underestimating measurement noise or unaccounted-for calibration errors? How robust is the algorithm in the presence of corrupted measurements or perturbations caused by lack of calibration? How much parameter tuning is acceptable when we are dealing with a large throughput of data? All these questions require systematic empirical study of algorithms combined with careful theoretical numerical analysis. This paper provides a snapshot from an algorithmic viewpoint of recent activities in the applied mathematics community in this field. In addition to traditional convergence analysis, we give equal attention to the sampling schemes and the data structures.
1.1 Overview
In Section 2 we introduce the main set-up and some mathematical notation, and introduce various measurement techniques arising in phase retrieval, such as coded diffraction illumination and ptychography. Section 3 is devoted to questions of uniqueness and feasibility. We also analyse various noise models. Non-convex optimization methods are covered in Section 4. We first review and analyse iterative projection methods, such as alternating projections, averaged alternating reflections and the Douglas–Rachford splitting. We also review issues of convergence. We then analyse gradient descent methods and the alternating direction method of multipliers in detail. We discuss convergence rates, fixed points and robustness of these algorithms. The question of the right initialization method is addressed in Section 5, as initialization plays a key role in the performance of many algorithms. In Section 6 we introduce various convex optimization methods for phase retrieval, such as PhaseLift and convex methods without ‘lifting’. We also discuss applications in quantum tomography and how to take advantage of signal sparsity. Section 7 focuses on blind ptychography. We describe connections to time-frequency analysis, discuss in detail ambiguities arising in blind ptychography, and describe a range of blind reconstruction algorithms. Holographic coded diffraction imaging is the topic of Section 8. We conclude in Section 9.
2 Phase retrieval and ptychography: basic set-up
2.1 Mathematical formulation
There are many ways in which one can pose the phase retrieval problem, for instance depending upon whether one assumes a continuous or discrete-space model for the signal. In this paper we consider discrete-length signals (one-dimensional or multi-dimensional) for simplicity, and because numerical algorithms ultimately operate with digital data. Moreover, for the same reason we will often focus on finite-length signals. We refer to Grohs et al. (Reference Grohs, Koppensteiner and Rathmair2020) and the many references therein regarding the similarities and delicate differences arising between the discrete and the continuous setting.
To fix ideas, suppose our object of interest is represented by a discrete signal
 $x({\mathbf n}), {\mathbf n} = (n_1,n_2,\ldots ,n_d)\in {\mathbb {Z}}^d.$
Define the Fourier transform of
 ${x_{*}}$
as
 $$ \begin{align*} \sum_{{\mathbf n}} {x_{*}}({\mathbf n}) \,{\mathrm{e}}^{ - 2\pi {\mathrm{i}} {\mathbf n}\cdot {\mathbf{w}}},\quad {\mathbf{w}} \in \Omega. \end{align*} $$
We denote the Fourier transform operator by F, and
 $F^{-1}$
is its inverse Fourier transform.Footnote
1
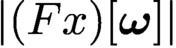
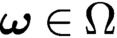
The phase retrieval problem consists in finding x from the magnitude coefficients
 $|(F x)[{\boldsymbol {\omega }}]|$
,
 ${\boldsymbol {\omega }} \in \Omega $
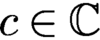
. Without further information about the unknown signal x, this problem is in general ill-posed since there are many different signals whose Fourier transforms have the same magnitude. Clearly, if x is a solution to the phase retrieval problem, then (i)
 $c x$
is also a solution for any scalar
 $c \in {\mathbb {C}}$
obeying
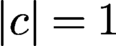 $|c| = 1$
, (ii) the ‘mirror function’ or time-reversed signal
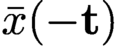 $\bar {x}(-{\mathbf t})$
is also a solution, and (iii) the shifted signal
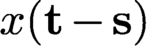 $x({\mathbf t} - {\mathbf s})$
is also a solution. From a physical viewpoint these ‘trivial associates’ of x are usually acceptable ambiguities. But in general infinitely many solutions can be obtained from
 $\{|\hat {x}({\boldsymbol {\omega }})| \colon {\boldsymbol {\omega }} \in \Omega \}$
beyond these trivial associates (Sanz Reference Sanz1985).
Most phase retrieval problems are formulated in two dimensions, often with the ultimate goal of reconstructing – via tomography – a three-dimensional structure. But phase retrieval problems also arise in one dimension (e.g. fibre optic communications) and potentially even four dimensions (e.g. mapping the dynamics of biological structures).
Thus, we formulate the phase retrieval problem in a more general way as follows. Let
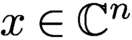 $x \in {\mathbb {C}}^n$
and
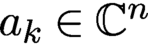 $a_k \in {\mathbb {C}}^n$
:
 $$ \begin{align} \text{Recover } x, \quad \text{given} \ y_k = | \langle x, a_k\rangle |^2, \quad k = 1, \ldots, N. \end{align} $$
Here x and the
 $a_k$
can represent multi-dimensional signals. We assume intensity measurements but obviously the problem is equivalent from a theoretical viewpoint if we assume magnitude measurements
 $$ \begin{align*} b_k = | \langle x, a_k\rangle |, \quad k = 1, \ldots, N. \end{align*} $$
To ease the burden of notation, when x represents an image and the two-dimensionality of x is essential for the presentation, we will often denote its dimension as
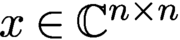 $x\in {\mathbb {C}}^{n\times n}$
(instead of the more cumbersome notation
 $x \in {\mathbb {C}}^{\sqrt {n}\times \sqrt {n}}$
), in which case the total number of unknowns is
 $n^2$
. In other cases, when the dimensionality of x is less relevant to the analysis, we will simply consider
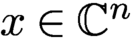 $x \in {\mathbb {C}}^n$
, where x may be one- or multi-dimensional. The dimensionality will be clear from the context.
Also, the measurement vectors
 $a_k$
can represent different measurement schemes (e.g. coded diffraction imaging, ptychography, …) with specific structural properties, which we will describe in more detail later.
We note that if x is a solution to the phase retrieval problem, then
 $c x$
for any scalar
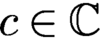 $c \in {\mathbb {C}}$
obeying
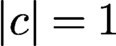 $|c| = 1$
is also a solution. Thus, without further information about x, all we can hope for is to recover x up to a global phase. Thus, when we talk in this paper about exact recovery of x, we always mean recovery up to this global phase factor.
As mentioned before, the phase retrieval problem is notoriously ill-posed in its most classical form, where one tries to recover x from intensities of its Fourier transform,
 $|\hat {x}|^2$
. We will discuss questions about uniqueness in Section 3; see also the reviews by Grohs et al. (Reference Grohs, Koppensteiner and Rathmair2020), Jaganathan, Eldar and Hassibi (Reference Jaganathan, Eldar and Hassibi2015) and Bendory, Beinert and Eldar (Reference Bendory, Beinert, Eldar and Boche2017). To combat his ill-posedness, we have the options to include additional prior information about x or acquire additional measurements about x, or a combination of the two. We will briefly outline the most common strategies below.
2.2 Prior information
A natural way to attack the ill-posedness of phase retrieval is to reduce the number of unknown parameters. The most common assumption is to invoke support constraints on the signal (Fienup Reference Fienup1982, Chen, Miao, Wang and Lee Reference Chen, Miao, Wang and Lee2007). This is often justified since the object of interest may have clearly defined boundaries, outside of which one can assume that the signal is zero. The effectiveness of this constraint often hinges on the accuracy on the estimated support boundaries. Positivity and real-valuedness are other frequent assumptions suitable in many settings, while atomicity is more limited to specific scenarios (Fienup Reference Fienup1978, Fienup Reference Fienup1982, Marchesini Reference Marchesini2007, Chen et al. Reference Chen, Miao, Wang and Lee2007). Another assumption that has gained popularity in recent years is sparsity (Shechtman et al. Reference Shechtman, Eldar, Cohen, Chapman, Miao and Segev2015). Under the sparsity assumption, the signal of interest has only relatively few non-zero coefficients in some (known) basis, but we do not know a priori the indices of these coefficients, so we do not know the location of the support. This can be seen as a generalization of the usual support constraint.
Oversampling in the Fourier domain has been proposed as a means to mitigate the non-uniqueness of the phase retrieval problem in connection with prior signal information (Miao, Chapman and Sayre Reference Miao, Chapman and Sayre1997). While oversampling offers no benefit for most one-dimensional signals, the situation is more favourable for multi-dimensional signals, where it has been shown that twofold oversampling in each dimension almost always yields uniqueness for finitely supported, real-valued and non-negative signals (Bruck and Sodin Reference Bruck and Sodin1979, Hayes Reference Hayes1982, Sanz Reference Sanz1985; see also Grohs et al. Reference Grohs, Koppensteiner and Rathmair2020). Luke et al. (Reference Luke, Burke and Lyon2002) point out that these uniqueness results do not say anything about how a signal can be recovered from its intensity measurements, or about the robustness and stability of commonly used reconstruction algorithms. We will discuss throughout the paper how to incorporate various kinds of prior information in the algorithm design.
2.3 Measurement techniques
The set-up of classical X-ray crystallography (aside from oversampling) corresponds to the most basic measurement set-up where the measurement vectors
 $a_k$
are the columns of the associated two-dimensional DFT matrix. This means that if x is an
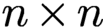 $n \times n$
image, we obtain
 $n^2$
Fourier-intensity samples, which is obviously not enough to recover x. Thus, besides oversampling, different strategies have been devised to obtain additional measurements about x. We briefly review these strategies and discuss many of them in more detail throughout the paper.
2.3.1 Coded diffraction imaging
The combination of X-ray diffraction, oversampling and phase retrieval has launched the field of coherent diffraction imaging or CDI (Miao et al. Reference Miao, Charalambous, Kirz and Sayre1999, Marchesini Reference Marchesini2007). A detailed description of CDI and phase retrieval can be found in Shechtman et al. (Reference Shechtman, Eldar, Cohen, Chapman, Miao and Segev2015). As pointed out by Shechtman et al. (Reference Shechtman, Eldar, Cohen, Chapman, Miao and Segev2015), the lensless nature of CDI is actually an advantage when dealing with extremely intense and destructive pulses, where one can only carry out a single pulse measurement with each object (say, a molecule) before the object disintegrates. Lensless imaging is mainly used in short wavelength spectral regions such as extreme ultraviolet (EUV) and X-ray, where high precision imaging optics are difficult to manufacture, expensive, and experience high losses. We discuss CDI in more detail in Section 2.4, as well as throughout the paper.
2.3.2 Multiple structured illuminations
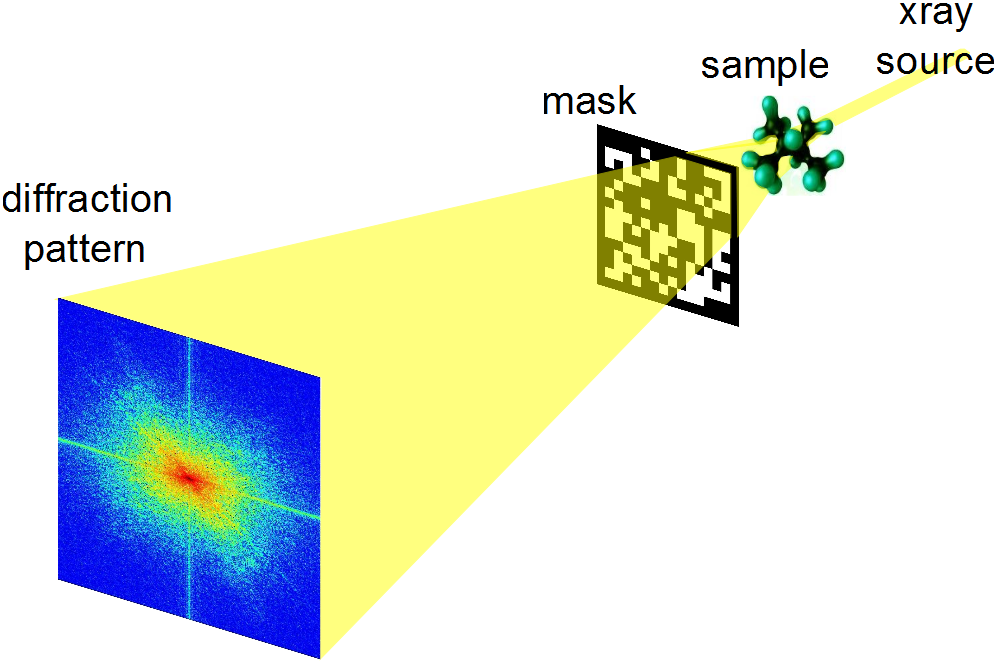
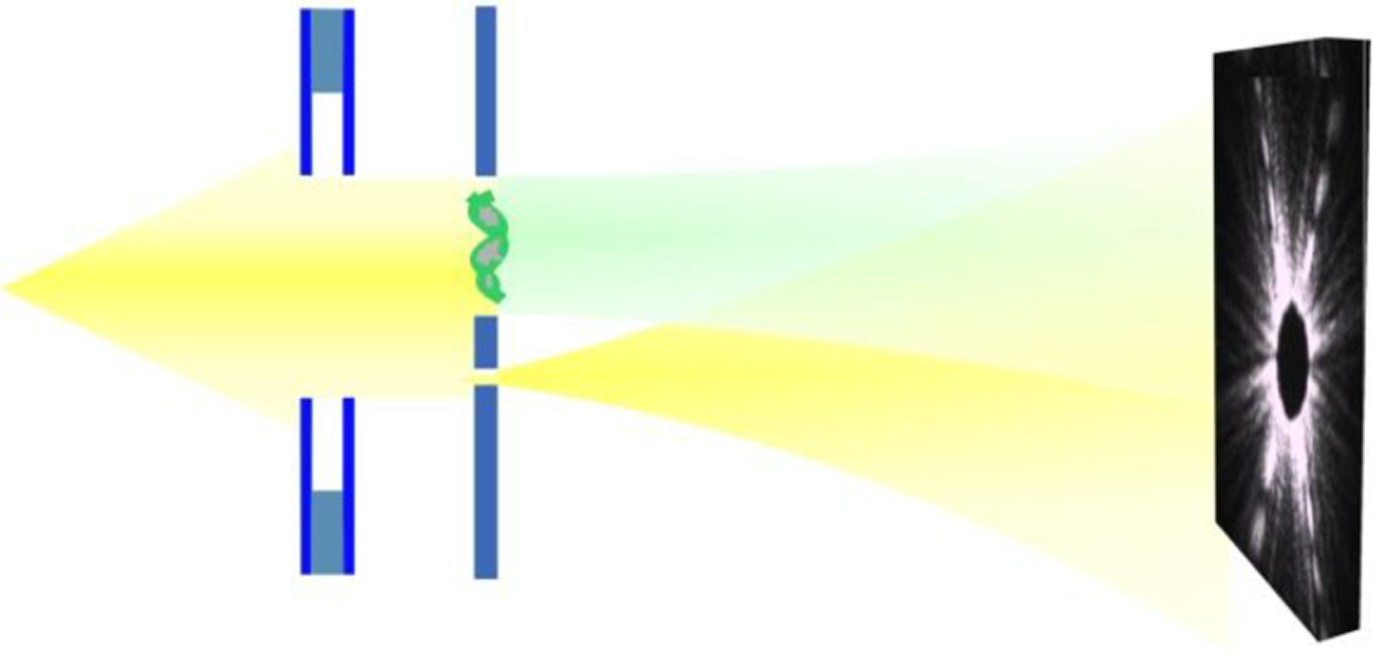
A very popular approach to increasing the number of measurements is to collect several diffraction patterns providing ‘different views’ of the sample or specimen, as illustrated in Figure 2.1. The concept of using multiple measurements as an attempt to resolve the phase ambiguity for diffraction imaging is of course not new, and was suggested by Misell (Reference Misell1973). Since then, a variety of methods have been proposed to carry out these multiple measurements; depending on the particular application, these may include the use of various gratings or masks, the rotation of the axial position of the sample, and the use of defocusing implemented in a spatial light modulator; see Duadi et al. (Reference Duadi, Margalit, Mico, Rodrigo, Alieva, Garcia and Zalevsky2011) for details and references.
Typical set-up for structured illuminations in diffraction imaging using a phase mask.

Inspired by work on compressive sensing and coded diffraction imaging, theoretical analysis clearly revealed the potential of combining randomness with multiple illuminations (Candès et al. Reference Candès, Strohmer and Voroninski2013b , Fannjiang Reference Fannjiang2012). Despite the sometimes expressed scepticism towards the feasibility of random illuminations (Luke Reference Luke2017), this concept has a long history in optics and X-ray imaging, and great progress continues to be made (Maiden et al. Reference Maiden, Morrison, Kaulich, Gianoncelli and Rodenburg2013, Horisaki, Egami and Tanida Reference Horisaki, Egami and Tanida2016, Peng, Ruane, Quadrelli and Swartzlander Reference Peng, Ruane, Quadrelli and Swartzlander2017, Seaberg, d’Aspremont and Turner Reference Seaberg, d’Aspremont and Turner2015, Zhang et al. Reference Zhang, Chen, Morrison, Vila-Comamala, Guizar-Sicairos and Robinson2016, Marchesini and Sakdinawat Reference Marchesini and Sakdinawat2019), thereby exemplifying the exciting advances that can be achieved by an efficient feedback loop between theory and practice. To quote from Marchesini and Sakdinawat (Reference Marchesini and Sakdinawat2019): ‘The ability to arbitrarily shape coherent x-ray wavefronts at new synchrotron and x-ray free electron facilities with these new optics will lead to advances in measurement capabilities and techniques that have been difficult to implement in the x-ray regime.’
We can create multiple illuminations in many ways. One possibility is to modify the phase front after the sample by inserting a mask or a phase plate; see Liu et al. (Reference Liu2008), for example. A schematic layout is shown in Figure 2.1. Another standard approach would be to change the profile or modulate the illuminating beam, which can easily be accomplished by the use of optical gratings (Loewen and Popov Reference Loewen and Popov1997). A simplified representation would look similar to the scheme depicted in Figure 2.1, with a grating instead of the mask (the grating could be placed before or after the sample).
Ptychography can be seen as an example of multiple illuminations. But due to its specific structure, ptychography deserves to be treated separately. In ptychography, one records several diffraction patterns from overlapping areas of the sample; see Rodenburg (Reference Rodenburg2008), Thibault et al. (Reference Thibault, Dierolf, Bunk, Menzel and Pfeiffer2009) and references therein. We discuss ptychography in more detail in Sections 2.7 and 2.5. In Johnson et al. (Reference Johnson, Jefimovs, Bunk, David, Dierolf, Gray, Renker and Pfeiffer2008), the sample is scanned by shifting the phase plate as in ptychography; the difference is that one scans the known phase plate rather than the object being imaged. Oblique illuminations are another way to create multiple illuminations. Here one can use illuminating beams hitting the sample at a user-specified angle (Faridian et al. Reference Faridian, Hopp, Pedrini, Eigenthaler, Hirscher and Osten2010).
In mathematical terms, the phase retrieval problem when using multiple structured illuminations in the measurement process can be expressed as follows:
 $$ \begin{align*} &\text{Find}\qquad\qquad x\\ &\text{subject to}\qquad\!\!\! y_{k,\ell} = |(FD_\ell x)_k|^2, \quad k=1,\ldots,n; \ell =1,\ldots,L, \end{align*} $$
where
 $D_\ell $
is a diagonal matrix representing the
 $\ell $
th mask out of a total of L different masks, and the total number of measurements is given by
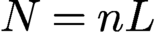 $N=nL$
.
2.3.3 Holography
Holographic techniques, going back to the seminal work of Dennis Gabor (Reference Gabor1948), are among the more popular methods that have been proposed to measure the phase of the optical wave. The basic idea of holography is to include a reference in the illumination process. This prior information can be utilized to recover the phase of the signal. While holographic techniques have been successfully applied in certain areas of optical imaging, they can generally be difficult to implement in practice (Duadi et al. Reference Duadi, Margalit, Mico, Rodrigo, Alieva, Garcia and Zalevsky2011). In recent years we have seen significant progress in this area (Saliba et al. Reference Saliba, Bosgra, Parsons, Wagner, Rau and Thibault2016, Latychevskaia, Longchamp and Fink Reference Latychevskaia, Longchamp and Fink2012). We postpone a more detailed discussion of holographic methods to Section 8.
2.4 Measurement of coded diffraction patterns
Due to the importance of coded diffraction patterns for phase retrieval, we describe this scheme in more detail. Let
 be the object domain containing the support of the discrete object
 ${x_{*}}$
, where
 denotes the integers between, and including,
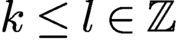 $k\le l\in {\mathbb {Z}}$
.
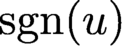
For any vector u, define its modulus vector
 $|u|$
as
 $|u|(j)= |u(j)| $
and its phase vector
 ${\text {sgn}}(u)$
as
 $$ \begin{align*} {\text{sgn}}(u)(j)=\begin{cases} {\mathrm{e}}^{{\mathrm{i}} \alpha}&\text{if } u(j)=0, \\ u(j)/|u(j)|&\text{else, } \end{cases} \end{align*} $$
where j is the index for the vector component. The choice of
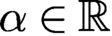 $\alpha \in {\mathbb {R}}$
is arbitrary when
 $u(j)$
vanishes. However, for numerical implementation,
 $\alpha $
can be conveniently set to
 $0$
.
In the noiseless case the phase retrieval problem is to solve
 $$ \begin{align} b=|u|\quad \text{with } u=A{x_{*}} \end{align} $$
for unknown object
 ${x_{*}}$
with given data b and some measurement matrix A.
Let
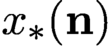 ${x_{*}}({\mathbf n})$
,
 ${\mathbf n} = (n_1,n_2,\ldots ,n_d)\in {\mathbb {Z}}^d,$
be a discrete object function supported in
 $$ \begin{align*} {\mathcal{M}} = \{ 0\le m_1\le M_1, 0\le m_2\le M_2,\ldots, 0\leq m_d\leq M_d\}. \end{align*} $$
Define the d-dimensional discrete-space Fourier transform of
 ${x_{*}}$
as
 $$ \begin{align*} {\sum_{{\mathbf n}\in {\mathcal{M}}} {x_{*}}({\mathbf n}) \,{\mathrm{e}}^{ - 2\pi {\mathrm{i}} {\mathbf n}\cdot {\mathbf{w}}},\quad {\mathbf{w}}=(w_1,\ldots,w_d)\in [0,1]^d.} \end{align*} $$
However, only the intensities of the Fourier transform, called the diffraction pattern, are measured, that is,
 $$ \begin{align*} \sum_{{\mathbf n} =-{\mathbf{M}}}^{{\mathbf{M}}}\sum_{{\mathbf{m}}\in {\mathcal{M}}} {x_{*}}({\mathbf{m}}+{\mathbf n})\overline{{x_{*}}({\mathbf{m}})} \,{\mathrm{e}}^{-{\mathrm{i}} 2\pi {\mathbf n}\cdot {\mathbf{w}}},\quad {\mathbf{M}} = (M_1,\ldots,M_d), \notag \end{align*} $$
which is the Fourier transform of the autocorrelation
 $$ \begin{align*} R({\mathbf n})=\sum_{{\mathbf{m}}\in {\mathcal{M}}} {x_{*}}({\mathbf{m}}+{\mathbf n})\overline{{x_{*}}({\mathbf{m}})}. \end{align*} $$
Here and below the over-line means complex conjugacy.
Note that R is defined on the enlarged grid
 $$ \begin{align*} \widetilde {\mathcal{M}} = \{ (m_1,\ldots, m_d)\in {\mathbb{Z}}^d\colon -M_1 \le m_1 \le M_1,\ldots, -M_d\le m_d\leq M_d \} , \end{align*} $$
whose cardinality is roughly
 $2^d$
times that of
 ${\mathcal {M}}$
. Hence, by sampling the diffraction pattern on the grid
 $$ \begin{align*} {\mathcal{L}} = \biggl\{(w_1,\ldots,w_d)\ | \ w_j = 0,{\displaystyle \frac{1}{2 M_j + 1}},{\displaystyle \frac{2}{2M_j + 1}},\ldots, {\displaystyle \frac{2M_j}{2M_j + 1}}\biggr\}, \end{align*} $$
we can recover the autocorrelation function by the inverse Fourier transform. This is the standard oversampling with which the diffraction pattern and the autocorrelation function become equivalent via the Fourier transform.
A coded diffraction pattern is measured with a mask whose effect is multiplicative and results in a masked object
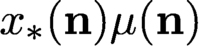 ${ x_{*}}({\mathbf n}) \mu ({\mathbf n})$
, where
 $\mu ({\mathbf n})$
is an array of random variables representing the mask. In other words, a coded diffraction pattern is just the plain diffraction pattern of a masked object.
We will focus on the effect of random phases
 $ \phi ({\mathbf n})$
in the mask function
 $\mu ({\mathbf n})=|\mu |({\mathbf n})\,{\mathrm {e}}^{{\mathrm {i}} \phi ({\mathbf n})}$
, where
 $\phi ({\mathbf n})$
are independent, continuous real-valued random variables and
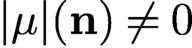 $|\mu |({\mathbf n})\neq 0$
for all
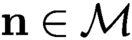 $ {\mathbf n}\in {\mathcal {M}}$
(i.e. the mask is transparent). The mask function by assumption is a finite set of continuous random variables and so is
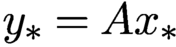 ${y_{*}}=A {x_{*}}$
. Therefore
 ${y_{*}}$
vanishes nowhere almost surely, that is,
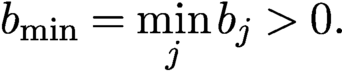 $$ \begin{align*} b_{\text{min}}= \min_{j} b_j>0. \end{align*} $$
For simplicity we assume
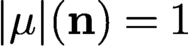 $|\mu |({\mathbf n})=1$
for all
 ${\mathbf n}$
, which gives rise to a phase mask and an isometric, or unitary, propagation matrix
 $$ \begin{align} \text{(1-mask)}\quad A= c\Phi\ {\operatorname{diag}}\{\mu\}, \end{align} $$
that is,
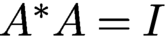 $A^{*}A=I$
(with a proper choice of the normalizing constant c), where
 $\Phi $
is the oversampled d-dimensional discrete Fourier transform (DFT). Specifically,
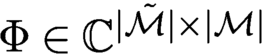 $\Phi \in {\mathbb {C}}^{|\tilde {\mathcal {M}}|\times |{\mathcal {M}}|}$
is the sub-column matrix of the standard DFT on the extended grid
 $\tilde {\mathcal {M}}$
, where
 $|{\mathcal {M}}|$
is the cardinality of
 ${\mathcal {M}}$
.
If the non-vanishing mask
 $\mu $
does not have uniform transparency, i.e.
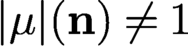 $|\mu |({\mathbf n})\neq 1$
for all
 ${\mathbf n}$
, then we can define a new object vector
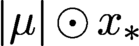 $|\mu |\odot {x_{*}}$
and a new isometric propagation matrix
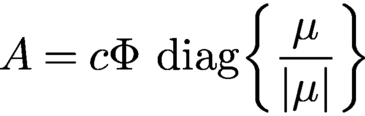 $$ \begin{align*} A= c\Phi\ {\operatorname{diag}}\biggl\{\displaystyle \frac{\mu}{|\mu|}\biggr\} \end{align*} $$
with which to recover the new object first.
When two phase masks
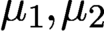 $\mu _1, \mu _2$
are deployed, the propagation matrix
 $A^*$
is the stacked coded DFTs, that is,
 $$ \begin{align} \text{(2-mask case)}\quad A=c \begin{bmatrix} \Phi\ {\operatorname{diag}}\{\mu_1\}\\ \Phi\ {\operatorname{diag}}\{\mu_2\} \end{bmatrix}\!. \end{align} $$
With proper normalization, A is isometric.
All of the results with coded diffraction patterns present in this work apply to
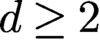 $d\geq 2$
. But the most relevant case is
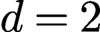 $d=2$
, which is assumed hereafter. We can vectorize the object/masks by converting the
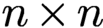 $n\times n$
square grid into a long vector. Let N be the total number of measured data. In other words
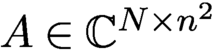 $A\in {\mathbb {C}} ^{N\times n^2}$
, where N is about
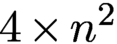 $4\times n^2$
and
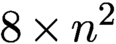 $8\times n^2$
, respectively, in the case of (2.3) and (2.4).
2.5 Ptychography
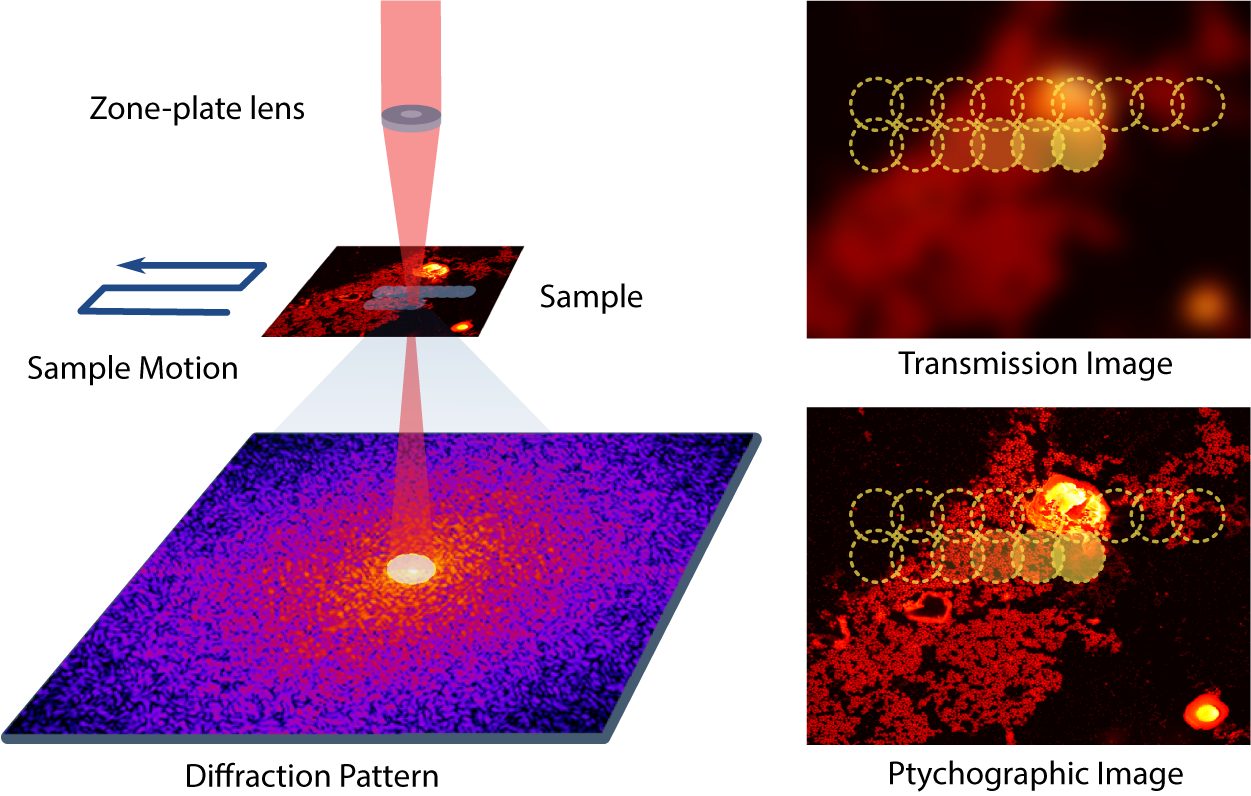
Ptychography is a special case of coherent diffractive imaging that uses multiple micro-diffraction patterns obtained by scanning across the unknown specimen with a mask, making a measurement for each location via a localized illumination on the specimen (Hoppe Reference Hoppe1969, Rodenburg Reference Rodenburg2008). This provides a much larger set of measurements, but at the cost of a longer, more involved experiment. As such, ptychography is a synthetic aperture technique and, along with advances in detection and computation techniques, has enabled microscopies with enhanced resolution and robustness without the need for lenses. Ptychography offers numerous benefits and has thus attracted significant attention. See Dierolf et al. (Reference Dierolf, Menzel, Thibault, Schneider, Kewish, Wepf, Bunk and Pfeiffer2010), Thibault et al. (Reference Thibault, Dierolf, Bunk, Menzel and Pfeiffer2009), Rodenburg (Reference Rodenburg2008), Qian et al. (Reference Qian, Yang, Schirotzek, Maia and Marchesini2014), Pfeiffer (Reference Pfeiffer2018) and Horstmeyer et al. (Reference Horstmeyer, Chung, Ou, Zheng and Yang2016) for a small sample of different activities in this field.
Schematic depiction of a ptychography experiment in which a probe scans through a two-dimensional object in an overlapping fashion and produces a sequence of diffraction patterns of the scanned regions. Image courtesy of Qian et al. (Reference Qian, Yang, Schirotzek, Maia and Marchesini2014).
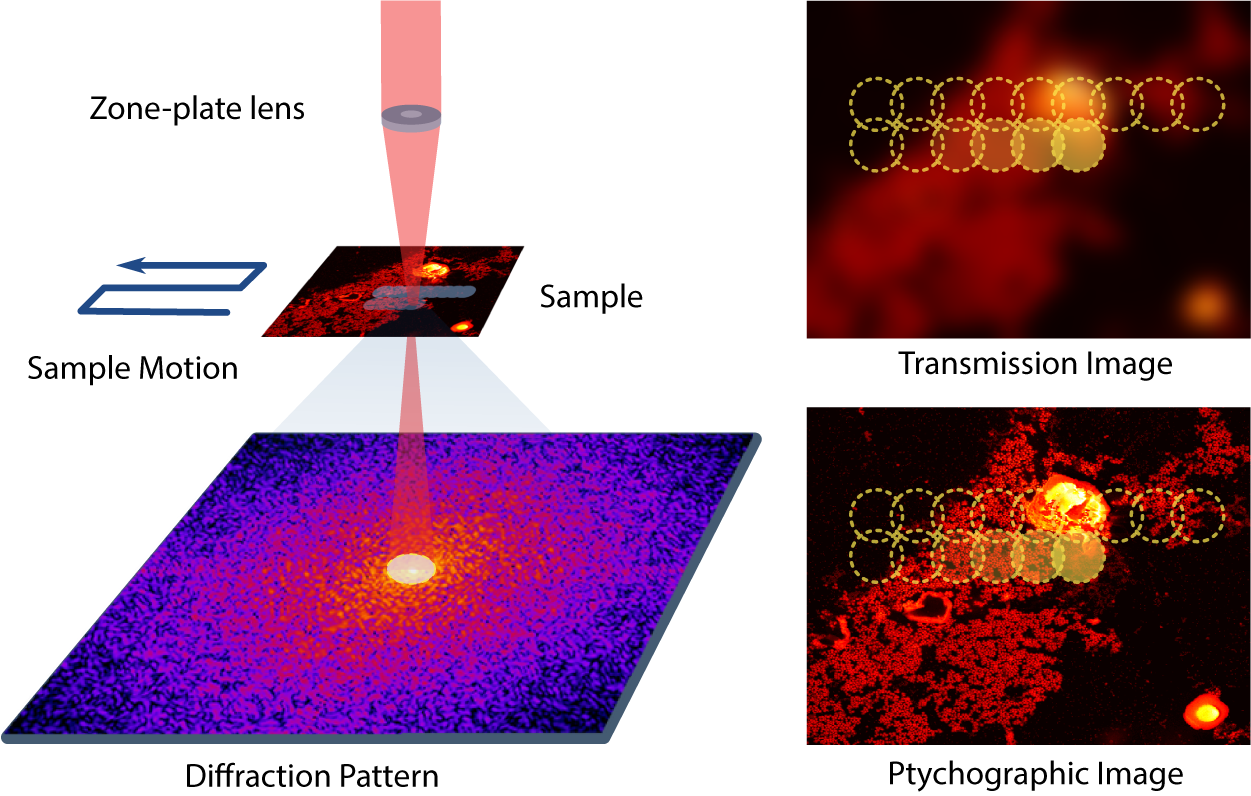
Figure 2.2 is a schematic depiction of a ptychography experiment in which a probe scans through a two-dimensional object in an overlapping fashion and produces a sequence of diffraction patterns of the scanned regions. Each image frame represents the magnitude of the Fourier transform of
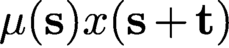 $\mu ({\mathbf s}) x({\mathbf s} + {\mathbf t})$
, where
 $\mu ({\mathbf s})$
is a localized illumination (window) function or a mask,
 $x({\mathbf s})$
is the unknown object of interest and t is a translational vector. Thus the measurements taken in ptychography can be expressed as
 $$ \begin{align} | F(\mu({\mathbf s}) x({\mathbf s}+{\mathbf t}) |^2. \end{align} $$
Due to its specific underlying mathematical structure, ptychography warrants its own analysis. A detailed discussion of various reconstruction algorithms for ptychography can be found in Qian et al. (Reference Qian, Yang, Schirotzek, Maia and Marchesini2014). For a convex approach using the PhaseLift idea, see for instance Horstmeyer et al. (Reference Horstmeyer, Chen, Ou, Ames, Tropp and Yang2015). An intriguing algorithm that combines ideas from PhaseLift with the local nature of the measurements can be found in Iwen, Preskitt, Saab and Viswanathan (Reference Iwen, Preskitt, Saab and Viswanathan2016).
2.6 Ptychography and time-frequency analysis
An inspection of the basic measurement mechanism of ptychography in (2.5) shows an interesting connection to time-frequency analysis (Gröchenig Reference Gröchenig2001). To see this, we recall the definition of the short-time Fourier transform (STFT) and the Gabor transform. For
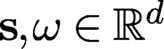 ${\mathbf s},\omega \in {\mathbb {R}}^d$
we define the translation operator
 $ T_{\mathbf s}$
and the modulation operator
 $ M_{\omega }$
by
 $$ \begin{align*} {T_{\mathbf s} x({\mathbf t}) = x({\mathbf t}-{\mathbf s}), \quad M_{{\boldsymbol{\omega}}} x({\mathbf t}) = {\mathrm{e}}^{2\pi {\mathrm{i}} {\boldsymbol{\omega}} \cdot {\mathbf t}} x({\mathbf t}),} \end{align*} $$
where
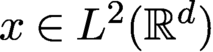 $x \in L^2({\mathbb {R}}^d)$
. Let
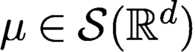 $\mu \in {\cal S}({\mathbb {R}}^d)$
, where
 ${\cal S}$
denotes the Schwartz space. The STFT of x with respect to the window
 $ \mu $
is defined by
 $$ \begin{align*} {\mathcal V}_\mu x({\mathbf s},{\boldsymbol{\omega}}) = \int\limits_{{\mathbb{R}}^{d}} x({\mathbf t}) \mu({\mathbf s}-{\mathbf t}) \,{\mathrm{e}}^{-2\pi {\mathrm{i}} {\boldsymbol{\omega}} \cdot {\mathbf t}} {\,{\mathrm{d}}} t = \langle x, M_\omega T_{\mathbf s} \mu \rangle , \quad ({\mathbf s},{\boldsymbol{\omega}}) \in {\mathbb{R}}^{2d}. \end{align*} $$
A Gabor system consists of functions of the form
 $$ \begin{align*} { {\mathrm{e}}^{2\pi {\mathrm{i}} b{\mathbf l} {\mathbf t}} \mu({\mathbf t}- a{\mathbf k} ) = M_{b{\mathbf l} } T_{a {\mathbf k} } \mu ,\quad ({\mathbf k},{\mathbf l}) \in {\mathbb{Z}}^d \times {\mathbb{Z}}^d ,} \end{align*} $$
where
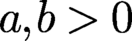 $a, b>0$
are the time- and frequency-shift parameters (Gröchenig Reference Gröchenig2001). The associated Gabor transform
 $G\colon L^2({\mathbb {R}}) \mapsto \ell ^2({\mathbb {Z}}\times {\mathbb {Z}})$
is definedas
 $$ \begin{align*} {Gx = \{\langle x, M_{b {\mathbf l} } T_{a {\mathbf k} } \mu \rangle\}_{({\mathbf k},{\mathbf l}) \in {\mathbb{Z}}^d \times {\mathbb{Z}}^d}.} \end{align*} $$
G is clearly just an STFT that has been sampled at the time-frequency lattice
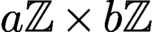 $a{\mathbb {Z}} \times b{\mathbb {Z}}$
. It is clear that the definitions of the STFT and Gabor transform above can be adapted in an obvious way for discrete or finite-dimensional functions.
Since ptychographic measurements take the form
 $\{| \langle x, M_{{\boldsymbol {\omega }}} T_{{\mathbf s}} \mu \rangle |^2\}$
, where
 $({\mathbf s},{\boldsymbol {\omega }})$
are indices of some time-frequency lattice, it is now evident that these measurements simply correspond to squared magnitudes of the STFT or (depending on the chosen time-frequency shift parameters) of the Gabor transform of the signal x with respect to the mask
 $\mu $
. Thus, methods developed for the reconstruction of a function from magnitudes of its (sampled) STFT (see e.g. Eldar et al. Reference Eldar, Sidorenko, Mixon, Barel and Cohen2014, Pfander and Salanevich Reference Pfander and Salanevich2019 and Grohs, Koppensteiner and Rathmair Reference Grohs, Koppensteiner and Rathmair2020) become relevant for ptychography.
Beyond ptychography, phase retrieval from the STFT magnitude has been used in speech and audio processing (Nawab, Quatieri and Lim Reference Nawab, Quatieri and Lim1983, Balan Reference Balan2010). It has also found extensive applications in optics. As described in Jaganathan et al. (Reference Jaganathan, Eldar and Hassibi2015), one example arises in frequency-resolved optical gating (FROG) or XFROG, which is used for characterizing ultra-short laser pulses by optically producing the STFT magnitude of the measured pulse.
2.7 Two-dimensional ptychography
While the mathematical framework of ptychography can be formulated in any dimension, the two-dimensional case is the most relevant in practice. In the ptychographic measurement, the
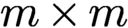 $m\times m$
mask has a smaller size than the
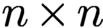 $n\times n$
object, i.e.
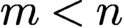 $m< n$
, and is shifted around to various positions for measurement of coded diffraction patterns so as to cover the entire object.
Let
 ${\mathcal {M}}^{0}:={\mathbb {Z}}_m^2,\, m \lt n,$
be the initial mask area, i.e. the support of the mask
 $\mu ^{0}$
describing the illumination field. Let
 ${\mathcal {T}}$
be the set of all shifts (i.e. the scan pattern), including
 $(0,0)$
, involved in the ptychographic measurement. Let
 $\mu ^{\mathbf t}$
be the
 ${\mathbf t}$
-shifted mask for all
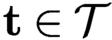 ${\mathbf t}\in {\mathcal {T}}$
and let
 ${\mathcal {M}}^{\mathbf t}$
be the domain of
 $\mu ^{\mathbf t}$
. Let
 $x_{*}^{\mathbf t}$
be the object restricted to
 ${\mathcal {M}}^{\mathbf t}$
. We refer to each
 $x_{*}^{\mathbf t}$
as a part of
 ${x_{*}}$
and write
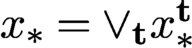 ${x_{*}}=\vee _{\mathbf t} x_{*}^{\mathbf t}$
, where
 $\vee $
is the ‘union’ of functions consistent over their common support set. In ptychography, the original object is broken up into a set of overlapping object parts, each of which produces a
 $\mu ^{\mathbf t}$
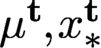
-coded diffraction pattern. The totality of the coded diffraction patterns is called the ptychographic measurement data. For convenience of analysis, we assume the value zero for
 $\mu ^{\mathbf t}, x_{*}^{\mathbf t}$
outside
 ${\mathcal {M}}^{\mathbf t}$
and the periodic boundary condition on
 ${\mathbb {Z}}_n^{2}$
when
 $\mu ^{\mathbf t}$
crosses over the boundary of
 ${\mathbb {Z}}_n^{2}$
.
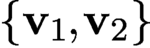
A basic scanning pattern is the two-dimensional lattice with the basis
 $\{{\mathbf v}_1, {\mathbf v}_2\}$
,
 $$ \begin{align*} {\mathcal{T}}=\{{\mathbf t}_{kl}\equiv k{\mathbf v}_1+l{\mathbf v}_2\colon k,l\in {\mathbb{Z}}\},\quad {\mathbf v}_1,{\mathbf v}_2\in {\mathbb{Z}}^2, \end{align*} $$
acting on the object domain
 ${\mathbb {Z}}_n^{2}$
. Instead of
 ${\mathbf v}_1$
and
 ${\mathbf v}_2$
we can also take
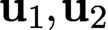
 $ {\mathbf u}_1=\ell _{11}{\mathbf v}_1+\ell _{12}{\mathbf v}_2$
and
 ${\mathbf u}_2=\ell _{21} {\mathbf v}_1+\ell _{22}{\mathbf v}_2$
for integers
 $\ell _{ij}$
with
 $\ell _{11}\ell _{22}-\ell _{12}\ell _{21}=\pm 1$
. This ensures that
 ${\mathbf v}_1$
and
 ${\mathbf v}_2$
themselves are integer linear combinations of
 ${\mathbf u}_1,{\mathbf u}_2$
. Every lattice basis defines a fundamental parallelogram, which determines the lattice. There are five two-dimensional lattice types, called period lattices, as given by the crystallographic restriction theorem. In contrast, there are 14 lattice types in three dimensions, called Bravais lattices.
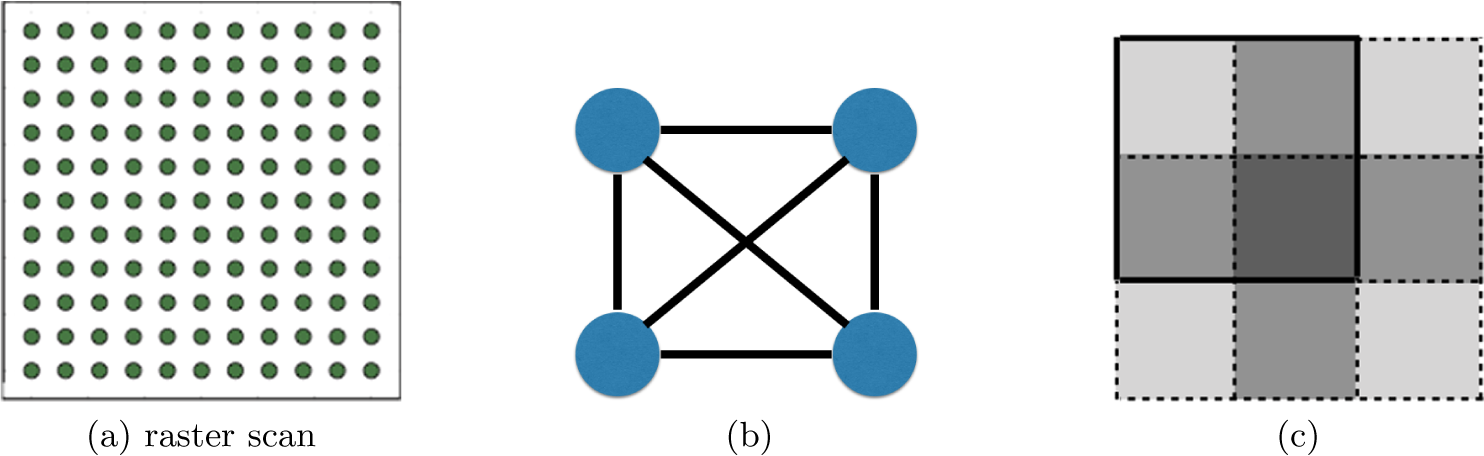
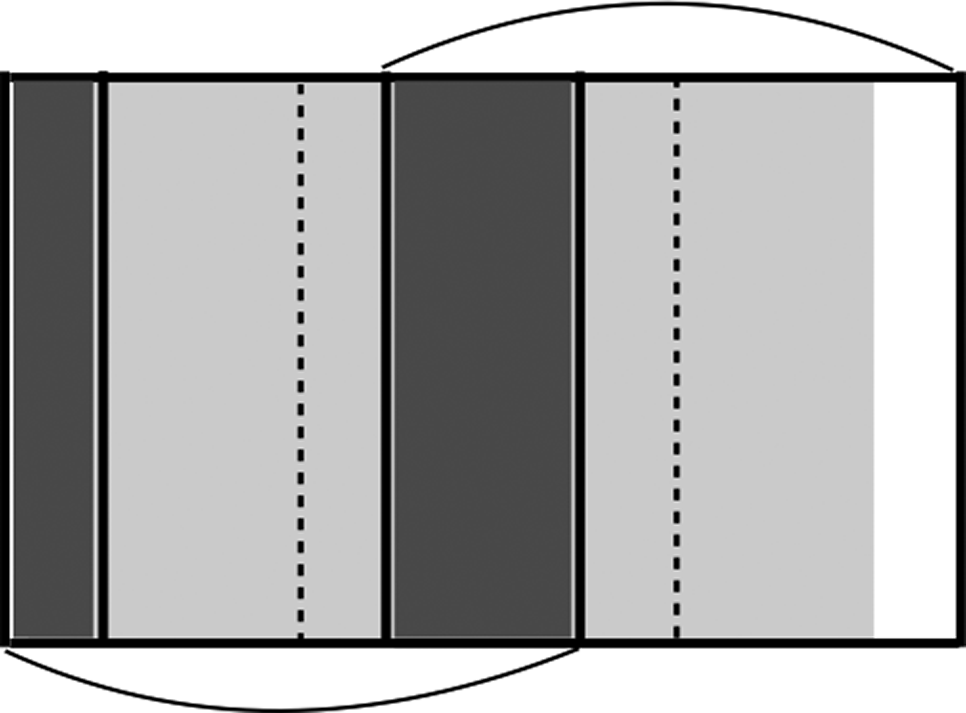
A complete undirected graph (a) representing four connected object parts (b), where the grey level indicates the number of coverages by the mask in four scan positions (c).
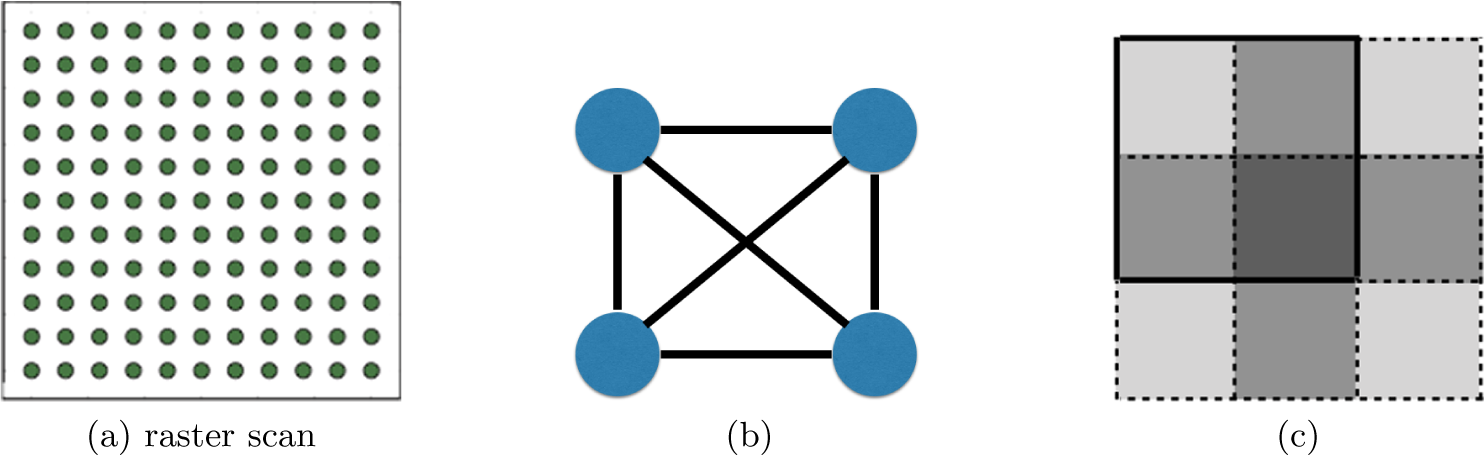
Under the periodic boundary condition, the raster scan with step size
 $\tau =n/q, q\in {\mathbb {N}}$
,
 ${\mathcal {T}}$
consists of
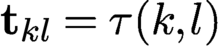 ${\mathbf t}_{kl}={\tau }(k,l)$
, with
 $k,l\in \{0,1,\ldots , q-1\}$
(Figure 2.3(a)). The periodic boundary condition means that for
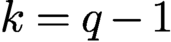 $k=q-1$
or
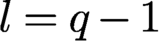 $l=q-1$
the shifted mask is wrapped around into the other end of the object domain.
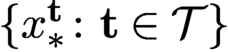
A basic requirement is the strong connectivity property of the object with respect to the measurement scheme. It is useful to think of connectivity in graph-theoretical terms. Let the ptychographic experiment be represented by a complete graph
 ${\mathcal G}$
whose nodes correspond to
 $\{x^{\mathbf t}_{*}\colon {\mathbf t}\in {\mathcal {T}}\}$
(see Figure 2.3(b)).
An edge between two nodes corresponding to
 $x_{*}^{\mathbf t}$
and
 $x_{*}^{{\mathbf t}'}$
is s-connective if
 $$ \begin{align} |{\mathcal{M}}^{\mathbf t}\cap {\mathcal{M}}^{{\mathbf t}'}\cap\, {\operatorname{supp}}({x_{*}})|\ge s\ge 2, \end{align} $$
where
 $|\cdot |$
denotes the cardinality. In the case of full support (i.e.
 ${\operatorname {supp}}({x_{*}})={\mathcal {M}}$
), (2.6) becomes
 $|{\mathcal {M}}^{\mathbf t}\cap {\mathcal {M}}^{{\mathbf t}'}|\ge s$
. An s-connective subgraph
 ${\mathcal G}_s$
of
 ${\mathcal G}$
consists of all the nodes of
 ${\mathcal G}$
but only the s-connective edges. Two nodes are adjacent (and neighbours) in
 ${\mathcal G}_s$
if and only if they are s-connected. A chain in
 ${\mathcal G}_s$
is a sequence of nodes such that two successive nodes are adjacent. In a simple chain all the nodes are distinct. Then the object parts
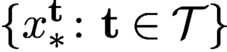 $\{ x_{*}^{\mathbf t}\colon {\mathbf t}\in {\mathcal {T}}\}$
are s-connected if and only if
 ${\mathcal G}_s$
is a connected graph, i.e. every two nodes is connected by a chain of s-connective edges. Loosely speaking, an object is strongly connected with respect to the ptychographic scheme if
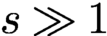 $s\gg 1$
. We say that
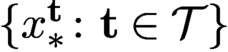 $\{ x_{*}^{\mathbf t}\colon {\mathbf t}\in {\mathcal {T}}\}$
are s-connected if there is an s-connected chain between any two elements.
Let us consider the simplest raster scan corresponding to the square lattice with
 ${\mathbf v}_1=(\tau ,0), {\mathbf v}_2=(0,\tau )$
of step size
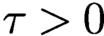 $\tau>0$
, that is,
 $$ \begin{align} {\mathbf t}_{kl}=\tau (k,l),\quad k,l=0,\ldots, q-1. \end{align} $$
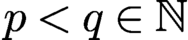
For even coverage of the object, we assume that
 $\tau =n/q=m/p$
for some
 $p< q\in {\mathbb {N}}$
.
Denote the
 ${\mathbf t}_{kl}$
-shifted masks and blocks by
 $\mu ^{kl}$
and
 ${\mathcal {M}}^{kl}$
, respectively. Likewise, let
 $x_{*}^{kl}$
denote the object restricted to the shifted domain
 ${\mathcal {M}}^{kl}$
.
Let
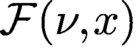 ${\mathcal F}(\nu ,x)$
be the bilinear transformation representing the totality of the Fourier (magnitude and phase) data for any mask
 $\nu $
and object x. From
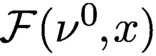 ${\mathcal F}(\nu ^0,x)$
we can define two measurement matrices. First, for a given
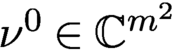 $\nu ^0\in {\mathbb {C}} ^{m^2}$
, let
 $A_{\nu }$
be defined via the relation
 $A_{\nu } x:={\mathcal F}(\nu ^0,x)$
for all
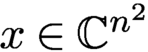 $x\in {\mathbb {C}} ^{n^2}$
. Second, for a given
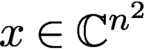 $x\in {\mathbb {C}} ^{n^2}$
, let
 $B_{x}$
be defined via
 $B_{x} {\nu }={\mathcal F}(\nu ^0,x)$
for all
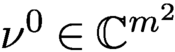 $\nu ^0\in {\mathbb {C}} ^{m^2}$
.
More specifically, let
 $\Phi $
denote the oversampled Fourier matrix. The measurement matrix
 $A_{\nu }$
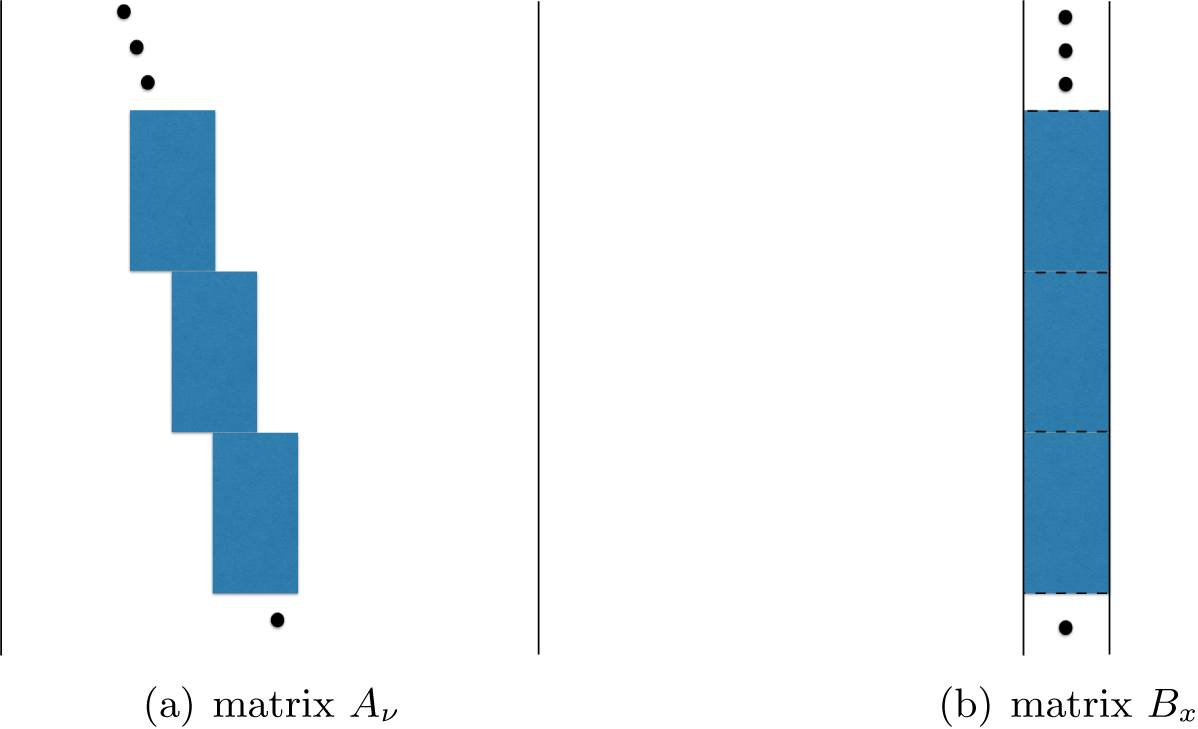
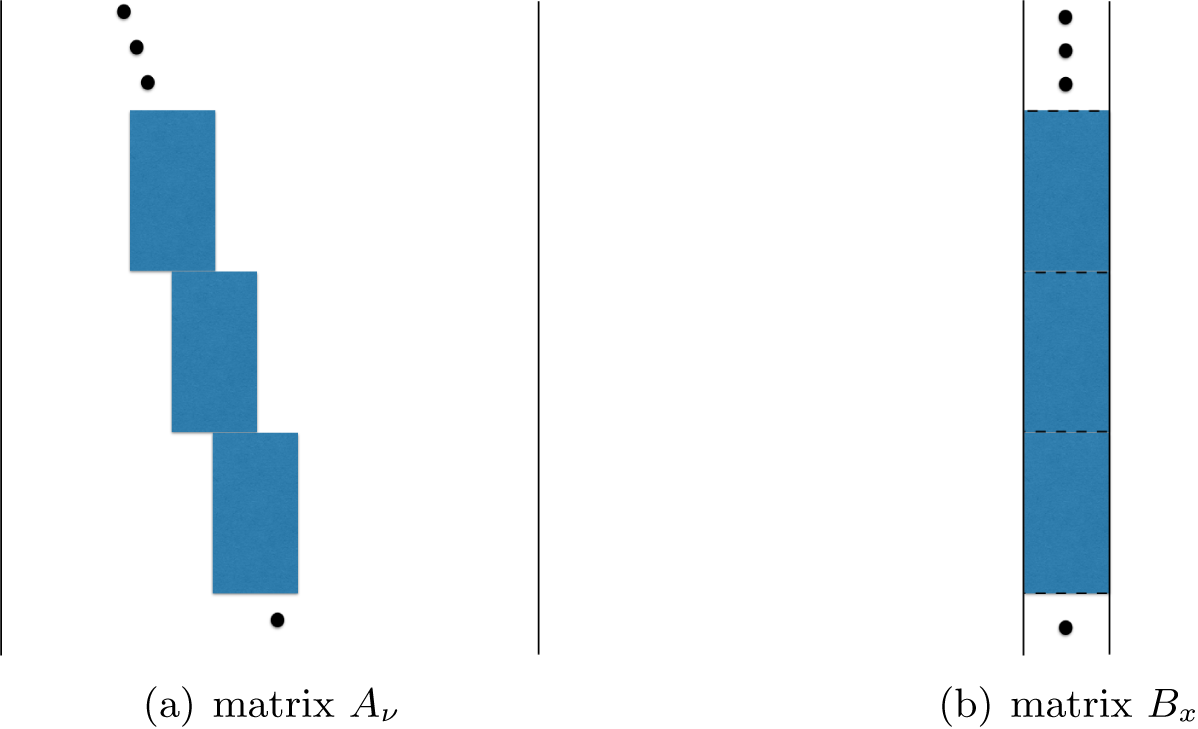
is a concatenation of
 $\{\Phi \,{\operatorname {diag}}(\nu ^{\mathbf t})\colon {\mathbf t} \in {\mathcal {T}}\}$
(Figure 2.4(a)). Likewise,
 $B_{x}$
is
 $\{\Phi \,{\operatorname {diag}}(x^{\mathbf t})\colon {\mathbf t} \in {\mathcal {T}}\}$
stacked on top of each other (Figure 2.4(b)). Since
 $\Phi $
has orthogonal columns, both
 $A_{\nu }$
and
 $B_{x}$
have orthogonal columns. Both matrices will be relevant when we discuss blind ptychography, which does not assume prior knowledge of the mask in Section 7.
(a)
 $A_{\nu }$
is a concatenation of shifted blocks
 $\{\Phi \ {\operatorname {diag}}({\nu }^{\mathbf t})\colon {\mathbf t}\in {\mathcal {T}}\}$
. (b)
 $B_{{x}}$
is a concatenation of unshifted blocks
 $\{\Phi \ {\operatorname {diag}}( x^{\mathbf t})\colon {\mathbf t}\in {\mathcal {T}}\}$
. In both cases, each block gives rise to a coded diffraction pattern
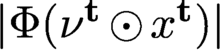 $|\Phi ({\nu }^{\mathbf t}\odot x^{\mathbf t})|$
.
3 Uniqueness, ambiguities, noise
In this section we discuss various questions of uniqueness and feasibility related to the phase retrieval problem. Since a detailed and thorough current review of uniqueness and feasibility can be found in Grohs et al. (Reference Grohs, Koppensteiner and Rathmair2020), we mainly focus on aspects not covered in that review. We will also discuss various noise models.
3.1 Uniqueness and ambiguities with coded diffraction patterns
We say that
 ${x_{*}}$
is a line object if the original object support is part of a line segment. Otherwise
 ${x_{*}}$
is said to be a nonlinear object.
A phase retrieval solution is unique only up to a constant of modulus one, no matter how many coded diffraction patterns are measured. Thus the proper error metric for an estimate
 $ x$
of the true solution
 ${x_{*}}$
is given by
 $$ \begin{align*} \min_{\theta\in {\mathbb{R}}}\|{\mathrm{e}}^{-{\mathrm{i}}\theta} {x_{*}}- x \|=\min_{\theta\in {\mathbb{R}}}\|{\mathrm{e}}^{{\mathrm{i}}\theta} x - {x_{*}} \|, \end{align*} $$
where the optimal phase adjustment
 $\theta _*$
is given by

Now we recall the uniqueness theorem of phase retrieval with coded diffraction patterns.
Theorem 3.1 (Fannjiang Reference Fannjiang2012).
Let
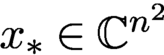 ${x_{*}}\in {\mathbb {C}} ^{n^2}$
be a nonlinear object and let x be a solution of the phase retrieval problem. Suppose that the phases of the random mask(s) are formed of independent continuous random variables on
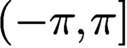
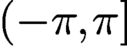 $(-\pi ,\pi ]$
.
(i) One-pattern case. Suppose, in addition, that
 for allj, with
 $\alpha +\beta \in (0,2)$
and that the density function for
 $\phi ({\mathbf n})$
is a constant (i.e.
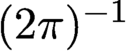 $(2\pi )^{-1}$
) for every
 ${\mathbf n}$
.
Then
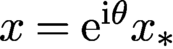 $x={\mathrm {e}}^{{\mathrm {i}}\theta } {x_{*}}$
for some constant
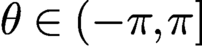 $\theta \in (-\pi ,\pi ]$
, with high probability, which has the simple lower bound
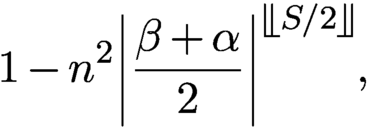
where S is the number of non-zero components in
 ${x_{*}}$
and
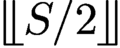 is the greatest integer less than or equal to
 $S/2$
.
(ii) Two-pattern case. Here
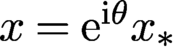 $x={\mathrm {e}}^{{\mathrm {i}}\theta } {x_{*}}$
for some constant
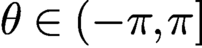 $\theta \in (-\pi ,\pi ]$
with probability one.
The proof of Theorem 3.1 is given in Fannjiang (Reference Fannjiang2012), where more general uniqueness theorems can be found. It is noteworthy that the probability bound for uniqueness (3.1) improves exponentially with higher sparsity of the object.
We have the analogous uniqueness theorem for ptychography.
Theorem 3.2 (Fannjiang and Chen Reference Fannjiang and Chen2020).
Let
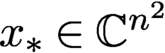 ${x_{*}}\in {\mathbb {C}} ^{n^2}$
be a nonlinear object and let x be a solution of the phase retrieval problem. Suppose that the phases of the random mask(s) are formed of independent continuous random variables on
 $(-\pi ,\pi ]$
.
If the connectivity condition (2.6) holds, then
 ${x_{*}}$
is the unique ptychographic solution up to a constant phase factor.
3.2 Ambiguities with one diffraction pattern
By the methods in Fannjiang (Reference Fannjiang2012), it can be shown that an object estimate
 ${x}$
produces the same coded diffraction pattern as
 ${x_{*}}$
if and only if
 $$ \begin{align} {x}({\mathbf n})= \begin{cases} {\mathrm{e}}^{{\mathrm{i}} \theta} {x_{*}}({\mathbf n} + {\mathbf{m}})\mu({\mathbf n} + {\mathbf{m}})/\mu({\mathbf n}), \\[6pt] {\mathrm{e}}^{{\mathrm{i}} \theta} \overline{{x_{*}}}({\mathbf{N}}-{\mathbf n} + {\mathbf{m}})\overline{\mu} ({\mathbf{N}}-{\mathbf n} + {\mathbf{m}})/\mu({\mathbf n}), \end{cases} \end{align} $$
for some
 ${\mathbf {m}}\in {\mathbb {Z}}^2, \theta \in {\mathbb {R}}$
almost surely. The ‘if’ part of the above statement is straightforward to check. The ‘only if’ part is a useful result of using a random mask in measurement. Therefore, in addition to the trivial phase factor, there are translational (related to
 ${\mathbf {m}}$
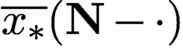
), conjugate-inversion (related to
 $\overline {{x_{*}}}({\mathbf {N}}-\cdot )$
) modulation ambiguities (related to
 $\mu ({\mathbf n}+ {\mathbf {m}})/\mu ({\mathbf n})$
or
 $\overline {\mu } ({\mathbf {N}}+ {\mathbf {m}}-{\mathbf n})/\mu ({\mathbf n})$
). Among these, the conjugate inversion (also known as the twin image) is more prevalent as it cannot be eliminated by a tight support constraint.
If, however, we have the prior knowledge that
 ${x_{*}}$
is real-valued, then none of the ambiguities in (3.2) can happen since the right-hand side of (3.2) has a non-zero imaginary part almost surely for any
 $\theta ,{\mathbf {m}}$
.
On the other hand, if the mask is uniform (i.e.
 $\mu =$
constant), then (3.2) becomes
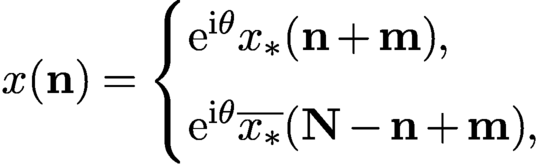 $$ \begin{align} {x}({\mathbf n})= \begin{cases} {\mathrm{e}}^{{\mathrm{i}} \theta} {x_{*}}({\mathbf n} + {\mathbf{m}}) ,\\[6pt] {\mathrm{e}}^{{\mathrm{i}} \theta} \overline{{x_{*}}}({\mathbf{N}}-{\mathbf n} + {\mathbf{m}}), \end{cases} \end{align} $$
for some
 ${\mathbf {m}}\in {\mathbb {Z}}^2, \theta \in {\mathbb {R}}$
. Thus, even with the real-valued prior, all the ambiguities in (3.3) are present, including translation, conjugate-inversion (twin image) and constant phase factor. In addition, there may be other ambiguities not explicit in (3.3).
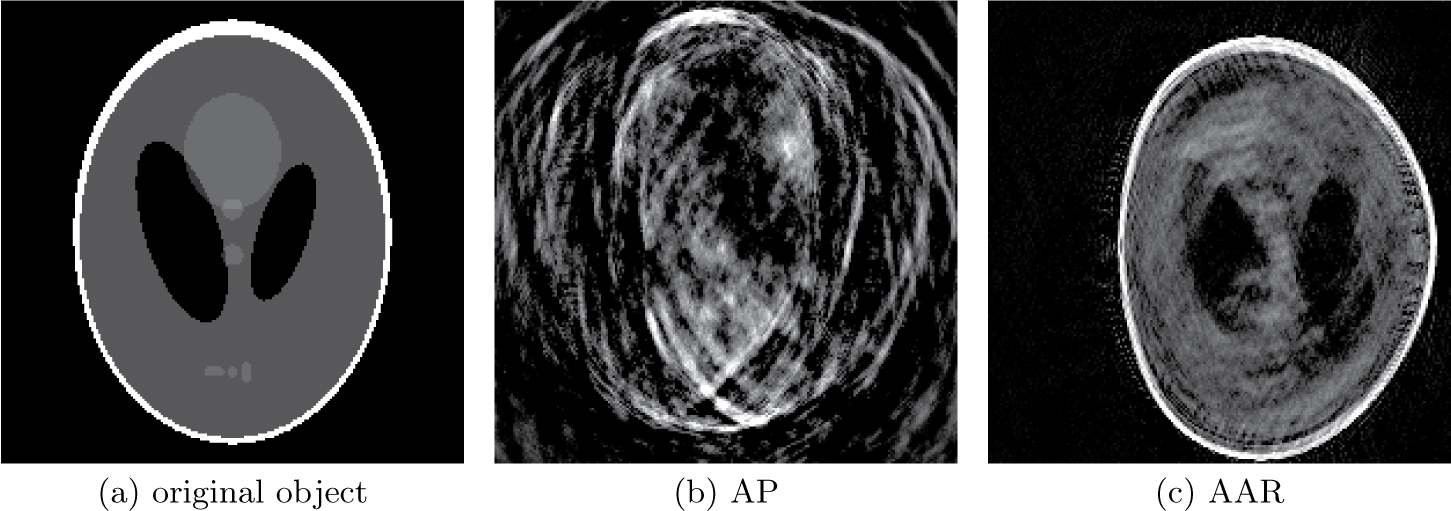
These ambiguities result in poor reconstruction, as shown in Figure 3.1 for the non-negative real-valued phantom with a plain uniform mask, using two widely used algorithms, alternating projections (AP) and averaged alternating reflections (AAR), both of which are discussed in Section 3.3.
(a) Non-negative real-valued phantom with a plain uniform mask, along with its AP (b) and AAR (c) reconstructions.
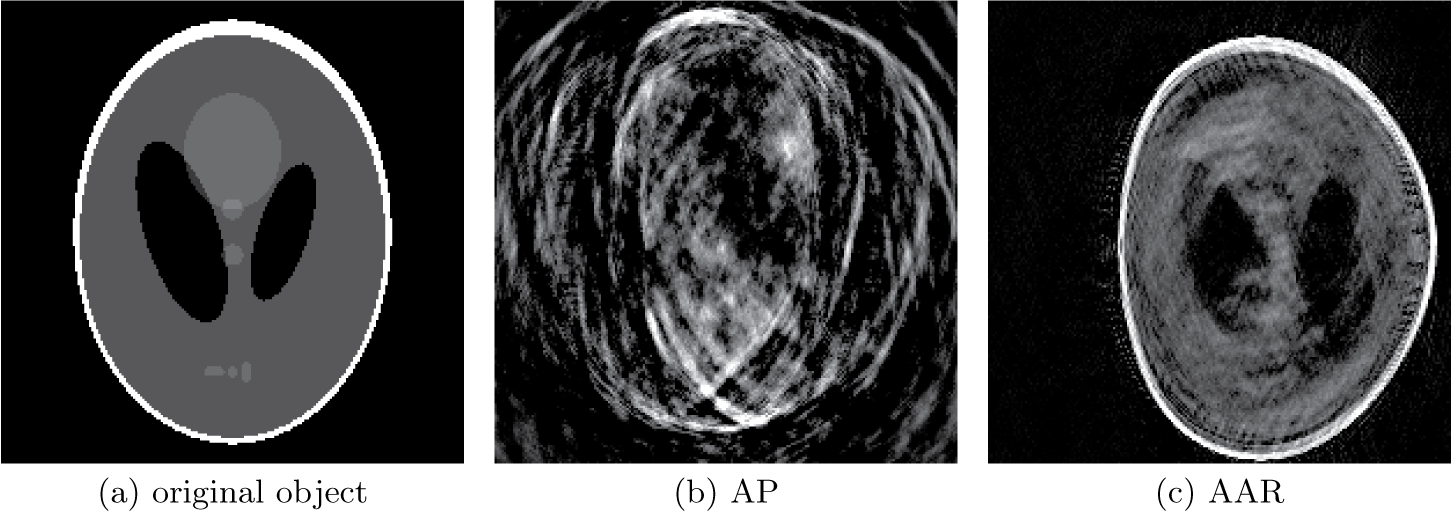
The phantom and its complex-valued variant, randomly phased phantom (RPP), used in Figure 3.2, have the distinguishing feature that their support is not the whole
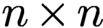 $n\times n$
grid but is surrounded by an extensive area of dark pixels, thus making the translation ambiguity in (3.3) show up. This is particularly apparent in Figure 3.1(c). In general, when the unknown object has full
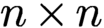 $n\times n$
support, phase retrieval becomes somewhat easier, because translation ambiguity is absent regardless of the mask used.
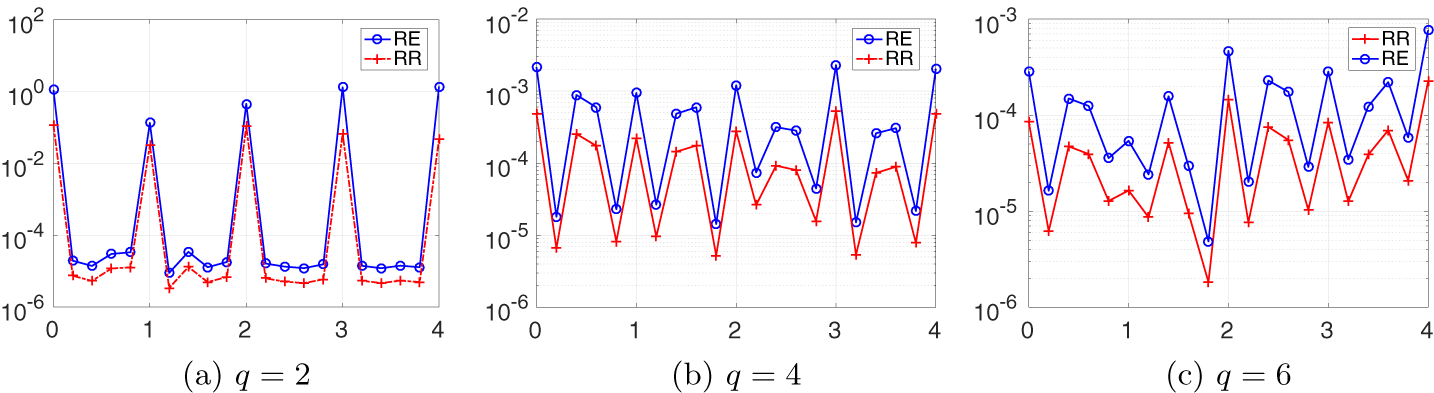
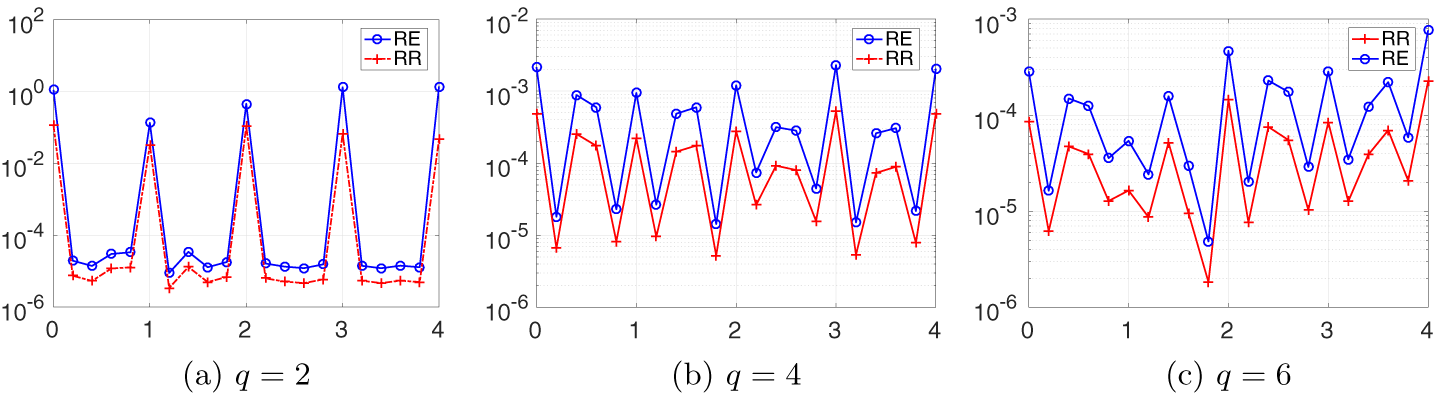
Relative error (RE) and relative residual (RR) on the semi-log scale versus the parameter f of the Fresnel mask for the test object RPP.
3.2.1 Twin-like ambiguity with a Fresnel mask
The next example shows that a commonly used mask can harbour a twin-like image as ambiguity, and the significance of using a ‘random’ mask for phase retrieval.
Consider the Fresnel mask function which, up to a shift, has the form
 $$ \begin{align} \mu^0(k_1,k_2):=\exp\{{\mathrm{i}} \pi f(k_1^2+k_2^2)/m\},\quad k_1, k_2=1,\ldots, m, \end{align} $$
where
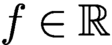 $f\in {\mathbb {R}}$
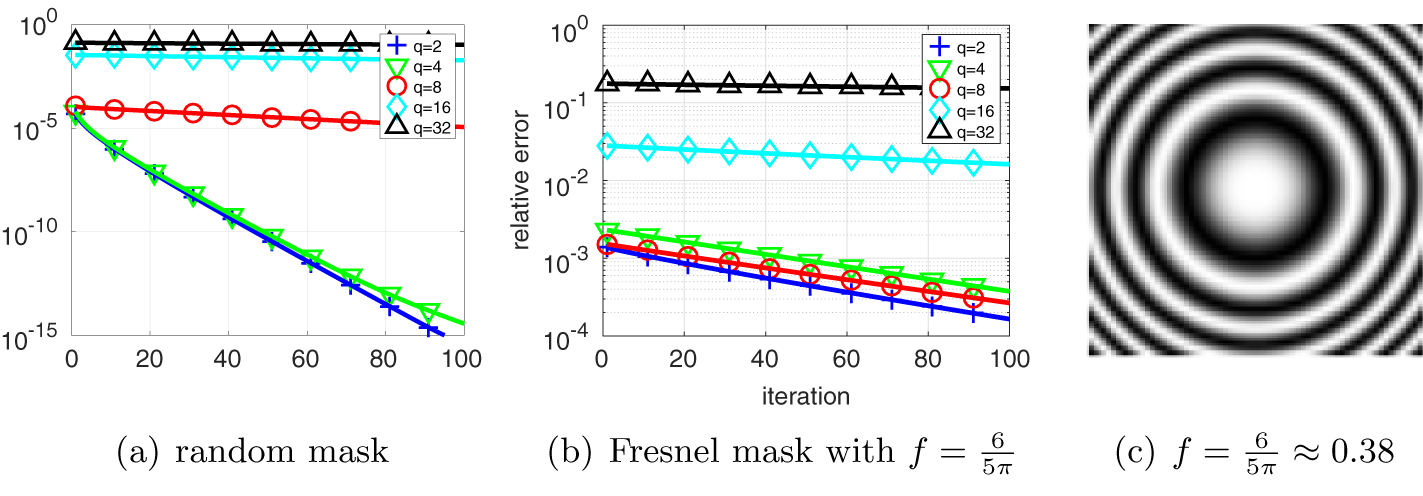
is an adjustable parameter (see Figure 4.1(c) for the phase pattern of (3.4)).
We construct a twin-like ambiguity for the Fresnel mask with
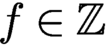 $f\in {\mathbb {Z}}$
and
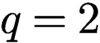 $q=2$
. Similar twin-like ambiguities can be constructed for general q.
For constructing the twin-like ambiguity we shall write the object vector
 ${x_{*}}$
as an
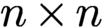 $n\times n$
matrix. Let
 $\check {\xi }$
be the conjugate inversion of any
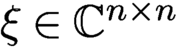 $\xi \in {\mathbb {C}} ^{n\times n}$
, that is,
 $$ \begin{align*} \check{\xi}_{ij}=\overline{\xi}_{n+1-i,n+1-j}. \end{align*} $$
Proposition 3.3 (Chen and Fannjiang Reference Chen and Fannjiang2018a ).
Let
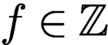 $f\in {\mathbb {Z}}$
and
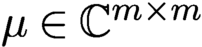 $\mu \in {\mathbb {C}} ^{m\times m}$
be the Fresnel mask (3.4). For an even integer n, the matrix
 $$ \begin{align*} {\overline{\check{\mu} }\odot \mu:=h= \begin{pmatrix} h_1& h_2 \\ h_3 & h_4 \end{pmatrix}\!, \quad h_j\in {\mathbb{C}} ^{m/2\times m/2},\quad j=1,2,3,4,} \end{align*} $$
satisfies the symmetry
 $$ \begin{align*} h_1=h_4=\sigma h_2=\sigma h_3,\quad \sigma=(-1)^{f(1+m/2)}. \end{align*} $$
Moreover, for
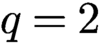 $q=2$
(hence
 $m=n$
and
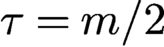 $\tau =m/2$
),
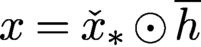 $x= \check {x}_* \odot \overline {h}$
and
 ${x_{*}}$
produce the same ptychographic data set with the Fresnel mask
 $\mu $
.
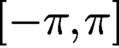
To demonstrate the danger of using a ‘regularly’ structured mask, we plot the relative error (RE) and relative residual (RR) of reconstruction (200 AAR iterations followed by 100 AP iterations) in Figure 3.2. The test object is a randomly phased phantom (RPP) whose modulus is exactly the non-negative phantom (Figure 3.1(a)) but whose phase is randomly and uniformly distributed in
 $ [-\pi , \pi ]$
. The scan scheme is the raster scan with
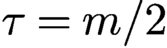 $\tau =m/2$
, i.e. 50% overlap ratio between adjacent masks. Both RE and RR spike at integer-valued f and the spill-over effect gets worse as q increases.
3.3 Phase retrieval as feasibility
For two-dimensional, complex-valued objects, let
 ${\mathbb {C}}^{n^2}$
be the object space where n is the number of pixels in each dimension. Sometimes it may be more convenient to think of the object space as
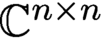 ${\mathbb {C}} ^{n\times n}$
. Let N be the total number of data. The data manifold
 $$ \begin{align*} Y:= \{u\in {\mathbb{C}} ^N\colon |u|=b\} \end{align*} $$
is an N-dimensional real torus. For phase retrieval it is necessary that
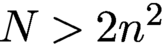 $N>2n^2$
(Balan, Casazza and Edidin Reference Balan, Casazza and Edidin2006). Without loss of generality we assume that A has full rank.
Due to the rectangular nature (more rows than columns) of the measurement matrix A, it is more convenient to work with the transform domain
 ${\mathbb {C}} ^N$
. Let
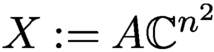 $X:=A{\mathbb {C}} ^{n^2}$
, i.e. the range of A.
The problem of phase retrieval and ptychography can be formulated as the feasibility problem
 $$ \begin{align*} \text{Find}\ u\in X \cap Y, \end{align*} $$
in the transform domain instead of the object domain. Let
 $P_X$
and
 $P_Y$
be the projection onto X and Y, respectively.
Let us clarify the meaning of solution in the transform domain since A is overdetermining. Let
 $\odot $
denote the component-wise (Hadamard) product, and we can write
 $$ \begin{align*} P_X u=AA^+ u,\quad P_Y u=b\odot{\textrm{sgn}}(u), \end{align*} $$
where the pseudo-inverse
 $$ \begin{align*} A^+= (A^*A)^{-1} A^* \end{align*} $$
becomes
 $A^*$
if A is isometric (unitary), which we assume henceforth.
We refer to
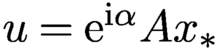 $u={\mathrm {e}}^{{\mathrm {i}} \alpha }A{x_{*}}$
,
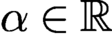 $\alpha \in {\mathbb {R}}$
, as the true solution (in the transform domain), up to a constant phase factor
 ${\mathrm {e}}^{{\mathrm {i}} \alpha }$
. We say that u is a generalized solution (in the transform domain) if
 $$ \begin{align*} |\tilde u|=b,\quad \tilde u:=P_X u. \end{align*} $$
In other words, u is said to be a generalized solution if
 $A^+u$
is a phase retrieval solution. Typically a generalized solution u is neither a feasible solution (since
 $|u|$
may not equal b) nor unique (since A is overdetermining), and
 $u+z$
is also a generalized solution if
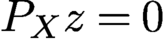 $P_X z=0$
.
We call u a regular solution if u is a generalized solution and
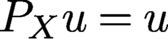 $P_X u=u$
. Let
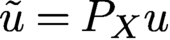 $\tilde u= P_X u$
for a generalized solution u. Since
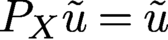 $P_X \tilde u=\tilde u$
and
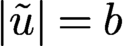 $|\tilde u|=b$
,
 $\tilde u$
is a regular solution. Moreover, since
 $P_X R_X u=P_X u$
and
 $R_X R_X u=u$
, u is a generalized solution if and only if
 $R_X u$
is a generalized solution.
The goal of the inverse problem (2.2) is the unique determination of
 ${x_{*}}$
, up to a constant phase factor, from the given data b. In other words, uniqueness holds if and only if all regular solutions
 $\tilde u$
in the transform domain have the form
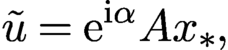 $$ \begin{align*} \tilde u={\mathrm{e}}^{{\mathrm{i}} \alpha} A {x_{*}}, \end{align*} $$
or equivalently, any generalized solution u is an element of the
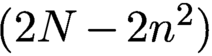 $(2N-2n^2)$
real-dimensional vector space
 $$ \begin{align} \{{\mathrm{e}}^{{\mathrm{i}} \alpha}A{x_{*}}+z\colon P_Xz=0,\ z\in {\mathbb{C}} ^N,\ \alpha\in{\mathbb{R}}\}. \end{align} $$
In the transform domain, the uniqueness is characterized by the uniqueness of the regular solution, up to a constant phase factor. Geometrically, uniqueness means that the intersection
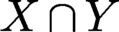 $X\cap Y$
is a circle (parametrized
 ${\mathrm {e}}^{{\mathrm {i}} \alpha }$
times
 $A{x_{*}}$
).
3.4 Noise models and log-likelihood functions
In the noisy case, it is more convenient to work with the optimization framework instead of the feasibility framework. When the noise statistics is known, it is natural to consider the maximum likelihood estimation (MLE) framework. In MLE, the negative log-likelihood function is the natural choice for the loss function.
3.4.1 Poisson noise
For Poisson noise, the negative log-likelihood function is (Thibault and Guizar-Sicairos Reference Thibault and Guizar-Sicairos2012, Bian et al. Reference Bian, Suo, Chung, Ou, Yang, Chen and Dai2016)
 $$ \begin{align} L(u) =\sum_i |u(i)|^2-b^2(i)\ln |u(i)|^2. \end{align} $$
A disadvantage of working with the Poisson loss function (3.6) is the occurrence of divergent derivative, where
 $u(i)$
vanishes but
 $b(i)$
does not. This roughness can be softened as follows.
At the high signal-to-noise (SNR) limit, the Poisson distribution
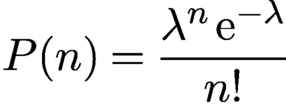 $$ \begin{align*} P(n)={\displaystyle \frac{\lambda^n\,{\mathrm{e}}^{-\lambda}}{ n!}} \end{align*} $$
has the asymptotic limit
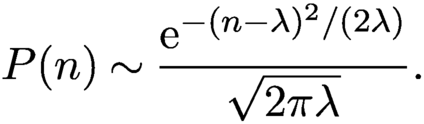 $$ \begin{align} P(n)\sim {\displaystyle \frac{{\mathrm{e}}^{-(n-\lambda)^2/(2\lambda)}}{ \sqrt{2\pi\lambda}}}. \end{align} $$
Namely, in the low noise limit the Poisson noise is equivalent to the Gaussian noise of the mean
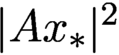 $|A{x_{*}}|^2$
and the variance is equal to the intensity of the diffraction pattern. The overall SNR can be tuned by varying the signal energy
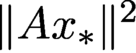 $\|A{x_{*}}\|^2$
.
The negative log-likelihood function for the right-hand side of (3.7) is
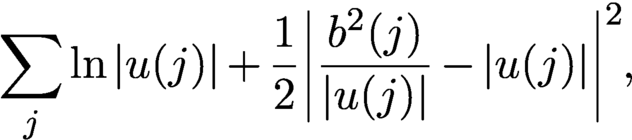 $$ \begin{align} \sum_j \ln |u(j)| +{\displaystyle \frac{1}{ 2}} \biggl|{\displaystyle \frac{b^2(j)}{ |u(j)|}}-|u(j)|\biggr|^2, \end{align} $$
which is even rougher than (3.6), where
 $u(i)$
vanishes but
 $b(i)$
does not. To get rid of the divergent derivatives at
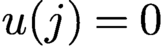 $u(j)=0$
we make the substitution
 $$ \begin{align*} {\displaystyle \frac{{b(j)}}{ |u(j)|}}\to 1,\quad \ln|u(j)|\to \ln{b(j)}=\text{const.}, \end{align*} $$
in (3.8) and obtain
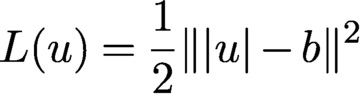 $$ \begin{align} L(u)={{1\over 2}} \| |u|- b\|^2 \end{align} $$
after dropping irrelevant constant terms. Expanding the loss function (3.9),
 $$ \begin{align} L(u)= {\displaystyle \frac{1}{2}}\|u\|^2-\sum_{j} b(j)|u(j)|+{\displaystyle \frac{1}{2}}\|b\|^2, \end{align} $$
we see that (3.10) has a bounded sub-differential where
 $u(j)$
vanishes but
 $b(j)$
does not. There are various tricks to smooth out (3.9), for example by introducing an additional regularization parameter as
 $$ \begin{align*} L(u)={{1\over 2}} \| \sqrt{|u|^2+\varepsilon}- \sqrt{b^2+\varepsilon}\|^2,\quad\varepsilon>0 \end{align*} $$
(see Chang, Enfedaque and Marchesini Reference Chang, Enfedaque and Marchesini2019).
3.4.2 Complex Gaussian noise
Another type of noise due to interference from multiple scattering can be modelled as complex circularly symmetric Gaussian noise (also known as a Rayleigh fading channel), resulting in
 $$ \begin{align} b=|A{x_{*}}+\eta|, \end{align} $$
where
 $\eta $
is a complex circularly symmetric Gaussian noise. Squaring the expression, we obtain
 $$ \begin{align*} b^2= |A{x_{*}}|^2+|\eta|^2+2{\mbox{Re}\,}(\overline{\eta}\odot A{x_{*}}){.} \end{align*} $$
Suppose
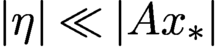 $|\eta |\ll |A{x_{*}}|$
so that
 $|\eta |^2 \ll 2{\mbox {Re}\,}(\overline {\eta }\odot A{x_{*}})$
. Then
 $$ \begin{align} b^2 \approx |A{x_{*}}|^2+2{\mbox{Re}\,}(\overline{\eta}\odot A{x_{*}}). \end{align} $$
Equation (3.12) says that at the photon counting level, the noise appears additive and Gaussian but with variance proportional to
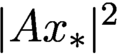 $|A{x_{*}}|^2$
, resembling the distribution (3.7). Therefore the loss function (3.9) is suitable for Rayleigh fading interference noise at low level.
3.4.3 Thermal noise
On the other hand, if the measurement noise is thermal (i.e. incoherent background noise) as in
 $$ \begin{align*} |b|^2 = |A{x_{*}}|^2+\eta, \end{align*} $$
where
 $\eta $
is real-valued Gaussian vector of covariance
 $\sigma ^2 I_N$
, then the suitable loss function is
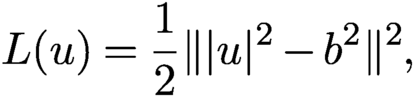 $$ \begin{align} L(u) = {{1\over 2}} \| |u|^2- b^2\|^2 , \end{align} $$
which is smooth everywhere. See Godard, Allain, Chamard and Rodenburg (Reference Godard, Allain, Chamard and Rodenburg2012), Zhang, Song and Dai (Reference Zhang, Song and Dai2017) and Konijnenberg, Coene and Urbach (Reference Konijnenberg, Coene and Urbach2018) for more choices of loss functions.
In general the amplitude-based Gaussian loss function (3.9) outperforms the intensity-based loss function (3.13) (Yeh et al. Reference Yeh, Dong, Zhong, Tian, Chen, Tang, Soltanolkotabi and Waller2015).
Finally, we note that the ambiguities discussed in Section 3.2 are global minimizers of the loss functions (3.6), (3.9) and (3.13) along with
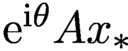 ${\mathrm {e}}^{{\mathrm {i}}\theta } A{x_{*}}$
in the noiseless case. Therefore, to remove the undesirable global minimizers, we need sufficient number of measurement data as well as proper measurement schemes.
3.5 Spectral gap and local convexity
For the sake of convenience we shall assume that A is an isometry which can always be realized by rescaling the columns of the measurement matrix.
In local convexity of the loss functions as well as geometric convergence of iterative algorithms, the following matrix plays a central role:
 $$ \begin{align} B= {\operatorname{diag}}[{\textrm{sgn}}(\overline{A x})] A , \end{align} $$
which is an isometry and varies with x.
With the notation
 $$ \begin{align} {\nabla f(x) := \frac{1}{2} \biggl({\displaystyle \frac{\partial f(x)}{ \partial {\mbox{Re}\,} (x)}}+i {\displaystyle \frac{\partial f(x) }{ \partial {\mbox{Im}\,} (x)}}\biggr),\quad x\in {\mathbb{C}} ^{n^2},} \end{align} $$
we can write the subgradient of the loss function (3.9) as
 $$ \begin{align*} {2 {\mbox{Re}\,}[\zeta^*\nabla L(Ax)] ={\mbox{Re}\,}(x^{*}\zeta)-b^{\top} {\mbox{Re}\,}(B \zeta)\quad {\text{for all}}\ \zeta\in {\mathbb{C}} ^{n^2}. } \end{align*} $$
In other words, x is a stationary point if and only if
 $$ \begin{align*} x = B^*b=A^* ({\textrm{sgn}}(Ax)\odot b) \end{align*} $$
or equivalently
 $$ \begin{align} B^*[|Ax|-b]=0. \end{align} $$
Clearly, with noiseless data,
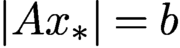 $|A{x_{*}}|=b$
and hence
 ${x_{*}}$
is a stationary point. In addition, there are probably other stationary points since
 $B^*$
has many more columns than rows.
On the other hand, with noisy data there is no regular solution to
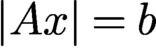 $|Ax|=b$
with high probability (since A has many more rows than columns) and the true solution
 $x_{*}$
is unlikely to be a stationary point (since (3.16) imposes extra constraints on noise).
Let
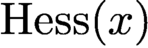 $\text {Hess}(x)$
be the Hessian of
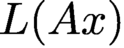 $L(Ax)$
. If
 $Ax$
has no vanishing components,
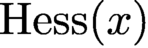 $\text {Hess}(x)$
can be given explicitly as
 $$ \begin{align*} {\mbox{Re}\,}[\zeta^*\text{Hess}(x) \zeta]=\|\zeta\|^2-{\mbox{Im}\,}( B\zeta)^T{\operatorname{diag}}\biggl[{\displaystyle \frac{b}{ |Ax|}}\biggr]{\mbox{Im}\,}( B\zeta)\quad {\text{for all}}\ \zeta\in {\mathbb{C}} ^{n^2}. \end{align*} $$
Theorem 3.4 (Chen, Fannjiang and Liu Reference Chen, Fannjiang and Liu2018, Chen and Fannjiang Reference Chen and Fannjiang2018a , Chen and Fannjiang Reference Chen and Fannjiang2018b ).
Suppose
 ${x_{*}}$
is not a line object. For A given by (2.3), (2.4) or the ptychography scheme under the connectivity condition (2.6) with independently and continuously distributed mask phases, the second-largest singular value
 $\lambda _2$
of the real-valued matrix
 $$ \begin{align} \mathcal{B}=[ \begin{matrix} - {\mbox{Re}\,}(B) & {\mbox{Im}\,}(B) \end{matrix} ] \end{align} $$
is strictly less than 1 with probability one.
Therefore, the Hessian of (3.9) at
 $A{x_{*}}$
(which is non-vanishing almost surely) is positive semidefinite and has one-dimensional eigenspace spanned by
 ${\mathrm {i}} {x_{*}}$
associated with eigenvalue zero.
4 Non-convex optimization
4.1 Alternating projections (AP)
The earliest phase retrieval algorithm for a non-periodic object (such as a single molecule) is the Gerchberg–Saxton algorithm (Gerchberg and Saxton Reference Gerchberg and Saxton1972) and its variant, error reduction (Fienup Reference Fienup1982). The basic idea is alternating projections (AP), going all the way back to the works of von Neumann, Kaczmarz and Cimmino in the 1930s (Cimmino Reference Cimmino1938, Kaczmarz Reference Kaczmarz1937, von Neumann Reference von Neumann1950). These further trace the history back to Schwarz (Reference Schwarz1870), who used AP to solve the Dirichlet problem on a region given as a union of regions, each having an easily solved Dirichlet problem.
AP is defined by
 $$ \begin{align} x_{k+1}=A^*[ b\odot {\textrm{sgn}}(Ax_k)]. \end{align} $$
In the case with real-valued objects, (4.1) is exactly Fienup’s error reduction algorithm (Fienup Reference Fienup1982).
The AP fixed points satisfy
 $$ \begin{align*} {x=A^*[b\odot {\textrm{sgn}}(Ax)] \quad\text{or}\quad B^*[|Ax|-b]=0,} \end{align*} $$
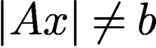
which is exactly the stationarity equation (3.16) for L in (3.9). The existence of non-solutional fixed points (i.e.
 $|Ax|\neq b$
), and hence local minima of L in (3.9), cannot be proved at present but manifests in numerical stagnation of AP iteration.
Indeed, AP can be formulated as a gradient descent for the loss function (3.9). The function (3.9) has the subgradient
 $$ \begin{align*} { 2 \nabla L(Ax) = x-A^*[b\odot {\textrm{sgn}}(A x)] ,} \end{align*} $$
and hence we can write the AP map as
 $$ \begin{align*} {T(x) = x- 2 \nabla L(Ax) ,} \end{align*} $$
implying a constant step size
 $1$
. Chen et al. (Reference Chen, Fannjiang and Liu2018) proved local geometric convergence to
 ${x_{*}}$
for AP. In other words, AP is both noise-agnostic in the sense that it projects onto the data set and noise-aware in the sense that it is the subgradient descent of the loss function (3.9).
The following result identifies any limit point of the AP iterates with a fixed point of AP with a norm criterion for distinguishing the phase retrieval solutions from the non-solutions among many coexisting fixed points.
Proposition 4.1 (Chen, Fannjiang and Liu Reference Chen and Fannjiang2018).
Under the conditions of Theorem 3.1 or Theorem 3.2, the AP sequence
 $x_k=T^{k-1}(x_1)$
, with any starting point
 $x_1$
, is bounded and every limit point is a fixed point.
Furthermore, if a fixed point x satisfies
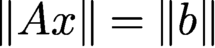 $\|A x\|= \|b\|$
, then
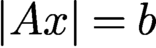 $|Ax|=b$
almost surely. On the other hand, if
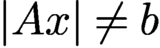 $|Ax|\neq b$
, then
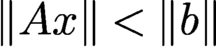 $\|A x\|<\|b\|$
.
4.2 Averaged alternating reflections (AAR)
AAR is based on the following characterization of convex feasibility problems.
Let
 $$ \begin{align*} R_X=2P_X-I, \quad R_Y=2P_Y-I. \end{align*} $$
Then we can characterize the feasibility condition as
 $$ \begin{align*} u\in X\cap Y\quad \text{if and only if } u=R_YR_X u \end{align*} $$
in the case of convex constraint sets
 $X $
and Y (Giselsson and Boyd Reference Giselsson and Boyd2016). This motivates the Peaceman–Rachford (PR) method: for
 $k=0,1, 2, \ldots ,$
 $$ \begin{align*} u_{k+1}= R_Y R_X y_{k}. \end{align*} $$
AAR is the averaged version of PR: for
 $k=0,1, 2, \ldots ,$
 $$ \begin{align} u_{k+1}= {{1\over 2}} u_k+{{1\over 2}} R_Y R_X u_{k}, \end{align} $$
hence the name averaged alternating reflections (AAR). With a different variable
 $v_k:=R_X u_k$
, we see that AAR (4.2) is equivalent to
 $$ \begin{align} v_{k+1}={{1\over 2}} v_k+ {{1\over 2}} R_X R_Y v_k. \end{align} $$
In other words, the order of applying
 $R_x$
and
 $R_Y$
does not matter.
A standard result for AAR in the convex case is as follows.
Proposition 4.2 (Bauschke, Combettes and Luke Reference Bauschke, Combettes and Luke2004).
Suppose X and Y are closed and convex sets of a finite-dimensional vector space E. Let
 $\{u_k\}$
be an AAR-iterated sequence for any
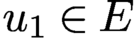 $u_1\in E$
. Then one of the following alternatives holds:
-
(i)
 $X\cap Y\neq \emptyset $
and
$(u_k)$
converges to a point u such that
$P_X u\in X\cap Y$
,
-
(ii)
$X\cap Y= \emptyset $
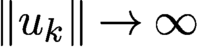
and
$\|u_k\|\to \infty $
.
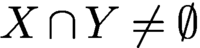


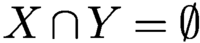
In alternative (i), the limit point u is a fixed point of the AAR map (4.2), which is necessarily in
 $X\cap Y$
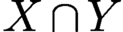
; in alternative (ii) the feasibility problem is inconsistent, resulting in divergent AAR iterated sequences, a major drawback of AAR since the inconsistent case is prevalent with noisy data because of the higher dimension of data compared to the object.
Accordingly, the alternative (i) in Proposition 4.2 means that if a convex feasibility problem is consistent, then every AAR iterated sequence converges to a generalized solution and hence every fixed point is a generalized solution.
We begin by showing that AAR can be viewed as an ADMM method with the indicator function
 ${\mathbb {I}}_Y $
of the set
 $Y=\{z\in {\mathbb {C}} ^N\colon |z|=b\}$
as the loss function.
AAR for phase retrieval can be viewed as relaxation of the linear constraint of X by alternately minimizing the augmented Lagrangian function
 $$ \begin{align} {\mathcal{L}}(z,x,\lambda) = {\mathbb{I}}_Y (z)+\lambda^*(z- A x)+{\displaystyle \frac{1}{ 2}} \|z-Ax\|^2 \end{align} $$
in the order
 $$ \begin{align} z_{k+1} &= \arg\min_z {\mathcal{L}}(z,x_k,\lambda_k)= P_Y [A x_k-\lambda_k], \end{align} $$
 $$ \begin{align} x_{k+1} &= \arg\min_{\nu} {\mathcal{L}}(z_{k+1},x,\lambda_k) = A^+(z_{k+1}+\lambda_k), \end{align} $$
 $$ \begin{align} \lambda_{k+1}&= \lambda_k+z_{k+1}-Ax_{k+1}. \end{align} $$
Let
 $u_{k}:= z_k+\lambda _{k-1}$
, and we have from (4.7)
 $$ \begin{align*} \lambda_{k}&= u_{k}-Ax_{k} = u_{k}-P_X u_{k} \end{align*} $$
and hence
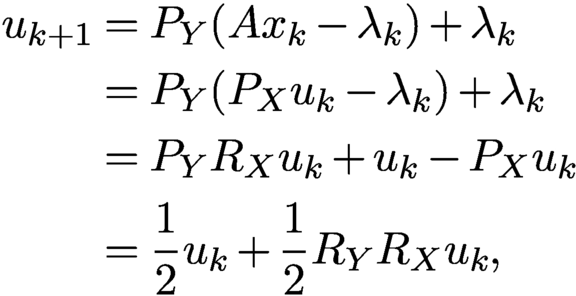 $$ \begin{align*} u_{k+1}&= P_Y (A x_k-\lambda_k)+\lambda_k\\ &= P_Y (P_X u_k-\lambda_k)+\lambda_k\\ &= P_Y R_X u_k+u_k-P_X u_k\\ &= {{1\over 2}} u_k+{{1\over 2}} R_Y R_X u_k, \end{align*} $$
which is AAR (4.2).
As proved in Chen and Fannjiang (Reference Chen and Fannjiang2018b ), when uniqueness holds, the fixed point set of the AAR map (4.2) is exactly the continuum set
 $$ \begin{align} \{u={\mathrm{e}}^{{\mathrm{i}} \alpha}A{x_{*}}-z\colon P_Xz=0,{\textrm{sgn}}(u)=\alpha+{\textrm{sgn}}(A{x_{*}}), z\in {\mathbb{C}} ^N, \alpha\in {\mathbb{R}}\}. \end{align} $$
In (4.8), the phase relation
 ${\textrm {sgn}}(u)=\alpha +{\textrm {sgn}}(A{x_{*}})$
implies that
 $z=\eta \odot {\textrm {sgn}}(u),\eta \in {\mathbb {R}}^N, b+\eta \ge 0.$
So the set (4.8) can be written as
 $$ \begin{align} \{{\mathrm{e}}^{{\mathrm{i}} \alpha} (b-\eta)\odot {\textrm{sgn}}(A{x_{*}})\colon P_X(\eta\odot{\textrm{sgn}}(A{x_{*}}))=0, b+\eta\ge 0,\eta\in {\mathbb{R}}^N,\alpha\in {\mathbb{R}}\}, \end{align} $$
which is an
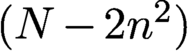 $(N-2n^2)$
real-dimensional set, a much larger set than the circle
 $\{{\mathrm {e}}^{{\mathrm {i}} \alpha } A{x_{*}}\colon \alpha \in {\mathbb {R}}\}$
for a given f. On the other hand, the fixed point set (4.9) has N dimensions less than the set (3.5) of generalized solutions and projected (by
 $P_X$
) onto the circle of true solution
 $\{{\mathrm {e}}^{{\mathrm {i}} \alpha } A{x_{*}}\colon \alpha \in {\mathbb {R}}\}$
.
A more intuitive characterization of the fixed points can be obtained by applying
 $R_X$
to the set (4.9). Since
 $$ \begin{align*} R_X [{\mathrm{e}}^{{\mathrm{i}} \alpha} (b-\eta)\odot {\textrm{sgn}}(A{x_{*}})] = {\mathrm{e}}^{{\mathrm{i}} \alpha} (b+\eta)\odot {\textrm{sgn}}(A{x_{*}}), \end{align*} $$
amounting to the sign change in front of
 $\eta $
, the set (4.9) under the map
 $R_X$
is mapped to
 $$ \begin{align} \{{\mathrm{e}}^{{\mathrm{i}} \alpha} (b+\eta)\odot {\textrm{sgn}}(A{x_{*}})\colon P_X(\eta\odot{\textrm{sgn}}(A{x_{*}}))=0,\ b+\eta\ge 0,\ \eta\in {\mathbb{R}}^N,\alpha\in {\mathbb{R}}\}. \end{align} $$
The set (4.10) is the fixed point set of the alternative form of AAR:
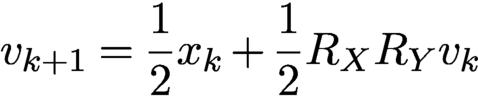 $$ \begin{align} v_{k+1} = {{1\over 2}} x_k+{{1\over 2}} R_X R_Y v_k \end{align} $$
in terms of
 $v_k:=R_X u_k$
. The expression (4.10) says that the fixed points of (4.11) are generalized solutions with the ‘correct’ Fourier phase.
However, the boundary points of the fixed point set (4.10) are degenerate in the sense that they have vanishing components, i.e.
 $|v|(j)=(b+\eta )(j)=0$
for some j, and can slow down convergence (Fienup and Wackerman Reference Fienup and Wackerman1986). Such points are points of discontinuity of the AAR map (4.11) because they are points of discontinuity of
 $P_Y=b\odot {\textrm {sgn}}(\cdot )$
. Indeed, even though AAR converges linearly in the vicinity of the true solution, numerical evidence suggests that globally (starting with a random initial guess) AAR converges sub-linearly. Due to the non-uniformity of convergence, the additional step of applying
 $P_X$
(Proposition 4.2(i)) at the ‘right timing’ of the iterated process can jump-start the geometric convergence regime (Chen and Fannjiang Reference Chen and Fannjiang2018b
).
As noted in Section 3.2, with a uniform mask, noiseless data and the real-valued prior, all the ambiguities in (3.3) are global minima of L in (3.9) and fixed points of both AP and AAR. Figure 3.1 demonstrates how detrimental these ambiguities are to numerical reconstruction.
4.3 Douglas–Rachford splitting (DRS)
AAR (4.2) is often written in the form
 $$ \begin{align} u_{k+1}= u_k+P_YR_Xu_k-P_Xu_k , \end{align} $$
which is equivalent to the three-step iteration
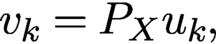 $$ \begin{align} v_{k} &= P_Xu_k, \end{align} $$
 $$ \begin{align} w_{k} &= P_Y (2v_{k}-u_k)=P_YR_X u_k, \end{align} $$
 $$ \begin{align} u_{k+1}&= u_k+ w_{k}-v_{k} {.} \end{align} $$
AAR can be modified in various ways by the powerful method of Douglas–Rachford splitting (DRS), which is simply an application of the three-step procedure (4.13)–(4.15) to proximal maps.
Proximal maps are generalization of projections. The proximal map relative to a function f is defined by
 $$ \begin{align*} {{\text{prox}}_{f}(u):= \mathop{\text{argmin}}\limits_{x} f(x)+{\displaystyle \frac{1}{2}}\| x-u\|^2.} \end{align*} $$
Projections
 $P_X$
and
 $P_Y$
are proximal maps relative to
 ${\mathbb {I}}_X$
and
 ${\mathbb {I}}_Y$
, the indicator functions of X and Y, respectively.
By choosing proxy functions other than
 ${\mathbb {I}}_X$
and
 ${\mathbb {I}}_Y$
, we may obtain different DRS methods that have more desirable properties than AAR.
4.4 Convergence rate
Next we recall the local geometric convergence property of AP and AAR with convergence rate expressed in terms of
 $\lambda _2$
, the second-largest singular value of
 ${\mathcal B}$
.
The Jacobians of the AP and AAR maps are given, respectively, by
 $$ \begin{align*} {\partial T (\xi) = {\mathrm{i}} B^*{\mbox{Im}\,}(B \xi),\quad\xi\in{\mathbb{C}} ^{n^2}} \end{align*} $$
and
 $$ \begin{align*} \partial \Gamma (\zeta)= (I-BB^*) \zeta + {\mathrm{i}} (2 B B^*-I)\; {\operatorname{diag}}\biggl[{\displaystyle \frac{b}{ |\zeta|}}\biggr]{\mbox{Im}\,}(\zeta),\quad\zeta\in{\mathbb{C}} ^N. \end{align*} $$
Note that
 $\partial \Gamma $
is a real, but not complex, linear map since
 $\partial \Gamma (c\zeta )\neq c\partial \Gamma (\zeta )$
,
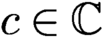 $c\in {\mathbb {C}} $
in general.
Theorem 4.3 (Chen and Fannjiang Reference Chen and Fannjiang2018a , Chen and Fannjiang Reference Chen and Fannjiang2018b , Chen et al. Reference Chen, Fannjiang and Liu2018).
The local geometric convergence rate of AAR and AP is
 $\lambda _2$
and
 $\lambda _2^2$
, respectively, where
 $\lambda _2$
is the second-largest singular value of
 ${\mathcal B}$
in (3.17).
As pointed out above, AAR has the true solution as the unique fixed point in the object domain while AP has a better convergence rate than DR (since
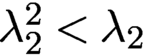 $\lambda _2^2<\lambda _2$
). A reasonable way to combine their strengths is to use AAR as the initialization method for AP.
With a carefully chosen parameter f (
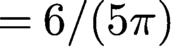 $=6/(5\pi )$
), the performance of a Fresnel mask (Figure 4.1(b)) is only slightly inferior to that of a random mask (Figure 4.1(a)). Figure 4.1 also demonstrates different convergence rates of AP with various q.
RE on the semi-log scale for the
 $128\times 128 $
RPP of phase range
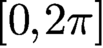 $[0,2\pi ]$
versus 100 AP iterations after initialization given by 300 AAR iterations with various q.
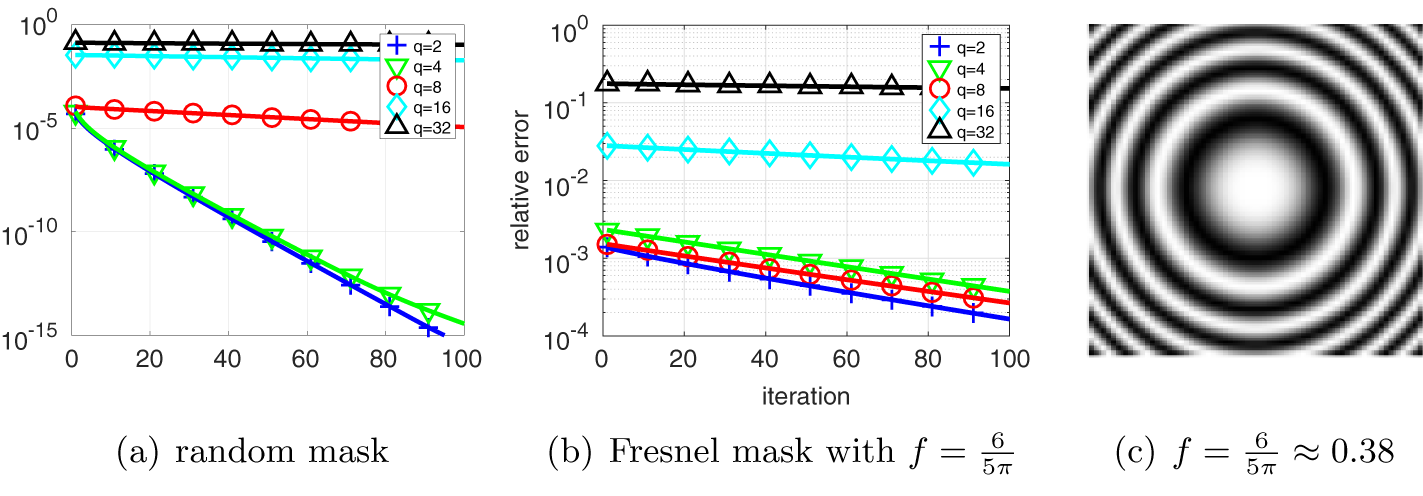
4.5 Fourier versus object domain formulation
It is important to note that due to the rectangular nature (more rows than columns) of the measurement matrix A, the following object domain version is a different algorithm from AAR discussed above:
 $$ \begin{align} x_{k+1} = x_k+A^+ R_Y ( A x_k)-A^+P_Y(Ax_k), \end{align} $$
which resembles (4.12) but operates on the object domain instead of the transform domain. Indeed, as demonstrated in Chen and Fannjiang (Reference Chen and Fannjiang2018b ), the object domain version (4.16) significantly underperforms the Fourier domain AAR.
As remarked earlier, this problem can be rectified by zero-padding and embedding the original object vector into
 ${\mathbb {C}} ^N$
and explicitly accounting for this additional support constraint. Let
 $P_S$
denote the projection from
 ${\mathbb {C}} ^N$
onto the zero-padded subspace and let
 $\tilde A$
be an invertible extension of A to
 ${\mathbb {C}} ^N$
. Then it is not hard to see that the ODR map
 $$ \begin{align*} G(x)= x+P_S\tilde A^{-1} R_Y \tilde A x-\tilde A^{-1} P_Y\tilde A x \end{align*} $$
satisfies
 $$ \begin{align*} \tilde A G \tilde A^{-1} (y)= y+\tilde A P_S\tilde A^{-1}R_Y y-P_Y y, \end{align*} $$
which is equivalent to (4.12) once we recognize that
 $P_X= \tilde A P_S\tilde A^{-1}$
.
In terms of the enlarged object space
 ${\mathbb {C}} ^N$
, Fienup’s well-known hybrid input–output (HIO) algorithm can be expressed as
 $$ \begin{align*} x_{k+1}= {{1\over 2}} \tilde A^{-1} [R_X (R_Y+(\beta-1)P_Y)+I+(1-\beta) P_Y]\tilde A x_k \end{align*} $$
(Fienup Reference Fienup1982). With
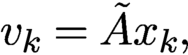 $v_k=\tilde A x_k,$
we can also express HIO in the Fourier domain:
 $$ \begin{align} v_{k+1} = {{1\over 2}} [R_X (R_Y+(\beta-1)P_Y)+I+(1-\beta) P_Y] v_k.\quad \end{align} $$
For
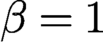 $\beta =1$
, HIO (4.17) is exactly AAR (4.3).
It is worth pointing out again that the lifting from
 ${\mathbb {C}} ^{n^2}$
to
 ${\mathbb {C}} ^N$
is key to the success of HIO over AP (4.1), which is an object domain scheme. In the optics literature, however, the measurement matrix is usually constructed as a square matrix by zero-padding the object vector with sufficiently large dimensions (see e.g. Miao, Sayre and Chapman Reference Miao, Sayre and Chapman1998, Miao, Kirz and Sayre Reference Miao, Kirz and Sayre2000). Zero-padding, of course, results in an additional support constraint that must be accounted for explicitly.
4.6 Wirtinger flow
We have already mentioned that the AP map (4.1) is a gradient descent for the loss function (3.9). In a nutshell, Wirtinger flow is a gradient descent algorithm with the loss function (3.13) proposed by Candès, Li and Soltanolkotabi (Reference Candès, Li and Soltanolkotabi2015), which establishes a basin of attraction at
 ${x_{*}}$
of radius
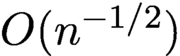 $O(n^{-1/2})$
for a sufficiently small step size.
Unlike many other non-convex methods, Wirtinger flow (and many of its modifications) comes with a rigorous theoretical framework that provides explicit performance guarantees in terms of required number of measurements, rate of convergence to the true solution, and robustness bounds. The Wirtinger flow approach consists of two components:
-
(i) a carefully constructed initialization based on a spectral method related to the PhaseLift framework;
-
(ii) starting from this initial guess, applying iteratively a gradient descent type update.
The resulting algorithm is computationally efficient and, remarkably, yields rigorous guarantees under which it will recover the true solution. We describe the Wirtinger flow approach in more detail. We consider the non-convex problem
 $$ \begin{align*} \min_z \ f(z):= {\displaystyle \frac{1}{2N}} \sum_{k=1}^N ( |\langle a_k, z \rangle |^2 - y_k )^2, \quad z \in {\mathbb{C}}^n. \end{align*} $$
The gradient of
 $f(z)$
is calculated via the Wirtinger gradient (3.15)
 $$ \begin{align*} \nabla f(z_j) = {\displaystyle \frac{1}{N}} \sum_{k=1}^N ( |\langle a_k, z \rangle |^2 - y_k ) \langle a_k,z\rangle a_k . \end{align*} $$
Starting from some initial guess
 $z_0$
, we compute
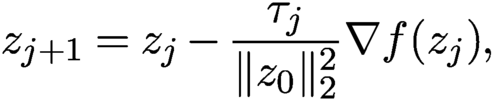 $$ \begin{align} z_{j+1} = z_j - {\displaystyle \frac{\tau_j}{\|z_0\|_2^2}} \nabla f(z_j), \end{align} $$
where
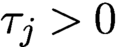 $\tau _j>0$
is a step size (learning rate). Note that the Wirtinger flow, like AP (4.1), is an object domain scheme.
The initialization of
 $z_0$
is computed via spectral initialization discussed in more detail in Section 5.1. We set
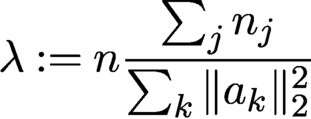 $$ \begin{align*} \lambda:= n {\displaystyle \frac{\sum_j n_j}{\sum_k \|a_k\|_2^2}} \end{align*} $$
and let
 $z_0$
be the principal eigenvector of the matrix
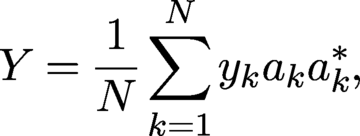 $$ \begin{align*} Y = {\displaystyle \frac{1}{N}} \sum_{k=1}^N y_k a_k a_k^\ast, \end{align*} $$
where
 $z_0$
is normalized such that
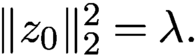 $\|z_0\|_2^2 = \lambda .$
Definition 4.4. Let
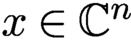 $x \in {\mathbb {C}}^n$
be any solution to (2.1). For each
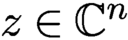 $z \in {\mathbb {C}}^n$
, define
 $$ \begin{align*} {\operatorname{dist}}(z,x) = \min_{\phi \in [0,2\pi)} \|z - {\mathrm{e}}^{{\mathrm{i}}\phi} x\|_2. \end{align*} $$
Theorem 4.5 (Candès, Li and Soltanolkotabi Reference Candès, Li and Soltanolkotabi2015).
Assume that the measurement vectors
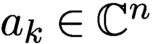 $a_k \in {\mathbb {C}}^n$
satisfy
 $a_k \overset {\text {i.i.d.}}{\sim } {\cal N}(0,I/2)+i{\cal N}(0,I/2)$
. Let
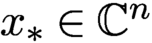 ${x_{*}} \in {\mathbb {C}}^n$
and
 $y = \{|\langle a_k, {x_{*}}\rangle |^2\}_{k=1}^N$
with
 $N \ge c_0 n \log n$
, where
 $c_0$
is a sufficiently large constant. Then the Wirtinger flow initial estimate
 $z_0$
, normalized such that
 $ \| z_0\|_2 = m^{-1} \sum _k y_k$
, obeys
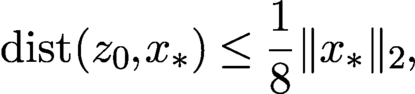 $$ \begin{align} {\operatorname{dist}}(z_0,{x_{*}}) \le {\displaystyle \frac{1}{8}} \|{x_{*}}\|_2, \end{align} $$
with probability at least
 $1-10\,{\mathrm {e}}^{-\gamma n} -8/n^2$
, where
 $\gamma $
is a fixed constant. Further, choose a constant step size
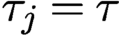 $\tau _j = \tau $
for all
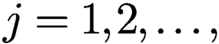 $j=1,2,\ldots ,$
and assume
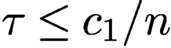 $\tau \le c_1/n$
for some fixed constant
 $c_1$
. Then, with high probability starting from any initial solution
 $z_0$
obeying (4.19), we have
 $$ \begin{align*} {\operatorname{dist}}(z_j,{x_{*}}) \le {\displaystyle \frac{1}{8}} \biggl(1- {\displaystyle \frac{\tau}{4}}\biggr)^{j/2} \|{x_{*}}\|_2. \end{align*} $$
A modification of this approach, called truncated Wirtinger flow (Chen and Candès Reference Chen and Candès2017), proposes a more adaptive gradient flow, both at the initialization step and during iterations. This modification seeks to reduce the variability of the iterations by introducing three additional control parameters (Chen and Candès Reference Chen and Candès2017).
Various other modifications of Wirtinger flow have been derived; see e.g. Wang, Giannakis and Eldar (Reference Wang, Giannakis and Eldar2018), Tu et al. (Reference Tu, Boczar, Simchowitz, Soltanolkotabi and Recht2015) and Cai, Li and Ma (Reference Cai, Li and Ma2016). While it is possible to obtain global convergence for such gradient descent schemes with random initialization (Chen, Chi, Fan and Ma Reference Chen, Chi, Fan and Ma2019), the price is a larger number of measurements. See Section 5 for a detailed discussion and comparison of various initializers combined with Wirtinger flow.
The general idea behind Wirtinger flow, of solving a non-convex method provably by a careful initialization followed by a properly chosen gradient descent algorithm, has inspired research in other areas, where rigorous global convergence results for gradient descent type algorithms have been established (often for the first time). This includes blind deconvolution (Li, Ling, Strohmer and Wei Reference Li, Ling, Strohmer and Wei2019, Ma, Wang, Chi and Chen Reference Ma, Wang, Chi and Chen2020), blind demixing (Ling and Strohmer Reference Ling and Strohmer2019, Jung, Krahmer and Stöger Reference Jung, Krahmer and Stöger2017) and matrix completion (Sun and Luo Reference Sun and Luo2016).
4.7 Alternating direction method of multipliers (ADMM)
The alternating direction method of multipliers (ADMM) is a powerful tool for solving the joint optimization problem
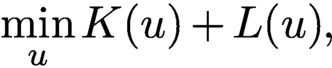 $$ \begin{align} \min\limits_{u}K(u)+ L(u), \end{align} $$
where the loss functions
 $ L$
and K represent the data constraint Y and the object constraint X, respectively.
Douglas–Rachford splitting (DRS) is another effective method for the joint optimization problem (4.20) with a linear constraint. For convex optimization, DRS applied to the primal problem is equivalent to ADMM applied to the Fenchel dual problem (Fortin and Glowinski Reference Fortin and Glowinski2000). For non-convex optimization such as (4.20) there is no clear relation between the two in general.
However, for phase retrieval, DRS and ADMM are essentially equivalent (Fannjiang and Zhang Reference Fannjiang and Zhang2020). So our subsequent presentation will mostly focus on ADMM.
ADMM seeks to minimize the augmented Lagrangian function
 $$ \begin{align} {\mathcal{L}}(y,z)=K(y)+L(z)+\lambda^*(z-y)+{\displaystyle \frac{\rho}{ 2}}\|z-y\|^2 \end{align} $$
alternatively as
 $$ \begin{align} y_{k+1}&= \arg\min_x{\mathcal{L}}(y,z_k,\lambda_k), \end{align} $$
 $$ \begin{align} z_{k+1}&= \arg\min_z{\mathcal{L}}(y_{k+1}, z, \lambda_k), \end{align} $$
or
 $$ \begin{align} z_{k+1}&= \arg\min_x{\mathcal{L}}(y_k,z,\lambda_k), \end{align} $$
 $$ \begin{align} y_{k+1}&= \arg\min_z{\mathcal{L}}(y, z_{k+1}, \lambda_k), \end{align} $$
and then update the multiplier by the gradient ascent
 $$ \begin{align*} \lambda_{k+1}=\lambda_k+\rho (z_{k+1}-y_{k+1}). \end{align*} $$
4.8 Noise-aware ADMM
We apply ADMM to the augmented Lagrangian
 ${\mathcal {L}}$
(4.21) with
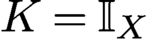 $K={\mathbb {I}}_X$
(the indicator function of the set X) and L given by the Poisson (3.6) or Gaussian (3.9) loss function.
Consider (4.24)–(4.25) and let
 $$ \begin{align*} u_k:=z_k+\lambda_{k-1}/\rho. \end{align*} $$
Then we have
 $$ \begin{align} z_{k+1}&= {\text{prox}}_{L/\rho}(y_k-\lambda_k/\rho), \end{align} $$
 $$ \begin{align} y_{k+1}&= {\text{prox}}_{K/\rho}(z_{k+1}+\lambda_k/\rho)=AA^*(z_{k+1}+\lambda_k/\rho), \end{align} $$
 $$ \begin{align} \lambda_{k+1}&= \lambda_k+\rho (z_{k+1}-y_{k+1}). \end{align} $$
We have from (4.28) that
 $$ \begin{align*} u_{k+1}=y_{k+1}+\lambda_{k+1}/\rho. \end{align*} $$
By (4.27) we also have
 $$ \begin{align*} y_{k+1}=P_X (z_{k+1}+\lambda_k/\rho)=P_X u_{k+1} \end{align*} $$
and
 $$ \begin{align*} y_k - \lambda_k/\rho= 2y_{k}-u_k=R_X u_{k}. \end{align*} $$
So (4.26) becomes
 $$ \begin{align*} z_{k+1}={\text{prox}}_{L/\rho}(R_X u_k). \end{align*} $$
Note also that by (4.28)
 $$ \begin{align*} u_k-P_X u_k=\lambda_k/\rho , \end{align*} $$
and hence
 $$ \begin{align*} u_{k+1}=z_{k+1}+\lambda_k/\rho=u_k-P_X u_k+{\text{prox}}_{L/\rho}(R_X u_k). \end{align*} $$
For the Gaussian loss function (3.9), the proximal map
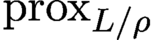 ${\text {prox}}_{L/\rho }$
can be calculated exactly:
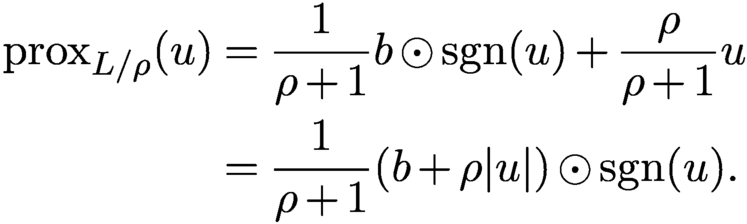 $$ \begin{align*} {\text{prox}}_{L/\rho}(u) &= {\displaystyle \frac{1}{\rho+1}}b\odot{\textrm{sgn}}{(u)}+{\displaystyle \frac{\rho}{\rho+1}}u\\ &= {\displaystyle \frac{1}{\rho+1}}(b+\rho|u|)\odot{\textrm{sgn}}{(u)}. \end{align*} $$
The resulting iterative scheme is given by
 $$ \begin{align} u_{k+1} &= {\displaystyle \frac{1}{ \rho+1} } u_k+ {\displaystyle \frac{\rho-1}{ \rho+1}} P_X u_k+{\displaystyle \frac{1}{\rho+1}}b\odot {\textrm{sgn}} (R_X u_k)\notag \\ :&= \Gamma(u_k). \end{align} $$
Like AAR, (4.29) can also be derived by the DRS method
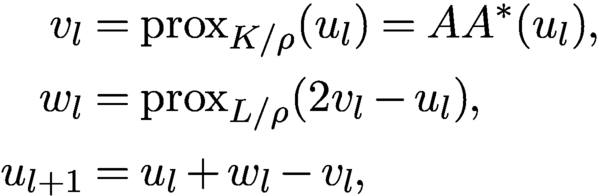 $$ \begin{align*} v_{l} &= {\text{prox}}_{K/\rho}(u_l) =AA^*(u_l), \\ w_{l} &= {\text{prox}}_{ L/\rho}(2v_{l}-u_l), \\ u_{l+1}&= u_l+ w_{l}-v_{l}, \end{align*} $$
instead of (4.13)–(4.15). For the Gaussian loss function (3.9), the proximal map
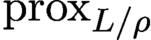 ${\text {prox}}_{ L/\rho }$
is
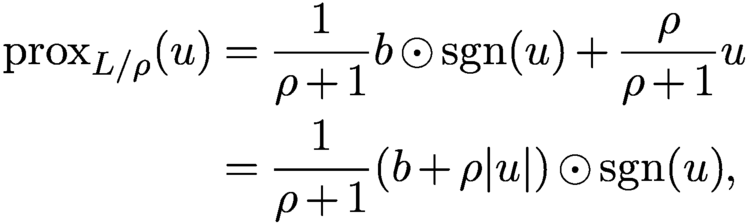 $$ \begin{align*} {\text{prox}}_{L/\rho}(u) &= {\displaystyle \frac{1}{\rho+1}}b\odot{\textrm{sgn}}{(u)}+{\displaystyle \frac{\rho}{\rho+1}}u\\ &= {\displaystyle \frac{1}{\rho+1}}(b+\rho|u|)\odot{\textrm{sgn}}{(u)}, \end{align*} $$
an averaged projection with the relaxation parameter
 $\rho $
. With this,
 $\{u_k\}$
satisfy (4.29). Following Fannjiang and Zhang (Reference Fannjiang and Zhang2020), we refer to (4.29) as the Gaussian-DRS map.
For the Poisson case the DRS map has a more complicated form,
 $$ \begin{align} &{u_{k+1}} \notag \\ & = {{1\over 2}} u_k-{\displaystyle \frac{1}{ \rho+2}} R_X u_k+ {\displaystyle \frac{\rho}{2(\rho+2)}}\biggl[|R_Xu_{k}|^2+{\displaystyle \frac{8(2+\rho)}{\rho^2}}b^2\biggr]^{1/2}\odot {\textrm{sgn}}{(R_X u_{k})}\notag \\ :&= \Pi(u_k)x \end{align} $$
where
 $b^2$
is the vector with component
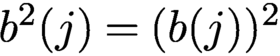 $b^2(j)=(b(j))^2$
for all j.
Note that
 $\Gamma (u)$
and
 $\Pi (u)$
are continuous except where
 $R_X u$
vanishes but b does not due to arbitrariness of the value of the
 ${\textrm {sgn}}$
function at zero.
4.9 Fixed points
With the proximal relaxation in (4.29), we can ascertain desirable properties that are either false or unproven for AAR.
By definition, all fixed points u satisfy the equation
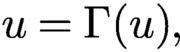 $$ \begin{align*} u= \Gamma(u), \end{align*} $$
and hence, after some algebra,
 $$ \begin{align*} P_X u+\rho P^\perp_X u=b\odot {\textrm{sgn}}(R_X u), \end{align*} $$
which in terms of
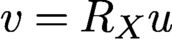 $v=R_X u$
becomes
 $$ \begin{align} P_X v-\rho P^\perp_X v=b\odot {\textrm{sgn}}(v). \end{align} $$
The following demonstrates the advantage of Gaussian-DRS in avoiding the divergence behaviour of AAR (as stated in Proposition 4.2(ii) for the convex case) when the feasibility problem is inconsistent and has no (generalized or regular) solution.
Theorem 4.6 (Fannjiang and Zhang Reference Fannjiang and Zhang2020).
Let
 $u_{k+1}:=\Gamma (u_k)$
,
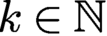 $k\in {\mathbb {N}}$
. Then, for
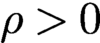 $\rho>0$
,
 $\{u_k\}$
is a bounded sequence satisfying
 $$ \begin{align*} \limsup_{k\to\infty} \|u_k\|\le {\displaystyle \frac{\|b\|}{ \min\{\rho, 1\}}}\quad \text{for } \rho>0. \end{align*} $$
Moreover, if u is a fixed point, then
 $$ \begin{align*} \|u\| <\|b\|\quad \text{for } \rho>1 \end{align*} $$
and
 $$ \begin{align*} \|b\|< \|u\|\le \|b\|/\rho \quad \text{for } \rho\in (0,1) \end{align*} $$
unless
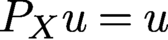 $P_X u=u$
, in which case u is a regular solution. On the other hand, for the particular value
 $\rho =1$
,
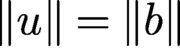 $\|u\|=\|b\|$
for any fixed point u.
The next result says that all attracting points are regular solutions and hence one need not worry about numerical stagnation.
Theorem 4.7 (Fannjiang and Zhang Reference Fannjiang and Zhang2020).
Let
 $\rho \ge 1$
. Let u be a fixed point such that
 $R_X u$
has no vanishing components. Suppose that the Jacobian J of Gaussian-DRS satisfies
 $$ \begin{align*} \|J(\eta)\| \le \|\eta\|\quad{\text{for all}}\ \eta\in {\mathbb{C}} ^N. \end{align*} $$
Then
 $$ \begin{align*} u=P_X u=b\odot{\textrm{sgn}}(R_X u), \end{align*} $$
implying that u is a regular solution.
The indirect implication of Theorem 4.7 is noteworthy. In the inconsistent case (such as with noisy measurements prohibiting the existence of a regular solution), convergence is impossible since all fixed points are locally repelling in some directions. The outlook, however, need not be pessimistic. A good iterative scheme need not converge in the traditional sense as long as it produces a good outcome when properly terminated, i.e. its iterates stay in the true solution’s vicinity of size comparable to the noise level. In this connection, let us recall the previous observation that in the inconsistent case the true solution is probably not a stationary point of the loss function. Hence a convergent iterative scheme to a stationary point may not be a good idea. The fact that Gaussian-DRS performs well in noisy blind ptychography (Figure 7.7(b)) with an error amplification factor of about 1/2 dispels much of the pessimism.
The next result says that, for any
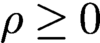 $\rho \ge 0$
, all regular solutions are indeed attracting fixed points.
Theorem 4.8 (Fannjiang and Zhang Reference Fannjiang and Zhang2020).
Let
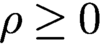 $\rho \ge 0$
. Let u be a non-vanishing regular solution. Then the Jacobian J of Gaussian-DRS is non-expansive:
 $$ \begin{align*} \|J(\eta)\| \le \|\eta\|\quad {\text{for all}}\ \eta \in {\mathbb{C}} ^N. \end{align*} $$
Finally, we are able to pinpoint the parameter corresponding to the optimal rate of convergence.
Theorem 4.9 (Fannjiang and Zhang Reference Fannjiang and Zhang2020).
The leading singular value of the Jacobian J of Gaussian-DRS is 1 and the second-largest singular value is strictly less than 1. Moreover the second-largest singular value as a function of the parameter
 $\rho $
is increasing over
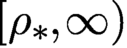 $[\rho _*,\infty )$
and decreasing over
 $[0,\rho_*]$
, achieving the global minimum
 $$ \begin{align} {\displaystyle \frac{\lambda_2}{ \sqrt{1+\rho_* }}}\quad \text{at } \rho_*=2\lambda_2\sqrt{1-\lambda_2^2}\in [0,1] , \end{align} $$
where
 $\lambda _2$
is the second-largest singular value of
 ${\mathcal B}$
in (3.17).
Moreover, for
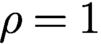 $\rho =1$
, the local convergence rate is
 $\lambda _2^2$
the same as AP.
By the arithmetic–geometric mean inequality,
 $$ \begin{align*} \rho_*\le 2 \times {{1\over 2}} \sqrt{\lambda_2^2+1-\lambda_2^2}=1, \end{align*} $$
where the equality holds only when
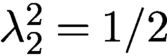 $\lambda ^2_2=1/{2}$
.
As
 $\lambda ^{2}_{2}$
tends to 1,
 $\rho _*$
tends to 0, and as
 $\lambda ^{2}_{2}$
tends to
 ${1/2}$
,
 $\rho _*$
tends to 1. Recall that
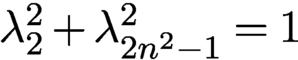 $\lambda _{2}^{2} + \lambda ^{2}_{2n^2-1}=1$
and hence
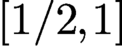 $[1/2,1]$
is the proper range of
 $\lambda ^{2}_{2}$
.
4.10 Perturbation analysis for Poisson-DRS
The full analysis of Poisson-DRS (4.30) is more challenging. Instead, we give a perturbative derivation of analogous result to Theorem 4.6 for Poisson-DRS with small positive
 $\rho $
.
For small
 $\rho $
, by keeping only the terms up to
 ${{{O}}} (\rho )$
we obtain the perturbed DRS
 $$ \begin{align*} u_{k+1}={{1\over 2}} u_k-{{1\over 2}}\biggl(1-{\displaystyle \frac{\rho}{ 2}}\biggr) R_X u_k +P_Y R_X u_k. \end{align*} $$
Writing
 $$ \begin{align*} I=P_X+P^\perp_X\quad\text{and}\quad R_X=P_X-P^\perp_X, \end{align*} $$
we then have the estimates
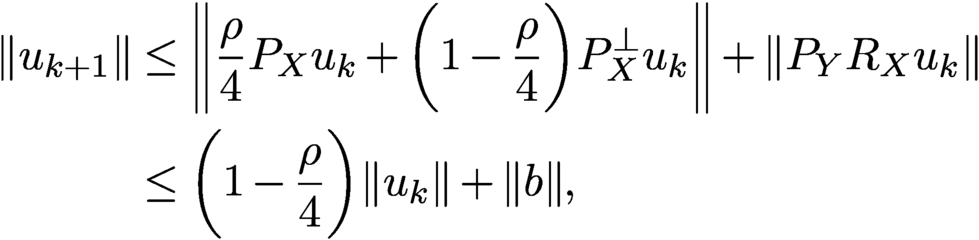 $$ \begin{align*} \|u_{k+1}\| &\le \biggl\|{\displaystyle \frac{\rho}{ 4}} P_X u_k+\biggl(1-{\displaystyle \frac{\rho}{ 4}}\biggr)P^\perp_X u_k\biggr\|+\|P_Y R_X u_k\|\notag \\ &\le \biggl(1-{\displaystyle \frac{\rho}{ 4}}\biggr)\|u_k\|+\|b\| , \end{align*} $$
since
 $\rho $
is small. Iterating this bound, we obtain
 $$ \begin{align*} \|u_{k+1}\|\le \biggl(1-{\displaystyle \frac{\rho}{ 4}}\biggr)^k\|u_1\|+\|b\|\sum_{j=0}^{k-1}\biggl(1-{\displaystyle \frac{\rho}{ 4}}\biggr)^j \end{align*} $$
and hence
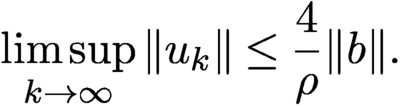 $$ \begin{align} \limsup_{k\to\infty} \|u_k\|\le {\displaystyle \frac{4}{\rho}} \|b\|. \end{align} $$
Note that the small
 $\rho $
limit and the Poisson-to-Gaussian limit do not commune, resulting in a different constant in (4.33) from Theorem 4.6.
4.11 Noise-agnostic method
In addition to AAR, relaxed averaged alternating reflections (RAAR) is another noise-agnostic method that is formulated as the non-convex optimization problem
 $$ \begin{align} \min \|P_X^\perp z\|^2,\quad \text{subject to } |z|=b , \end{align} $$
or equivalently (4.20) with the loss functions
 $$ \begin{align} K(y) ={{1\over 2}} \|P_X^\perp y\|^2,\quad L(z)={\mathbb{I}}_{b}(z) , \end{align} $$
where the hard constraint represented by the indicator function
 ${\mathbb {I}}_{b}$
of the set
 $\{z\in {\mathbb {C}} ^N\colon |z|=b\}$
is oblivious to the measurement noise, while the choice of K represents a relaxation of the object domain constraint.
If the noisy phase retrieval problem is consistent, then the minimum value of (4.34) is zero and the minimizer is a regular solution (corresponding to the noisy data b). If the noisy problem is inconsistent, then the minimum value of (4.34) is unknown and the minimizer
 $z_*$
is the generalized solution with the least inconsistent component. In this case we can use
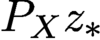 $P_X z_*$
as the reconstruction.
Let us apply ADMM to the augmented Lagrangian function
 $$ \begin{align*} {\mathcal{L}}_\gamma(y,z,\lambda):= K(y) +L(z) +\lambda^*(z-y)+{\displaystyle \frac{\gamma}{2}}\|z-y\|^2, \end{align*} $$
with K and L given in (4.35) in the order
 $$ \begin{align} y_{k+1}&= \arg\min_y{\mathcal{L}}_\gamma(y,z_k,\lambda_k) , \end{align} $$
 $$ \begin{align} z_{k+1}&= \arg\min_{|z|=b}{\mathcal{L}}_\gamma(y_{k+1}, z, \lambda_k) , \end{align} $$
 $$ \begin{align} \lambda_{k+1}&= \lambda_k+\gamma (z_{k+1}-y_{k+1}). \end{align} $$
Solving (4.36), we have
 $$ \begin{align} y_{k+1}= (I+P_X^\perp/\gamma )^{-1}(z_k+\lambda_k/\gamma)=(I-\beta P^\perp_X) (z_k+\lambda_k/\gamma), \end{align} $$
where
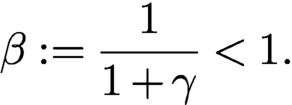 $$ \begin{align} \beta:={\displaystyle \frac{1}{ 1+\gamma}}<1. \end{align} $$
Likewise, solving (4.37) we obtain
 $$ \begin{align*} z_{k+1}=P_Y u_{k+1},\quad u_{k+1}:= y_{k+1}-\lambda_k/\gamma \end{align*} $$
and hence by (4.38) and (4.39)
 $$ \begin{align*} u_{k+1}=(I-\beta {P_{X}^{\perp}}) ({P_{Y}} u_k+\lambda_k/\gamma)-\lambda_k/\gamma. \end{align*} $$
On the other hand we can rewrite (4.38) as
 $$ \begin{align*} \lambda_{k}/\gamma=z_{k}-u_{k}=P_Y u_{k}-u_{k}, \end{align*} $$
and hence
 $$ \begin{align*} u_{k+1}&= (I-\beta {P_{X}^{\perp}}) {P_{Y}} u_k-\beta{P_{X}^{\perp}} \lambda_k/\gamma \notag \\ &= (I-\beta {P_{X}^{\perp}}) {P_{Y}} u_k+\beta{P_{X}^{\perp}} (I-{P_{Y}}) u_k, \end{align*} $$
which after reorganization becomes
 $$ \begin{align} {u_{k+1}=T_\beta (u_k):=\beta \biggl({{1\over 2}} I+{{1\over 2}} R_XR_Y\biggr)u_k+(1-\beta)P_Y u_k.} \end{align} $$
The scheme (4.41) resembles the RAAR method first proposed by Luke (Reference Luke2004, Reference Luke2008) and formulated in the object domain from a different perspective. RAAR becomes AAR for
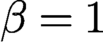 $\beta =1$
(obviously) and AP for
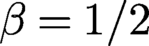 $\beta ={1/2}$
(after some algebra) (Marchesini et al. Reference Marchesini, Krishnan, Daurer, Shapiro, Perciano, Sethian and Maia2016, Luke Reference Luke2004, Luke Reference Luke2008).
Let us demonstrate again that the properly formulated DRS method can also lead to RAAR. Let us apply (4.13)–(4.15) to (4.20) in the order
 $$ \begin{align} z_{k+1}&= {\text{prox}}_{L/\gamma} (u_k)= P_Y u_k , \end{align} $$
 $$ \begin{align} y_{k+1}&= {\text{prox}}_{K/\gamma} (2z_{k+1}-u_k)= (I-\beta {P_{X}^{\perp}})(2 {P_{Y}} u_k-u_k) , \end{align} $$
 $$ \begin{align} u_{k+1}&= u_k+y_{k+1}-z_{k+1}. \end{align} $$
Substituting (4.42) and (4.43) into (4.44), we obtain after straightforward algebra the RAAR map (4.41).
With the splitting I and
 $R_X$
as
 $$ \begin{align*} I=P_X +P^{\perp}_X \quad \text{ and} \quad R_X =P_X-P^{\perp}_X, \end{align*} $$
the fixed point equation
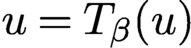 $u=T_\beta (u)$
becomes
 $$ \begin{align*} P_X u+P_{X}^{\perp} u=\beta P_{X}^{\perp} u+ [P_X+(1-2\beta)P_{X}^{\perp} ] P_Y u, \end{align*} $$
from which it follows that
 $$ \begin{align*} {P_{X}}u= {P_{X}}{P_{Y}} u,\quad {P_{X}^{\perp}} u=\biggl({\displaystyle \frac{1-2\beta}{1-\beta}}\biggr){P_{X}^{\perp}}{P_{Y}}u, \end{align*} $$
and hence
 $$ \begin{align} {P_{X}} u-\biggl({\displaystyle \frac{1-\beta}{ 2\beta-1}}\biggr) {P_{X}^{\perp}} u = {P_{X}}{P_{Y}} u+{P_{X}^{\perp}}{P_{Y}} u={P_{Y}} u. \end{align} $$
If the fixed point satisfies
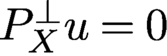 ${P_{X}^{\perp }} u=0$
, then (4.45) implies
 $$ \begin{align*} u={P_{X}} u={P_{Y}} u=b\odot{\textrm{sgn}}(u), \end{align*} $$
that is, u is a regular solution.
Notably, (4.45) is exactly the RAAR fixed point equation (4.31) with the corresponding parameter
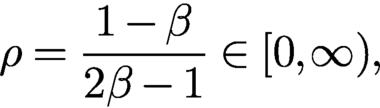 $$ \begin{align} \rho = {\displaystyle \frac{1-\beta}{2\beta-1}} \in [0,\infty) , \end{align} $$
which tends to 0 and
 $\infty $
as
 $\beta $
tends to 1 and
 ${1/2}$
, respectively.
Local geometric convergence of RAAR has been proved by Li and Zhou (Reference Li and Zhou2017). Moreover, like Theorem 4.6, RAAR possesses the desirable property that every RAAR sequence is explicitly bounded in terms of
 $\beta $
as follows.
Theorem 4.10. Let
 $\{u_k\}$
be an RAAR-iterated sequence. Then
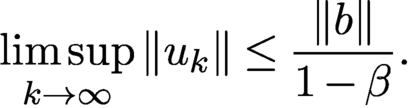 $$ \begin{align} \limsup_{k\to\infty} \|u_k\|\le {\displaystyle \frac{\|b\|}{ 1-\beta}}. \end{align} $$
Let u be an RAAR fixed point. Then
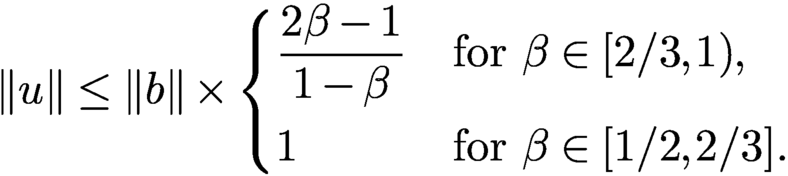 $$ \begin{align} \|u\| \le \|b\| \times \begin{cases} \displaystyle \frac{2\beta-1}{ 1-\beta} &\text{for } \beta\in [2/3, 1),\\[7pt] 1&\text{for } \beta \in [1/2, 2/3]. \end{cases} \end{align} $$
Proof. For
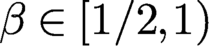 $\beta \in [{1/2}, 1)$
,
 $2\beta -1\in [0,1)$
and hence we have
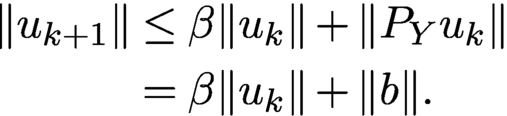 $$ \begin{align*} \|u_{k+1}\|&\le \beta \|u_k\|+\|P_Yu_k\|\\&= \beta\|u_k\|+\|b\|. \end{align*} $$
Iterating the above equation, we obtain
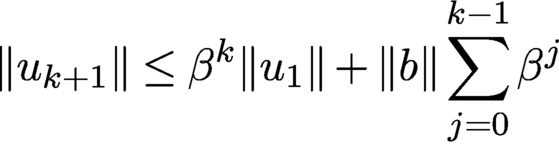 $$ \begin{align*} \|u_{k+1}\| \le \beta^k\|u_1\|+\|b\|\sum_{j=0}^{k-1} \beta^{j} \end{align*} $$
and conclude (4.47).
From (4.45) it follows that
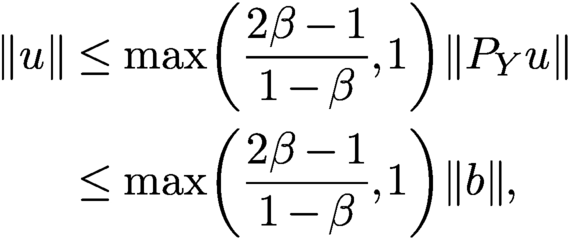 $$ \begin{align*} \|u\|&\le \max \biggl({\displaystyle \frac{2\beta-1}{ 1-\beta}}, 1\biggr)\|{P_{Y}} u\| \\ &\le \max \biggl({\displaystyle \frac{2\beta-1}{ 1-\beta}}, 1\biggr)\|b\|,\end{align*} $$
and hence (4.48). □
4.12 Optimal parameter
We briefly explore the optimal parameter for Gaussian-DRS (4.29) in view of the optimal convergence rate (4.32).
Our test image, shown in Figure 4.2, is
 $256\times 256$
Cameraman +
 ${\mathrm {i}}$
Barbara, or CiB.
The real (a) and imaginary (b) parts of test image
 $256\times 256$
CiB.
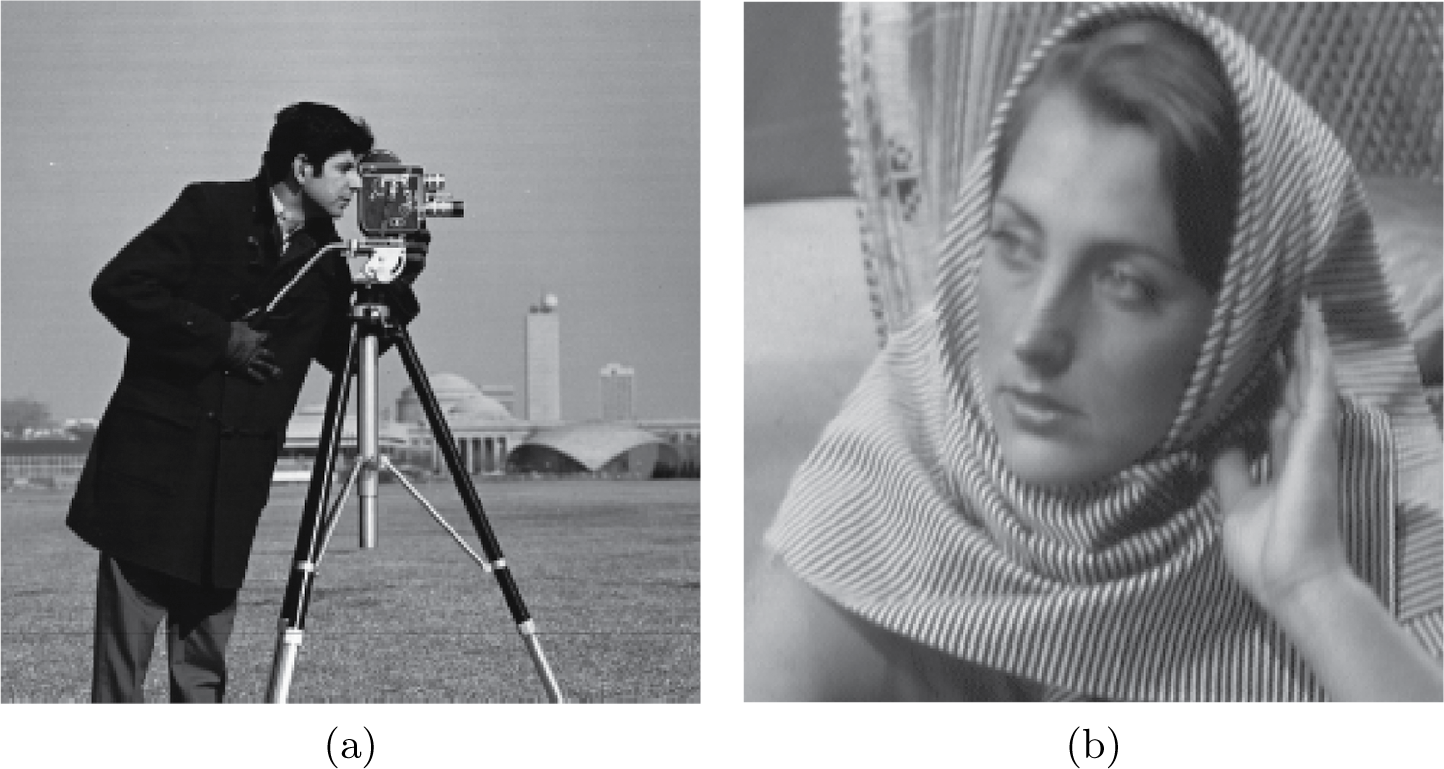
We use three baseline algorithms as the benchmark. The first two are AAR and RAAR. The third is Gaussian-DRS with
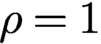 $\rho =1$
:
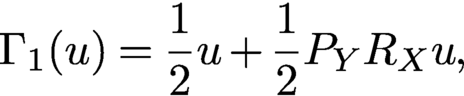 $$ \begin{align} \Gamma_1(u) = {{1\over 2}} u+{{1\over 2}} P_YR_X u, \end{align} $$
given the basic guarantee that, for
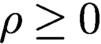 $\rho \ge 0$
, the regular solutions are attracting (Theorem 4.8), that for the range
 $\rho \ge 1$
no fixed points other than the regular solution(s) are locally attracting (Theorem 4.7) and that Gaussian-DRS with
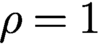 $\rho =1$
produces the best convergence rate for any
 $\rho \ge 1$
(Corollary 4.9). The contrast between (4.49) and AAR (4.2) is noteworthy. The simplicity of the form (4.49) suggests the name averaged projection reflection (APR) algorithm.
According to Li and Zhou (Reference Li and Zhou2017), the optimal
 $\beta $
is usually between 0.8 and 0.9, corresponding to
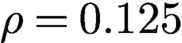 $\rho =0.125$
and
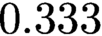 $0.333$
according to (4.46). We set
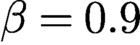 $\beta =0.9$
in Figure 4.3.
Reconstruction (relative) error versus iteration by various methods indicated in the legend with random initialization. The straight line feature (in all but AAR) in the semi-log plot indicates geometric convergence.
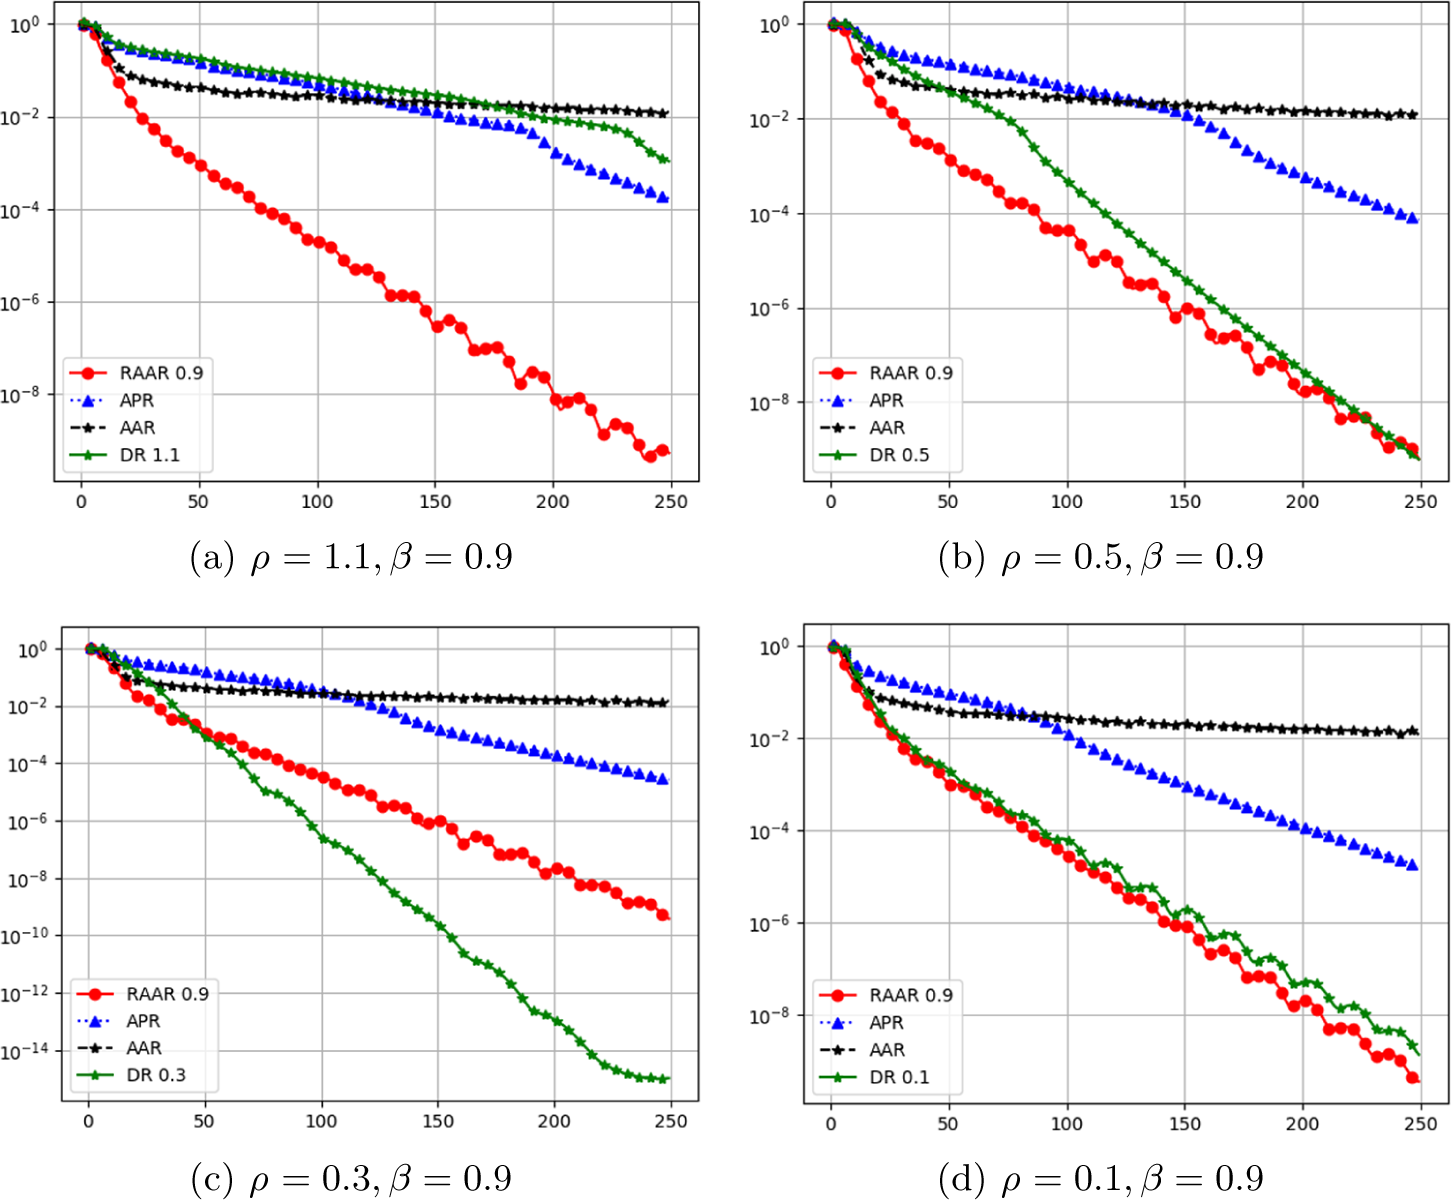
In the experiments we consider the setting of non-ptychographic phase retrieval with two coded diffraction patterns: the plane wave (
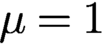 $\mu =1$
), and
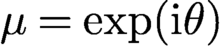 $\mu =\exp ({\mathrm {i}} \theta )$
where
 $\theta $
is independent and uniformly distributed over
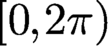 $[0,2\pi )$
. The uniqueness of the solution, up to a constant phase factor, is given in Fannjiang (Reference Fannjiang2012).
Figure 4.3 shows the relative error (modulo a constant phase factor) versus iteration of RAAR (
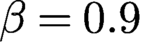 $\beta =0.9$
red dots, solid line), APR (blue triangles, dotted line), AAR (black stars, dashed line) and Gaussian-DRS with (a)
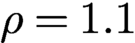 $\rho =1.1$
, (b)
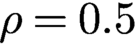 $\rho =0.5$
, (c)
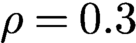 $\rho =0.3$
and (d)
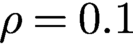 $\rho =0.1$
. Note that the AAR, APR and RAAR lines vary slightly across different plots because of random initialization.
The straight line feature (in all but AAR) in the semi-log plot indicates global geometric convergence. The case with AAR is less clear in Figure 4.3, but it has been shown that the AAR sequence converges geometrically near the true object (after applying
 $A^+$
) but converges in power-law (
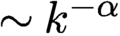 $\sim k^{-\alpha }$
with
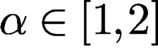 $\alpha \in [1,2]$
) from random initialization (Chen and Fannjiang Reference Chen and Fannjiang2018b
).
Figure 4.3 shows that APR outperforms AAR but underperforms RAAR. By decreasing
 $\rho $
to either
 $0.5$
or
 $0.1$
, the performance of Gaussian-DRS closely matches that of RAAR. The optimal parameter appears to lie in between
 $0.1$
and
 $0.5$
. For example, with
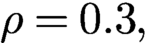 $\rho =0.3,$
Gaussian-DRS significantly outperforms RAAR. The oscillatory behaviour of Gaussian-DRS in Figure 4.3(d) is due to the dominant complex eigenvalue of J.
5 Initialization strategies
Initialization is an important part of non-convex optimization to avoid local minima. Good initialization can also help to reduce the number of iterations of iterative solvers for convex optimization problems. A simple idea for effective initialization is to first capture basic features of the original object. There are three tasks we want a good initializer to fulfil: (i) it should ensure that the algorithm converges to the correct solution, (ii) it should reduce the number of iterations, and (iii) it should be inexpensive to compute. Naturally, there will be a trade-off between achieving the first two tasks and task (iii).
5.1 Spectral initialization
Spectral initialization (Candès et al. Reference Candès, Li and Soltanolkotabi2015) has become a popular method in phase retrieval, bilinear compressive sensing, matrix completion and related areas. In a nutshell, one chooses the leading eigenvector of the positive semidefinite Hermitian matrix
 $$ \begin{align} Y:= \sum_k y_k a_k a_k^{\ast} = A^{\ast} {\operatorname{diag}}(y) A \end{align} $$
as initializer. The leading eigenvector of Y can be computed efficiently via the power method by repeatedly applying A, entry-wise multiplication by y and
 $A^{\ast }$
.
To give an intuitive explanation for this choice, consider the case in which the measurement vectors
 $a_k$
are i.i.d.
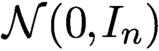 ${\cal N}(0,I_n)$
. Let x be a solution to (2.1) so that
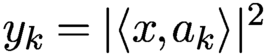 $y_k = |\langle x, a_k \rangle |^2$
for
 $k=1,\ldots ,N$
. In the Gaussian model, a simple moment calculation gives
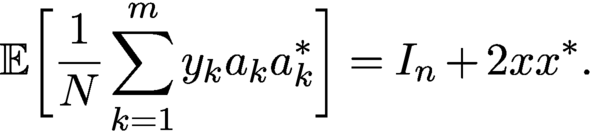 $$ \begin{align*} {\mathbb{E}}\biggl[ {\displaystyle \frac{1}{N}} \sum_{k=1}^m y_k a_k a_k^{\ast} \biggr] = I_n + 2xx^{\ast}. \end{align*} $$
By the strong law of large numbers, the matrix
 $Y = \sum _k y_k a_k a_k^{\ast }$
converges to the right-hand side as the number of samples goes to infinity. Since any leading eigenvector of
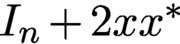 $I_n + 2xx^{\ast }$
is of the form
 $\lambda x$
for some
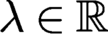 $\lambda \in {\mathbb {R}}$
, it follows that if we had infinitely many samples, this spectral initialization would recover x exactly (up to a usual global phase factor). Moreover, the ratio between the top two eigenvalues of
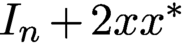 $I_n + 2xx^{\ast }$
is
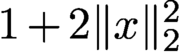 $1+2 \|x\|_2^2$
, which means these eigenvalues are well separated unless
 $\|x\|_2$
is very small. This in turn implies that the power method would converge fast. For a finite amount of measurements, the leading eigenvector of Y will of course not recover x exactly, but with the power of concentration of measure on our side, we can hope that the resulting (properly normalized) eigenvector will serve as a good initial guess to the true solution. This is made precise in connection with Wirtinger flow in Theorem 4.5.
There is a nice connection between the spectral initialization and the PhaseLift approach, which will become evident in Section 6.
5.2 Null initialization
Another approach to constructing an effective initializer proceeds by choosing a threshold for separating the ‘weak’ signals from the ‘strong’ signals. The classification of signals into classes of weak and strong signals is a basic feature of the data.
Let
 $I\subset \{1,\ldots ,N\}$
be the support set of the weak signals and
 $I_c$
its complement such that
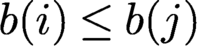 $b(i)\leq b(j)$
for all
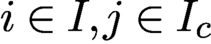 $i\in I, j\in I_c$
. In other words,
 $\{b(i)\colon i\in I_c\}$
are the strong signals. Denote the sub-row matrices consisting of
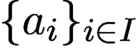 $\{a_i\}_{i\in I} $
and
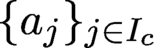 $\{a_j\}_{j\in I_c}$
by
 $A_I$
and
 $A_{I_c}$
, respectively. Let
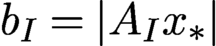 $b_I=|A_I{x_{*}}|$
and
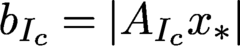 $b_{I_c}=|A_{I_c}{x_{*}}|$
. We always assume
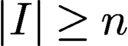 $|I|\ge n$
so that
 $A_I$
has a trivial null space and hence preserves the information of
 ${x_{*}}$
.
The significance of the weak signal support I lies in the fact that I contains the best loci to ‘linearize’ the problem since
 $A^*_I {x_{*}}$
is small. We then initialize the object estimate by the ground state of the sub-row matrix
 $A_I$
, i.e. the variational principle
 $$ \begin{align} x_{\text{null}}\in \text{ arg }\min \{\|A_I x\|^2\colon x\in {\mathbb{C}} ^{n}, {\|x\|=\|b\|} \}, \end{align} $$
which by the isometric property of A is equivalent to
 $$ \begin{align} x_{\text{null}}\in \text{ arg }\max \{\|A_{I_c} x\|^2\colon x\in {\mathbb{C}} ^{n}, {\|x\|=\|b\|}\}. \end{align} $$
Note that (5.3) can be solved by the power method for finding the leading singular value. The resulting initial estimate
 $x_{\text {null}}$
is called the null vector (Chen, Fannjiang and Liu Reference Chen, Fannjiang and Liu2017, Chen et al. Reference Chen, Fannjiang and Liu2018); see Wang et al. (Reference Wang, Giannakis and Eldar2018) for a similar idea for real-valued Gaussian matrices.
In the case of non-blind ptychography, for each diffraction pattern k, the ‘weak signals’ are those less than some chosen threshold
 $\tau _k$
, and we collect the corresponding indices in the set
 $I_k$
. Let
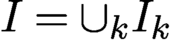 $I=\cup _k I_k$
. We then initialize the object estimate by the variational principle (5.2) or (5.3).
A key question then is how to choose the threshold for separating weak from strong signals. The following performance guarantee provides a guideline for choosing the threshold.
Theorem 5.1 (Chen, Fannjiang and Liu Reference Chen, Fannjiang and Liu2017).
Let A be an
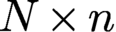 $N\times n$
i.i.d. complex Gaussian matrix and let
 $$ \begin{align} \xi_{\text{null}} \in \text{ arg }\min \{\|A_I x\|^2\colon x\in {\mathbb{C}} ^{n}, {\|x\|=\|{x_{*}}\|}\}. \end{align} $$
Let
 $ \varepsilon :={|I|/N}<1$
,
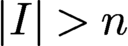 ${|I|>n}$
. Then, for any
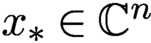 ${x_{*}}\in {\mathbb {C}} ^n$
, the error bound
 $$ \begin{align} \|{x_{*}}{x_{*}}^* - \xi_{\text{null}} \xi_{\text{null}}^*\|_{\mathrm{F}}/\|{x_{*}}\|^2 \le c_0\sqrt{\varepsilon} \end{align} $$
holds with probability at least
 $1-5\exp (-c_1{|I|^2/N}) - 4\exp (-c_2 n)$
. Here
 $\|\cdot \|_{\mathrm F}$
denotes the Frobenius norm.
By Theorem 5.1, we have that, for
 $N=Cn\ln n$
and
 $|I|=Cn,\ C>1$
,
 $$ \begin{align*} \|{x_{*}}\|^{-2}\|{x_{*}}{x_{*}}^* - \xi_{\text{null}} \xi_{\text{null}}^*\|_{\mathrm{F}}\le {\displaystyle \frac{c}{ \sqrt{\ln n}}}, \end{align*} $$
with probability exponentially (in n) close to one, implying that crude reconstruction from a one-bit intensity measurement is easy. Theorem 5.1 also gives a simple guideline
 $$ \begin{align*} n< |I|\ll N\ll |I|^2 \end{align*} $$
for the choice of
 $|I|$
(and hence the intensity threshold) to achieve a small
 $\varepsilon $
with high probability. In particular, the choice
 $$ \begin{align} |I|=\lceil n^{1-\alpha}N^\alpha\rceil=\lceil n \delta^{\alpha}\rceil,\quad \alpha\in [0.5, 1) \end{align} $$
yields the (relative) error bound
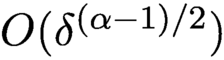 ${{{O}}} (\delta ^{(\alpha -1)/2})$
, with probability exponentially (in n) close to 1, achieving the asymptotic minimum at
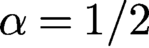 $\alpha =1/2$
(the geometric mean rule). The geometric mean rule will be used in the numerical experiments below.
Given the wide range of effective thresholds, the null vector is robust because the noise primarily tends to mess up the indices near the threshold and can be compensated by choosing a smaller I, unspoiled by noise and thus satisfying the error bound (5.5).
For null vector initialization with a non-isometric matrix such as the Gaussian random matrix in Theorem 5.1, it is better to first perform QR factorization of A, instead of computing (5.4), as follows.
For a full rank
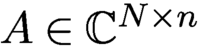 $A\in {\mathbb {C}} ^{N\times n}$
, let
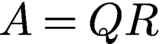 $A=QR$
be the QR-decomposition of A where Q is isometric and R is an invertible upper-triangular square matrix. Let
 $Q_I$
and
 $Q_{I_c}$
be the sub-row matrices of Q corresponding to the index sets I and
 $I_c$
, respectively. Clearly
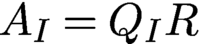 $A_I=Q_IR$
and
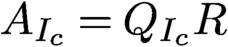 $A_{I_c}=Q_{I_c}R$
.
Let
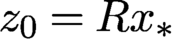 $z_0=R{x_{*}}$
. Since
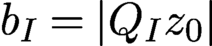 $b_I=|Q_Iz_0|$
is small, the rows of
 $Q_I$
are nearly orthogonal to
 $z_0$
. A first approximation can be obtained from
 $x_{\text {null}}=R^{-1} z_{\text {null}}$
, where
 $$ \begin{align*} z_{\text{null}}\in \text{arg}\min \{\|Q_I z\|^2\colon z\in {\mathbb{C}} ^n, {\|z\|=\|b\|}\}. \end{align*} $$
In view of the isometry property
 $$ \begin{align*} \|z\|^2= \|Q_I z \|^2+\|Q_{I_c} z \|^2=\|b\|^2, \end{align*} $$
minimizing
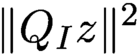 $ \|Q_I z \|^2$
is equivalent to maximizing
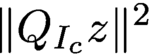 $\|Q_{I_c}z\|^2$
over
 $\{z\colon \|z\|= \|b\|\}$
. This leads to the alternative variational principle
 $$ \begin{align} x_{\text{null}}\in \text{arg}\max \{\|A_{I_c} x\|^2\colon x\in {\mathbb{C}} ^n, {\|Rx\|=\|b\|}\} \end{align} $$
solvable by the power method.
The initial estimate
 $ \xi _{\text {null}}$
in (5.4) is close to
 $x_{\text {null}}$
in (5.7) when the oversampling ratio
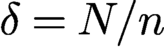 $\delta =N/n$
of the i.i.d. Gaussian matrix is large or when the measurement matrix is isometric (
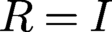 $R=I$
) as for the coded Fourier matrix. Numerical experiments show that
 $ \xi _{\text {null}}$
is close to
 $x_{\text {null}}$
for
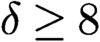 $\delta \ge 8$
. But for
 $\delta =4$
,
 $x_{\text {null}}$
is a significantly better approximation than
 $ \xi _{\text {null}}$
. Note that
 $\delta =4$
is near the threshold of having an injective intensity map:
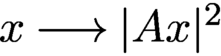 $x\longrightarrow |A x|^2$
for a generic (i.e. random) A (Balan et al. Reference Balan, Casazza and Edidin2006).
5.3 Optimal preprocessing
In both null and spectral initializations, the estimate
 ${x}$
is given by the principal eigenvector of a suitable positive definite matrix constructed from A and b. In the case of spectral initialization, an asymptotically exact recovery is guaranteed; in the case of null initialization, a non-asymptotic error bound exists and guarantees asymptotically exact recovery.
Contrary to these, the weak recovery problem of finding an estimate
 ${x}$
that has a positive correlation with
 ${x_{*}}$
, that is,
 $$ \begin{align} \liminf_{N\to\infty} {\mathbb{E}}\biggl\{{\displaystyle \frac{|{x}^*{x_{*}}|}{ \|{x_{*}}\|\|{x}\|}}\biggr\}> \varepsilon\quad\text{for some } \varepsilon>0, \end{align} $$
is analysed in Mondelli and Montanari (Reference Mondelli and Montanari2019), Lu and Li (Reference Lu and Li2017) and Luo, Alghamdi and Lu (Reference Luo, Alghamdi and Lu2019). The fundamental interest of the weak recovery problem lies in the phase transition phenomenon stated below.
Theorem 5.2. Let
 ${x_{*}}$
be uniformly distributed on the n-dimensional complex sphere with radius
 $\sqrt {n}$
and let the rows of
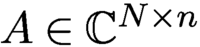 $A\in {\mathbb {C}} ^{N\times n}$
be i.i.d. complex circularly symmetric Gaussian vectors of covariance
 $I_n/n$
. Let
 $$ \begin{align} {\tilde{y}}=|A{x_{*}}|^2+\eta , \end{align} $$
where
 $\eta $
is real-valued Gaussian vector of covariance
 $\sigma ^2 I_N$
and let
 $N,n\to \infty $
with
 $N/n\to \delta \in (0,\infty )$
.
-
• For
$\delta <1$
, no algorithm can provide non-trivial estimates on
${x_{*}}$
. -
• For
$\delta>1$
, there exists
$\sigma _0(\delta )>0$
and a spectral algorithm that returns an estimate
${x}$
satisfying (5.8) for any
$\sigma \in [0,\sigma _0(\delta )]$
.



Like spectral initialization, weak recovery theory considers the spectral algorithm of computing the principal eigenvalue of
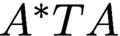 $A^* T A$
, where T is a preprocessing diagonal matrix. An important discovery of Mondelli and Montanari (Reference Mondelli and Montanari2019) is that by removing the positivity assumption
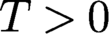 $T>0$
and allowing negative values, an explicit recipe for T is given and shown to be optimal in the sense that it provides the smallest possible threshold
 $\delta _u$
for the signal model (5.9). Specifically, with vanishing noise
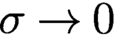 $\sigma \to 0$
, the threshold
 $\delta _u$
tends to 1 as
 $$ \begin{align*} \delta_u(\sigma^2)=1+\sigma^2+ o(\sigma^2), \end{align*} $$
and the optimal function is given by
 $$ \begin{align} T_{\text{op}}({\tilde{y}},\delta) = {\displaystyle \frac{{\tilde{y}}_+-1}{ {\tilde{y}}_++\sqrt{\delta}-1}},\quad {\tilde{y}}_+=\max(0,{\tilde{y}}), \end{align} $$
which has a large negative part for small
 ${\tilde {y}}$
(Mondelli and Montanari Reference Mondelli and Montanari2019). This counterintuitive feature tends to slow down convergence of the power method as the principal eigenvalue of
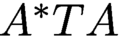 $A^*TA$
may not have the largest modulus; see Mondelli and Montanari (Reference Mondelli and Montanari2019) for more details.
5.4 Random initialization
While the aforementioned initializations are computationally quite efficient, one may wonder if such carefully designed initialization is even necessary for achieving convergence for non-convex algorithms or to reduce the number of iterations for iterative solvers of convex approaches. In particular, random initialization has been proposed as a cheap alternative to the more costly initialization strategies described above. In this case we simply construct a random signal in
 ${\mathbb {C}}^n$
, for instance with i.i.d. entries chosen from
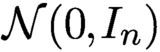 ${\mathcal N}(0,I_{n})$
, and use it as initialization.
For non-convex solvers, we clearly cannot expect that starting the iterations at an arbitrary point will work, since we may get stuck at a saddle point or some local minimum. But if the optimization landscape is benign enough, it may be that there are no undesirable local extrema or that they can be easily avoided. A very thorough study of the optimization landscape of phase retrieval has been conducted by Sun, Qu and Wright (Reference Sun, Qu and Wright2018), Chen et al. (Reference Chen, Chi, Fan and Ma2019) and Mondelli and Montanari (Reference Mondelli and Montanari2019).
For instance, Chen et al. (Reference Chen, Chi, Fan and Ma2019) have shown that for Gaussian measurements, gradient descent combined with random initialization will converge to the true solution and at a favourable rate of convergence, assuming that the number of measurements satisfies
 . This result may suggest that random initialization is just fine and there is no need for more advanced initializations. The precise theoretical condition for N is
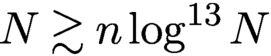 . This large exponent in the log-factor becomes negligible if n is of the order of at least, say,
 $10^{25}$
, which makes this result somewhat less compelling from a theoretical viewpoint. However, it is likely that this large exponent can be attributed to technical challenges in the proof and in truth it is actually much smaller. This is also suggested by the numerical simulations conducted in Section 5.5.
5.5 Comparison of initializations
We conduct an empirical study by comparing the effectiveness of different initializations.
First we present experiments comparing the performance of the null initialization and the optimal preprocessing methods for noiseless as well as noisy data; see Figures 5.1 and 5.2. While the optimal preprocessing function has no adjustable parameter, we use the default threshold
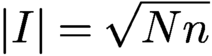 $|I|=\sqrt {Nn}$
for the null initialization (
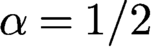 $\alpha ={1/2}$
in (5.6)).
Initialization for RPP with two OCDPs at NSR 0% (a), 10% (b) and 20% (c). Each panel shows
 $|{\mbox {Re}\,}[\overline {x}\odot {\textrm {sgn}}({x_{*}})]|$
(left half) and
 $|{\mbox {Im}\,}s[\overline {x}\odot {\textrm {sgn}}({x_{*}})]|$
(right half), where
 $x=x_{\text {null}}$
(top row) or
 $x_{\text {op}}$
(bottom row).
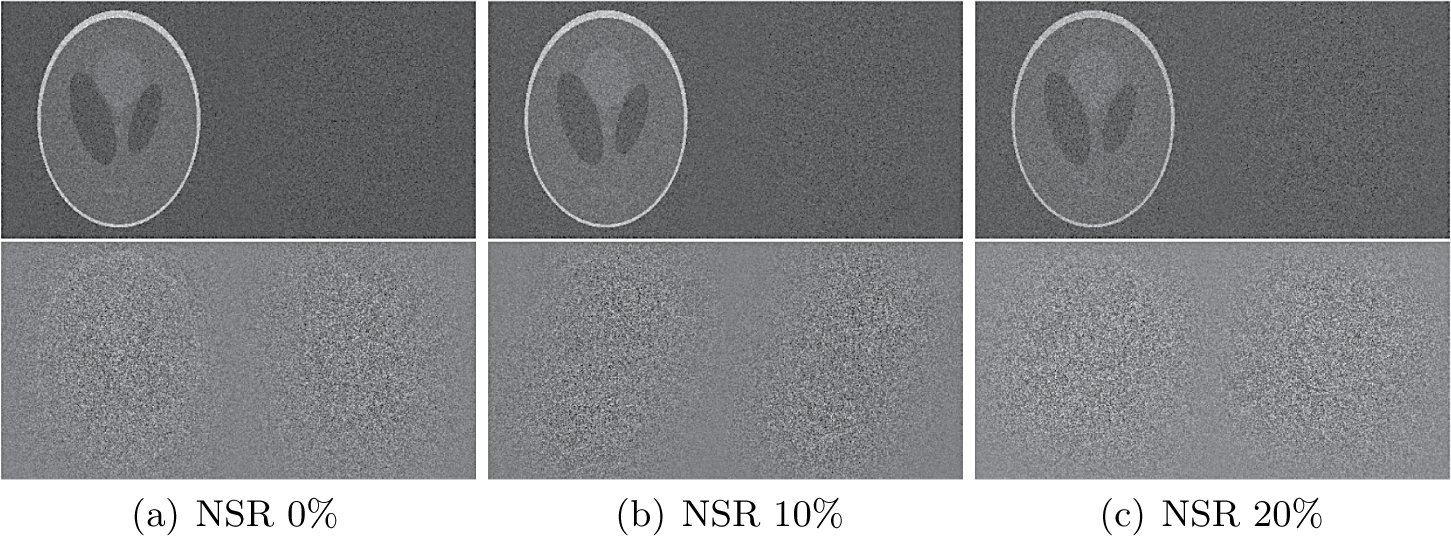
In the noisy case, we consider the complex Gaussian noise model (3.11) which sits between the Poisson noise and the thermal noise in some sense. The nature of noise is unimportant for the comparison but the level of noise is. We consider three different levels of noise (0%, 10% and 20%) as measured by the noise-to-signal ratio (NSR) defined as
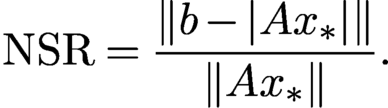 $$ \begin{align} \text{NSR}= {\displaystyle \frac{\|b-|A{x_{*}}|\|}{\|A{x_{*}}\|}}. \end{align} $$
Because the noise dimension N is larger than that of the object dimension, the feasibility problem is inconsistent with high probability.
Figure 5.1 shows the results for two oversampled randomly coded diffraction patterns (OCDPs). Hence
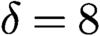 $\delta =8$
for the optimal preprocessing function (5.10) and the outcome is denoted by
 $x_{\text {op}}$
. We see that
 $x_{\text {null}}$
significantly outperforms
 $x_{\text {op}}$
, consistent with the relative errors shown in Table 5.1.
Relative errors for
 $x_{\text {null}}$
and
 $x_{\text {op}}$
of Figure 5.1.
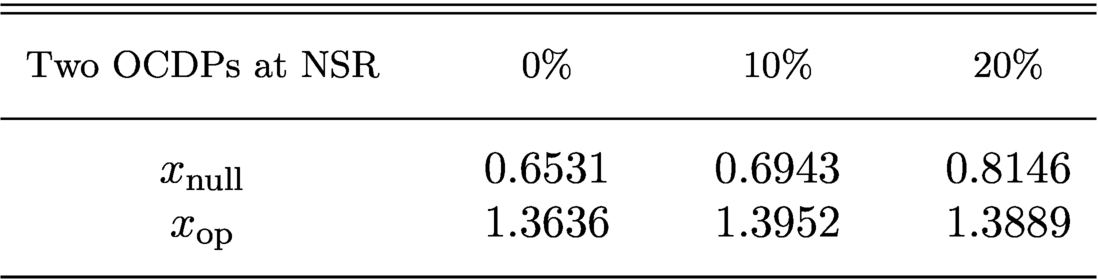
Here the optimal preprocessing method returns an essentially random output at all noise levels. This is somewhat surprising since the null vector uses only 1-bit information (the threshold), compared to the optimal preprocessing function (5.10), which uses the full information of the signals.
On the other hand, with four randomly coded diffraction patterns (CDPs) that are not oversampled (
 $\delta =4 $
for (5.10)),
 $x_{\text {op}}$
outperforms
 $x_{\text {null}}$
especially at large NSR. See Figure 5.2 for the visual effect and Table 5.2 for the relative errors of initialization.
Initialization for RPP with four CDPs at NSR 0% (a), 10% (b) and 20% (c). Each panel shows
 $|{\mbox {Re}\,}[\overline {x}\odot {\textrm {sgn}}({x_{*}})]|$
(left half) and
 $|{\mbox {Im}\,}[\overline {x}\odot {\textrm {sgn}}({x_{*}})]|$
(right half), where
 $x=x_{\text {null}}$
(top row) or
 $x_{\text {op}}$
(bottom row).
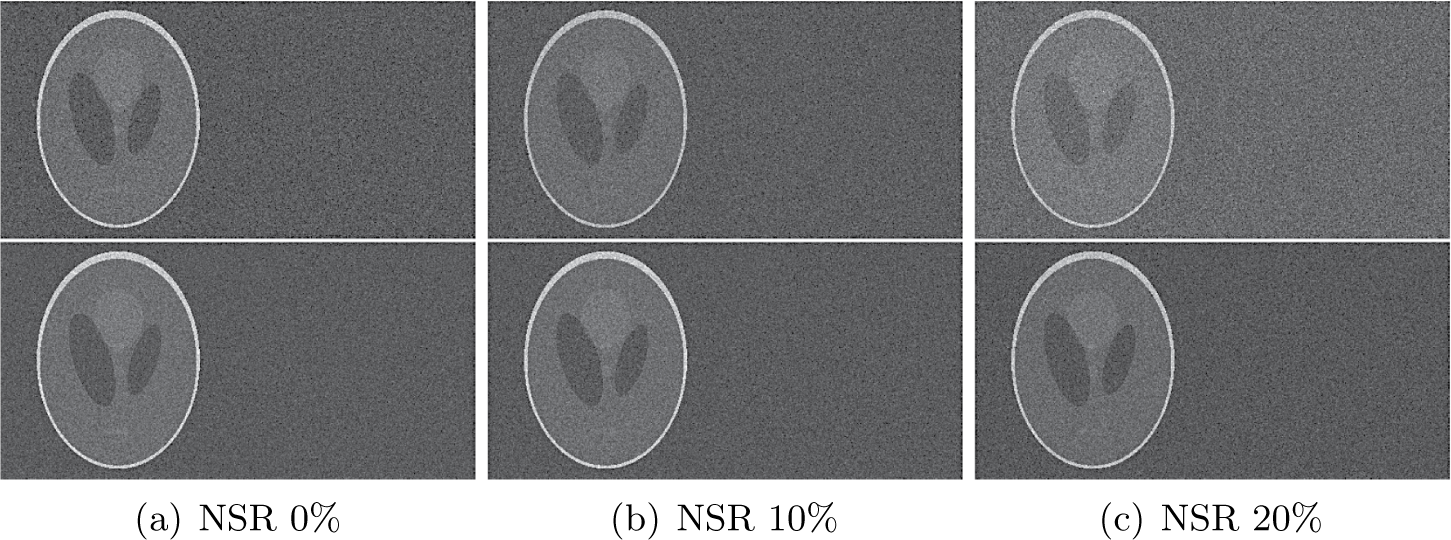
Relative errors for
 $x_{\text {null}}$
and
 $x_{\text {op}}$
of Figure 5.2.
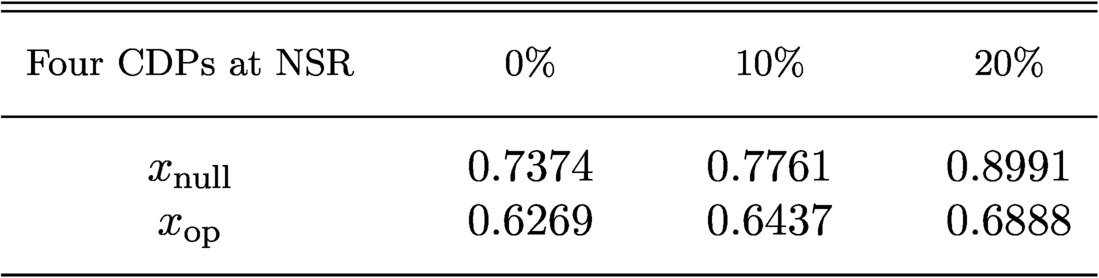
The important lesson here is that the null vector and the optimal preprocessing function make use of differently sampled CDPs in different ways: the oversampled CDPs favour the former while the standard CDPs favour the latter. In particular, the optimal spectral method (5.10) is optimized for independent measurements and does not perform well with highly correlated data in oversampled CDPs (Figure 5.1). As pointed out by Mondelli and Montanari (Reference Mondelli and Montanari2019), the performance of (5.10) can often be improved by manually setting
 $\delta $
very close to 1.
What follows are more simulations with a higher number of CDPs that are not oversampled, for various initialization methods. We analyse their performance with respect to three different aspects: (i) number of measurements; (ii) number of iterations, (iii) overall runtime. The initializers under comparison are the standard spectral initializer, the truncated spectral initializer introduced in Chen and Candès (Reference Chen and Candès2017), the optimal spectral initializer, the null initializer (sometimes also referred to as the ‘orthogonality-promoting’ initializer) and random initialization. The computational complexity of constructing each of the first four initializers is roughly similar; they all require the computation of the leading eigenvector of a self-adjoint matrix associated with the measurement vectors
 $a_k$
, which can be done efficiently with the power method (the matrix itself does not have to be constructed explicitly).
We choose a complex-valued Gaussian random signal of length
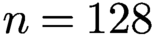 $n=128$
as ground truth and obtain phaseless measurements with k diffraction illuminations, where
 $k=3,\ldots , 12$
. Thus the number N of phaseless measurements ranges from
 $3n$
to
 $12n$
. The signal has no structural properties that we can take advantage of; for example, we cannot exploit any support constraints. We use the PhasePack toolbox (Chandra et al. Reference Chandra, Zhong, Hontz, McCulloch, Studer and Goldstein2017) with its default settings for this simulation, except that for the threshold for the null initialization we use
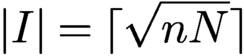 $|I|=\lceil \sqrt {nN}\rceil $
, as suggested by Theorem 5.1.
We run Wirtinger flow with different initializations until the residual error is smaller than
 $10^{-4}$
. For each
 $k=3,\ldots ,12$
and each fixed choice of signal and illuminations we repeat the experiment 100 times, and do so for 100 different random choices of signal and illuminations. For each k the results are then averaged over these
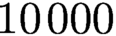 $10\,000$
runs. For each number of illuminations, we compare the number of iterations as well as the overall runtime of the algorithm needed to achieve the desired residual error. We also compare the rate of successful recovery, where success is (generously) defined as the case when the algorithm returns a solution with relative
 $\ell _2$
-error less than 0.1. A success rate of 1 means that the algorithm succeeded in all simulations for a fixed number of illuminations. See Figures 5.3 and 5.4 for results.
The initializers under comparison are the standard, truncated and optimal spectral initializers, the ‘orthogonality-promoting’ initializer, and random initialization. We run Wirtinger flow with different initializations and compare (a) the number of iterations and (b) the total computation time needed for Wirtinger flow to achieve a residual error less than
 $10^{-4}$
.
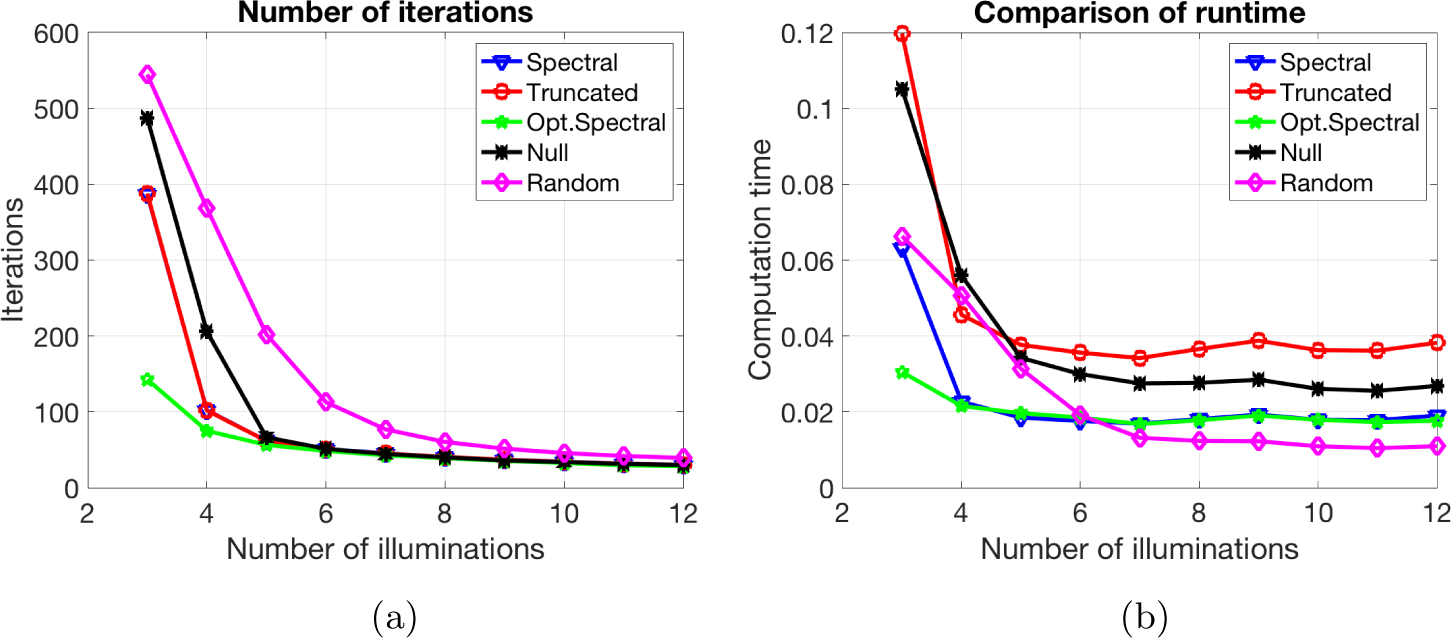
The same set-up as in Figure 5.3. We compare the success rate for Wirtinger flow with different initializations. For this experiment, a ‘successful recovery’ means that the algorithm returns a solution with relative
 $\ell _2$
-error less than 0.1. A success rate of 1 means that the algorithm succeeded in all simulations. The optimal spectral initialization clearly outperforms all other initializations when the number of measurements is small.
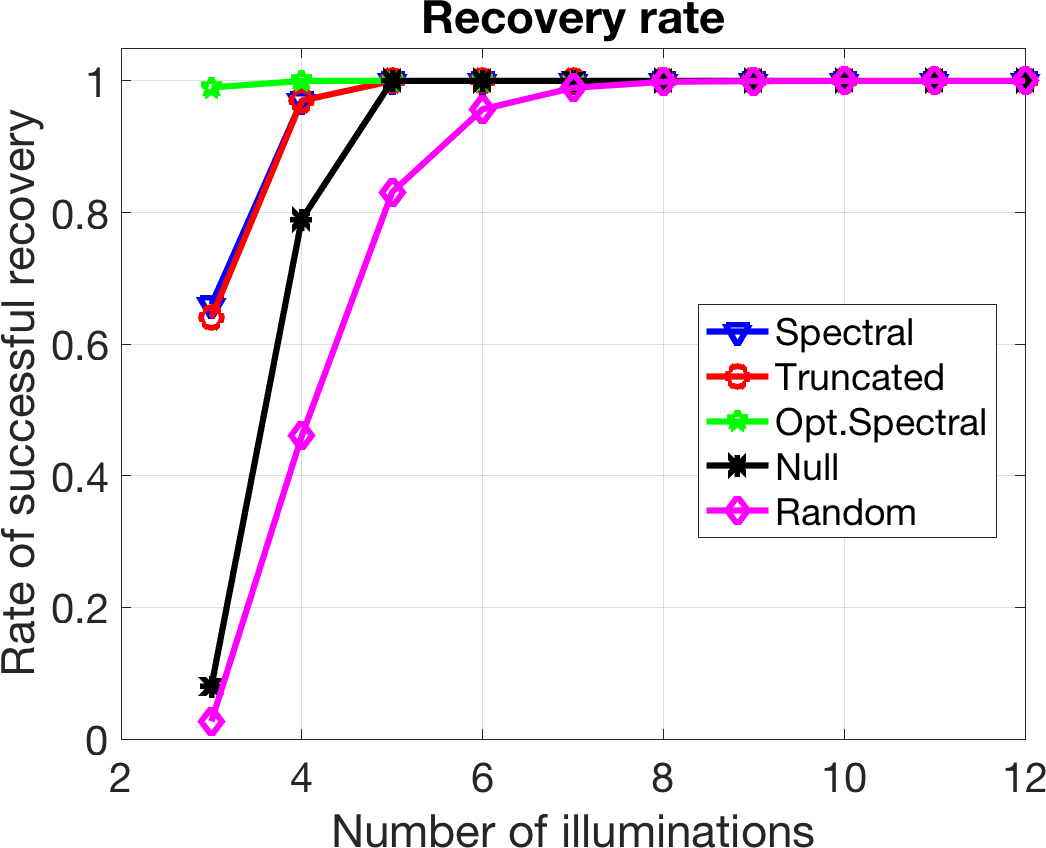
The most relevant and important case from a practical viewpoint is when the required number of illuminations is as small as possible, as this reduced the experimental burden. The clear winner in this case is the optimal spectral initializer. When we use only three illuminations, it significantly outperforms all the other initializers. In general, for the recovery of a complex-valued signal of length n from phaseless measurements, we cannot expect any method to succeed at a perfect rate when we use only
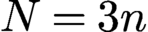 $N=3n$
measurements.
The exact number of measurements necessary to make recovery of a signal
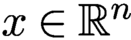 $x \in {\mathbb {R}}^n$
from phaseless measurements at least theoretically possible (setting aside the existence of a feasible algorithm and issues of numerical stability) is
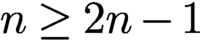 $n \ge 2n-1$
. For complex-valued signals the precise lower bound is still open. The asymptotic estimate
 $N =(4+o(1))n$
follows from Heinosaari, Mazzarella and Wolf (Reference Heinosaari, Mazzarella and Wolf2013) and Balan, Casazza and Edidin (Reference Balan, Casazza and Edidin2007); see also Bandeira, Cahill, Mixon and Nelson (Reference Bandeira, Cahill, Mixon and Nelson2014). For dimensions
 $n=2^k =1$
, Conca, Edidin, Hering and Vinzant (Reference Vinzant2015) have shown that
 $N=4n-4$
is necessary.Footnote
2
In general, for the recovery of a complex-valued signal of length n from phaseless measurements we have
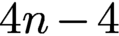 $4n-4$
; we cannot expect any method to succeed at a perfect rate when we use only
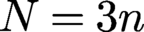 $N=3n$
measurements,
As the number of illuminations increases, the difference becomes less pronounced, which is in line with theoretical predictions. For a moderate number of illuminations the random initializer performs as well as the others, at a lower computational cost. As expected, the theory for random initialization (which involves the term
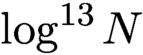 $\log ^{13} N$
) is overly pessimistic. Nevertheless, in practice there can be a substantial difference in the experimental effort if we need to carry, say, six illuminations instead of just three illuminations. Hence, we conclude that ‘there is no free lunch with random initialization!’
6 Convex optimization
While phase retrieval is a non-convex optimization problem, it has become very popular in recent years to pursue convex relaxations of this problem. A major breakthrough in this context was the PhaseLift approach (Candès et al. Reference Candès, Eldar, Strohmer and Voroninski2013a , Candès et al. Reference Candès, Strohmer and Voroninski2013b ), which demonstrated that under fairly mild conditions the solution of a properly constructed semidefinite program coincides with the true solution of the original non-convex problem. This discovery has ignited a renewed interest in the phase retrieval problem. We will describe the key idea of PhaseLift below.
6.1 PhaseLift: phase retrieval via matrix completion
As is well known, quadratic measurements can be lifted up and interpreted as linear measurements about the rank-one matrix
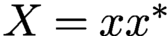 $X = x x^{*}$
. Indeed,
 $$ \begin{align} |\langle a_k, x\rangle |^2 = {\operatorname{Tr}}(x^* a_k a_{k}^{*} x) = {\operatorname{Tr}}(a_k a_{k}^{*} x x^*). \end{align} $$
We write
 ${\mathcal {H}}_{n}$
for the Hilbert space of all
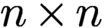 $n \times n$
Hermitian matrices equipped with the Hilbert–Schmidt inner product
 $\langle X,Y \rangle _{{\text {HS}}} := {\operatorname {Tr}}(Y^\ast X)$
. Now, letting
 ${\mathcal {A}}$
be the linear transformation
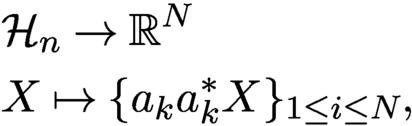 $$ \begin{align} \begin{aligned} &{\mathcal{H}}_{n} \rightarrow {\mathbb{R}}^N \\ & X \mapsto \{a_{k} a_{k}^{*} X \}_{1 \le i \le N}, \end{aligned} \end{align} $$
which maps Hermitian matrices into real-valued vectors, one can express the data collection
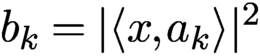 $b_k = |\langle x, a_k\rangle |^2$
as
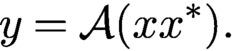 $$ \begin{align*} y = \mathcal{A}(x x^*). \end{align*} $$
For reference, the adjoint operator
 ${\mathcal {A}}^*$
maps real-valued inputs into Hermitian matrices, and is given by
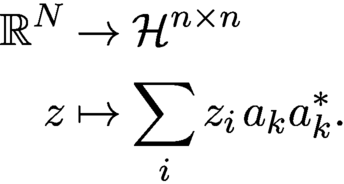 $$ \begin{align*} \begin{aligned} {\mathbb{R}}^{N} & \to \mathcal{H}^{n \times n}\\ z & \mapsto \sum_i z_i \, a_k a_{k}^{*}. \end{aligned} \end{align*} $$
Moreover, we define
 ${\mathcal {T}}_{x}$
to be the set of symmetric matrices of the form
 $$ \begin{align*} {\mathcal{T}}_{x} = \{X = x z^{*} + z x^*\colon z \in {\mathbb{C}}^n\} \end{align*} $$
and let
 ${\mathcal {T}}_{x}^\perp $
denote its orthogonal complement. Note that
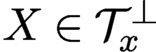 $X \in {\mathcal {T}}_{x}^\perp $
if and only if both the column and row spaces of X are perpendicular to x.
Hence the phase retrieval problem can be cast as the matrix recovery problem (Candès et al. Reference Candès, Eldar, Strohmer and Voroninski2013a , Candès et al. Reference Candès, Strohmer and Voroninski2013b )
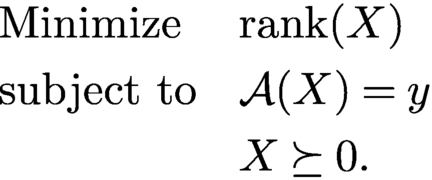 $$ \begin{align*} \begin{aligned} & \text{Minimize}&& {\operatorname{rank}}(X)\\& \text{subject to}&& {\mathcal{A}}(X) = y \\&&& X \succeq 0. \end{aligned} \end{align*} $$
Indeed, we know that a rank-one solution exists so the optimal X has rank at most one. We then factorize the solution as
 $x x^*$
in order to obtain solutions to the phase retrieval problem. This gives x up to multiplication by a unit-normed scalar.
Rank minimization is in general NP hard, and we instead propose solving a trace-norm relaxation. Although this is a fairly standard relaxation in control (Beck and D’Andrea Reference Beck and D’Andrea1998, Mesbahi and Papavassilopoulos Reference Mesbahi and Papavassilopoulos1997), the idea of casting the phase retrieval problem as a trace minimization problem over an affine slice of the positive semidefinite cone is more recent.Footnote 3 Formally, we suggest solving
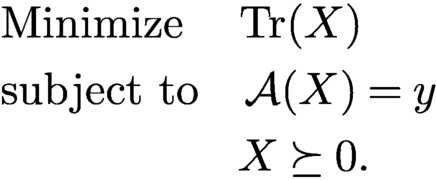 $$ \begin{align} \begin{aligned} & \text{Minimize}\quad\,\, {\operatorname{Tr}}(X)\\ & \text{subject to} \quad {\mathcal{A}}(X) = y\\ &\,\,\quad \qquad \qquad X \succeq 0. \end{aligned} \end{align} $$
If the solution has rank one, we factorize it as above to recover our signal. This method, which lifts up the problem of vector recovery from quadratic constraints into that of recovering a rank-one matrix from affine constraints via semidefinite programming, is known by the name of PhaseLift (Candès et al. Reference Candès, Eldar, Strohmer and Voroninski2013a , Candès et al. Reference Candès, Strohmer and Voroninski2013b ).
A sufficient (and nearly necessary) condition for
 $x x^\ast $
to be the unique solution to (6.3) is given by the following lemma.
Lemma 6.1. For a given vector
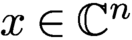 $x \in {\mathbb {C}}^n$
, suppose the measurement mapping
 ${\mathcal {A}}$
satisfies the following two conditions.
-
(i) The restriction of
${\mathcal {A}}$
to T is injective (
$X \in T$
and
${\mathcal {A}}(X) = 0 \Rightarrow X = 0$
). -
(ii) There exists a dual certificate Z in the range of
${\mathcal {A}}^*$
obeyingFootnote
4
$$ \begin{align*} Z_T = x x^{\ast} \quad \text{and} \quad Z_{{\mathcal{T}^{\perp}}} \prec I_{{\mathcal{T}^{\perp}}}{.} \end{align*} $$

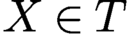



Then
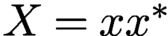 $X = x x^\ast $
is the only matrix in the feasible set of (6.3), that is, X is the unique solution of (6.3).
The proof of Lemma 6.1 follows from standard duality arguments in semidefinite programming.
Proof. Let
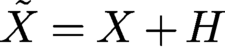 $\tilde {X} = X+H$
be a matrix in the feasible set of (6.3). We want to show that
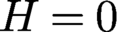 $H=0$
. By assumption
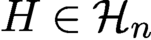 $H \in {\mathcal {H}}_{n}$
and
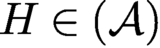 $H \in ({\mathcal {A}})$
, so we can express H as
 $H = H_{\mathcal {T}} + H_{\mathcal {T}}^{\perp }$
. Since
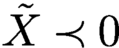 $\tilde X \prec 0$
, it follows for all
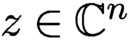 $z \in {\mathbb {C}}^n$
with
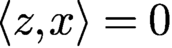 $\langle z,x\rangle = 0$
that
 $$ \begin{align*} z^\ast \tilde{X} z = z^\ast (x x^{\ast} + H_{\mathcal{T}} + H_{\mathcal{T}}^{\perp})z = z^\ast H_{\mathcal{T}}^{\perp} y \ge 0. \end{align*} $$
Because the range spaces of
 $H_{\mathcal {T}}^{\perp }$
and of
 $H^{\ast }_{{\mathcal {T}^{\perp }}}$
are contained in orthogonal complement of
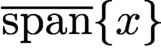 $\overline {\text {span}}\{x\}$
, this shows that
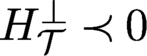 $H_{\mathcal {T}}^{\perp } \prec 0$
. Since
 $Z \in {\mathcal {R}} ({\mathcal {A}}) = ({\mathcal {A}})^\perp $
it holds that
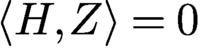 $\langle H,Z \rangle = 0$
, and because
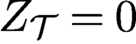 $Z_{\mathcal {T}} = 0$
it follows that
 $\langle H,Z \rangle = \langle H_{\mathcal {T}}^{\perp }, Z_{\mathcal {T}}^{\perp } \rangle = 0$
. But since
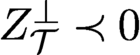 $Z_{\mathcal {T}}^{\perp } \prec 0 $
, this shows that
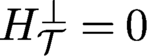 $H_{\mathcal {T}}^{\perp } = 0$
. By injectivity of
 ${\mathcal {A}}$
on
 ${\mathcal {T}}$
we also have
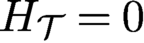 $ H_{\mathcal {T}} = 0$
, such that
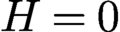 $H = 0$
and therefore
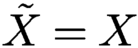 $\tilde {X} = X$
. □
The real challenge here is asserting that the conditions of Lemma 6.1 hold under reasonable conditions on the number of measurements. Careful strengthening of the injectivity property in Lemma 6.1 allows us to relax the properties of the dual certificate, as in the approach pioneered by Gross (Reference Gross2011) for matrix completion. This observation is at the core of the proof of Theorem 6.2 below. In a nutshell, the theorem states that under mild conditions PhaseLift can recover x exactly (up to a global phase factor) with high probability, provided that the number of measurements is of the order of
 $n \log n$
.
Theorem 6.2 (Candès, Strohmer and Voroninski Reference Candès, Strohmer and Voroninski2013b ).
Consider an arbitrary signal x in
 ${\mathbb {R}}^n$
or
 ${\mathbb {C}}^n$
. Let the measurement vectors
 $a_k$
be sampled independently and uniformly at random on the unit sphere, and suppose that the number of measurements obeys
 $N \ge c_0 \, n \log n$
, where
 $c_0$
is a sufficiently large constant. Then the solution to the trace minimization program is exact with high probability, in the sense that (6.3) has a unique solution obeying
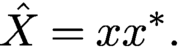 $$ \begin{align*} \hat X = x x^\ast. \end{align*} $$
This holds with probability at least
 $1 - 3\,{\mathrm {e}}^{-\gamma ({m}/{n})}$
, where
 $\gamma $
is a positive absolute constant.
Theorem 6.2 can be extended to noisy measurements (Candès et al. Reference Candès, Strohmer and Voroninski2013b
, Hand Reference Hand2017), demonstrating that PhaseLift is robust vis-à-vis noise. Candès and Li (Reference Candès and Li2014) further improved the condition
 $m ={{{O}}} ( n \log n)$
to
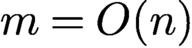 $m = {{{O}}} ( n)$
. As noted by Candès and Li (Reference Candès and Li2014) and Demanet and Hand (Reference Demanet and Hand2014), under the conditions of Lemma 6.1 the feasible set of (6.3) reduces to the single point
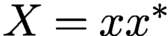 $X = xx^{\ast }$
. Thus, from a purely theoretical viewpoint, the trace minimization in (6.3) is actually not necessary, while from a numerical viewpoint, particularly in the case of noisy data, using the program (6.3) still seems beneficial.
We also note that the spectral initialization of Section 5.1 has a natural interpretation in the PhaseLift framework. Comparing equation (5.1) with the definition of
 ${\mathcal {A}}$
in (6.2), it is evident that the spectral initializer is simply given by the solution extracted from computing
 ${\mathcal {A}}^{\ast } y$
.
Although PhaseLift favours low-rank solutions, in the case of noisy data it is not guaranteed to find a rank-one solution. Therefore, if our optimal solution
 $\hat {X}$
does not have exactly rank one, we extract the rank-one approximation
 $\hat {x} \hat {x}^*$
where
 $\hat {x}$
is an eigenvector associated with the largest eigenvalue of
 $\hat {X}$
. In that case one can further improve the accuracy of the solution
 $\hat {x}$
by ‘debiasing’ it. We replace
 $\hat {x}$
with its rescaled version
 $s \hat {x}$
, where
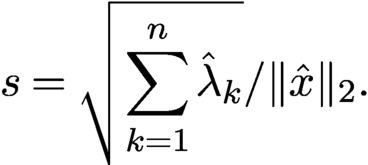 $$ \begin{align*} s = \sqrt{\sum_{k=1}^{n} \hat{\lambda}_k}/\|\hat{x}\|_2. \end{align*} $$
This corrects for the energy leakage occurring when
 $\hat {X}$
is not exactly a rank-one solution, which could cause the norm of
 $\hat {x}$
to be smaller than that of the actual solution. Other corrections are of course possible.
Remark 6.3. For the numerical solution of (6.3) it is not necessary to actually set up the matrix X explicitly. Indeed, this fact has already been described in detail by Candès et al. (Reference Candès, Eldar, Strohmer and Voroninski2013a ). Yet, the misconception that the full matrix X needs to be computed and stored can sometimes be found in the non-mathematical literature (Elser, Lan and Bendory Reference Elser, Lan and Bendory2018).
Theorem 6.2 serves as a benchmark result, but using Gaussian vectors as measurement vectors
 $a_k$
is not very realistic. For practical purposes, we prefer sets of measurement vectors that obey, for example, the coded diffraction structure illustrated in Figure 2.1. The extension of PhaseLift to these more realistic conditions was first shown by Candès et al. (Reference Candès, Li and Soltanolkotabi2015), who proved that a result similar to Theorem 6.2 also holds for Fourier-type measurements when
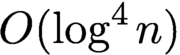 ${{{O}}} (\log ^4 n)$
different specifically designed random masks are employed. Thus, compared to Theorem 6.2, the total number of measurements increases to
 $N= {{{O}}} (n \log ^4 n)$
. This result was improved in Gross, Krahmer and Kueng (Reference Kueng, Rauhut and Terstiege2017), where the number of measurements was reduced to
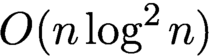 $ {{{O}}} (n \log ^2 n)$
. Since the coded diffraction approach is both mathematically appealing and relevant in practice, we will describe below, in more detail, a typical set-up that is also the basis of Candès et al. (Reference Candès, Li and Soltanolkotabi2015) and Gross et al. (Reference Gross, Krahmer and Kueng2017).
We assume that we collect the magnitudes of the discrete Fourier transform of a random modulation of the unknown signal x. Each such modulation pattern represents one mask and is modelled by a random diagonal matrix. Let
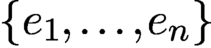 $\{e_1,\ldots , e_n\}$
denote the standard basis of
 ${\mathbb {C}}^n$
. We define the
 $\ell $
th (coded diffraction) mask via
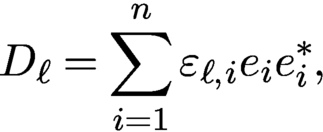 $$ \begin{align*} D_\ell = \sum_{i=1}^n {\varepsilon}_{\ell,i} e_i e_{i}^{\ast}, \end{align*} $$
where the
 ${\varepsilon }_{\ell ,i}$
are independent copies of a real-valued random variable
 ${\varepsilon }$
which obeys
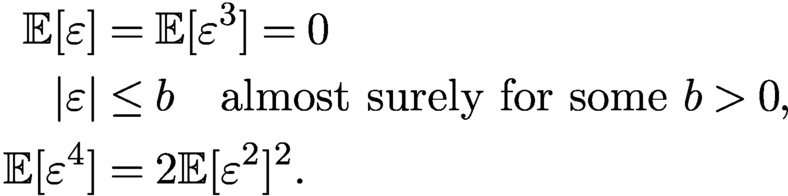 $$ \begin{align} \begin{aligned} {\mathbb{E}}[{\varepsilon}] & = {\mathbb{E}}[{\varepsilon}^3] = 0 \\ |{\varepsilon} | & \le b \quad \text{almost surely for some } b> 0, \\ {\mathbb{E}}[{\varepsilon}^4] & = 2 {\mathbb{E}}[{\varepsilon}^2]^2. \end{aligned} \end{align} $$
Denote
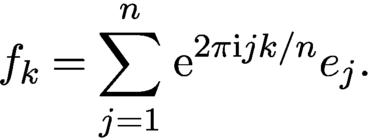 $$ \begin{align*} f_k = \sum_{j=1}^n \,{\mathrm{e}}^{2\pi {\mathrm{i}} jk/n} e_j. \end{align*} $$
Then the measurements captured via this coded diffraction approach can be written as
 $$ \begin{align} y_{k,\ell} = | \langle f_k, D_\ell x \rangle |^2, \quad k=1,\ldots,n, \ \ell=1,\ldots, L. \end{align} $$
As shown by Gross et al. (Reference Gross, Krahmer and Kueng2017), condition (6.4) ensures that the measurement ensemble forms a spherical 2-design, a concept proposed by Balan, Bodmann, Casazza and Edidin (Reference Balan, Bodmann, Casazza and Edidin2009) and Gross, Krahmer and Kueng (Reference Gross, Krahmer and Kueng2015) in connection with phase retrieval. As a particular choice in (6.4) we may select each modulation to correspond to a Rademacher vector with random erasures, that is,
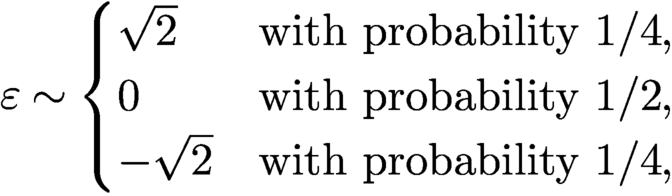 $$ \begin{align*} {\varepsilon} \sim \begin{cases} \sqrt{2} & \text{with probability } 1/4, \\ 0 & \text{with probability } 1/2, \\ -\sqrt{2} & \text{with probability } 1/4, \end{cases} \end{align*} $$
as suggested by Candès et al. (Reference Candès, Li and Soltanolkotabi2015).
In the case of such coded diffraction measurements, the following theorem, proved by Gross et al. (Reference Gross, Krahmer and Kueng2017), guarantees the success of PhaseLift with high probability (see also Candès, Li and Soltanolkotabi Reference Candès, Li and Soltanolkotabi2015).
Theorem 6.4. Let
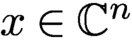 $x \in {\mathbb {C}}^n$
with
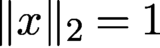 $\|x\|_2 = 1$
and let
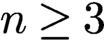 $n\ge 3$
be an odd number. Suppose that
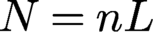 $N=nL$
Fourier measurements using L independent random diffraction patterns (as defined in (6.4) and (6.5)) are gathered. Then, with probability at least
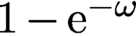 $1 - {\mathrm {e}}^{-\omega }$
, PhaseLift endowed with the additional constraint
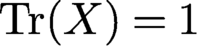 ${\operatorname {Tr}}(X) = 1$
recovers x up to a global phase, provided that
 $$ \begin{align*} L \ge C \omega \log^2 n. \end{align*} $$
Here,
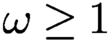 $\omega \ge 1$
is an arbitrary parameter and C is a dimension-independent constant that can be explicitly bounded.
While the original PhaseLift approach works for multi-dimensional signals, there exist specific constructions of masks for the special case of one-dimensional signals that provide further improvements. For instance, Pohl, Yang and Boche (Reference Pohl, Yang and Boche2015) derived a deterministic, carefully designed set of
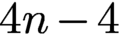 $4n - 4$
measurement vectors and proved that a semidefinite program will successfully recover generic signals from the associated measurements. They accomplished this by showing that the conditions of Lemma 6.1 hold on a dense subspace of
 ${\mathbb {C}}^n$
. Another approach that combines the PhaseLift idea with the construction of a few specially designed one-dimensional masks can be found in Jaganathan et al. (Reference Jaganathan, Eldar and Hassibi2015).
The PhaseCut method, proposed by Waldspurger, d’Aspremont and Mallat (Reference Waldspurger, d’Aspremont and Mallat2015), casts the phase retrieval problem as an equality constrained quadratic program and then uses the famous MaxCut relaxation for this type of problem. Interestingly, while the PhaseCut and PhaseLift relaxations are in general different, there is a striking equivalence between these two approaches; see Waldspurger et al. (Reference Waldspurger, d’Aspremont and Mallat2015).
Concerning the numerical solution of (6.3), there exists a wide array of fairly efficient numerical solvers; see e.g. Nesterov (Reference Nesterov2004), Toh, Todd and Tütüncü (Reference Toh, Todd and Tütüncü1999) and Monteiro (Reference Monteiro1997). The numerical algorithm to solve (6.3) in the example illustrated in Figure 6.2 was implemented in MATLAB using TFOCS (Becker, Candès and Grant Reference Becker, Candès and Grant2011). That implementation avoids setting up the matrix X explicitly and only keeps an
 $n\times r$
matrix with
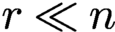 $r \ll n$
in memory. More custom-designed solvers have also been developed; see e.g. Huang, Gallivan and Zhang (Reference Zhang, Song and Dai2017).
6.2 Convex phase retrieval without lifting
Despite its mathematical elegance, a significant drawback of PhaseLift is that its computational complexity is too high (even when X is not set up explicitly) for large-scale problems. A different route to solving the phase retrieval problem via convex relaxation was pursued independently in Bahmani and Romberg (Reference Bahmani and Romberg2016) and Goldstein and Studer (Reference Goldstein and Studer2018). Starting from our usual set-up, assume we are given phaseless measurements
 $$ \begin{align} |\langle a_k, x\rangle |^2 = y_k, \quad k=1,\ldots,N. \end{align} $$
We relax each measurement to an inequality
 $$ \begin{align} |\langle a_k, x\rangle | \le \sqrt{y_k}=b_k, \quad k=1,\ldots,N. \end{align} $$
This creates a symmetric slab
 ${\cal S}_i$
of feasible solutions. Collectively, these slabs describe a ‘complex polytope’
 ${\cal K}$
of feasible solutions. The target signal x is one of the extreme points of
 ${\cal K}$
, as illustrated in Figure 6.1.
The ‘complex polytope’ of feasible solutions intersecting at
 ${x_{*}}=x_*$
. Here, the role of the anchor vector u is played by
 $a_0$
. Image courtesy of Bahmani and Romberg (Reference Bahmani and Romberg2016).
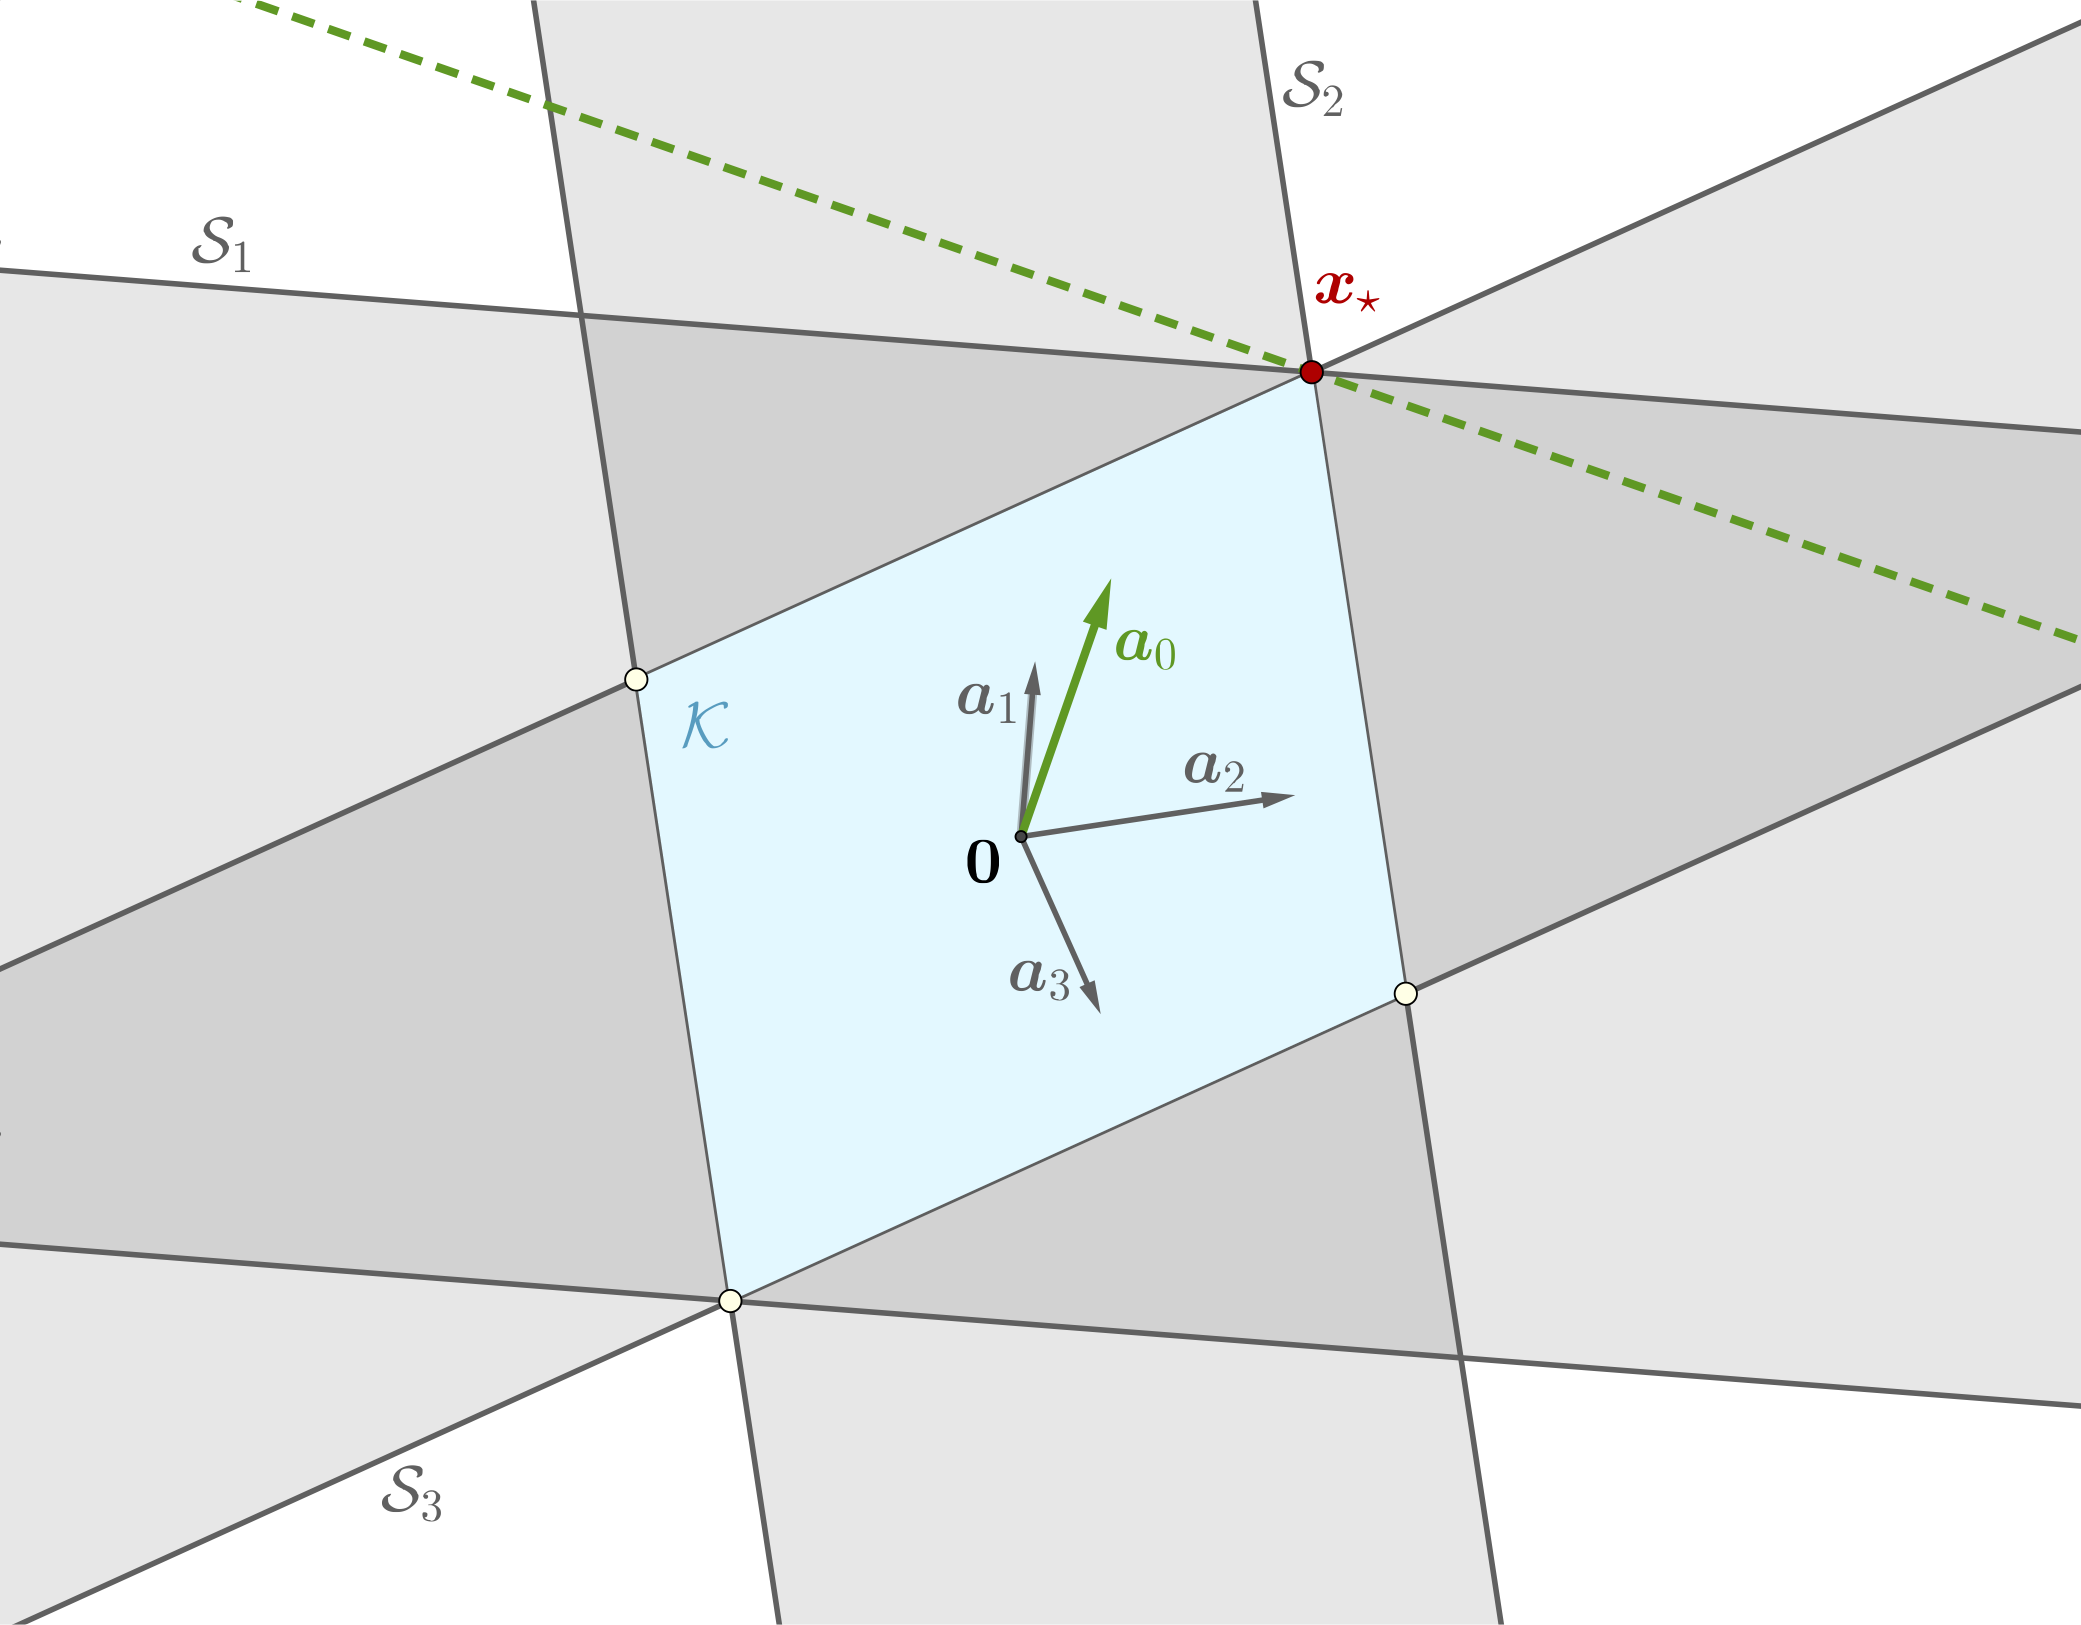
How do we distinguish the desired solution x from all the other extreme points of
 ${\cal K}$
? The idea proposed in Bahmani and Romberg (Reference Bahmani and Romberg2016) and Goldstein and Studer (Reference Goldstein and Studer2018) is to use a (non-zero) ‘anchor’ vector u that is sufficiently close to x. Following Bahmani and Romberg (Reference Bahmani and Romberg2016), from a geometrical viewpoint, the idea is to find a hyperplane tangent to
 ${\cal K}$
at x and the anchor vector u acts as the normal for the desired tangent hyperplane see Figure 6.1; u is required to have a non-vanishing correlation with x in the sense that
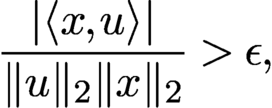 $$ \begin{align} {\displaystyle \frac{| \langle x,u \rangle |}{ \|u\|_2 \|x\|_2}}> \epsilon, \end{align} $$
for some
 $\epsilon>0$
. See also (5.8) related to the optimal initialization in Section 5.3. The idea of Bahmani and Romberg (Reference Bahmani and Romberg2016) and Goldstein and Studer (Reference Goldstein and Studer2018) is now to recover x by finding the vector that is most aligned with u and satisfies the relaxed measurement constraints in (6.7).
This approach can be expressed as the following convex problem, dubbed PhaseMax by Goldstein and Studer (Reference Goldstein and Studer2018):
 $$ \begin{align} \begin{aligned} &\max_{x}\qquad\qquad \langle x,u \rangle \\ &\text{subject to}\qquad b_k \le |\langle a_k, x\rangle |^2 +\xi_k, \quad k=1,\ldots,N. \end{aligned} \end{align} $$
It is remarkable that this convex relaxation of the phase retrieval problem does not involve lifting and operates in the original parameter space.
Choosing an appropriate anchor vector u is crucial, since u must be sufficiently close to x. Bahmani and Romberg (Reference Bahmani and Romberg2016) have shown that under the assumptions of Theorem 6.2, the condition (6.8) holds with probability at least
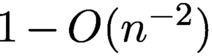 $1-{{{O}}} (n^{-2})$
. They then showed that the convex program in (6.9) can successfully recover the original signal from measurements of the form (6.6) under conditions similar to those in Theorem 6.2 (and under additional technical assumptions), and moreover that this recovery is robust in the presence of measurement noise. A slightly stronger result was proved by Hand and Voroninski (Reference Hand and Voroninski2016), who established the following result.
Theorem 6.5 (Hand and Voroninski Reference Hand and Voroninski2016).
Fix
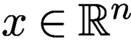 $x\in {\mathbb {R}}^n$
. Let
 $a_k$
be i.i.d.
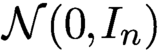 ${\cal N}(0,I_{n})$
for
 $k = 1,\ldots , N$
. Let
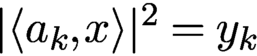 $|\langle a_k, x\rangle |^2 = y_k$
. Assume that
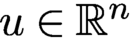 $u \in {\mathbb {R}}^n$
satisfies
 $\| u - x\|_2 \le 0.6 \|x\|_2$
. If
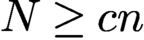 $N \ge cn$
, then with probability at least
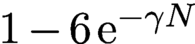 $1-6\,{\mathrm {e}}^{-\gamma N}$
, x is the unique solution of the linear program PhaseMax. Here,
 $\gamma $
and c are universal constants.
Using for instance the truncated spectral initialization proposed in Chen and Candès (Reference Chen and Candès2017), one can show that
 $\| u = x\|_2 \le 0.6 \|x\|_2$
holds with probability at least
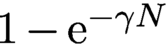 $1-{\mathrm {e}}^{-\gamma N}\!\!$
, provided that
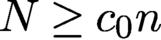 $N \ge c_0 n$
.
Dhifallah, Thrampoulidis and Lu (Reference Dhifallah, Thrampoulidis and Lu2017) showed that even better signal recovery guarantees can be achieved by iteratively applying PhaseMax. The resulting method is called PhaseLamp; the name derives from the fact that the algorithm is based on the idea of successive linearization and maximization over a polytope.
Denote the
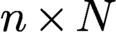 $n \times N$
matrix
 $A =[a_1,\ldots ,a_N]$
and the
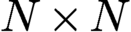 $N \times N$
diagonal matrix
 $B = {\operatorname {diag}} (b_1,\ldots ,b_N)$
. Then, as noticed by Goldstein and Studer (Reference Goldstein and Studer2018), the basis pursuit problem
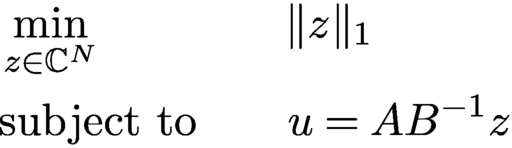 $$ \begin{align} \begin{aligned} &\min_{z \in {\mathbb{C}}^N}\qquad\qquad \|z\|_1 \\ &\text{subject to} \qquad u = A B^{-1}z \end{aligned} \end{align} $$
is dual to the convex program (6.9). Moreover, as pointed out by Goldstein and Studer (Reference Goldstein and Studer2018), as a consequence, if PhaseMax succeeds, then the phases of the solution vector z to (6.10) are exactly the phases that were lost in the measurement process in (6.6), that is,
 $$ \begin{align*} {\displaystyle \frac{z_k}{|z_k|}} b_k = \langle a_k, x\rangle, \quad k=1,\ldots,N. \end{align*} $$
These observations open up the possibility of using algorithms associated with basis pursuit for phase retrieval.
Yet another convex approach to phase retrieval has been proposed by Doelman, Thao and Verhaegen (Reference Doelman, Thao and Verhaegen2018). They proposed a sequence of convex relaxations, where the obtained convex problems are affine in the unknown signal
 ${x_{*}}$
. No lifting is required in this approach. However, no theoretical conditions are provided (in terms of number of measurements or otherwise) that would ensure that the computed solution actually coincides with the true solution
 ${x_{*}}$
.
To illustrate the efficacy of the approaches described in this section, we consider a stylized version of a set-up encountered in X-ray crystallography or diffraction imaging. The test image, shown in Figure 6.2(a) (magnitude), is a complex-valued imageFootnote
5
of size
 $256 \times 256$
, whose pixel values correspond to the complex transmission coefficients of a collection of gold balls at nanoscale embedded in a medium (data courtesy of Stefano Marchesini from Lawrence Berkeley National Laboratory).
Original image of gold balls (a) and reconstructions via PhaseLift (b), PhaseMax (c) and PhaseLamp (d), using three coded diffraction illuminations.
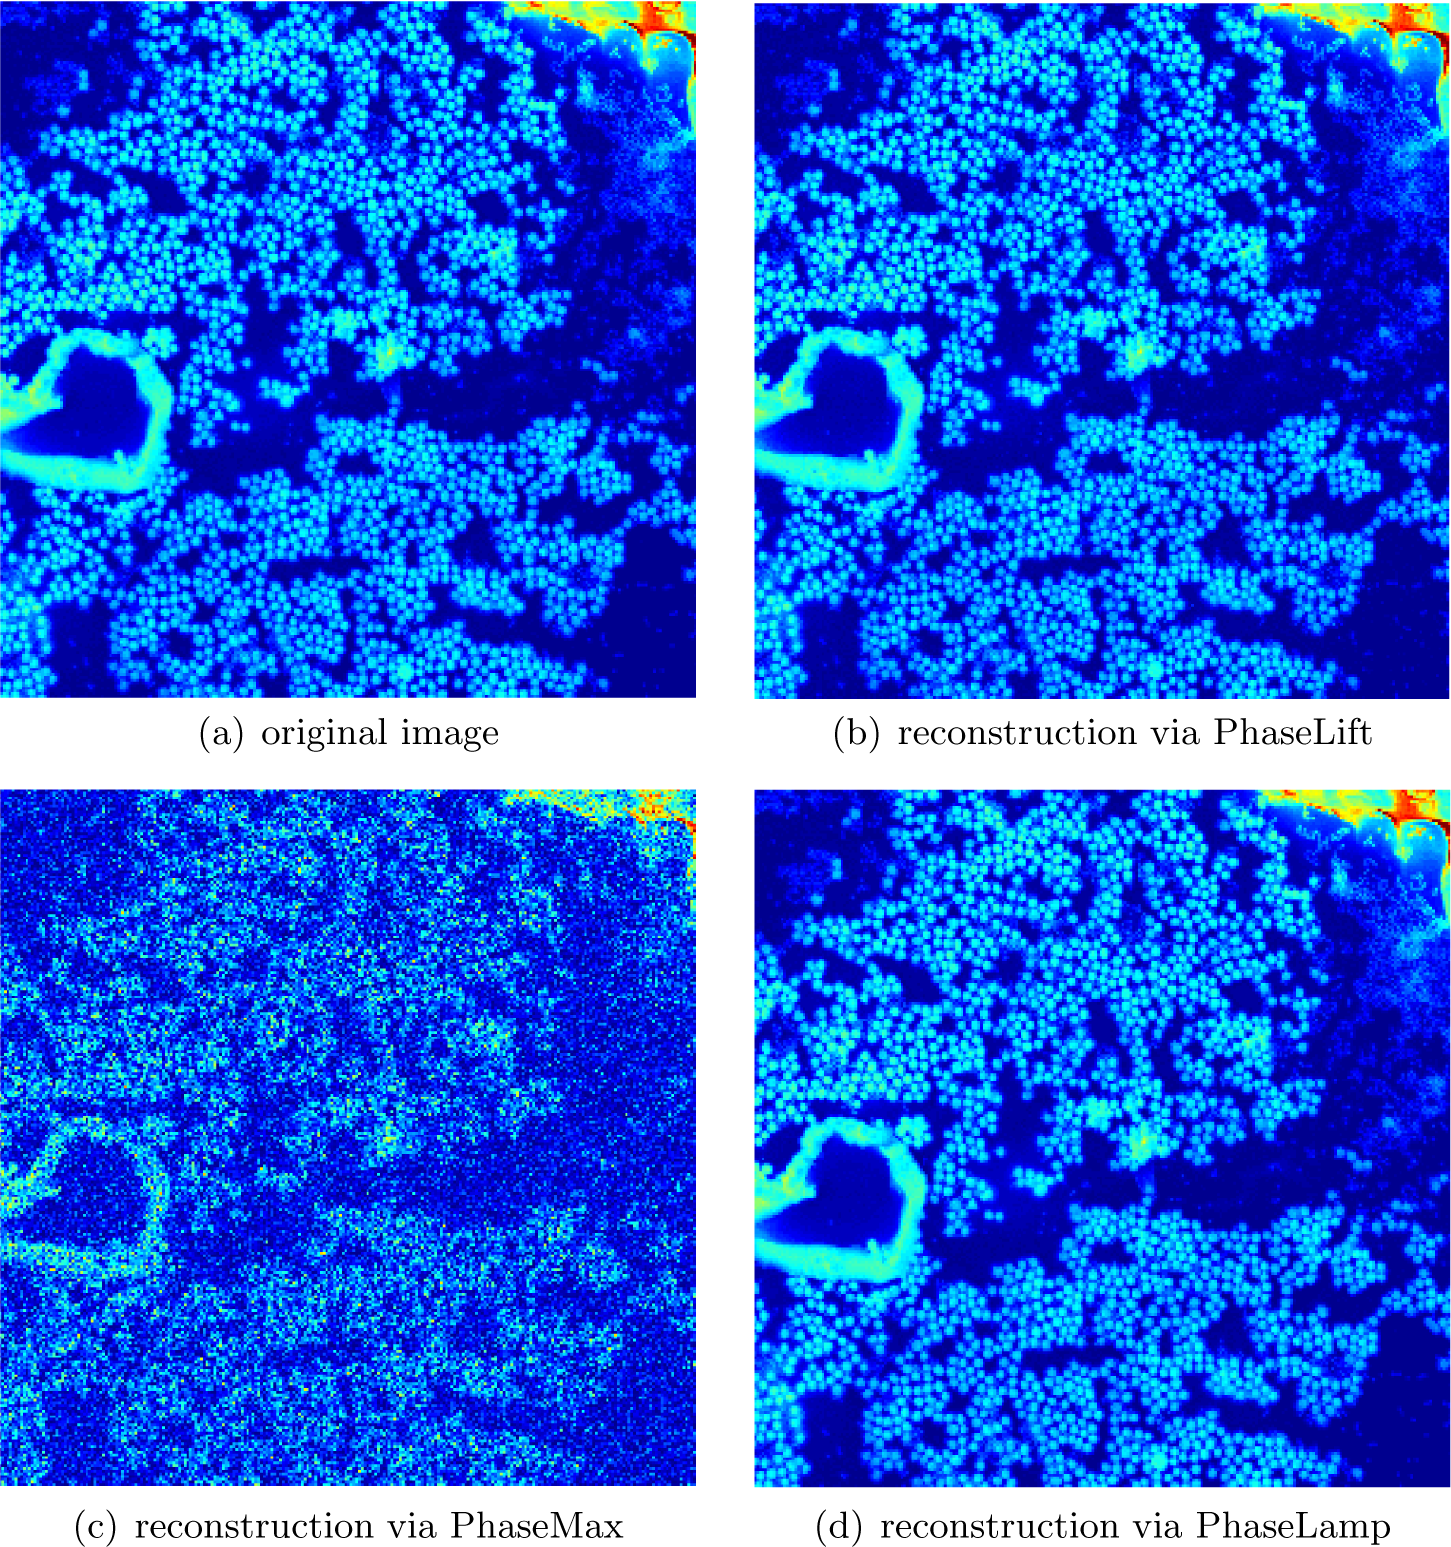
We demonstrate the recovery of the image shown in Figure 6.2(a) from noiseless measurements via PhaseLift, PhaseMax and PhaseLamp. We use three coded diffraction illuminations, where the entries of the diffraction matrices are either
 $+1$
or
 $-1$
with equal probability. We use the TFOCS based implementation of PhaseLift from Candès et al. (Reference Candès, Eldar, Strohmer and Voroninski2013a
) with reweighting. For PhaseMax and PhaseLamp we use the implementations provided by PhasePack (see Chandra et al. Reference Chandra, Zhong, Hontz, McCulloch, Studer and Goldstein2017) with the optimal spectral initializer and the default settings. The reconstructions by PhaseLift and PhaseLamp, shown in Figures 6.2(b) and 6.2(d), are visually indistinguishable from the original. The reconstruction computed by PhaseMax, depicted in Figure 6.2(c), is less accurate in this example.
Despite the ability of convex methods to recover signals from a small number of phaseless observations, these methods have not yet found practical use. While there exist fast implementations of PhaseLift, in terms of computational efficiency it cannot compete with the non-convex methods discussed in Section 4. The biggest impact PhaseLift has had on phase retrieval is that on the one hand it triggered a broad and systematic study of numerical algorithms for phase retrieval, and on the other hand it ignited a sophisticated design of initializations for non-convex solvers. Beyond phase retrieval, it ignited research in related areas, such as in bilinear compressive sensing (Ling and Strohmer Reference Ling and Strohmer2015), including blind deconvolution (Ahmed, Recht and Romberg Reference Ahmed, Recht and Romberg2013, Li, Lee and Bresler Reference Li, Lee and Bresler2016, Krahmer and Stöger Reference Krahmer and Stöger2019) and blind demixing (Ling and Strohmer Reference Ling and Strohmer2017). Moreover, the techniques behind PhaseLift and sparse recovery have influenced other areas directly related to phase retrieval, namely low-rank phase retrieval problems as they appear for instance in quantum tomography, as well as utilizing sparsity in phase retrieval. We will discuss these topics in Sections 6.3 and 6.4 below.
6.3 Low-rank phase retrieval problems
The phase retrieval problem has a natural generalization to recovering low-rank positive semidefinite matrices. Consider the problem of recovering an unknown
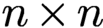 $n \times n$
rank-r matrix
 $ \succeq 0$
from linear functionals of the form
 $y_k = {\operatorname {Tr}}(A_k^{\ast } M)$
for
 $k=1,\ldots ,N$
, where A is Hermitian. By representing M in factorized form,
 $M = X X^{\ast }, X \in {\mathbb {C}}^{n\times r}$
, we can express this problem as the attempt to recover
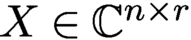 $ X \in {\mathbb {C}}^{n\times r}$
from the measurements
 $y_k = {\operatorname {Tr}}(A_k^{\ast } X X^{\ast })$
, which, in light of (6.1), is a natural generalization of the phase retrieval problem.
A particular instance of interest of this problem arises in quantum state tomography, where one tries to characterize the complete quantum state of a particle or particles through a series of measurements in different bases (Paris and Řeháček Reference Paris and Řeháček2004, Haah et al. Reference Haah, Harrow, Ji, Wu and Yu2017). More precisely, we are concerned with the task of reconstructing a finite-dimensional quantum mechanical system which is fully characterized by its density operator
 $\rho $
– an
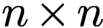 $n \times n$
positive semidefinite matrix with trace one. Estimating the density operator of an actual (finite-dimensional) quantum system is an important task in quantum physics known as quantum state tomography. We are often interested in performing tomography for quantum systems that have certain structural properties. One important structural property is purity. A pure quantum state of n ions can be described by its
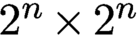 $2^n \times 2^n$
rank-one density matrix. A quantum state is almost pure if it is well approximated by a matrix of low rank r with
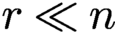 $r \ll n$
.
Assuming this structural property, quantum state tomography becomes a low-rank matrix recovery problem (Gross Reference Gross2011, Recht, Fazel and Parrilo Reference Recht, Fazel and Parrilo2010, Kueng, Rauhut and Terstiege Reference Kueng, Rauhut and Terstiege2017, Davenport and Romberg Reference Davenport and Romberg2016). It is obvious that we can recover a general quantum state
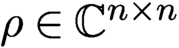 $\rho \in {\mathbb {C}}^{n\times n}$
from
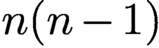 $n(n-1)$
properly chosen measurements. But if
 $\rho $
is low-rank, how many measurements are needed such that we can still recover
 $\rho $
in a numerically efficient manner? And what properties does measurement system have to satisfy? An additional requirement is the fact that the measurement process has to be ‘experimentally realizable’ and preferably in an efficient manner (Kueng et al. Reference Kueng, Rauhut and Terstiege2017). Moreover, in a real experiment, the measurements are noisy, and the true state is only approximately low-rank. Thus, any algorithm that aims to recover quantum states must be robust to these sources of error.
Many of the algorithms discussed in the previous sections can be extended with straightforward modifications to the generalized phase retrieval problem. For example, Kueng et al. (Reference Kueng, Rauhut and Terstiege2017) have shown that the PhaseLift results can be extended beyond the rank-one case: for Gaussian measurements the required number of measurements is
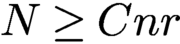 $N \ge C nr$
, which is analogous to the rank-one case.
Perhaps more interestingly, and similar in spirit to coded diffraction illuminations, there are certain structured measurement systems that are also realizable from an experimental viewpoint. For example, using the mathematically intriguing concept of Clifford orbits, one can reconstruct a rank-r quantum state exactly in the noiseless case and robustly in the presence of noise if the measurement matrices are chosen independently and uniformly at random from the Clifford orbit, assuming the number of measurements satisfies
 $N \ge C r n \log n$
; see Kueng, Zhu and Gross (Reference Kueng, Zhu and Gross2016). Here, the noise can include additive noise as well as ‘model noise’ due to the state being not exactly of rank r. Kueng et al. (Reference Kueng, Zhu and Gross2016) showed that a similar result holds if we replace the measurement system with approximate projective 4-designs (see Kueng, Rauhut and Terstiege Reference Kueng, Rauhut and Terstiege2017 for a precise definition). This line of research opens up beautiful connections to group theory, representation theory and time-frequency analysis.
We will demonstrate that the famous Zauner conjecture can be expressed as a low-rank phase retrieval problem. At the core of this conjecture is the problem of finding a family of
 $n^2$
unit-length vectors
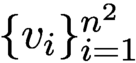 $\{v_i\}_{i=1}^{n^2}$
in
 ${\mathbb {C}}^n$
such that
 $$ \begin{align} |\langle v_i , v_i' \rangle |^2 = \frac{1}{n+1} \quad {\text{for all}}\ i\neq i' \end{align} $$
(see Zauner Reference Zauner1999). Such a family constitutes an equiangular tight frame of maximal cardinality (since no more than
 $n^2$
lines in
 ${\mathbb {C}}^n$
can be equiangular), also known as a Grassmannian frame (Strohmer and Heath Reference Strohmer and Heath2003). Equiangular tight frames play an important role in many applications, ranging from signal processing and communications to compressive sensing. In quantum physics (Appleby Reference Appleby2005) such a family of vectors is known as a symmetric informationally complete positive-operator-valued measure (SIC-POVM) (Scott and Grassl Reference Scott and Grassl2010).
Zauner conjectured that for each
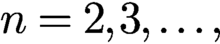 $n=2,3,\dots ,$
there exists a fiducial vector
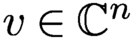 $v \in {\mathbb {C}}^n$
such that the Weyl–Heisenberg (or Gabor) frame
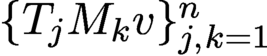 $\{T_j M_k v\}_{j,k=1}^n$
satisfies (6.11). Moreover, Zauner conjectured that this fiducial vector
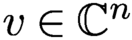 $v\in {\mathbb {C}}^n $
is an eigenvector of a certain order-3 Clifford unitary
 ${\cal U}_{n}$
. We refrain here from going into details about the Clifford group and refer instead to Zauner (Reference Zauner1999), Appleby (Reference Appleby2005) and Fuchs, Hoang and Stacey (Reference Fuchs, Hoang and Stacey2017). Putative fiducial vectors have been found (to machine precision) via computational techniques for every dimension n up to 151, and for a handful of higher dimensions (Fuchs et al. Reference Fuchs, Hoang and Stacey2017). We also know analytic solutions for a few values of n; see e.g. Appleby, Bengtsson, Flammia and Goyeneche (Reference Appleby, Bengtsson, Flammia and Goyeneche2019) and Fuchs et al. (Reference Fuchs, Hoang and Stacey2017).
Note that
 $$ \begin{align*} \langle T_j M_k x, T_{j'} M_{k'}x \rangle = {\mathrm{e}}^{-2\pi {\mathrm{i}} (j-j')k'} \langle T_{j-j'} M_{k-k'} x, x \rangle . \end{align*} $$
Hence, Zauner’s conjecture can be expressed as solving the problem
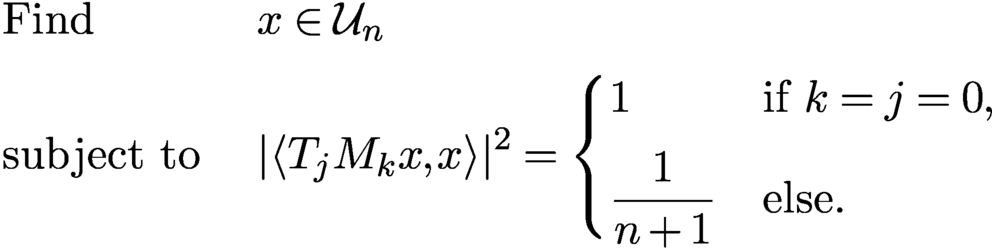 $$ \begin{align} \begin{aligned} & \text{Find} && x \in {\cal U}_{n} \\ & \text{subject to}\ && | \langle T_j M_k x, x \rangle |^2 = \begin{cases} 1 & \text{if } k=j=0, \\[5pt] {\displaystyle \frac{1}{n+1}} & \text{else.} \end{cases} \end{aligned} \end{align} $$
This is a phase retrieval problem. Unfortunately, the unknown vector x appears on both sides of the inner product. Hence, while the measurement set-up may seem similar to ptychography at first glance, the problem (6.12) is actually more challenging.
To arrive at the promised low-rank formulation, first note that the property
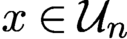 $x \in {\cal U}_{n}$
can be expressed as
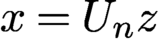 $x=U_n z$
, where
 $U_n$
is an
 $n \times d$
matrix and
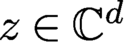 $z\in {\mathbb {C}}^d$
with
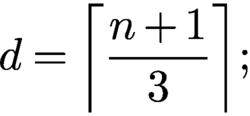 $$ \begin{align*} {d = \biggl\lceil \frac{n+1}{3} \biggr\rceil{;}} \end{align*} $$
see Scott and Grassl (Reference Scott and Grassl2010). Hence, for
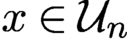 $x \in {\cal U}_{n}$
we obtain
 $$ \begin{align*} \langle T_j M_k x, x \rangle = \langle T_j M_k U_n z, U_n z \rangle = \langle V_{jk} , Z \rangle_{\text{HS}}, \end{align*} $$
where
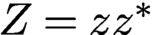 $Z=z z^{\ast }$
and
 $$ \begin{align*} V_{jk} = U_n^{\ast} T_j M_k U_n\quad\text{for } j,k=0,\dots,n-1. \end{align*} $$
Thus we arrive at our first low-rank phase retrieval version by rewriting (6.12) as
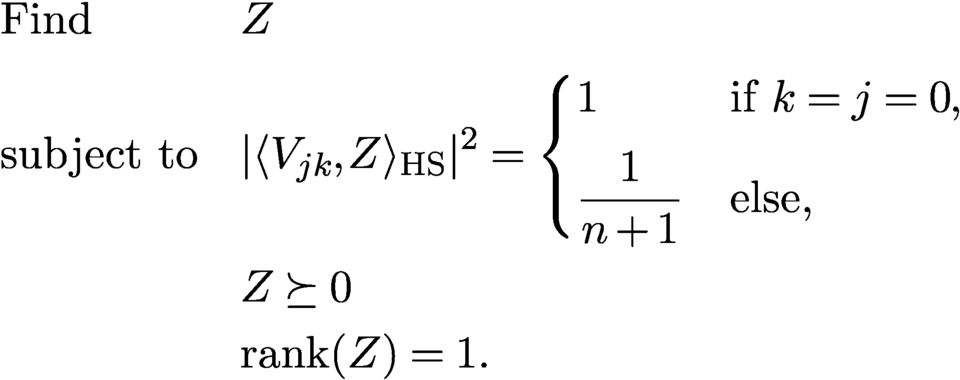 $$ \begin{align} \begin{aligned} &\text{Find} && Z \\ &\text{subject to} && | \langle V_{jk} , Z \rangle_{\text{HS}} |^2 = \begin{cases} 1 & \text{if } k=j=0, \\[5pt] {\displaystyle \frac{1}{n+1}} & \text{else,} \end{cases} \\ &&& Z \succeq 0\\ &&& {\operatorname{rank}}(Z) = 1. \end{aligned} \end{align} $$
In (6.13) we have
 $n^2$
quadratic equations with about
 $(n/3)^2$
unknowns. It is not difficult to devise a simple alternating projection algorithm with random initialization to solve (6.12) that works quite efficiently for
 $n <100$
. However, for larger n the algorithm seems to get stuck in local minima. Maybe methods from blind ptychography can guide us to solve (6.12) numerically for larger n.
We can lift the equations in (6.13) up using tensors to arrive at our second low-rank scenario. More precisely, defining the tensors
 ${\cal V}_{jk} = V_{jk} \otimes V_{jk}$
and the rank-one tensor
 ${\cal Z} = Z \otimes Z$
, we can express (6.12) as the problem
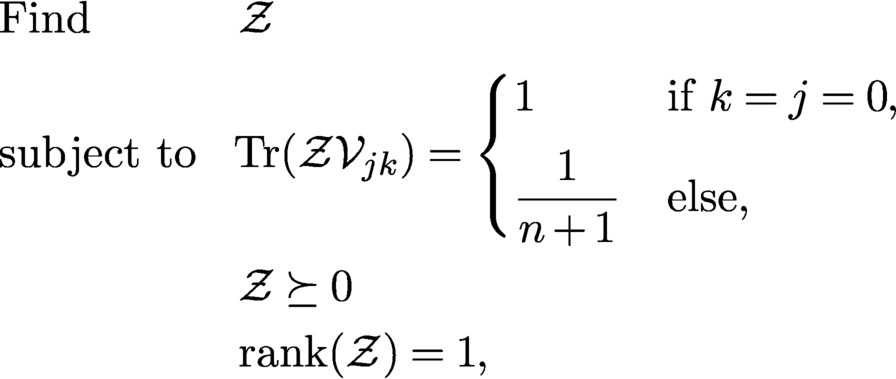 $$ \begin{align} \begin{aligned} &\text{Find} && {\cal Z}\\ &\text{subject to} && \!{\operatorname{Tr}}({\cal Z}{\cal V}_{jk}) = \begin{cases} 1 & \text{if } k=j=0, \\[5pt] {\displaystyle \frac{1}{n+1}} & \text{else,} \end{cases} \\ &&& {\cal Z} \succeq 0\\ &&& {\operatorname{rank}}({\cal Z}) = 1, \end{aligned} \end{align} $$
with an appropriate interpretation of trace, positive-definiteness, and rank for tensors. While the equations in (6.14) are now linear, this simplification comes at the cost of substantially increasing the number of unknowns to
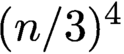 $(n/3)^4$
. Perhaps modifications of recent algorithms for low-rank tensor recovery (see e.g. Rauhut, Schneider and Stojanac Reference Rauhut, Schneider and Stojanac2017) can be utilized to solve (6.14).
6.4 Phase retrieval, sparsity and beyond
Support constraints have been popular in phase retrieval for a very long time as a means to make the problem well-posed or to make algorithms converge (faster) to the desired solution. When imposing a support constraint, we usually assume that we know (an upper bound of) the interval or region in which the object is non-zero. Such a constraint is easy to enforce numerically, and it has been discussed in detail in previous sections.
A more general form of support constraint is sparsity. In recent years the concept of sparsity has been recognized as an enormously useful assumption in all kinds of inverse problems. When a signal is sparse, this means that the signal has only relatively few non-zero coefficients in some (known) basis, but we do not know a priori the indices of these coefficients. For example, for the standard basis this would mean that we know the signal is sparsely supported but we do not know the locations of the non-zero entries. An illustrative example is depicted in Figure 7.2. The simplest setting is when the basis in which the signal is represented sparsely is known in advance. When such a basis or dictionary is not given a priori, it may have to be learned from the measurements themselves (Tillmann, Eldar and Mairal Reference Tillmann, Eldar and Mairal2016).
When we assume sparsity we are no longer dealing with a linear subspace condition, as is the case with ordinary support constraints, but with a non-linear subspace. Due to this fact, such a ‘non-linear’ sparsity constraint is much harder to enforce than the case when the support of the signal is known a priori.
Thanks to the theory of compressive sensing (Candès and Tao Reference Candès and Tao2006, Donoho Reference Donoho2006, Foucart and Rauhut Reference Foucart and Rauhut2013), we now have a thorough and quite broad theoretical and algorithmic understanding of how to exploit sparsity to reduce the number of measurements or to improve the quality of the reconstructed signal. We call a signal
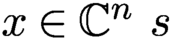 $x \in {\mathbb {C}}^n \ s$
-sparse if x has at most s non-zero entries, and write
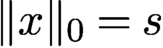 $\|x\|_0=s$
in this case. The theory of compressive sensing tells us in a nutshell that under appropriate conditions of the sensing matrix
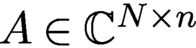 $A \in {\mathbb {C}}^{N\times n}$
, an s-sparse signal
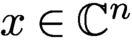 $x\in {\mathbb {C}}^n$
can be recovered from the linear measurements
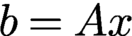 $b=Ax$
via linear programming (with high probability) if
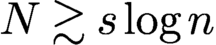 ; see Foucart and Rauhut (Reference Foucart and Rauhut2013) for precise versions and many variations.
Classical compressive sensing assumes a linear data acquisition mode, where measurements are of the form
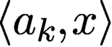 $\langle a_k, x\rangle $
. Obviously, this data acquisition mode does fit the phase retrieval problem. Nevertheless, the tools and insights we have gained from compressive sensing can be adapted to some extent to the setting of quadratic measurements, i.e. for phase retrieval.
The problem we want to address is as follows. Assume
 ${x_{*}}$
is a sparse signal. How can we utilize this prior knowledge effectively in the phase retrieval problem? For example, what are efficient ways to enforce sparsity in the numerical reconstruction? How much can we reduce the number of phaseless measurements and still successfully recover
 ${x_{*}}$
with theoretical guarantees, and do so in a numerically robust manner?
There exists a plethora of methods to incorporate sparsity in phase retrieval. This includes convex approaches (Ohlsson, Yang, Dong and Sastry Reference Ohlsson, Yang, Dong and Sastry2012, Li and Voroninski Reference Li and Voroninski2013), thresholding strategies (Wang et al. Reference Wang, Zhang, Giannakis, Akçakaya and Chen2017, Yuan, Wang and Wang Reference Yuan, Wang and Wang2019), greedy algorithms (Shechtman, Beck and Eldar Reference Shechtman, Beck and Eldar2014), algebraic methods (Beinert and Plonka Reference Beinert and Plonka2017) and tools from deep learning (Hand, Leong and Voroninski Reference Hand, Leong and Voroninski2018, Kim and Chung Reference Kim and Chung2019). In the following we briefly discuss a few selected techniques in more detail.
Following the paradigm of compressive sensing, it is natural to consider the following semidefinite program to recover a sparse signal
 ${x_{*}}$
from phaseless measurements. We denote
 $\|X\|_1: = \sum _{k,l} |X_{k,l}|$
, and similar to using the trace-norm of a matrix X as a convex surrogate of the rank of X, we use
 $\|X\|_1$
as a convex surrogate of
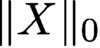 $\|X\|_0$
. Hence, we are led to the following semidefinite program (SDP) (Ohlsson et al. Reference Ohlsson, Yang, Dong and Sastry2012, Li and Voroninski Reference Li and Voroninski2013):
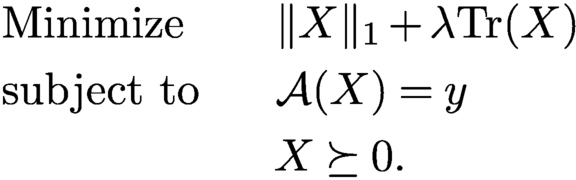 $$ \begin{align} \begin{aligned} &\text{Minimize}\qquad \|X\|_1 + \lambda {\operatorname{Tr}}(X)\\ &\text{subject to}\qquad\!\!\! {\mathcal{A}}(X) = y\\ &\qquad\qquad\qquad X \succeq 0. \end{aligned} \end{align} $$
Li and Voroninski (Reference Li and Voroninski2013) showed that for Gaussian measurement vectors,
 $N = {{{O}}} (s^2 \log n)$
measurements are sufficient to recover an s-sparse input from phaseless measurements using (6.15). Based on optimal sparse recovery results from compressive sensing using Gaussian matrices, one would hope that
 $N = {{{O}}} (s \log n)$
should suffice. However, Li and Voroninski (Reference Li and Voroninski2013) showed that the SDP in (6.15) cannot outperform this sub-optimal sample complexity by direct
 $\ell _1$
-penalization.
It is conceptually easy to enforce some sparsity of the signal to be reconstructed in the algorithms based on alternating projections or gradient descent, described in Section 4. One only needs to incorporate an additional greedy step or a thresholding step during each iteration. For example, for gradient descent we modify the update rule (4.18) to
 $$ \begin{align*} z_{j+1} = {\cal T}_{\tau} \biggl( z_j - {\displaystyle \frac{\mu_j}{\|z_0\|_2^2}} \nabla f(z_j) \biggr), \end{align*} $$
where
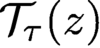 ${\cal T}_{\tau }(z)$
is a threshold operator that keeps the
 $\tau $
largest entries of z and sets the other entries of z to zero, or, alternatively,
 ${\cal T}_{\tau }$
might leave all values of z above a certain threshold (indicated by
 $\tau $
) unchanged and set all values of z below this threshold to zero. We can also replace the latter hard thresholding procedure with some soft thresholding rule. Here it is assumed that the signal is sparse in the standard basis, otherwise the thresholding procedure must be applied in a suitable basis that yields a sparse representation, such as a wavelet basis (at the cost of applying additional forward and inverse transforms).
While such modifications are easy to carry numerically, providing theoretical guarantees is significantly harder. For example, it has been shown that sparse Wirtinger flow (Yuan et al. Reference Yuan, Wang and Wang2019) and truncated amplitude flow (Wang et al. Reference Wang, Zhang, Giannakis, Akçakaya and Chen2017) succeed if the sampling complexity is at least
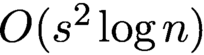 ${{{O}}} (s^2 \log n)$
. By applying a thresholded Wirtinger flow to a non-convex empirical risk minimization problem derived from the phase retrieval problem, Cai et al. (Reference Cai, Li and Ma2016) have established optimal convergence rates for noisy sparse phase retrieval under sub-exponential noise.
Two-stage approaches have been proposed as well, where in the first stage the support of the signal is identified and in the second stage the signal is recovered using the information from the first stage (Iwen, Viswanathan and Wang Reference Iwen, Viswanathan and Wang2017, Jaganathan, Oymak and Hassibi Reference Jaganathan, Oymak and Hassibi2017). For example, Jaganathan et al. (Reference Jaganathan, Oymak and Hassibi2017) propose such a two-stage scheme for the one-dimensional Fourier phase retrieval problem, consisting of (i) identifying the locations of the non-zero components of the signal using a combinatorial algorithm, and (ii) identifying the signal values in the support using a convex algorithm. This algorithm is shown experimentally to recover s-sparse signals from
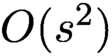 ${{{O}}} (s^2)$
measurements, but the theoretical guarantees require higher sample complexity.
Hand et al. (Reference Hand, Leong and Voroninski2018) propose an alternative approach to model signals with a small number of parameters, based on generative models. They suppose that the signal of interest is in the range of a deep generative neural network
 $G\colon {\mathbb {R}}^s \to {\mathbb {R}}^n$
, where the generative model is a d-layer, fully connected, feed-forward neural network with random weights. They introduce an empirical risk formulation and prove, assuming a range of technical conditions holds, that this optimization problem has favourable global geometry for gradient methods, as soon as the number of measurements satisfies
 $N = {{{O}}} (s d^2 \log n)$
.
Given the current intense interest in deep learning, it is not surprising that numerous other deep-learning-based methods for phase retrieval have been proposed; see e.g. Metzler, Schniter, Veeraraghavan and Baraniuk (Reference Metzler, Schniter, Veeraraghavan and Baraniuk2018), Rivenson et al. (Reference Rivenson, Zhang, Günaydın, Teng and Ozcan2018), Gladrow (Reference Gladrow2019) and Zhang et al. (Reference Zhang, Guan, Shen, Wang, Hu, Wang, He and Xie2018). Many of the deep-learning-based methods come with little theoretical foundation and are sometimes difficult to reproduce. Moreover, if one changes the input parameters just by a small amount, say, by switching to a slightly different image resolution, a complete retraining of the network is required. As with most deep learning applications, there is currently almost no theory about any kind of reconstruction guarantee, convergence rate, stability analysis and other basic questions one might pose to a numerical algorithm. On the other hand, there is anecdotal evidence that deep learning has tieve cohe potential to achnvincing results in phase retrieval.
Instead of designing an end-to-end deep-learning-based phase retrieval algorithm (and thereby ignoring the underlying physical model), a more promising direction seems to be to utilize all the information available to model the inverse problem and bring to bear the power of deep learning as a data-driven regularizer. Li, Schwab, Antholzer and Haltmeier (Reference Li, Schwab, Antholzer and Haltmeier2018) and Arridge, Maass, Öktem and Schönlieb (Reference Arridge, Maass, Öktem and Schönlieb2019) have advocated such an approach for general inverse problems. It will interesting to adapt these techniques to the setting of phase retrieval.
Schniter and Rangan (Reference Schniter, Rangan and Balan2015) proposed an approximate message passing (AMP) approach for phase retrieval of sparse signals. AMP-based methods were originally developed for compressed sensing problems of estimating sparse vectors from underdetermined linear measurements (Donoho, Maleki and Montanari Reference Donoho, Maleki and Montanari2010). They have now been extended to a wide range of estimation and learning problems including matrix completion, dictionary learning and phase retrieval. The first AMP algorithm designed for phase retrieval for sparse signals using techniques from compressive sensing can be found in Schniter and Rangan (Reference Schniter and Rangan2014). Various extensions and improvements have been developed (Drémeau and Krzakala Reference Drémeau and Krzakala2015, Metzler, Maleki and Baraniuk Reference Metzler, Maleki and Baraniuk2016, Metzler et al. Reference Metzler, Sharma, Nagesh, Baraniuk, Cossairt and Veeraraghavan2017).
As pointed out by Metzler et al. (Reference Metzler, Sharma, Nagesh, Baraniuk, Cossairt and Veeraraghavan2017), one downside is that AMP algorithms are heuristic algorithms and at best offer only asymptotic guarantees. In the case of the phase retrieval problem, most AMP algorithms offer no guarantees at all. Despite this shortcoming, they often perform well in practice, and a key appealing feature of AMP is its computational scalability. See Metzler et al. (Reference Metzler, Sharma, Nagesh, Baraniuk, Cossairt and Veeraraghavan2017) for a more detailed discussion of AMP algorithms for phase retrieval.
In another line of research, the randomized Kaczmarz method has been adapted to phase retrieval; see Wei (Reference Wei2015). Competitive theoretical convergence results can be found in Tan and Vershynin (Reference Tan and Vershynin2019) and Jeong and Güntürk (Reference Jeong and Güntürk2017), where it has been shown that the convergence is exponential and comparable to the linear setting (Strohmer and Vershynin Reference Strohmer and Vershynin2009).
7 Blind ptychography
An important development in ptychography since the work of Thibault et al. (Reference Thibault, Dierolf, Bunk, Menzel and Pfeiffer2009) is the potential of simultaneous recovery of the object and the illumination. This is referred to as blind ptychography. There are two ambiguities inherent to any blind ptychography.
The first is the affine phase ambiguity. Consider the mask and object estimates
 $$ \begin{align} \nu^{0}({\mathbf n}) & = \mu^{0}({\mathbf n}) \exp(-{\mathrm{i}} a -{\mathrm{i}} {\mathbf{w}}\cdot{\mathbf n}),\quad{\mathbf n}\in{\mathcal{M}}^{0} , \end{align} $$
 $$ \begin{align} {x}({\mathbf n}) & = {x_{*}}({\mathbf n}) \exp({\mathrm{i}} b+{\mathrm{i}} {\mathbf{w}}\cdot{\mathbf n}),\quad{\mathbf n}\in {\mathbb{Z}}^2_n, \end{align} $$
for any
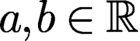 $a,b\in {\mathbb {R}}$
and
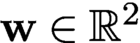 ${\mathbf {w}}\in {\mathbb {R}}^2$
. For any
 ${\mathbf t}$
, we have the calculation
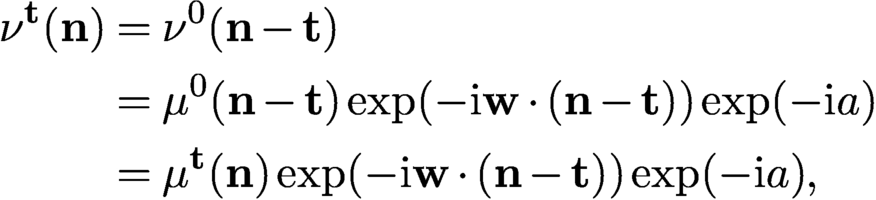 $$ \begin{align*} \nu^{\mathbf t}({\mathbf n})&= \nu^{0}({\mathbf n}-{\mathbf t})\\ &= \mu^{0}({\mathbf n}-{\mathbf t}) \exp(-{\mathrm{i}} {\mathbf{w}}\cdot({\mathbf n}-{\mathbf t}))\exp(-{\mathrm{i}} a)\\ &= \mu^{\mathbf t}({\mathbf n}) \exp(-{\mathrm{i}} {\mathbf{w}}\cdot({\mathbf n}-{\mathbf t}))\exp(-{\mathrm{i}} a), \end{align*} $$
and hence for all
 ${\mathbf n}\in {\mathcal {M}}^{\mathbf t}, {\mathbf t}\in {\mathcal {T}}$
 $$ \begin{align} \nu^{\mathbf t}({\mathbf n}) x^{\mathbf t}({\mathbf n}) = \mu^{\mathbf t}({\mathbf n})x_{*}^{\mathbf t}({\mathbf n}) \exp({\mathrm{i}}(b-a))\exp({\mathrm{i}} {\mathbf{w}}\cdot{\mathbf t}). \end{align} $$
Clearly (7.3) implies that g and
 $\nu ^{0}$
produce the same ptychographic data as f and
 $\mu ^{0}$
, since for each
 ${\mathbf t}$
,
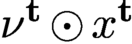 $\nu ^{\mathbf t}\odot x^{\mathbf t}$
is a constant phase factor times
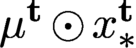 $\mu ^{\mathbf t}\odot x_{*}^{\mathbf t}$
where
 $\odot $
is the entry-wise (Hadamard) product. It is also clear that the above statement holds true regardless of the set
 ${\mathcal {T}}$
of shifts and the type of mask.
In addition to the affine phase ambiguity (7.1)–(7.2), a scaling factor (
 ${x}=c {x_{*}},\ \nu ^{0}=c^{-1} \mu ^{0},\ c>0$
) is inherent to any blind ptychography. Note that when the mask is exactly known (i.e.
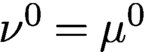 $\nu ^{0}=\mu ^{0}$
), neither ambiguity can occur.
7.0.1 Local rigidity
Motivated by (7.3), we seek sufficient conditions for results such as
 $$ \begin{align} \nu^{k}\odot x^k={\mathrm{e}}^{{\mathrm{i}}\theta_{k}}\mu^{k}\odot x_{*}^k,\quad k=0,\ldots,Q-1, \end{align} $$
for some constants
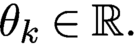 $\theta _k\in {\mathbb {R}}.$
We call (7.4) the property of local rigidity.
A main assumption needed here is the mask phase constraint (MPC):
The mask estimate
 $\nu ^0$
has the property
 ${\mbox {Re}\,}(\overline {{\nu }^0}\odot \mu ^0)>0$
at every pixel (where
 $\odot $
denotes the component-wise product and the bar denotes the complex conjugate).
Figure 7.1 illustrates MPC geometrically. Another ingredient in the measurement scheme is that at least for one block (say
 ${\mathcal {M}}^{\mathbf t}$
) the corresponding object part
 $f^{\mathbf t}$
has a tight support in
 ${\mathcal {M}}^{\mathbf t}$
, that is,
 $$ \begin{align*} \text{Box}[{\operatorname{supp}}(f^{\mathbf t})]={\mathcal{M}}^{\mathbf t} , \end{align*} $$
where
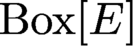 $\text{Box}[E]$
stands for the box hull, the smallest rectangle containing E with sides parallel to
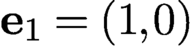 ${\mathbf {e}}_1=(1,0)$
or
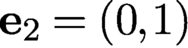 ${\mathbf {e}}_2=(0,1)$
. We call such an object part an anchor. Informally speaking, an object part
 $f^{\mathbf t}$
is an anchor if its support touches four sides of
 ${\mathcal {M}}^{\mathbf t}$
(Figure 7.2).
 $\nu ^0$
satisfies MPC if
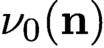 $\nu _0({\mathbf n})$
and
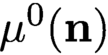 $\mu ^0({\mathbf n})$
form an acute angle for all
 ${\mathbf n}$
.
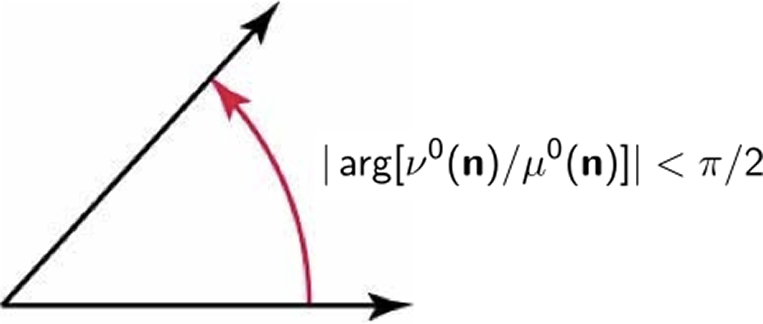
Sparse objects such as this image of maize grains, where the dark area represents zero pixel values, can be challenging for ptychographic measurements. The two red-framed blocks are not connected even though they overlap. The object part in the lower-right block is not an anchor since the object support does not touch the four sides of the block, whereas the object part in the upper-left block is an anchor. Indeed, the two grains at the lower-left and upper-right corners of the latter block suffice to create a tight support.
In the case
 ${\operatorname {supp}}(x)={\mathcal {M}}$
, every object part is an anchor. For an extremely sparse object such as that shown in Figure 7.2, the anchoring assumption can pose a challenge.
Both the anchoring assumption and MPC are nearly necessary conditions for local rigidity (7.4) to hold, as demonstrated by counterexamples constructed in Fannjiang and Chen (Reference Fannjiang and Chen2020).
Theorem 7.1 (Fannjiang and Chen Reference Fannjiang and Chen2020).
Suppose that
 $\{x_{*}^k\} $
has an anchor and is s-connected with respect to the ptychographic scheme.
Suppose that an object estimate
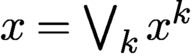 ${x}=\bigvee _k x^k$
, where
 $ x^k$
are defined on
 ${\mathcal {M}}^k$
, and a mask estimate
 $\nu ^0$
produce the same ptychographic data as
 ${x_{*}}$
and
 $\mu ^0$
. Suppose that the mask estimate
 $\nu ^0$
satisfies MPC. Then local rigidity (7.4) holds with probability exponentially (in s) close to 1.
7.0.2 Raster scan ambiguities
Before describing the global rigidity result, let us review the other ambiguities associated with the raster scan (2.7) other than the inherent ambiguities of the scaling factor and the affine phase ambiguity (7.1)–(7.2). These ambiguities include the arithmetically progressing phase factor inherited from the block phases and the raster grid pathology which has a
 $\tau $
-periodic structure of
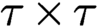 $\tau \times \tau $
degrees of freedom.
Let
 ${\mathcal {T}}'$
be any cyclic subgroup of
 ${\mathcal {T}}$
generated by
 ${\mathbf v}$
, that is,
 $$ \begin{align*} {\mathcal{T}}':=\{{\mathbf t}_j=j{\mathbf v}\colon j=0,\ldots,s-1\}, \end{align*} $$
of order s, i.e.
 $s{\mathbf v}=0\mod \, n$
. For ease of notation, let
 $\mu ^k$
,
 $x_{*}^k$
,
 ${\nu }^k$
,
 ${x}^k$
and
 $M^{k}$
denote the respective
 ${\mathbf t}_k$
-shifted quantities.
Theorem 7.2 (Fannjiang Reference Fannjiang2019).
Suppose that
 $$ \begin{align*} {\nu}^k\odot {x}^k={\mathrm{e}}^{{\mathrm{i}} \theta_k}\mu^k\odot x_{*}^k,\quad k=0,\ldots,s-1, \end{align*} $$
where
 $\mu ^k$
and
 ${\nu }^k$
vanish nowhere in
 ${\mathcal {M}}^k$
. If, for all
 $ k=0,\ldots ,s-1,$
 $$ \begin{align} {\mathcal{M}}^{k}\cap {\mathcal{M}}^{k+1}\cap {\operatorname{supp}}(x_{*}) \cap({\operatorname{supp}}({x_{*}})+ {{\mathbf v}})\neq \emptyset, \end{align} $$
then the sequence
 $\{\theta _0,\theta _1,\ldots ,\theta _{s-1}\}$
is an arithmetic progression where
 $\Delta \theta =\theta _k-\theta _{k-1}$
is an integer multiple of
 $2\pi /s$
.
For the full raster scan
 ${\mathcal {T}}$
, the block phases have the profile
 $$ \begin{align} \theta_{kl}=\theta_{00}+{\mathbf r}\cdot(k,l),\quad k,l=0,\ldots,q-1, \end{align} $$
for some
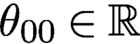 $\theta _{00}\in {\mathbb {R}}$
and
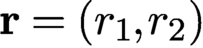 $ {\mathbf r}=(r_1,r_2)$
where
 $r_1$
and
 $r_2$
are integer multiples of
 $2\pi /q$
.
Note that if
 ${x_{*}}$
has a full support, i.e.
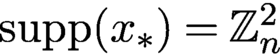 ${\operatorname {supp}}({x_{*}})={\mathbb {Z}}^2_n$
, then (7.5) holds for any step size
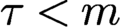 $\tau \lt m$
(i.e. positive overlap).
The next example shows an ambiguity resulting from the arithmetically progressing block phases (7.6) which make positive and negative imprints on the object and phase estimates, respectively.
Example 7.3. For
 $q=3, \tau =m/2$
, let
 $$ \begin{align*} {x_{*}} = \begin{bmatrix} f_{00}&f_{10}&f_{20}\\ f_{01}& f_{11} & f_{21} \\ f_{02} & f_{12} & f_{22} \end{bmatrix}\!,\quad {x} = \begin{bmatrix} f_{00} & {\mathrm{e}}^{{\mathrm{i}} 2\pi/3} f_{10} & {\mathrm{e}}^{{\mathrm{i}} 4\pi/3} f_{20} \\ {\mathrm{e}}^{{\mathrm{i}} 2\pi/3} f_{01} &{\mathrm{e}}^{{\mathrm{i}} 4\pi/3} f_{11} &f_{21} \\ {\mathrm{e}}^{{\mathrm{i}} 4\pi/3} f_{02} & f_{12}& {\mathrm{e}}^{{\mathrm{i}} 2\pi/3} f_{22} \end{bmatrix} \end{align*} $$
be the object and its reconstruction, respectively, where
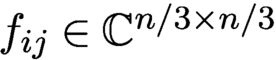 $f_{ij}\in {\mathbb {C}} ^{n/3\times n/3}$
. Let
 $$ \begin{align*} \mu^{kl}= \begin{bmatrix} \mu^{kl}_{00} & \mu^{kl}_{10} \\ \mu^{kl}_{01}&\mu^{kl}_{11} \end{bmatrix}\!, \quad {\nu}^{kl}= \begin{bmatrix} \mu^{kl}_{00} &{\mathrm{e}}^{-{\mathrm{i}} 2\pi/3} \mu^{kl}_{10} \\ {\mathrm{e}}^{-{\mathrm{i}} 2\pi/3} \mu^{kl}_{01}&{\mathrm{e}}^{-{\mathrm{i}} 4\pi/3} \mu^{kl}_{11} \end{bmatrix}\!, \end{align*} $$
for
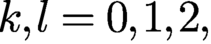 $ k,l=0,1,2,$
be the
 $(k,l)$
th shift of the mask and estimate, respectively, where
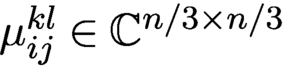 $\mu ^{kl}_{ij}\in {\mathbb {C}} ^{n/3\times n/3}$
.
Let
 $x_{*}^{ij}$
and
 ${x}^{ij}$
be the part of the object and estimate illuminated by
 $\mu ^{ij}$
and
 ${\nu }^{ij}$
, respectively. For example, we have
 $$ \begin{align*} x_{*}^{00}= \begin{bmatrix} f_{00}&f_{10}\\ f_{01}& f_{11} \end{bmatrix}\!,\quad x_{*}^{10}= \begin{bmatrix} f_{10}&f_{20}\\ f_{11} & f_{21} \end{bmatrix}\!,\quad x_{*}^{20}= \begin{bmatrix} f_{20}&f_{00}\\ f_{21}& f_{01} \end{bmatrix}\!, \end{align*} $$
and likewise for other
 $x_{*}^{ij}$
and
 ${x}^{ij}$
. It is easily seen that
 $$ \begin{align*} {\nu}^{ij}\odot {x}^{ij}={\mathrm{e}}^{{\mathrm{i}} (i+j)2\pi/3} \mu^{ij}\odot x_{*}^{ij}. \end{align*} $$
Example 7.3 illustrates the non-periodic ambiguity inherited from the affine block phase profile. The non-periodic arithmetically progressing ambiguity is different from the affine phase ambiguity (7.1)–(7.2) as they manifest on different scales: the former is constant in each
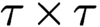 $\tau \times \tau $
block (indexed by
 $k,l$
) while the latter varies from pixel to pixel.
The next example illustrates the periodic artifact called raster grid pathology.
Example 7.4. For
 $q=3, \tau =m/2$
and any
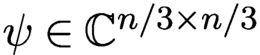 $\psi \in {\mathbb {C}} ^{{n}/{3}\times {n}/{3}}$
, let
 $$ \begin{align} {x_{*}} = \begin{bmatrix} f_{00}&f_{10}&f_{20}\\ f_{01}& f_{11} & f_{21} \\ f_{02} & f_{12} & f_{22} \end{bmatrix}\!, \quad {x} = \begin{bmatrix} {\mathrm{e}}^{-{\mathrm{i}} \psi}\odot f_{00} & {\mathrm{e}}^{-{\mathrm{i}} \psi} \odot f_{10} & {\mathrm{e}}^{-{\mathrm{i}} \psi} \odot f_{20} \\ {\mathrm{e}}^{-{\mathrm{i}} \psi}\odot f_{01} &{\mathrm{e}}^{-{\mathrm{i}}\psi} \odot f_{11} & {\mathrm{e}}^{-{\mathrm{i}}\psi}\odot f_{21} \\ {\mathrm{e}}^{-{\mathrm{i}} \psi}\odot f_{02} & {\mathrm{e}}^{-{\mathrm{i}}\psi}\odot f_{12}& {\mathrm{e}}^{-{\mathrm{i}} \psi} \odot f_{22} \end{bmatrix} \end{align} $$
be the object and its reconstruction, respectively, where
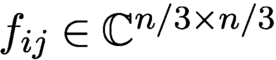 $f_{ij}\in {\mathbb {C}} ^{n/3\times n/3}$
. Let
 $$ \begin{align} \mu^{kl}= \begin{bmatrix} \mu^{kl}_{00} & \mu^{kl}_{10} \\[3pt] \mu^{kl}_{01}&\mu^{kl}_{11} \end{bmatrix}\!, \quad {\nu}^{kl}= \begin{bmatrix} {\mathrm{e}}^{{\mathrm{i}}\psi}\odot \mu^{kl}_{00} &{\mathrm{e}}^{{\mathrm{i}} \psi} \odot \mu^{kl}_{10} \\[3pt] {\mathrm{e}}^{{\mathrm{i}} \psi}\odot \mu^{kl}_{01}&{\mathrm{e}}^{{\mathrm{i}} \psi} \odot \mu^{kl}_{11} \end{bmatrix}\!, \end{align} $$
for
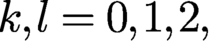 $ k,l=0,1,2,$
be the
 $(k,l)$
th shift of the mask and estimate, respectively, where
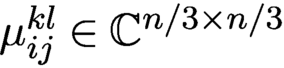 $\mu ^{kl}_{ij}\in {\mathbb {C}} ^{n/3\times n/3}$
.
Let
 $x_{*}^{ij}$
and
 ${x}^{ij}$
be the part of the object and estimate illuminated by
 $\mu ^{ij}$
and
 ${\nu }^{ij}$
, respectively (as in Example 7.3). It is verified easily that
 ${\nu }^{ij}\odot {x}^{ij}= \mu ^{ij}\odot x_{*}^{ij}.$
Since
 $\psi $
in Example 7.4 is any complex
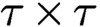 $\tau \times \tau $
matrix, (7.7) and (7.8) represent the maximum degrees of ambiguity over the respective initial sub-blocks. This ambiguity is transmitted to other sub-blocks, forming periodic artifacts called the raster grid pathology.
For a complete analysis of ambiguities associated with raster scan, we refer the reader to Fannjiang (Reference Fannjiang2019).
7.0.3 Global rigidity
In view of Theorem 7.1, we make simple observations and transform (7.4) into the ambiguity equation that will be key to subsequent development.
Let
 $$ \begin{align*} \alpha({\mathbf n})\exp[{\mathrm{i}} \phi({\mathbf n})]={\nu}^0({\mathbf n})/\mu^0({\mathbf n}), \quad \alpha({\mathbf n})>0\quad {\text{for all}}\ {\mathbf n} \in {\mathcal{M}}^0 \end{align*} $$
and
 $$ \begin{align*} h({\mathbf n}) \equiv \ln {x}({\mathbf n})-\ln {x_{*}}({\mathbf n})\quad{\text{for all}}\ {\mathbf n}\in {\mathcal{M}}, \end{align*} $$
where
 ${x_{*}}$
and
 ${x}$
are assumed to be non-vanishing.
Suppose that
 $$ \begin{align*} {\nu}^{k}\odot {x}^k={\mathrm{e}}^{{\mathrm{i}}\theta_{k}}\mu^{k}\odot x_{*}^k\quad {\text{for all}}\ k, \end{align*} $$
where
 $\theta _k$
are constants. Then
 $$ \begin{align} h({\mathbf n}+{\mathbf t}_{k}) ={\mathrm{i}} \theta_{k}-\ln\alpha({\mathbf n})-{\mathrm{i}} \phi({\mathbf n}) \mod {\mathrm{i}} 2\pi\quad{\text{for all}}\ {\mathbf n}\in {\mathcal{M}}^0,\end{align} $$
and for all
 ${\mathbf n}\in {\mathcal {M}}^{k} \cap {\mathcal {M}}^{l}$
 $$ \begin{align*} \alpha({\mathbf n}-{\mathbf t}_l)&= \alpha({\mathbf n}-{\mathbf t}_k)\\ \theta_k- \phi({\mathbf n}-{\mathbf t}_k)&= \theta_l- \phi({\mathbf n}-{\mathbf t}_l) \mod 2\pi. \end{align*} $$
The ambiguity equation (7.9) is a manifestation of local uniqueness (7.4) and has the immediate consequence
 $$ \begin{align} h({\mathbf n}+{\mathbf t}_{k})-h({\mathbf n}+{\mathbf t}_{l})={\mathrm{i}} \theta_{k}-{\mathrm{i}}\theta_{l} \mod {\mathrm{i}}2\pi\quad \text{for all } {\mathbf n}\in {\mathcal{M}}^{0} \text{ and } k,l \end{align} $$
or equivalently
 $$ \begin{align} h({\mathbf n}+{\mathbf t}_{k}-{\mathbf t}_{l})-h({\mathbf n})={\mathrm{i}} \theta_{k}-{\mathrm{i}}\theta_{l} \mod {\mathrm{i}}2\pi\quad {\text{for all}}\ {\mathbf n}\in {\mathcal{M}}^{l} \end{align} $$
by shifting the argument in h.
We refer to (7.10) or (7.11) as the phase drift equation, which determines the ambiguity (represented by h) at different locations connected by ptychographic shifts.
We seek sufficient conditions for guaranteeing the following global rigidity properties:
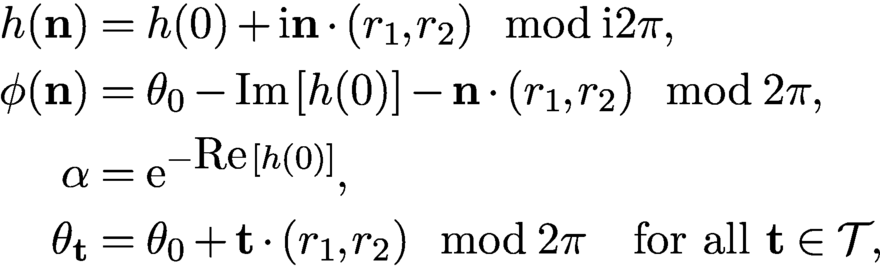 $$ \begin{align*} h({\mathbf n})&= h(0)+{\mathrm{i}} {\mathbf n}\cdot (r_1,r_2)\mod {\mathrm{i}} 2\pi, \\ \phi({\mathbf n})&= \theta_0-{\mbox{Im}\,}[h(0)]-{\mathbf n}\cdot(r_1,r_2) \mod 2\pi , \\ \alpha&= {\mathrm{e}}^{-{\mbox{Re}\,}[h(0)]} ,\\ \theta_{\mathbf t}&= \theta_0 +{\mathbf t}\cdot(r_1,r_2)\mod 2\pi\quad{\text{for all}}\ {\mathbf t}\in {\mathcal{T}}, \end{align*} $$
for some
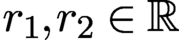 $ r_1, r_2\in {\mathbb {R}}$
and all
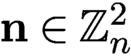 ${\mathbf n}\in {\mathbb {Z}}_n^2$
.
Fannjiang and Chen (Reference Fannjiang and Chen2020) introduce a class of ptychographically complete schemes. A ptychographic scheme is complete if global rigidity holds under the minimum prior constraint MPC defined in Figure 7.1. A simple example of ptychographically complete schemes is the perturbed scan (Figure 7.3(b))
 $$ \begin{align} {\mathbf t}_{kl}=\tau (k,l)+(\delta^1_{kl},\delta^2_{kl}),\quad k,l=0,\ldots,q-1, \end{align} $$
where
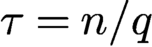 $\tau =n/q$
needs to be only slightly greater than
 $m/2$
(i.e. overlap ratio slightly greater than
 $50\%$
) and
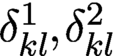 $ \delta ^1_{kl}, \delta ^2_{kl}$
are small integers with some generic non-degeneracy conditions (Fannjiang and Chen Reference Fannjiang and Zhang2020). In particular, if we set
 $$ \begin{align} \delta^1_{kl}=\delta^1_k, \quad \delta^2_{kl}=\delta^2_l\quad{\text{for all}}\ k,l=0,\ldots, q-1, \end{align} $$
then we obtain the scan pattern shown in Figure 7.3(a).
7.0.4 Minimum overlap ratio
In this subsection we show that
 $50\%$
overlap is roughly the minimum overlap ratio required by uniqueness among the perturbed raster scans defined by (7.12)–(7.13).
Perturbed raster scan patterns.
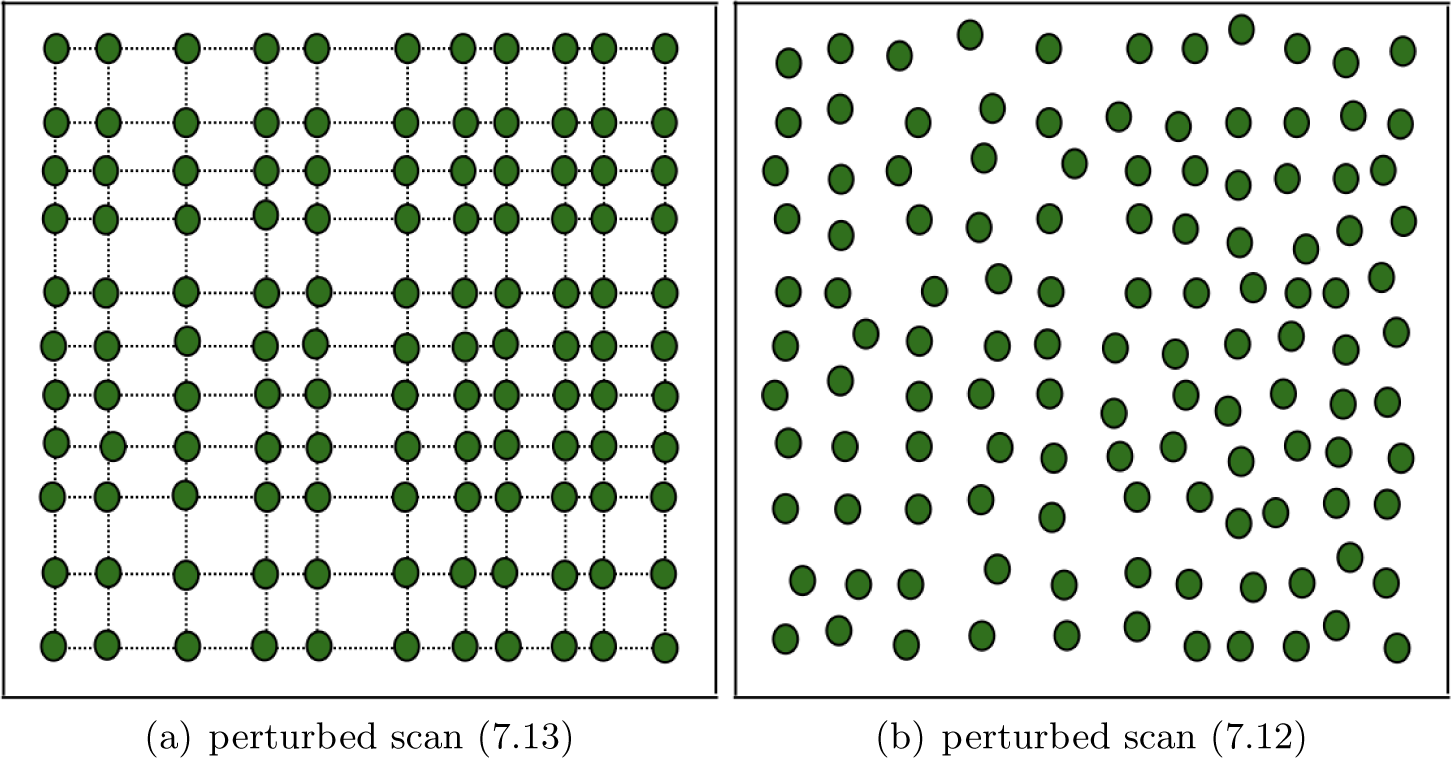
Let us consider the perturbed scheme (7.13) with
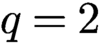 $q=2$
and
 $$ \begin{align*} {\mathbf t}_{kl}=(\tau_k,\tau_l),\quad k,l=0,1,2, \end{align*} $$
where
 $\tau _0=0, \tau _2=n$
and
 $$ \begin{align} {3m/2} \lt n \lt m+\tau_1. \end{align} $$
The condition (7.14) is to ensure that the overlap ratio (
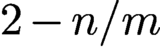 $2-n/m$
) between two adjacent blocks is less than (but can be made arbitrarily close to)
 $50\%$
. To avoid the raster scan (which has many undesirable ambiguities (Fannjiang Reference Fannjiang2019)), we assume that
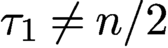 $\tau _1\neq n/2$
and hence
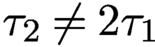 $\tau _2\neq 2\tau _1$
. Note that the periodic boundary condition implies that
 ${\mathcal {M}}^{00}={\mathcal {M}}^{20}={\mathcal {M}}^{02}={\mathcal {M}}^{22}$
. Figure 7.4 illustrates the relative positions of
 ${\mathcal {M}}^{00}$
and
 ${\mathcal {M}}^{10}$
.
Perturbed scan with
 $q=2$
. The arcs indicate the extent of the two blocks
 ${\mathcal {M}}^{00}$
and
 ${\mathcal {M}}^{10}$
. The dotted lines mark the mid-lines of the two blocks. The grey area represents the object, with the light grey areas being
 $R_{00}$
and
 $R_{10}$
and the dark grey areas being the overlap of the two blocks. The white area inside
 ${\mathcal {M}}^{10}$
folds into the other end inside
 ${\mathcal {M}}^{00}$
by the periodic boundary condition.
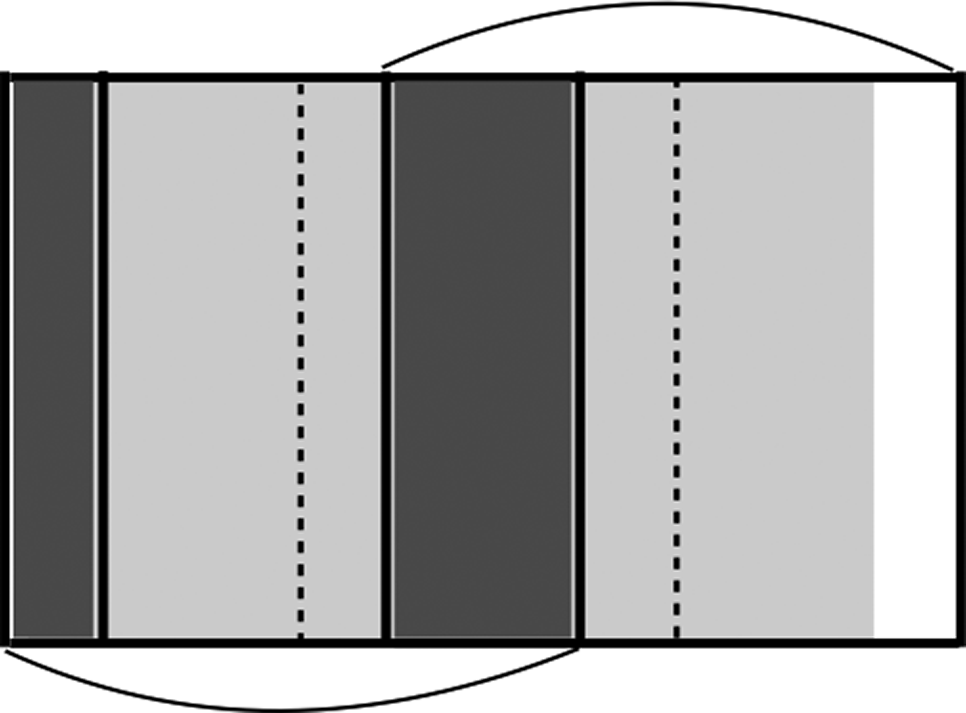
First let us focus on the horizontal shifts
 $\{{\mathbf t}_{k0}\colon k=0,1,2\}$
. As shown in Figure 7.4, two subsets of
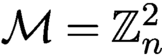 ${\mathcal {M}}={\mathbb {Z}}^2_n$
,

are covered only once by
 ${\mathcal {M}}^{00}$
and
 ${\mathcal {M}}^{10}$
respectively, due to (7.14).
Now consider the intersections

which correspond to the same region of the mask in
 ${\mathcal {M}}^{10}$
and
 ${\mathcal {M}}^{00}$
respectively, and let
 $h_1$
be any function defined on
 ${\mathcal {M}}$
such that
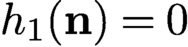 $h_1({\mathbf n})=0$
for any
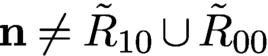 ${\mathbf n}\neq \tilde R_{10}\cup \tilde R_{00}$
and
 $h_1({\mathbf n}+{\mathbf t}_{10})=h_1({\mathbf n})$
for any
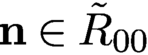 ${\mathbf n}\in \tilde R_{00}$
.
Consider the object estimate
 $ x({\mathbf n})= {\mathrm {e}}^{h_1({\mathbf n})}{x_{*}}({\mathbf n})$
and the mask estimate
 $\nu ^{k0}({\mathbf n}):={\mathrm {e}}^{-h_1({\mathbf n})}\mu ^{k0}({\mathbf n}) $
, which is well-defined because
 $\tilde R_{10}={\mathbf t}_{10}+\tilde R_{00}$
, and both correspond to the same region of the mask.
By the same token, we can construct a similar ambiguity function
 $h_2$
for the vertical shifts. With both horizontal and vertical shifts, we define the ambiguity function
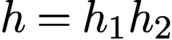 $h=h_1h_2$
and the associated pair of mask–object estimates
 $ \nu ^{kl}({\mathbf n}):={\mathrm {e}}^{-h({\mathbf n})}\mu ^{kl}({\mathbf n}) $
and
 $ x({\mathbf n})= {\mathrm {e}}^{h({\mathbf n})}{x_{*}}({\mathbf n}).$
Clearly the mask–object pair
 $(\nu ,x)$
produces the same set of diffraction patterns as
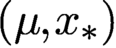 $(\mu , {x_{*}})$
. Therefore this ptychographic scheme has at least
 $(2\tau _1- m)^2$
or
 $(2n-2\tau _1-m)^2$
degrees of ambiguity dimension depending on whether
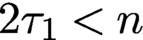 $2\tau _1\lt n$
or
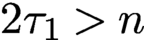 $2\tau _1>n$
.
7.1 Algorithms for blind ptychography
Let
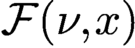 ${\mathcal F}(\nu ,x)$
be the bilinear transformation representing the totality of the Fourier (magnitude and phase) data for any mask
 $\nu $
and object x. From
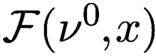 ${\mathcal F}(\nu ^0,x)$
we can define two measurement matrices. First, for a given
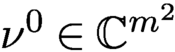 $\nu ^0\in {\mathbb {C}} ^{m^2}$
, let
 $A_{\nu }$
be defined via the relation
 $A_{\nu } x:={\mathcal F}(\nu ^0,x)$
for all
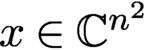 $x\in {\mathbb {C}} ^{n^2}$
. Second, for a given
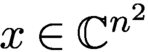 $x\in {\mathbb {C}} ^{n^2}$
, let
 $B_{x}$
be defined via
 $B_{x} {\nu }={\mathcal F}(\nu ^0,x)$
for all
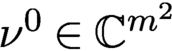 $\nu ^0\in {\mathbb {C}} ^{m^2}$
.
More specifically, let
 $\Phi $
denote the oversampled Fourier matrix. The measurement matrix
 $A_{\nu }$
is a concatenation of
 $\{\Phi \,{\operatorname {diag}}(\nu ^{\mathbf t})\colon {\mathbf t} \in {\mathcal {T}}\}$
(Figure 2.4(a)). Likewise,
 $B_{x}$
is
 $\{\Phi \,{\operatorname {diag}}(x^{\mathbf t})\colon {\mathbf t} \in {\mathcal {T}}\}$
stacked on top of each other (Figure 2.4(b)). Since
 $\Phi $
has orthogonal columns, both
 $A_{\nu }$
and
 $B_{x}$
have orthogonal columns. We simplify the notation by setting
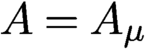 $A=A_\mu $
and
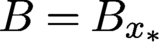 $B=B_{{x_{*}}}$
.
Let
 ${\nu }^{0}$
and
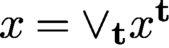 ${x}=\vee _{\mathbf t} x^{\mathbf t}$
be any pair of the mask and object estimates producing the same ptychography data as
 $\mu ^{0}$
and
 ${x_{*}}$
, that is, the diffraction pattern of
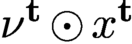 ${\nu }^{\mathbf t}\odot x^{\mathbf t}$
is identical to that of
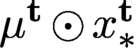 $\mu ^{\mathbf t}\odot x_{*}^{\mathbf t}$
, where
 ${\nu }^{\mathbf t}$
is the
 ${\mathbf t}$
-shift of
 ${\nu }^{0}$
and
 $ x^{\mathbf t}$
is the restriction of
 ${x}$
to
 ${\mathcal {M}}^{\mathbf t}$
. We refer to the pair
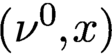 $({\nu }^0,{x})$
as a blind-ptychographic solution and
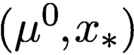 $(\mu ^0,{x_{*}})$
as the true solution (in the mask–object domain).
We can write the total measurement data as
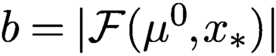 $b=|{\mathcal F}(\mu ^0,{x_{*}})|$
, where
 ${\mathcal F}$
is the concatenated oversampled Fourier transform acting on
 $\{\mu ^{\mathbf t}\odot x_{*}^{\mathbf t}\colon {\mathbf t} \in {\mathcal {T}}\}$
(see Figure 2.4), i.e. a bilinear transformation in the direct product of the mask space and the object space. By definition, a blind-ptychographic solution
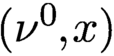 $({\nu }^0,{x})$
satisfies
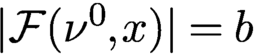 $|{\mathcal F}({\nu }^0, {x})|=b$
.
According to the global rigidity theorem, we use relative error (RE) and relative residual (RR) as the merit metrics for the recovered image
 $x_k$
and mask
 $\mu _k$
at the kth epoch:
 $$ \begin{align} \text{RE}(k) &= \min_{\alpha\in \mathbb{C}, \mathbf{r} \in \mathbb{R}^2}{\displaystyle \frac{\sqrt{\sum_{\mathbf n}|{x_{*}}({\mathbf n}) - \alpha \,{\mathrm{e}}^{-{\mathrm{i}} {2\pi}\mathbf{n}\cdot \mathbf{r}/n} x_k({\mathbf n})|^2}}{\|f\|}} , \end{align} $$
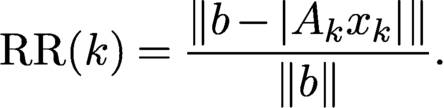 $$ \begin{align} \text{RR}(k) &= {\displaystyle \frac{\|b- |A_kx_{k}|\|}{\|b\|}}. \end{align} $$
Note that in (7.15) both the affine phase and the scaling factors are waived.
7.1.1 Initial mask estimate
For non-convex iterative optimization, a good initial guess or some regularization is usually crucial for convergence (Thibault and Guizar-Sicairos Reference Thibault and Guizar-Sicairos2012, Bian et al. Reference Bian, Suo, Chung, Ou, Yang, Chen and Dai2016). This is even more so for blind ptychography, which is doubly non-convex because, in addition to the phase retrieval step, extracting the mask and the object from their product is also non-convex.
We say that a mask estimate
 $\nu ^0$
satisfies MPC
 $(\delta )$
if

where
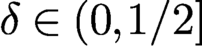 $\delta \in (0, 1/2]$
is the uncertainty parameter. The weakest condition necessary for uniqueness is
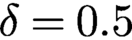 $\delta =0.5$
, equivalent to
 ${\mbox {Re}\,}(\overline {{\nu }^0}\odot \mu ^0)>0.$
Non-blind ptychography gives rise to infinitesimally small
 $\delta $
.
We use MPC
 $(\delta )$
as a measure of the initial mask estimate for blind-ptychographic reconstruction and randomly choose
 $\nu ^0$
from the set MPC
 $(\delta )$
. Specifically, we use the following mask initialization:
 $$ \begin{align*} \mu_1 (\mathbf{n})=\mu^0(\mathbf{n})\,\exp{\biggl[{\mathrm{i}} 2\pi{\displaystyle \frac{ \mathbf{k}\cdot\mathbf{n}}{n}}\biggr]}\,\exp{[{\mathrm{i}} \phi(\mathbf{n})]},\quad \mathbf{n}\in \mathcal{M}^0 , \end{align*} $$
where
 $\phi ({\mathbf n})$
are independently and uniformly distributed on
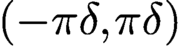 $(-\pi \delta , \pi \delta )$
.
Under MPC, however, the initial mask may be significantly far away from the true mask in norm. Even if
 $|\nu ^0({\mathbf n})|=|\mu ^{0}({\mathbf n})|=\text {const.}$
, the mask guess with uniformly distributed
 $\phi $
in
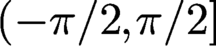 $(-\pi /2, \pi /2]$
has relative error close to
 $$ \begin{align*} \sqrt{\displaystyle \frac{1}{ \pi}\int^{\pi/2}_{-\pi/2} |{\mathrm{e}}^{{\mathrm{i}}\phi}-1|^2 {\,{\mathrm{d}}} \phi}=\sqrt{2\biggl(1-{\displaystyle \frac{2}{ \pi}}\biggr)}\approx 0.8525 \end{align*} $$
with high probability.
7.1.2 Ptychographic iterative engine (PIE)
The ptychographic iterative engines, namely PIE (Faulkner and Rodenburg Reference Faulkner and Rodenburg2004, Faulkner and Rodenburg Reference Faulkner and Rodenburg2005, Rodenburg and Faulkner Reference Rodenburg and Faulkner2004), ePIE (Maiden and Rodenburg Reference Maiden and Rodenburg2009) and rPIE (Maiden, Johnson and Li Reference Maiden, Johnson and Li2017), are related to the mini-batch gradient method.
In PIE and ePIE, the exit wave estimate is given by
 $$ \begin{align} \tilde\psi^{k}=\Phi^* [b^{k}\odot{\textrm{sgn}}(\Phi ({\nu}^{k}\odot x^k))] \end{align} $$
analogous to AP, where the kth object part
 $ x^k$
is updated by a gradient descent
 $$ \begin{align*} x^k-{\displaystyle \frac{1}{ 2\max_{{\mathbf n}} |{\nu}^k({\mathbf n})|^2}} \nabla_{{\nu}}\|{\nu}^{k}\odot x^k-\tilde \psi^{k}\|^2. \end{align*} $$
This choice of step size resembles the Lipschitz constant of the gradient of the loss function
 ${{1\over 2}} \|{\nu }^{k}\odot x^k-\tilde \psi ^{k}\|^2$
. The process continues in random order until each of the diffraction patterns has been used to update the object and mask estimates, at which point a single PIE iteration has been completed. The mask update proceeds in a similar manner.
The update process can be done in parallel as in Thibault et al. (Reference Thibault, Dierolf, Menzel, Bunk, David and Pfeiffer2008, Reference Tillmann, Eldar and Mairal2009). First the exit wave estimates are updated in parallel by the AAR algorithm instead of (7.17), that is,
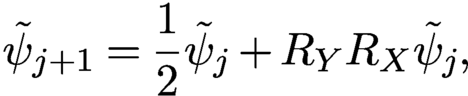 $$ \begin{align*} \tilde\psi_{j+1}={{1\over 2}} \tilde\psi_j+R_YR_X \tilde \psi_j , \end{align*} $$
where
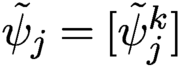 $\tilde \psi _j=[\tilde \psi ^k_j]$
is the jth iterate of the exit wave estimate. Second, the object and the mask are updated by solving iteratively the Euler–Lagrange equations
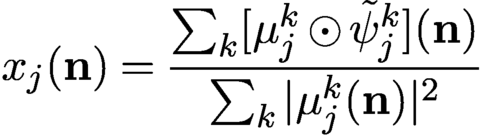 $$ \begin{align*} x_j({\mathbf n})= {\displaystyle \frac{\sum_k [\mu_j^k\odot \tilde\psi_j^k]({\mathbf n}) }{ \sum_k |\mu_j^k({\mathbf n})|^2}} \end{align*} $$
of the bilinear loss function
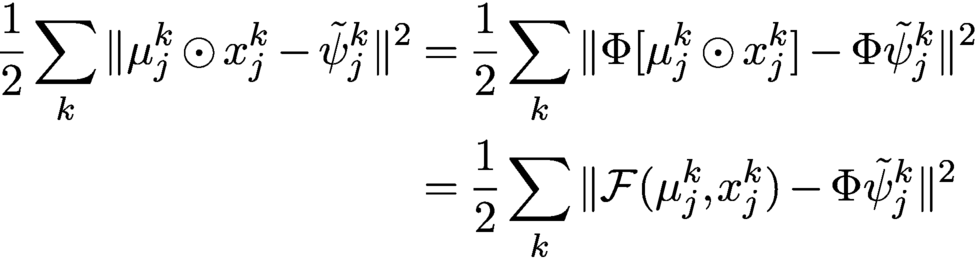 $$ \begin{align*} {{1\over 2}}\sum_k \|\mu_j^{k}\odot x_j^k-\tilde \psi_j^{k}\|^2 &= {{1\over 2}}\sum_k \|\Phi [\mu_j^{k}\odot x_j^k ]-\Phi\tilde \psi_j^{k}\|^2\notag \\ &= {{1\over 2}}\sum_k \|{\mathcal F}(\mu^k_j, x^k_j)-\Phi\tilde \psi^k_j\|^2 \end{align*} $$
for given
 $\tilde \psi _j$
(recall the isometric property of
 $\Phi $
).
7.1.3 Noise-aware method
As a first step of the noise-aware ADMM method for blind ptychography, we may consider the augmented Lagrangian
 $$ \begin{align*} {\mathcal{L}}(\nu,x,z,\lambda)={{1\over 2}}\|b-|z|\|^2+\lambda^*(z-{\mathcal F}(\nu,x))+{\displaystyle \frac{\beta}{ 2}} \|z-{\mathcal F}(\nu,x)\|^2 \end{align*} $$
and the scheme
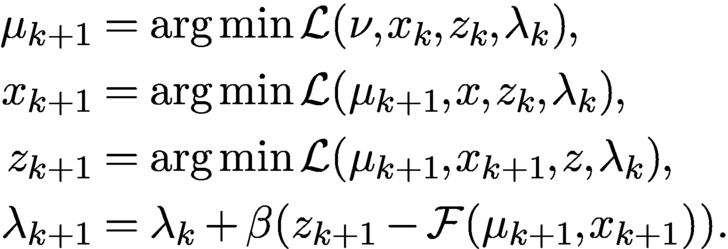 $$ \begin{align*} \mu_{k+1}&= \arg\min {\mathcal{L}}(\nu,x_k,z_k,\lambda_k),\\ x_{k+1}&= \arg\min {\mathcal{L}}(\mu_{k+1},x,z_k,\lambda_k),\\ z_{k+1}&= \arg\min {\mathcal{L}}(\mu_{k+1},x_{k+1},z,\lambda_k),\\ \lambda_{k+1}&= \lambda_k+ \beta(z_{k+1} -{\mathcal F}(\mu_{k+1},x_{k+1})). \end{align*} $$
Chang, Enfedaque and Marchesini (Reference Chen, Chi, Fan and Ma2019) have employed a more elaborate version of the above scheme to enhance convergence.
7.1.4 Extended Gaussian-DRS
As an extension of Gaussian-DRS (4.29), consider the augmented Lagrangian
 $$ \begin{align} {\mathcal{L}}(y,z, x,\nu,\lambda)= {{1\over 2}} \||z|-b\|^2+\lambda^*(z-y)+{\displaystyle \frac{\rho}{ 2}} \|z-y\|^2+{\mathbb{I}}_{\mathcal F}(y), \end{align} $$
where
 ${\mathbb {I}}_{\mathcal F}$
is the indicator function of the set
 $$ \begin{align*} \{y\in {\mathbb{C}} ^N\colon y={\mathcal F}(\nu, x) \ \text{for some }\nu,x\}. \end{align*} $$
Define the ADMM scheme for (7.18) as
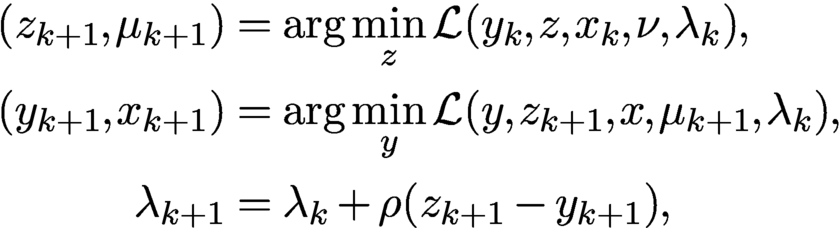 $$ \begin{align*} (z_{k+1}, \mu_{k+1})&= \arg\min_z {\mathcal{L}}(y_{k}, z, x_{k}, \nu, \lambda_k),\\ (y_{k+1},x_{k+1})&= \arg\min_y {\mathcal{L}}(y, z_{k+1}, x, \mu_{k+1}, \lambda_k) ,\\ \lambda_{k+1}&= \lambda_k+\rho (z_{k+1}-y_{k+1}) , \end{align*} $$
which is carried out explicitly by
 $$ \begin{align} z_{k+1} &= {\displaystyle \frac{1}{ \rho+1}} P_Y (y_k-\lambda_k/\rho)+{\displaystyle \frac{\rho}{\rho+1}} (y_k-\lambda_k/\rho), \end{align} $$
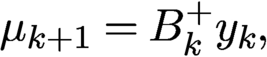 $$ \begin{align} \mu_{k+1} &= B_k^+ y_k, \end{align} $$
 $$ \begin{align} y_{k+1} &= A_{k+1}A_{k+1}^+ (z_{k+1}+\lambda_k/\rho), \end{align} $$
 $$ \begin{align} x_{k+1} &= A_{k+1}^+ y_{k+1}, \end{align} $$
 $$ \begin{align} \lambda_{k+1}/\rho & = {\lambda_k/\rho} +z_{k+1}-y_{k+1}. \end{align} $$
We can simplify the above scheme further in terms of the new variable
 $$ \begin{align*} u_k=z_{k}+\lambda_{k-1}/\rho. \end{align*} $$
Rewrite (7.21) as
 $$ \begin{align} y_{k+1}=A_{k+1}A_{k+1}^+ u_{k+1} \end{align} $$
and hence (7.23) as
 $$ \begin{align} \lambda_{k+1}/\rho= u_{k+1}-y_{k+1} = u_{k+1}-A_{k+1}A_{k+1}^+u_{k+1}. \end{align} $$
Combining (7.24) and (7.25), we obtain
 $$ \begin{align*} z_{k+1}= \biggl({\displaystyle \frac{1}{ \rho+1}} P_Y+{\displaystyle \frac{\rho}{\rho+1}}\biggr)(2A_kA_k^+-I)u_k{.} \end{align*} $$
On the other hand,
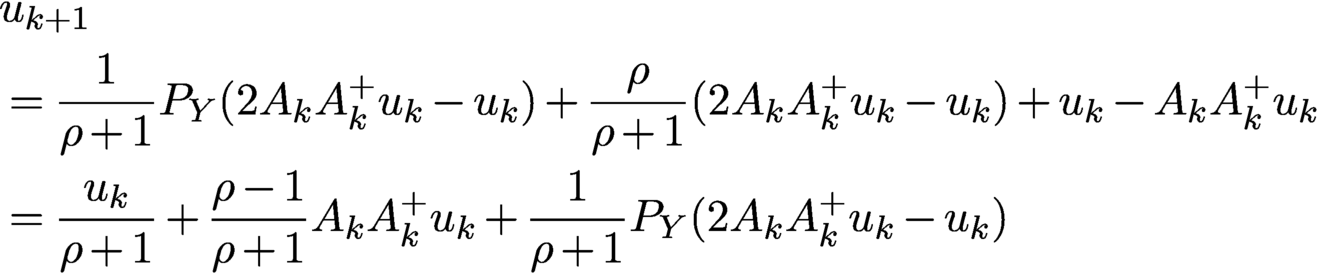 $$ \begin{align} &{u_{k+1}}\nonumber\\ & = {\displaystyle \frac{1}{ \rho+1}} P_Y (2A_{k}A_{k}^+u_k -u_k)+{\displaystyle \frac{\rho}{\rho+1}} (2A_{k}A_{k}^+u_k -u_k) + u_{k}-A_{k}A_{k}^+u_{k} \nonumber\\ & = {\displaystyle \frac{u_k}{ \rho+1}}+{\displaystyle \frac{\rho-1}{ \rho+1}} A_kA_k^+ u_k+{\displaystyle \frac{1}{ \rho+1}} P_Y(2A_{k}A_{k}^+u_k -u_k) \end{align} $$
with the mask and object updated by
 $$ \begin{align} \mu_{k+1} &= B_k^+ A_{k}A_{k}^+ u_k , \end{align} $$
 $$ \begin{align} x_{k+1} &= A_{k+1}^+ u_{k+1}. \end{align} $$
Equations (7.26)–(7.28) constitute the extended version of Gaussian-DRS (eGaussian-DRS) for blind ptychography.
Figure 7.5 shows the relative errors (for object and mask) and the residual of eGaussian-DRS, with
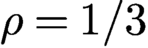 $\rho =1/3$
and various overlap ratios in the perturbed scan, as well as different initial mask phase uncertainties
 $\delta $
. Clearly, increasing the overlap ratio or decreasing the initial mask phase uncertainty speed up convergence. The straight line feature of the semi-log plots indicates geometric convergence, and vice versa.
Relative errors versus iteration of blind ptychography by eGaussian-DRS with
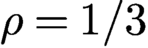 $\rho =1/3$
for the original object CiB. Scheme (7.13) is used with different overlap ratios and initializations, as indicated in each plot.
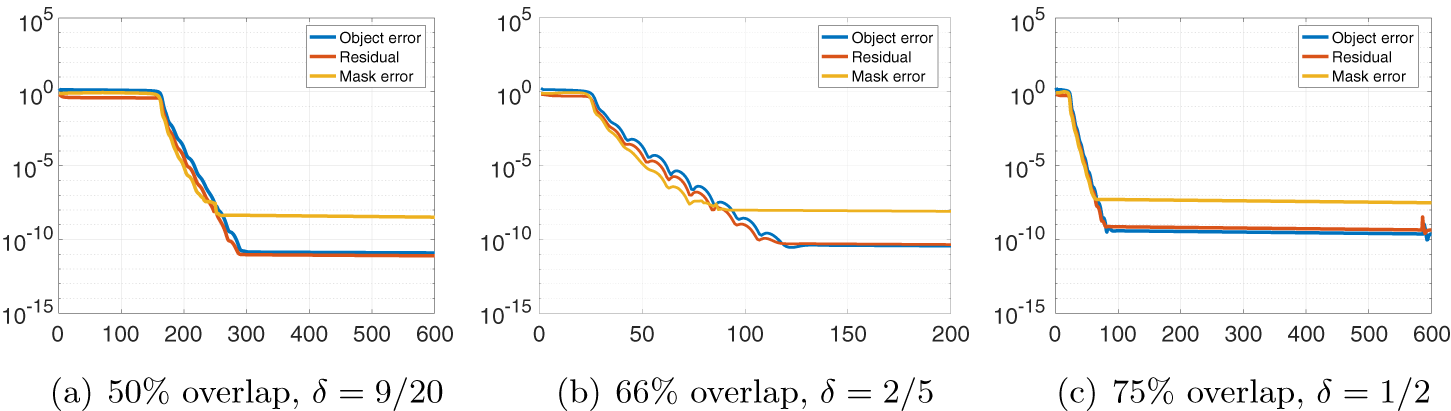
7.1.5 Noise-agnostic methods
As an extension of the augmented Lagrangian (4.4), consider
 $$ \begin{align*} \mathcal{L}(z,\nu,x,\lambda)= \mathbb{I}_{Y} (z)+\lambda^{*}(z- {\mathcal F}(\nu,x)) + \displaystyle\frac{1}{2} \|z-{\mathcal F}(\nu,x)\|^2 \end{align*} $$
and the ADMM scheme
 $$ \begin{align} z_{k+1} &= \arg\min_z {\mathcal{L}}(z,\mu_k,x_k,\lambda_k)= P_Y [{\mathcal F}(\mu_k, x_k)-\lambda_k], \end{align} $$
 $$ \begin{align} (\mu_{k+1}, x_{k+1}) &= \arg\min_{\nu} {\mathcal{L}}(z_{k+1},\nu,x,\lambda_k) \end{align} $$
 $$ \begin{align} \lambda_{k+1} &= \lambda_k+z_{k+1}-{\mathcal F}(\mu_{k+1}, x_{k+1}). \end{align} $$
If, instead of the bilinear optimization step (7.30), we simplify it by one step as alternating minimization
 $$ \begin{align*} \mu_{k+1}&= \arg\min_{\nu} {\mathcal{L}}(z_{k+1},\nu,x_k,\lambda_k) = B^+_{k}(z_{k+1}+\lambda_k),\\x_{k+1}&= \arg\min_g {\mathcal{L}}(z_{k+1},\mu_{k+1},x,\lambda_k)= A^+_{k+1}(z_{k+1}+\lambda_k) \end{align*} $$
with
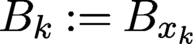 $B_k := B_{x_k}$
and
 $A_{k+1}=A_{\mu _{k+1}},$
then we obtain the DM algorithm for blind ptychography (Thibault et al. Reference Thibault, Dierolf, Menzel, Bunk, David and Pfeiffer2008, Thibault et al. Reference Thibault, Dierolf, Bunk, Menzel and Pfeiffer2009), one of the earliest methods for blind ptychography.
7.1.6 Extended RAAR
To extend RAAR to blind ptychography, let us consider the augmented Lagrangian
 $$ \begin{align*} {\mathcal{L}}(y, z,\nu,x,\lambda)= {\mathbb{I}}_Y (z)+{{1\over 2}} \|y- {\mathcal F}(\nu,x)\|^2+\lambda^*(z-y)+{\displaystyle \frac{\gamma}{ 2}} \|z-y\|^2 \end{align*} $$
and the ADMM scheme
 $$ \begin{align} (y_{k+1},x_{k+1}) &= \arg\min_y {\mathcal{L}}(y, z_k, x, \mu_{k}, \lambda_k), \end{align} $$
 $$ \begin{align} (z_{k+1}, \mu_{k+1}) &= \arg\min_z {\mathcal{L}}(y_{k+1}, z, x_{k+1}, \nu, \lambda_k), \end{align} $$
 $$ \begin{align} \lambda_{k+1} &= \lambda_k+\gamma (z_{k+1}-y_{k+1}). \end{align} $$
In the case of a known mask
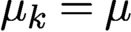 $\mu _k=\mu $
for all k, the procedure (7.32)–(7.34) is equivalent to RAAR. We refer to the above scheme as the extended RAAR (eRAAR). Note that eRAAR has a non-standard loss function as the term
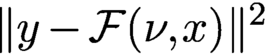 $\|y- {\mathcal F}(\nu ,{x})\|^2$
is not separable. A similar scheme is implemented in Marchesini et al. (Reference Marchesini, Krishnan, Daurer, Shapiro, Perciano, Sethian and Maia2016) in the domain of the masked object (see the discussion in Section 4.5).
With
 $\beta $
given in (4.40) the minimizer for (7.32) can be expressed explicitly as
 $$ \begin{align} y_{k+1} &= (I+P_k^\perp/\gamma)^{-1}(z_k+\lambda_k/\gamma)=(I-\beta P^\perp_k) (z_k+\lambda_k/\gamma), \end{align} $$
 $$ \begin{align} x_{k+1} &= A_k^+ y_{k+1}=A_k^+ (z_k+\lambda_k/\gamma) , \end{align} $$
where
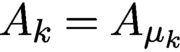 $A_k=A_{\mu _k}$
and
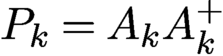 $P_k=A_kA_k^+$
. On the other hand, equation (7.33) can be solved exactly by
 $$ \begin{align} z_{k+1} & = P_Y [y_{k+1}-\lambda_k/\gamma], \end{align} $$
 $$ \begin{align} \mu_{k+1} & = B_{k+1}^+ y_{k+1} , \end{align} $$
where
 $B_{k+1}=B_{x_{k+1}}$
.
Let
 $$ \begin{align} u_{k+1}:= y_{k+1}-\lambda_k/\gamma \end{align} $$
and hence
 $$ \begin{align*} u_{k+1}=(I-\beta P_k^{\perp}) (P_Y u_k+\lambda_k/\gamma)-\lambda_k/\gamma. \end{align*} $$
On the other hand, we can rewrite (7.34) as
 $$ \begin{align} \lambda_{k}/\gamma=z_{k}-u_{k}=P_Y u_{k}-u_{k} \end{align} $$
and hence
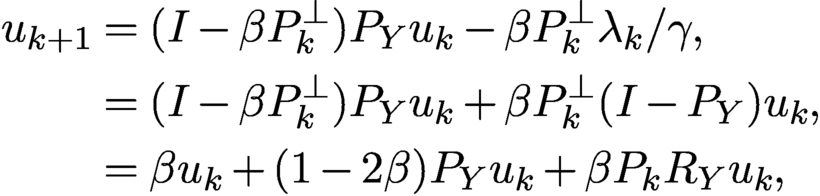 $$ \begin{align} u_{k+1}&= (I-\beta P^\perp_k) P_Y u_k-\beta P_k^\perp \lambda_k/\gamma, \nonumber \\ &= (I-\beta P_k^\perp) P_Y u_k+\beta P_k^\perp (I-P_Y) u_k, \nonumber \\ &= \beta u_k+(1-2\beta) P_Y u_k+\beta P_k R_Y u_k, \end{align} $$
where
 $R_Y=2P_Y-I$
. This is the RAAR map with the mask estimate
 $\mu _k$
updated by (7.38) and (7.36).
More explicitly, by (7.40) and (7.39),
 $$ \begin{align*} y_{k+1}= u_{k+1}+P_Y u_k-u_k \end{align*} $$
and hence
 $$ \begin{align} x_{k+1} & = A_k^+ (u_{k+1}+P_Y u_k-u_k ), \end{align} $$
 $$ \begin{align} \mu_{k+1} & = B_{k+1}^+ (u_{k+1}+P_Y u_k-u_k). \end{align} $$
Equation (7.42) can be further simplified as
 $$ \begin{align} x_{k+1}= A_k^+R_Y u_k \end{align} $$
by applying
 $A^+_k$
to (7.41) to get
 $A^+_k u_{k+1}=A^+_k P_Y u_k$
.
Equations (7.41), (7.44) and (7.43) constitute a simple, self-contained iterative system called extended RAAR (eRAAR).
Figure 7.6 shows the relative errors (for object and mask) and residual of eRAAR with
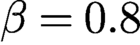 $\beta =0.8$
corresponding to
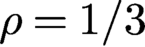 $\rho =1/3$
according to (4.46). The rest of the set-up is the same as for Figure 7.5. Comparing Figures 7.5 and 7.6 we see that eGaussian-DRS converges significantly faster than eRAAR, consistent with the results in Figure 4.3.
Relative errors versus iteration of blind ptychography for CiB by eRAAR with
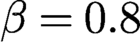 $\beta =0.8$
.
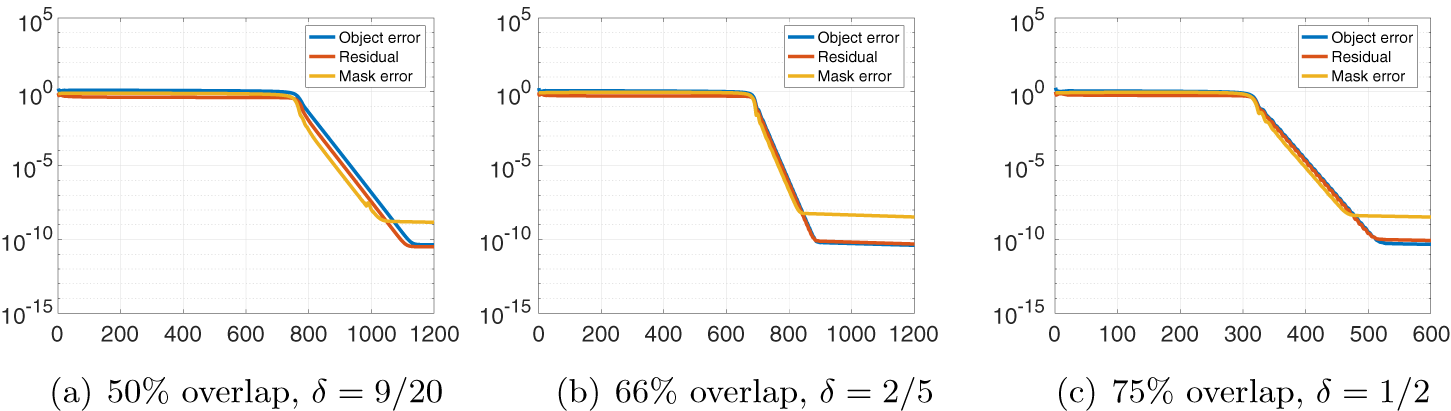
7.2 Further extensions of blind ptychography algorithms
7.2.1 One-loop version
Let
 $T_k$
denote the kth RAAR map (7.41) or Gaussian-DRS map (7.26). Starting with the initial guess
 $u_1$
, let
 $$ \begin{align} u_{k+1}= T_k^{\ell} (u_k)\quad \text{for sufficiently large } \ell \end{align} $$
for
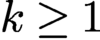 $k\ge 1$
. The termination rule can be based on a predetermined number of iterations, the residual, or a combination of the two. See Algorithm 1.
Let
 $$ \begin{align} x_{k+1} &= A_k^+R_Y u_k, \end{align} $$
 $$ \begin{align} \mu_{k+1} &= B_{k+1}^+ (u_{k+1}+P_Y u_k-u_k) \end{align} $$
in the case of RAAR (7.41), and
 $$ \begin{align} \mu_{k+1} & = B_k^+ A_{k}A_{k}^+ u_k , \end{align} $$
 $$ \begin{align} x_{k+1} & = A_{k+1}^+ u_{k+1} \end{align} $$
in the case of Gaussian-DRS (7.26).

In a sense, eGaussian-DRS/eRAAR is the one-step version of one-loop Gaussian-DRS/RAAR.
7.2.2 Two-loop version
Two-loop methods have two inner loops: the first is the object loop (7.45)–(7.46) and the second is the mask loop defined as follows. The two-loop version is an example of alternating minimization (AM). See Algorithm 2.
Let
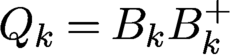 $Q_k=B_kB_k^+$
and let
 $S_k$
be the associated RAAR map
 $$ \begin{align*} S_k(v) := \beta v+(1-2\beta) P_Y v+\beta Q_k R_Yv \end{align*} $$
or the associated Gaussian-DRS map
 $$ \begin{align*} S_k(v) = {\displaystyle \frac{v}{ \rho+1}}+{\displaystyle \frac{\rho-1}{ \rho+1}} Q_k^+v+{\displaystyle \frac{1}{ \rho+1}} P_Y(2Q_k^+v -v) {.} \end{align*} $$
Starting with the initial guess
 $v_1$
, let
 $$ \begin{align} v_{k+1}= S_k^{\ell} (v_k)\quad \text{for sufficiently large } \ell \end{align} $$
for
 $k\ge 1$
.
Let
 $$ \begin{align} \mu_{k+1}= B_{k}^+ R_Y v_k \end{align} $$
in the case of RAAR in analogy to (7.46), and
 $$ \begin{align} \mu_{k+1}= B_{k+1}^+ v_{k+1} \end{align} $$
in the case of Gaussian-DRS in analogy to (7.49).
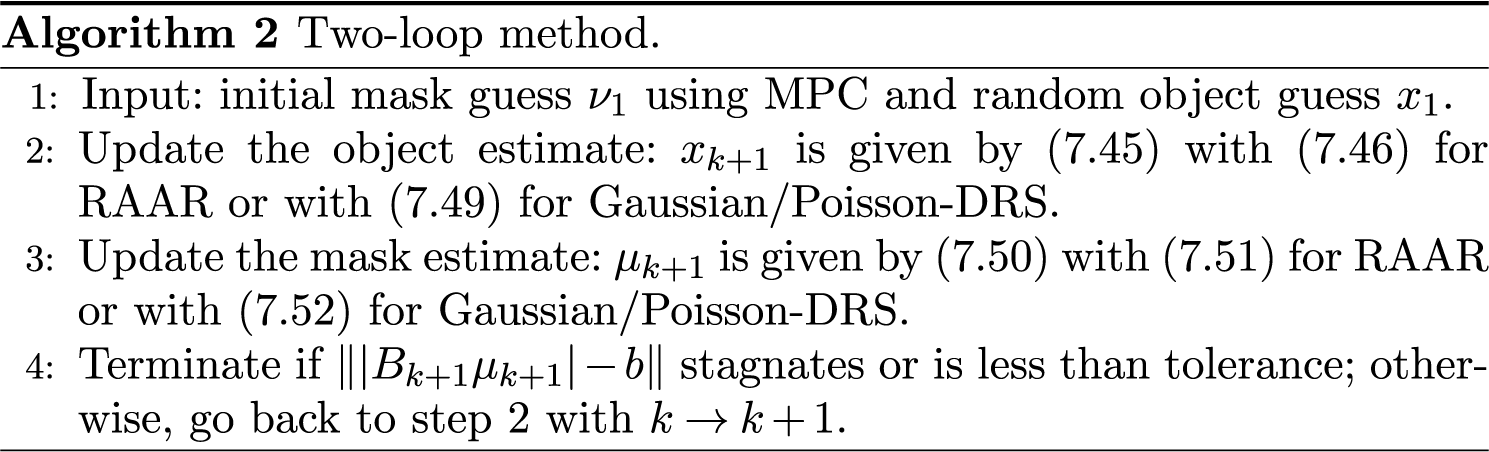
7.2.3 Two-loop experiments
Following Fannjiang and Zhang (Reference Fannjiang and Chen2020), we refer to the two-loop version with Gaussian-DRS or Poisson-DRS as DRSAM, which is tested next. We demonstrate that even with the parameter
 $\rho =1$
far from the optimal value (near 0.3), DRSAM converges geometrically under the minimum conditions required by uniqueness, i.e. with overlap ratio slightly above
 $50\%$
and initial mask phase uncertainty
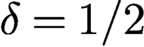 $\delta =1/2$
. We let
 $\delta _{k}^1$
and
 $\delta ^2_l$
in the rank-one scheme (7.13) and
 $\delta _{kl}^1$
and
 $\delta ^2_{kl}$
in the full-rank scheme (7.12) be i.i.d. uniform random variables over
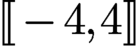 .
The inner loops of Gaussian-DRSAM become
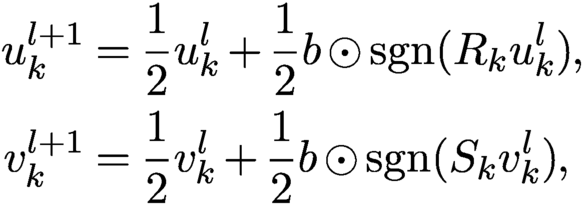 $$ \begin{align*} u_{k}^{l+1} &= {\displaystyle \frac{1}{2}}u_{k}^{l} +{\displaystyle \frac{1}{2}}b\odot {\textrm{sgn}}(R_ku_{k}^{l}),\\ v_{k}^{l+1}& = {\displaystyle \frac{1}{2}}v_{k}^{l} +{\displaystyle \frac{1}{2}}b\odot {\textrm{sgn}}{(S_k v_{k}^{l})}, \end{align*} $$
and the inner loops of Poisson-DRSAM become
 $$ \begin{align*} u_{k}^{l+1}& = {\displaystyle \frac{1}{2}}u_{k}^{l} -{\displaystyle \frac{1}{3}}R_k u_{k}^{l}+{\displaystyle \frac{1}{6}} {\textrm{sgn}}{(R_k u_{k}^{l})}\odot \sqrt{|R_k u^l_k|^2+24b^2} ,\\ v_{k}^{l+1} &= {\displaystyle \frac{1}{2}} v_{k}^{l} -{\displaystyle \frac{1}{3}}S_k v_{k}^{l}+{\displaystyle \frac{1}{6}}{\textrm{sgn}}{(S_k v_{k}^{l})}\odot \sqrt{|S_k v_{k}^{l}|^2+24b^2}. \end{align*} $$
Here
 $R_k=2P_k-I$
is the reflector corresponding to the projector
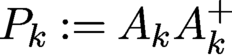 $P_k:=A_kA_k^{+}$
and
 $S_k$
is the reflector corresponding to the projector
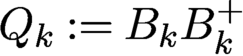 $Q_k:=B_kB_k^{+}$
. We set
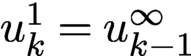 $u^1_k=u^{\infty }_{k-1}$
, where
 $u^{\infty }_{k-1}$
is the terminal value at epoch
 $k-1$
, and
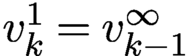 $v^1_k=v^{\infty }_{k-1}$
, where
 $v^{\infty }_{k-1}$
is the terminal value at epoch
 $k-1$
.
Figure 7.7(a) compares the performance of four combinations of loss functions (Poisson or Gaussian) and scanning schemes (rank-one or full-rank) with a
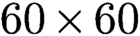 $60\times 60$
random mask for the test object CiB in the noiseless case. Full-rank perturbation (7.12) results in a faster convergence rate than the rank-one scheme (7.13). The convergence rate of Poisson-DRSAM is slightly better than Gaussian-DRSAM with noiseless data.
(a) Geometric convergence to CiB in the noiseless case at various rates for four combinations of loss functions and scanning schemes with i.i.d. mask (rank-one Poisson,
 $\text {rate}=0.8236$
; rank-one Gaussian,
 $\text {rate}=0.8258$
; full-rank Poisson,
 $\text {rate}=0.7205$
; full-rank Gaussian,
 $\text {rate}=0.7373$
). (b) RE versus NSR for reconstruction of CiB with Poisson noise.
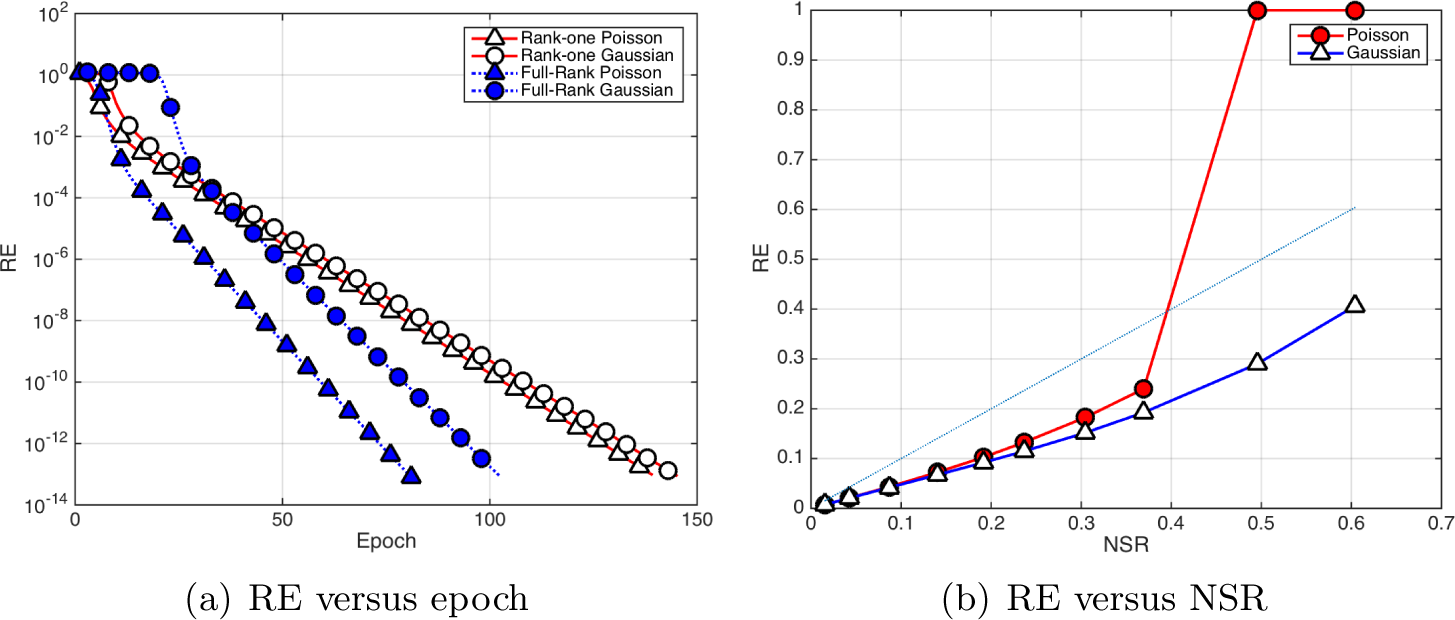
With data corrupted by Poisson noise, Figure 7.7(b) shows RE versus NSR (5.11) for CiB by Poisson-DRS and Gaussian-DRS with i.i.d. mask and the full-rank scheme. The maximum number of epochs in DRSAM is limited to
 $100$
. The RR stabilizes usually after 30 epochs. The (blue) reference straight line has slope = 1. We see that Gaussian-DRS outperforms Poisson-DRS, especially when the Poisson RE becomes unstable for NSR
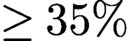 $\ge 35\%$
. As noted by Maiden et al. (Reference Maiden, Johnson and Li2017), Zuo, Sun and Chen (Reference Zuo, Sun and Chen2016) and Chen et al. (Reference Chen, Fannjiang and Liu2018), fast convergence (with the Poisson log-likelihood function) may introduce noisy artifacts and reduce reconstruction quality.
8 Holographic coherent diffraction imaging
Holography is a lensless imaging technique that enables complex-valued image reconstruction by virtue of placing a coherent point source at an appropriate distance from the object and having the object field interfere with the reference wave produced by this point source at the (far-field) detector plane (Goodman Reference Goodman2005). For example, adding a pinhole (corresponding to adding a delta distribution in the mathematical model) at an appropriate position to the sample creates an additional wave in the far field, with a tilted phase, caused by the displacement between the pinhole and the sample. The far-field detector now records the intensity of the Fourier transform of the sample and the reference signal (e.g. the pinhole).
The invention of holography goes back to Dennis Gabor,Footnote 6 who in 1947 was working on improving the resolution of the recently invented electron microscope (Gabor Reference Gabor1947, Gabor Reference Gabor1948, Gabor et al. Reference Gabor, Stroke, Brumm, Funkhouser and Labeyrie1965). In 1971 he was awarded the Nobel Prize in Physics for his invention. In the original scheme proposed by Gabor, called in-line holography, the reference and object waves are parallel to one another. In off-axis holography, the two waves are separated by a non-zero angle. In classical holography, a photographic plate is used to record the spatial intensity distribution. In state-of-the-art digital holography systems a digital acquisition device captures the spatial intensity distribution (Seelamantula, Pavillon, Depeursinge and Unser Reference Seelamantula, Pavillon, Depeursinge and Unser2011).
We recommend Latychevskaia (Reference Latychevskaia2019) for a recent survey of iterative algorithms in holography. While holography leads to relatively simple algorithms for solving the phase retrieval problems, it does pose numerous challenges in the experimental practice. For a detailed discussion of various practical issues with holography, such as resolution limitations, see Duadi et al. (Reference Duadi, Margalit, Mico, Rodrigo, Alieva, Garcia and Zalevsky2011), Latychevskaia and Fink (Reference Latychevskaia and Fink2015), Shechtman et al. (Reference Shechtman, Eldar, Cohen, Chapman, Miao and Segev2015), Saliba et al. (Reference Saliba, Bosgra, Parsons, Wagner, Rau and Thibault2016) and Latychevskaia (Reference Latychevskaia2019).
A compelling direction in holographic phase retrieval is to combine holography with CDI (Latychevskaia et al. Reference Latychevskaia, Longchamp and Fink2012, Saliba, Latychevskaia, Longchamp and Fink Reference Saliba, Latychevskaia, Longchamp and Fink2012, Raz et al. Reference Raz, Leshem, Miao, Nadler, Oron and Dudovich2014); see Figure 8.1 for a set-up depicting holographic CDI. This hybrid technique ‘inherits the benefits of both techniques, namely the straightforward unambiguous recovery of the phase distribution and the visualization of a non-crystalline object at the highest possible resolution’ (Latychevskaia et al. Reference Latychevskaia, Longchamp and Fink2012). Recently, researchers have successfully used holographic CDI to image proteins at the single molecule level (Longchamp et al. Reference Longchamp, Rauschenbach, Abb, Escher, Latychevskaia, Kern and Fink2017).
Holographic CDI set-up. Image courtesy of Saliba et al. (Reference Saliba, Latychevskaia, Longchamp and Fink2012).
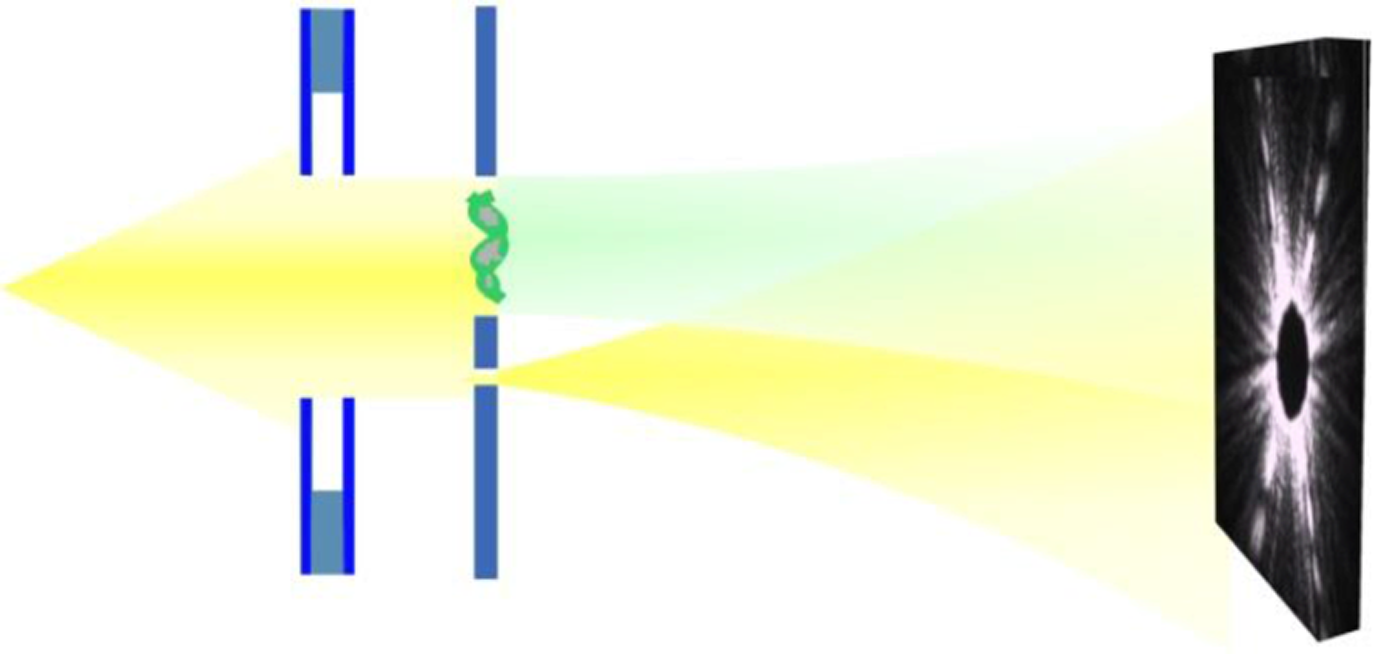
While holographic techniques have been around for a long time, these investigations have been mainly empirical. A notable exception is the recent work of Barmherzig et al. (Reference Barmherzig, Sun, Candès, Lane and Li2019a , Reference Barmherzig, Sun, Lane, Li and Candès2019b ), which contains a rigorous mathematical treatment of holographic CDI that sheds light on the reference design from an optimization viewpoint and provides a detailed error analysis. We will discuss some aspects of this work below.
From a mathematical viewpoint, the key point of holographic CDI is that the introduction of a reference signal simplifies the phase retrieval problem considerably, since the computational problem of recovering the desired signal can now be expressed as a linear deconvolution problem (Kikuta, Aoki, Kosaki and Kohra Reference Kikuta, Aoki, Kosaki and Kohra1972, Guizar-Sicairos and Fienup Reference Guizar-Sicairos and Fienup2007, Barmherzig et al. Reference Barmherzig, Sun, Lane, Li and Candès2019b ). We discuss this insight below.
Here, we assume that our function of interest
 ${x_{*}}$
is an
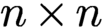 $n \times n$
image. We denote the convolution of two functions
 $x,z$
by
 $x \ast z$
and define the involution (also known as the twin image)
 $\check {x}$
of x as
 $\check {x}(t_1,t_2) = \overline {x(-t_1,-t_2)}$
. The cross-correlation
 $\mathfrak {C}_{[x,z]}$
between the two functions
 $x, z$
is given by
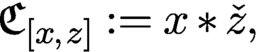 $$ \begin{align} \mathfrak{C}_{[x,z]} := x \ast \check{z}, \end{align} $$
where we use Neumann boundary conditions, i.e. zero-padding, outside the valid index range. We have already encountered the special case
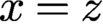 $x = z$
(although without stipulating specific boundary conditions), in the formof the autocorrelation
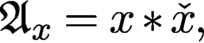 $$ \begin{align} {\mathfrak{A}}_{x} = x \ast \check{x}, \end{align} $$
which is at the core of the phase retrieval problem via the relationFootnote 7
 $$ \begin{align*} F (x \ast \check{x}) = |F(x)|^2. \end{align*} $$
While extracting a function from its autocorrelation is a difficult quadratic problem (as exemplified by the phase retrieval problem), extracting a function from a cross-correlation is a linear problem if the other function is known, and is thus much easier. This observation is the key point of holographic CDI. We will take full advantage of this fact by adding a reference area (in digital form represented by the signal r) to the specimen
 ${x_{*}}$
. For concreteness, we assume that the reference r is placed on the right side of
 ${x_{*}}$
, and subject the so-enlarged signal
 $[{x_{*}}, r]$
to the measurement process, as illustrated in Figure 8.1.
For
 $(s_1,s_2) \in \{-(n-1),\ldots ,0\}\times \{-(n-1),\ldots ,0\}$
, we have
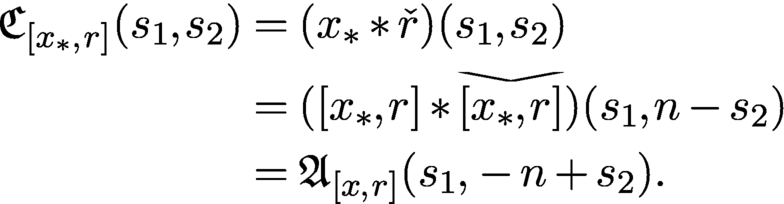
Equation (8.3) allows us to establish a linear relationship between
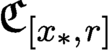 $\mathfrak {C}_{[{x_{*}}, r]}$
and the measurements given by the squared entries of
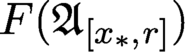 $F({\mathfrak {A}}_{[{x_{*}},r]})$
. Most approaches in holography are based on utilizing this relationship in some way; see e.g. Seelamantula et al. (Reference Seelamantula, Pavillon, Depeursinge and Unser2011).
Here, we take a signal processing approach and recall that the convolution of two two-dimensional signals with Neumann boundary conditions can be described as matrix–vector multiplication, where the matrix is given by a lower-triangular block Toeplitz matrix with lower-triangular Toeplitz blocks (Gray Reference Gray2006). The lower-triangular property stems from the fact that the zero-padding combined with the particular index range we are considering is equivalent to applying a two-dimensional causal filter (Gray Reference Gray2006).
Let
 $r^{(k)}$
be the kth column of the reference r and let the lower-triangular block-Toeplitz–Toeplitz block matrix
 $T(r)$
be given by
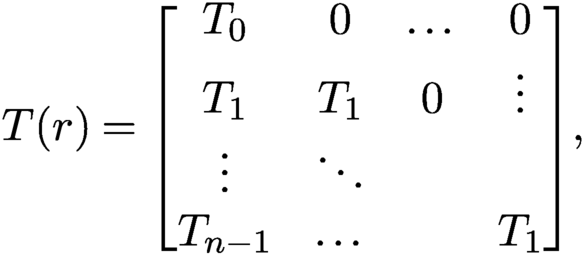 $$ \begin{align*} T(r) = \begin{bmatrix} T_0 & 0 & \dots &0 \\ T_1 & T_1 & 0 & \vdots \\ \vdots & \ddots & & \\ T_{n-1} & \dots & & T_1 \end{bmatrix}\!, \end{align*} $$
where the first column of the lower-triangular Toeplitz matrix
 $T_k$
is given by
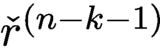 $\check {r}^{(n-k-1)}$
for
 $k=0,\ldots ,n-1$
. We also define
 $y : = F^{-1}(|F([{x_{*}},r])|^2)$
and note that
 $$ \begin{align*} y = F^{-1}(|F([{x_{*}},r])|^2) = F^{-1}(F({\mathfrak{A}}_{[{x_{*}},r]}))={\mathfrak{A}}_{[{x_{*}},r]}. \end{align*} $$
Hence, with a slight abuse of notation (by considering
 ${x_{*}}$
also as column vector of length
 $n^2$
by stacking its columns) we arrive at the following linear system of equations:
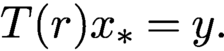 $$ \begin{align} T(r) {x_{*}} = y. \end{align} $$
The
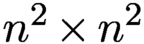 $n^2 \times n^2$
matrix
 $T(r)$
is invertible if and only if its diagonal entries are non-zero, that is, if and only if
 $r_{n-1,n-1} \neq 0$
. As noted by Barmherzig et al. (Reference Barmherzig, Sun, Lane, Li and Candès2019b
), this condition is equivalent to the well-known holographic separation condition (Guizar-Sicairos and Fienup Reference Guizar-Sicairos and Fienup2007), which dictates when an image is recoverable by using the reference r. In signal processing jargon, this separation condition prevents the occurrence of aliasing.
Let us consider the very special case of the pinhole reference. In this case
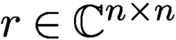 $r \in {\mathbb {C}}^{n\times n}$
is given by
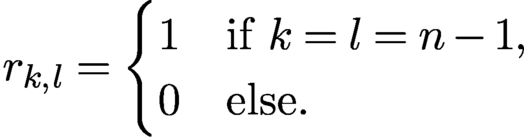 $$ \begin{align*} r_{k,l} = \begin{cases} 1 & \text{if } k=l=n-1, \\ 0 & \text{else.} \end{cases} \end{align*} $$
Thus r acts as a delta distribution with respect to the given digital resolution (which may be very difficult to realize in practice, and thus this is still one limiting factor in the achievable image resolution). In this particular case its diagonal entries are
 $[T(r)]_{k,k} =r_{n-1,n-1}=1$
for all
 $k=0,\ldots ,n^2-1$
, and all off-diagonal entries of
 $T(r)$
are zero; thus
 $T(r)$
is simply the
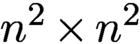 $n^2 \times n^2$
identity matrix.
Other popular choices are the block reference defined by
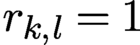 $r_{k,l}=1$
for all
 $k,l=0,\ldots ,n-1$
, and the slit reference defined by
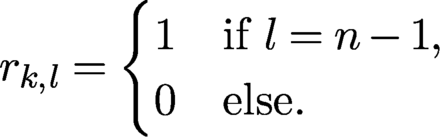 $$ \begin{align*} r_{k,l} = \begin{cases} 1 & \text{if } l=n-1, \\ 0 & \text{else.} \end{cases} \end{align*} $$
In both cases the resulting matrix
 $T(r)$
as well as its inverse
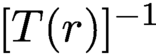 $[T(r)]^{-1}$
take a very simple form, as the interested reader may easily convince herself.
In the noiseless case, the only difference between these references from a theoretical viewpoint is the computational complexity in solving the system (8.4), which is obviously minimal for the pinhole reference. However, in the presence of noise, different references have different advantages and drawbacks. We refer to Barmherzig et al. (Reference Barmherzig, Sun, Lane, Li and Candès2019b ) for a thorough error analysis when the measurements are corrupted by Poisson shot noise.
We describe some numerical experiments illustrating the effectiveness of the referenced deconvolution algorithm. The description of these simulations and associated images are courtesy of Barmherzig et al. (Reference Barmherzig, Sun, Lane, Li and Candès2019b ), who also provide a number of other simulations.
In this experiment, the specimen
 ${x_{*}}$
is the mimivirus image (Ghigo et al. Reference Ghigo, Kartenbeck, Lien, Pelkmans, Capo, Mege and Raoult2008), and its spectrum mostly concentrates on very low frequencies, as shown in Figure 8.2(b). The image size is
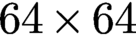 $64 \times 64$
, and the pixel values are normalized to
 $[0, 1]$
. For the referenced set-up, a reference r of size
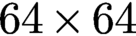 $64 \times 64$
is placed next to
 ${x_{*}}$
, forming a composite specimen
 $[{x_{*}},r]$
of size
 $64 \times 128$
. Three references are considered, i.e. the pinhole, slit and block references. Note that the zero-padding introduced as the boundary condition in the cross-correlation function (8.1) and the autocorrelation function (8.2) corresponds to an oversampling of the associated Fourier transform. In this experiment, the oversampled Fourier transform is taken to be of size
 $1024 \times 1024$
, and the collected noisy data are subject to Poisson shot noise. We note that since the oversampling condition in the detector plane corresponds to zero-padding in the object plane, this requires the specimen to be surrounded by a support with known transmission properties. For instance, when imaging a biological molecule, it must ideally be either levitating or resting on a homogeneous transparent film such as graphene (Latychevskaia et al. Reference Latychevskaia, Longchamp and Fink2012). Thus, that which is trivial from a mathematical viewpoint may be rather challenging to realize in practice.
Recovery result of the mimivirus image using various recovery schemes, and the corresponding relative recovery errors (all errors should be rescaled by
 $10^{-4}$
). Referenced deconvolution (RD) clearly outperforms HIO, both with and without the reference information enforced. Experimental and theoretical relative errors for referenced deconvolution match closely, as predicted by the theory derived by Barmherzig et al. (Reference Barmherzig, Sun, Lane, Li and Candès2019b
).
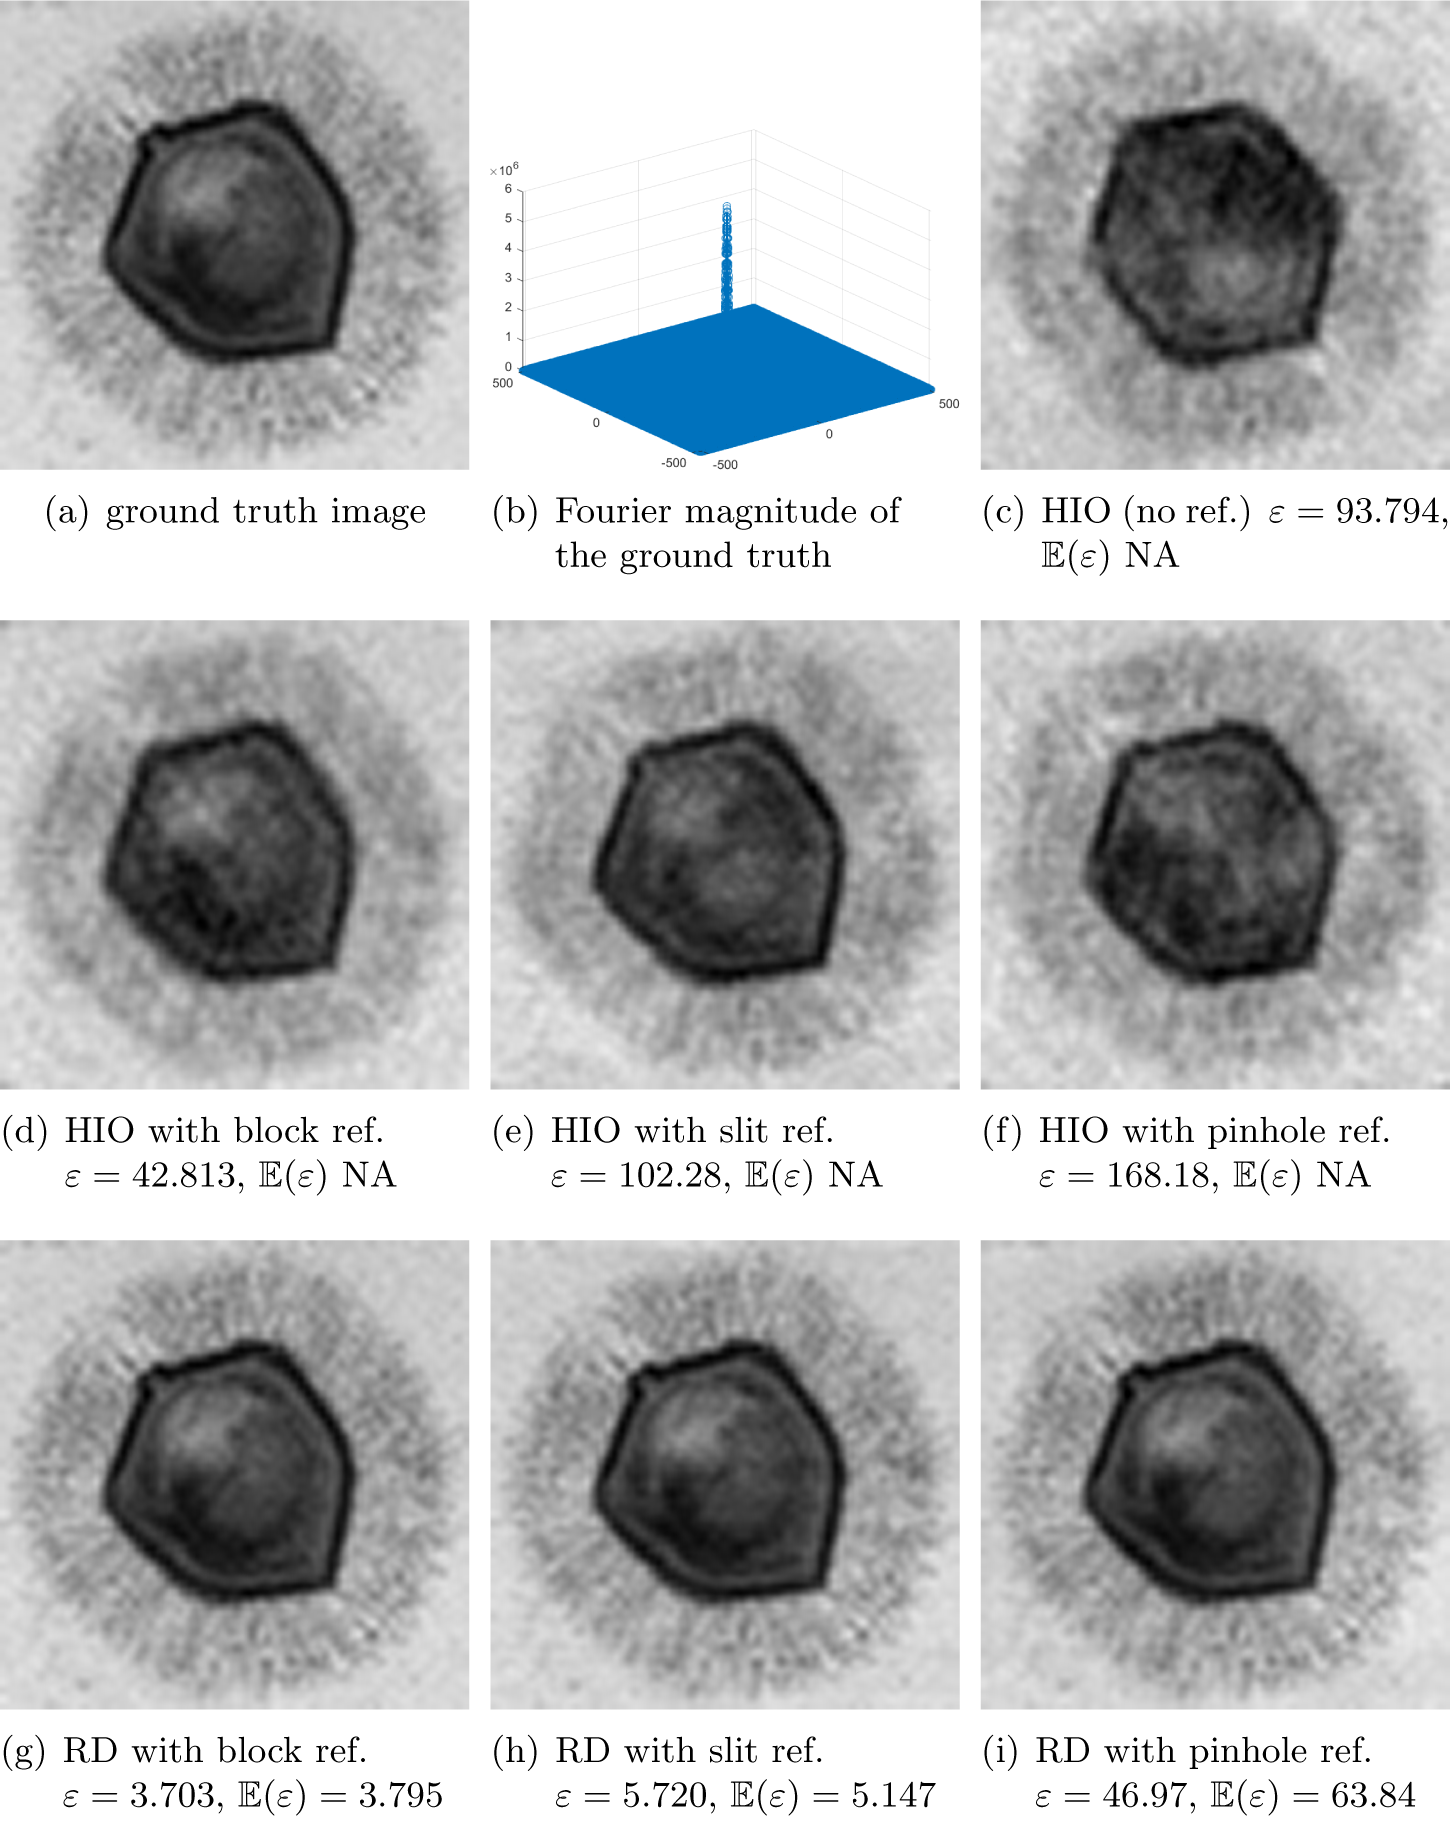
We run the referenced deconvolution algorithm and compare it to the HIO algorithm, the latter with and without enforcing the known reference for comparison. The results are presented in Figure 8.2. It is evident that referenced deconvolution clearly outperforms HIO. An inspection of the errors stated in the corresponding figure captions shows that for the referenced deconvolution schemes, the expected and empirical relative recovery errors are close for each reference, as predicted by the error analysis of Barmherzig et al. (Reference Barmherzig, Sun, Lane, Li and Candès2019b ).
In the example depicted in Figure 8.2, the block reference gives the smallest recovery error among the tested reference schemes. However, this is not the case in general. As illustrated in Barmherzig et al. (Reference Barmherzig, Sun, Lane, Li and Candès2019b
), depending on the spectral decay behaviour of the image under consideration, different reference schemes have different limitations. To overcome the specific limitations of each reference, a dual-reference approach has been proposed in Barmherzig et al. (Reference Barmherzig, Sun, Candès, Lane and Li2019a
), in which the reference consists of two reference portions: a pinhole portion
 $r_p$
and a block portion
 $r_b$
. In this case the illuminated image takes the form
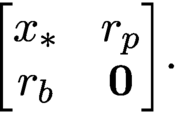 $$ \begin{align*} \begin{bmatrix} {x_{*}} & r_p \\ r_b & {\textbf{0}} \end{bmatrix}\!. \end{align*} $$
The theoretical and empirical error analysis in Barmherzig et al. (Reference Barmherzig, Sun, Candès, Lane and Li2019a ) show that this dual-reference scheme achieves a smaller recovery error than the leading single-reference schemes.
9 Conclusion and outlook
In this survey we have tried to capture the state of the art of the classical but rapidly evolving field of numerical algorithms for phase retrieval. The past decade has witnessed extensive activity in the systematic study of numerical algorithms for phase retrieval. Advances in convex and non-convex optimization have led to a better understanding of the benefits and limitations of various phase retrieval algorithms. The insights gained in the study of these algorithms has in turn advanced new measurement protocols, such as random illuminations.
Some of the most challenging problems related to phase retrieval arise in blind ptychography, in imaging proteins at the single molecule level (Longchamp et al. Reference Longchamp, Rauschenbach, Abb, Escher, Latychevskaia, Kern and Fink2017), and in non-crystallographic ‘single-shot’ X-ray imaging (Chapman et al. Reference Chapman, Hau-Riege, Bogan, Bajt, Barty, Boutet, Marchesini, Frank, Woods and Benner2007, Loh et al. Reference Loh, Bogan, Elser, Barty, Boutet, Bajt, Hajdu, Ekeberg, Maia and Schulz2010). In the latter problem, in addition to the phase retrieval problem, we face the major task of tomographic three-dimensional reconstruction of the object from diffraction images with unknown rotation angles – a challenge that we also encounter in cryo-EM (Singer Reference Singer2019). The review article by Shechtman et al. (Reference Shechtman, Eldar, Cohen, Chapman, Miao and Segev2015) contains a detailed discussion of current bottlenecks and future challenges, such as taking the CDI techniques to the regime of attosecond science. This topic remains one of the current challenges in phase retrieval.
Mathematicians sometimes develop theoretical and algorithmic frameworks under assumptions that do not conform to current practice. It is then important to find out if these assumptions are fundamentally unrealistic, or if they actually point to new ideas that are (perhaps with considerable effort) implementable in practice and advance the field.
It is clear that much more work needs to be done, and a closer dialogue between practitioners and theorists is highly desirable to create the kind of feedback loop where theory and practice drive each other forward with little temporal delay. Careful systematic numerical analysis is an essential ingredient in strengthening the bond between theory and practice.
Acknowledgements
The authors are grateful to Tatiana Latychevskaia, Emmanuel Candès, Justin Romberg and Stefano Marchesini for allowing us to use the exquisite illustrations from their corresponding publications; see Saliba et al. (Reference Saliba, Latychevskaia, Longchamp and Fink2012), Barmherzig et al. (Reference Barmherzig, Sun, Lane, Li and Candès2019b ), Bahmani and Romberg (Reference Bahmani and Romberg2016) and Qian et al. (Reference Qian, Yang, Schirotzek, Maia and Marchesini2014), respectively. We thank Dr Pengwen Chen for preparing Figures 5.1 and 5.2. A.F. acknowledges support from the NSF via grant NSF DMS-1413373 and from the Simons Foundation via grant SIMONS FDN 2019-24. T. S. acknowledges support from the NSF via grant DMS 1620455 and from the NGA and the NSF via grant DMS 1737943.