INTRODUCTION
Myctophid fish are one of the most abundant and widespread mesopelagic fish groups in the world oceans, being key species in various ecosystems (Gjøsæter & Kawaguchi, Reference Gjøsæter and Kawaguchi1980; Sassa et al., Reference Sassa, Moser and Kawaguchi2002; Brodeur & Yamamura, Reference Brodeur and Yamamura2005). Of these, some species occur associated with submerged bottom features such as islands, seamounts and continental slope regions, which are defined as ‘mesopelagic-boundary’, ‘pseudoceanic’ or ‘slope water’ in the literature (Reid et al., Reference Reid, Hirota, Young and Hallacher1991; Hulley, Reference Hulley1992; Brodeur & Yamamura, Reference Brodeur and Yamamura2005; Gartner et al., Reference Gartner, Sulak, Ross and Necaise2008). Benthosema pterotum (Alcock, 1890) is a typical mesopelagic-boundary myctophid, widely distributed in the subtropical–tropical waters of the Indo-West Pacific, especially over or near the continental shelf (Gjøsæter, Reference Gjøsæter1984; Dalpadado & Gjøsæter, Reference Dalpadado and Gjøsæter1987; Kinzer et al., Reference Kinzer, Böttger-Schnack and Schulz1993; Valinassab et al., Reference Valinassab, Pierce and Johannesson2007; Sassa et al., Reference Sassa, Tsukamoto, Yamamoto and Tokimura2010). They are small-sized, with a maximum body size of ~55 mm standard length (SL), and have a life cycle of one year or less (Gjøsæter, Reference Gjøsæter1984; Dalpadado, Reference Dalpadado1988).
Benthosema pterotum is the only myctophid distributed abundantly in the shelf region of the East China Sea (ECS) (Sassa et al., Reference Sassa, Tsukamoto, Yamamoto and Tokimura2010), which is one of the largest marginal seas of the western Pacific. The ECS is the northern fringe of the B. pterotum distribution (Yamada et al., Reference Yamada, Tokimura, Horikawa and Nakabo2007), and dense distributions were observed in the central part of the shelf (mainly 40–90 m depth) in all seasons, where the biomass was estimated in the order of several thousands to several tens of thousands of metric tons (Sassa et al., Reference Sassa, Tsukamoto, Yamamoto and Tokimura2010). This is a markedly shallower depth than previous reports for adult myctophids, and the mechanism of population maintenance in this area was hypothesized to be related to: (1) the adaptation to the low-salinity waters of 32–33 PSU; and (2) the presence of highly turbid waters in the benthopelagic layer of the shelf which produces dim light conditions during the daytime (Sassa et al., Reference Sassa, Tsukamoto, Yamamoto and Tokimura2010).
In the shelf region of the ECS, B. pterotum occurs in the epipelagic layer at night, and shifts down to the benthopelagic layer during the daytime to form dense aggregations (Yamada et al., Reference Yamada, Tokimura, Horikawa and Nakabo2007; Sassa et al., Reference Sassa, Tsukamoto, Yamamoto and Tokimura2010). The prey items of B. pterotum are mainly composed of small crustaceans such as copepods, euphausiids and ostracods (Ishihara & Kubota, Reference Ishihara and Kubota1997). Since B. pterotum form a major prey item for both pelagic and demersal fish, including many commercially important species, this species is a key species acting as an important link between secondary producers and upper trophic levels in the ecosystem of the ECS (Mio et al., Reference Mio, Tagawa, Shinohara and Yamada1984; Baeck & Huh, Reference Baeck and Huh2003; Chiou & Lee, Reference Chiou and Lee2004; Chiou et al., Reference Chiou, Chen, Wang and Chen2006; Yamada et al., Reference Yamada, Tokimura, Horikawa and Nakabo2007). Although morphology, distribution and feeding of B. pterotum in the ECS have been studied (Ozawa & Peñaflor, Reference Ozawa and Peñaflor1990; Ishihara et al., Reference Ishihara, Kubota and Yamada1995; Ishihara & Kubota, Reference Ishihara and Kubota1997; Sassa et al., Reference Sassa, Tsukamoto, Yamamoto and Tokimura2010), little has been reported on their reproductive biology. Benthosema pterotum is a small-sized species occurring abundantly in an area of high turbidity in the ECS throughout the year (Sassa et al., Reference Sassa, Tsukamoto, Yamamoto and Tokimura2010), and seasonal samplings of this species are much easier compared to other large-sized and/or oceanic species. This is an advantage of studying this species in the ECS for understanding biological aspects of myctophid fish.
Extensive studies of the ecology and biology of B. pterotum were conducted in the Indian Ocean from the mid-1970s to the 1980s, and information on the reproductive biology was accumulated (Gjøsæter, Reference Gjøsæter1984; Dalpadado & Gjøsæter, Reference Dalpadado and Gjøsæter1987, Reference Dalpadado and Gjøsæter1988; Hussain & Ali-Khan, Reference Hussain and Ali-Khan1987; Dalpadado, Reference Dalpadado1988). Since there is considerable potential for inter-regional variations in life history among broadly distributed myctophid species inhabiting subtropical to equatorial waters (Clarke, Reference Clarke1983, Reference Clarke1984; Gartner, Reference Gartner1993), detailed information on reproductive biology of each species must be obtained on a regional basis. We examined the sex-ratio, sexual maturity, spawning period, oocyte development and batch fecundity of B. pterotum in the ECS. Our results were compared with the published information on reproduction of B. pterotum from the Indian Ocean.
MATERIALS AND METHODS
Sample collection and general biological data
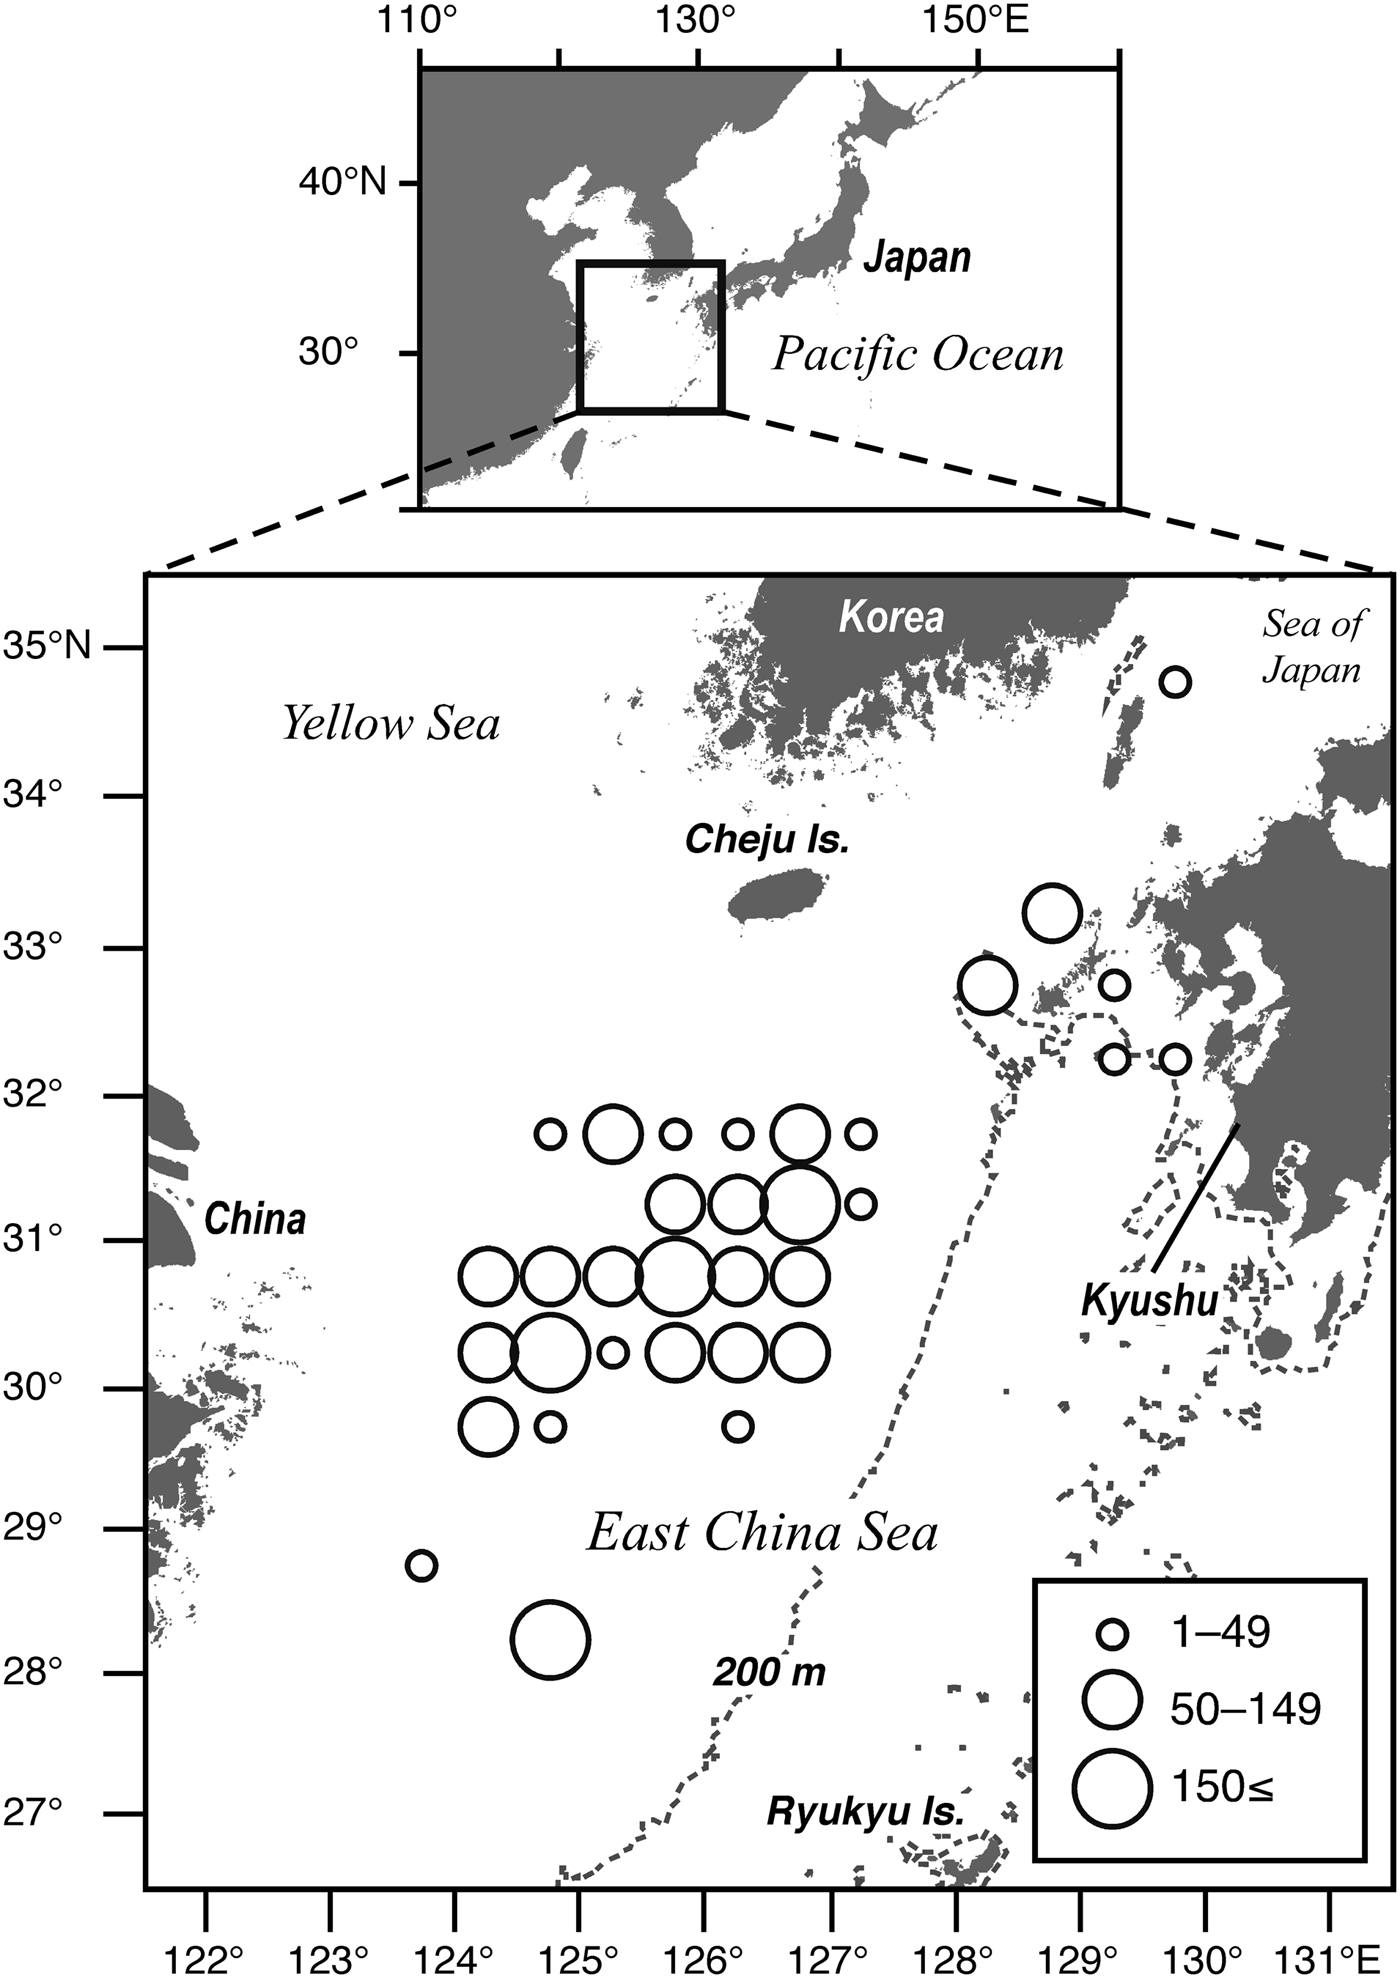
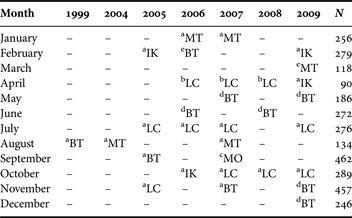
Benthosema pterotum were collected during 31 cruises in the continental shelf region of the ECS and its adjacent area in 1999 and from 2004 to 2009 on-board either the RVs ‘Yoko-Maru’, ‘Soyo-Maru’, ‘Hokkou-Maru’ (Fisheries Research Agency), ‘Kumamoto-Maru’ (Reiyou High School) or ‘Kaiyo-Maru No. 7’ (Nippon Kaiyo Co. Ltd) (Figure 1; Table 1). We used specimens collected by five types of gear to pool enough numbers of specimens for monthly analysis (Table 1). A 6 ft Isaacs–Kidd midwater trawl (IKMT, 1 mm mesh net), a Matsuda-Oozeki-Hu trawl (MOHT, 2.24 × 2.24 m mouth opening; 1.59 mm mesh net) (Oozeki et al., Reference Oozeki, Hu, Kubota, Sugisaki and Kimura2004) and a small-sized midwater trawl (Larval catcher net (LC net), Nichimo Co. Ltd., 8 × 8 m mouth opening; 9 mm mesh net) was obliquely towed from the surface to ~50 m depth during the day and night. A midwater otter trawl (25 × 25 m mouth opening; 9 mm mesh of cod end) tow was conducted for 30 min horizontally during the night in the epipelagic layer between 30 and 60 m depth where the deep scattering layers (DSL) were observed. A bottom otter trawl (20 × 4 or 8 × 3 mouth opening; 9 mm mesh of cod end) tow was conducted for 30 min during the day. Samples were fixed in 10% buffered formalin–seawater at sea.
Geographical distribution of Benthosema pterotum caught in the East China Sea and its adjacent areas in 1999 and 2004–2009 for reproductive investigations. The number of individuals in each sampling location was combined within 30′ × 30′ of latitude and longitude. The size of circle indicates the number of fish caught at each site. The total number of analysed specimens of B. pterotum was 3065.

Collection data. Collecting gear: MT, midwater trawl; BT, bottom trawl; IK, 6 ft Isaacs–Kidd midwater trawl (IKMT); MO, Matsuda-Oozeki-Hu trawl (MOHT); LC, small-sized midwater trawl (LC net). Research vessel: a, ‘Yoko-Maru'; b, ‘Soyo-Maru'; c, ‘Hokkou-Maru'; d, ‘Kumamoto-Maru'; e, ‘Kaiyo-Maru No. 7'. N, total number of Benthosema pterotum pooled.
A total of 3065 B. pterotum ranging from 10.7 to 54.8 mm SL were used for obtaining general biological data (Figure 3A). The SL of all specimens was measured to the nearest 0.1 mm. Body weight (BW) was determined to the nearest 0.1 mg, and gonadal weight (GW) and liver weight (LW) were measured to the nearest 0.01 mg using an electric microbalance (Mettler Toledo: XS105 DualRange). Sex was examined for all specimens by macroscopic observation of the gonad morphology using a stereomicroscope, and sex-ratios are based on pooled data for each month. Gonadosomatic index (GSI) and hepatosomatic index (HSI) were calculated using the following equations:
 $$GSI = {{GW} / {BW \times 100}}$$
 $$HSI = {{LW} / {BW \times 100}}$$
All mature specimens larger than the minimum size at sexual maturity (see ‘Results’) were used to determine the monthly changes in GSI and HSI.
Developmental stages of gonad
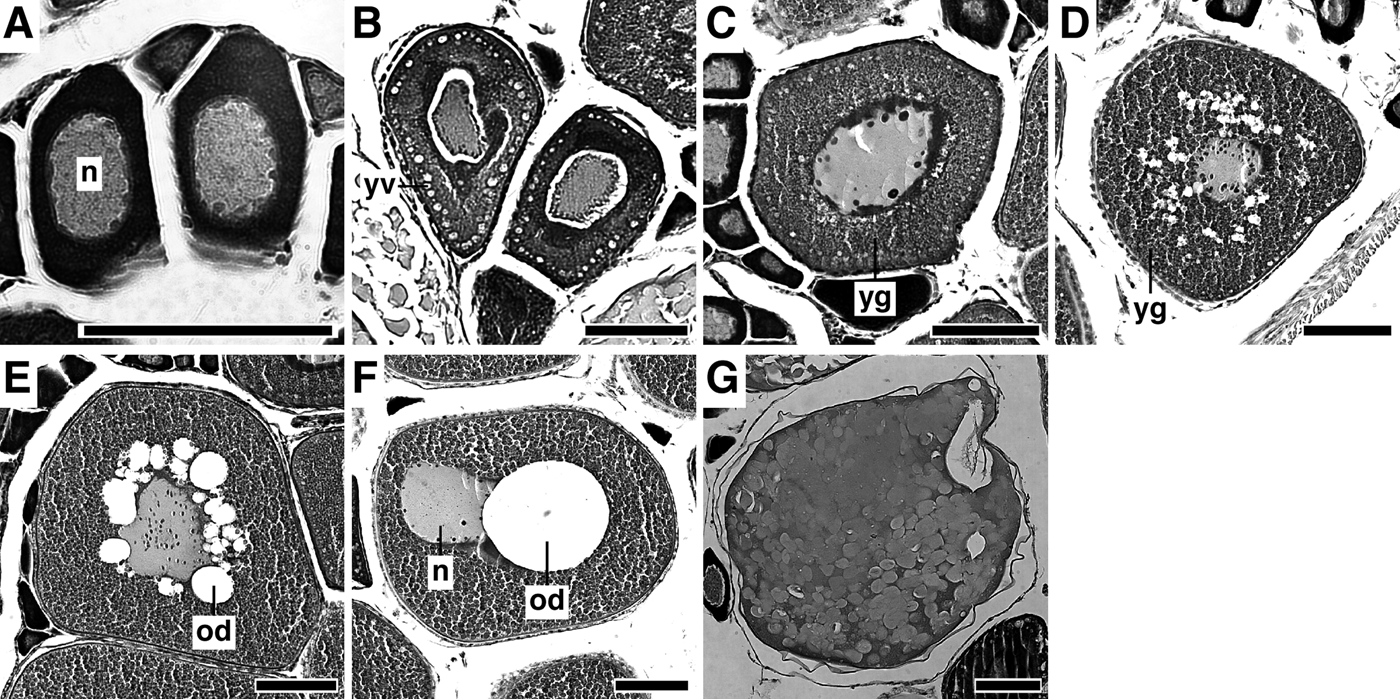
A total of 188 ovaries were histologically examined. A portion of the ovary was dehydrated, embedded in paraffin wax and sectioned at approximately 8 µm. The sections of the ovary were stained with Mayer's haematoxylin-eosin (HE). Ovarian stages were determined for the developmental stages of the most advanced group of oocytes in the ovaries. Since oogenesis is similar to that in other Teleostei (e.g. Yamamoto, Reference Yamamoto1956; Wallace & Selman, Reference Wallace and Selman1981; Kawasaki, Reference Kawasaki1982; Yoneda et al., Reference Yoneda, Miura, Mitsuhashi, Matsuyama and Matsuura2000, Reference Yoneda, Tokimura, Fujita, Takeshita, Takeshita, Matsuyama and Matsuura2001), the ovaries were classified into the following seven developmental stages based on Yamamoto (Reference Yamamoto1956) (Table 2; Figure 2): perinucleolus stage; yolk vesicle stage; primary yolk stage; secondary yolk stage; tertiary yolk stage; migratory nucleus stage; and hydrated stage.
Photomicrographs of seven oocyte maturity stages for Benthosema pterotum caught in the shelf region of the East China Sea: (A) perinucleolus stage; (B) yolk vesicle stage; (C) primary yolk stage; (D) secondary yolk stage; (E) tertiary yolk stage; (F) migratory nucleus stage; (G) hydrated stage. n, nucleus; yv, yolk vesicle; yg, yolk globule; od, oil droplet. Scale bars: 100 µm.
Histological characteristics of Benthosema pterotum oocytes at different developmental stages.
Since the testes of B. pterotum were too small (248 ±118 µg, mean ±standard deviation (SD)) to classify developmental stages based on histological examination (C. Sassa, unpublished data), the testes were classified into the following four morphological stages based on Dalpadado (Reference Dalpadado1988): Stage I, testes threadlike; Stage II, anterior part thicker, posterior part of testes tube-like; Stage III, testes thicker, posterior part flat, consisting of parallel tubes, anterior part more rounded, granular in appearance; and Stage IV, posterior part of testes bulbous with milt-filled tubes, anterior part thick, often with laminar appearance.
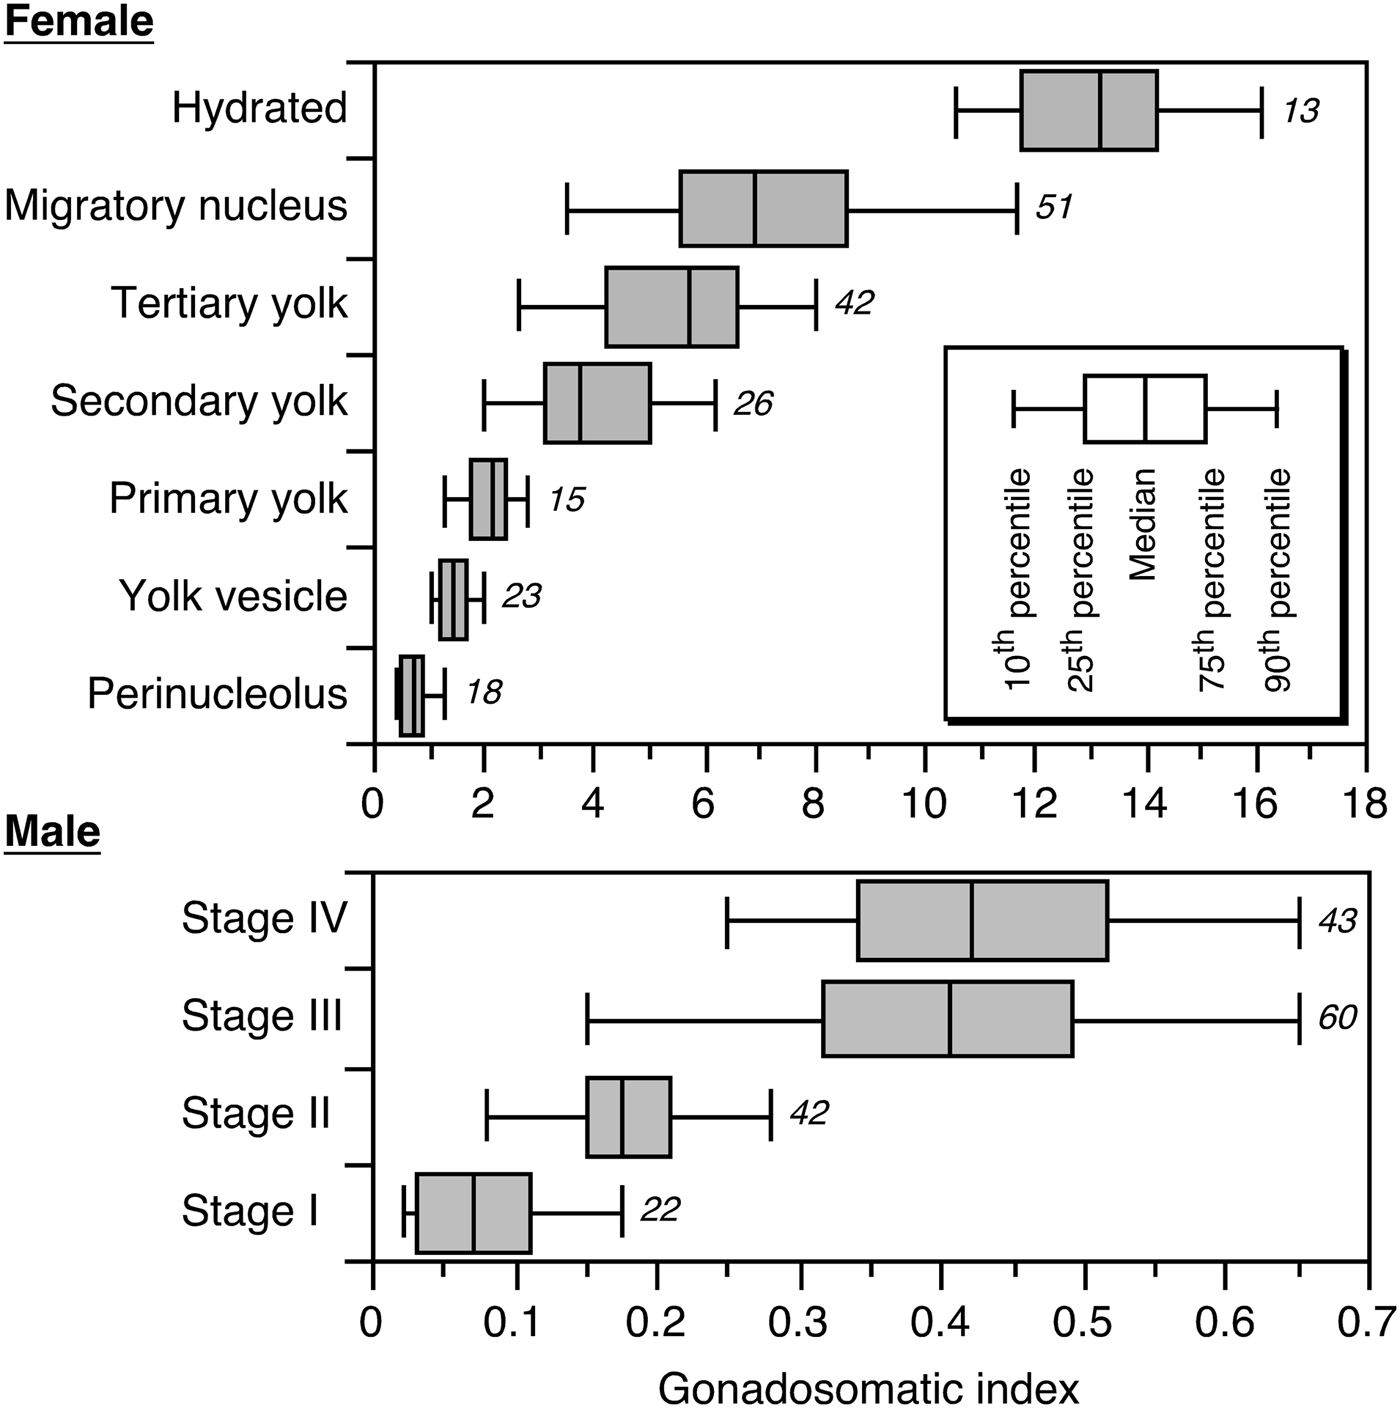
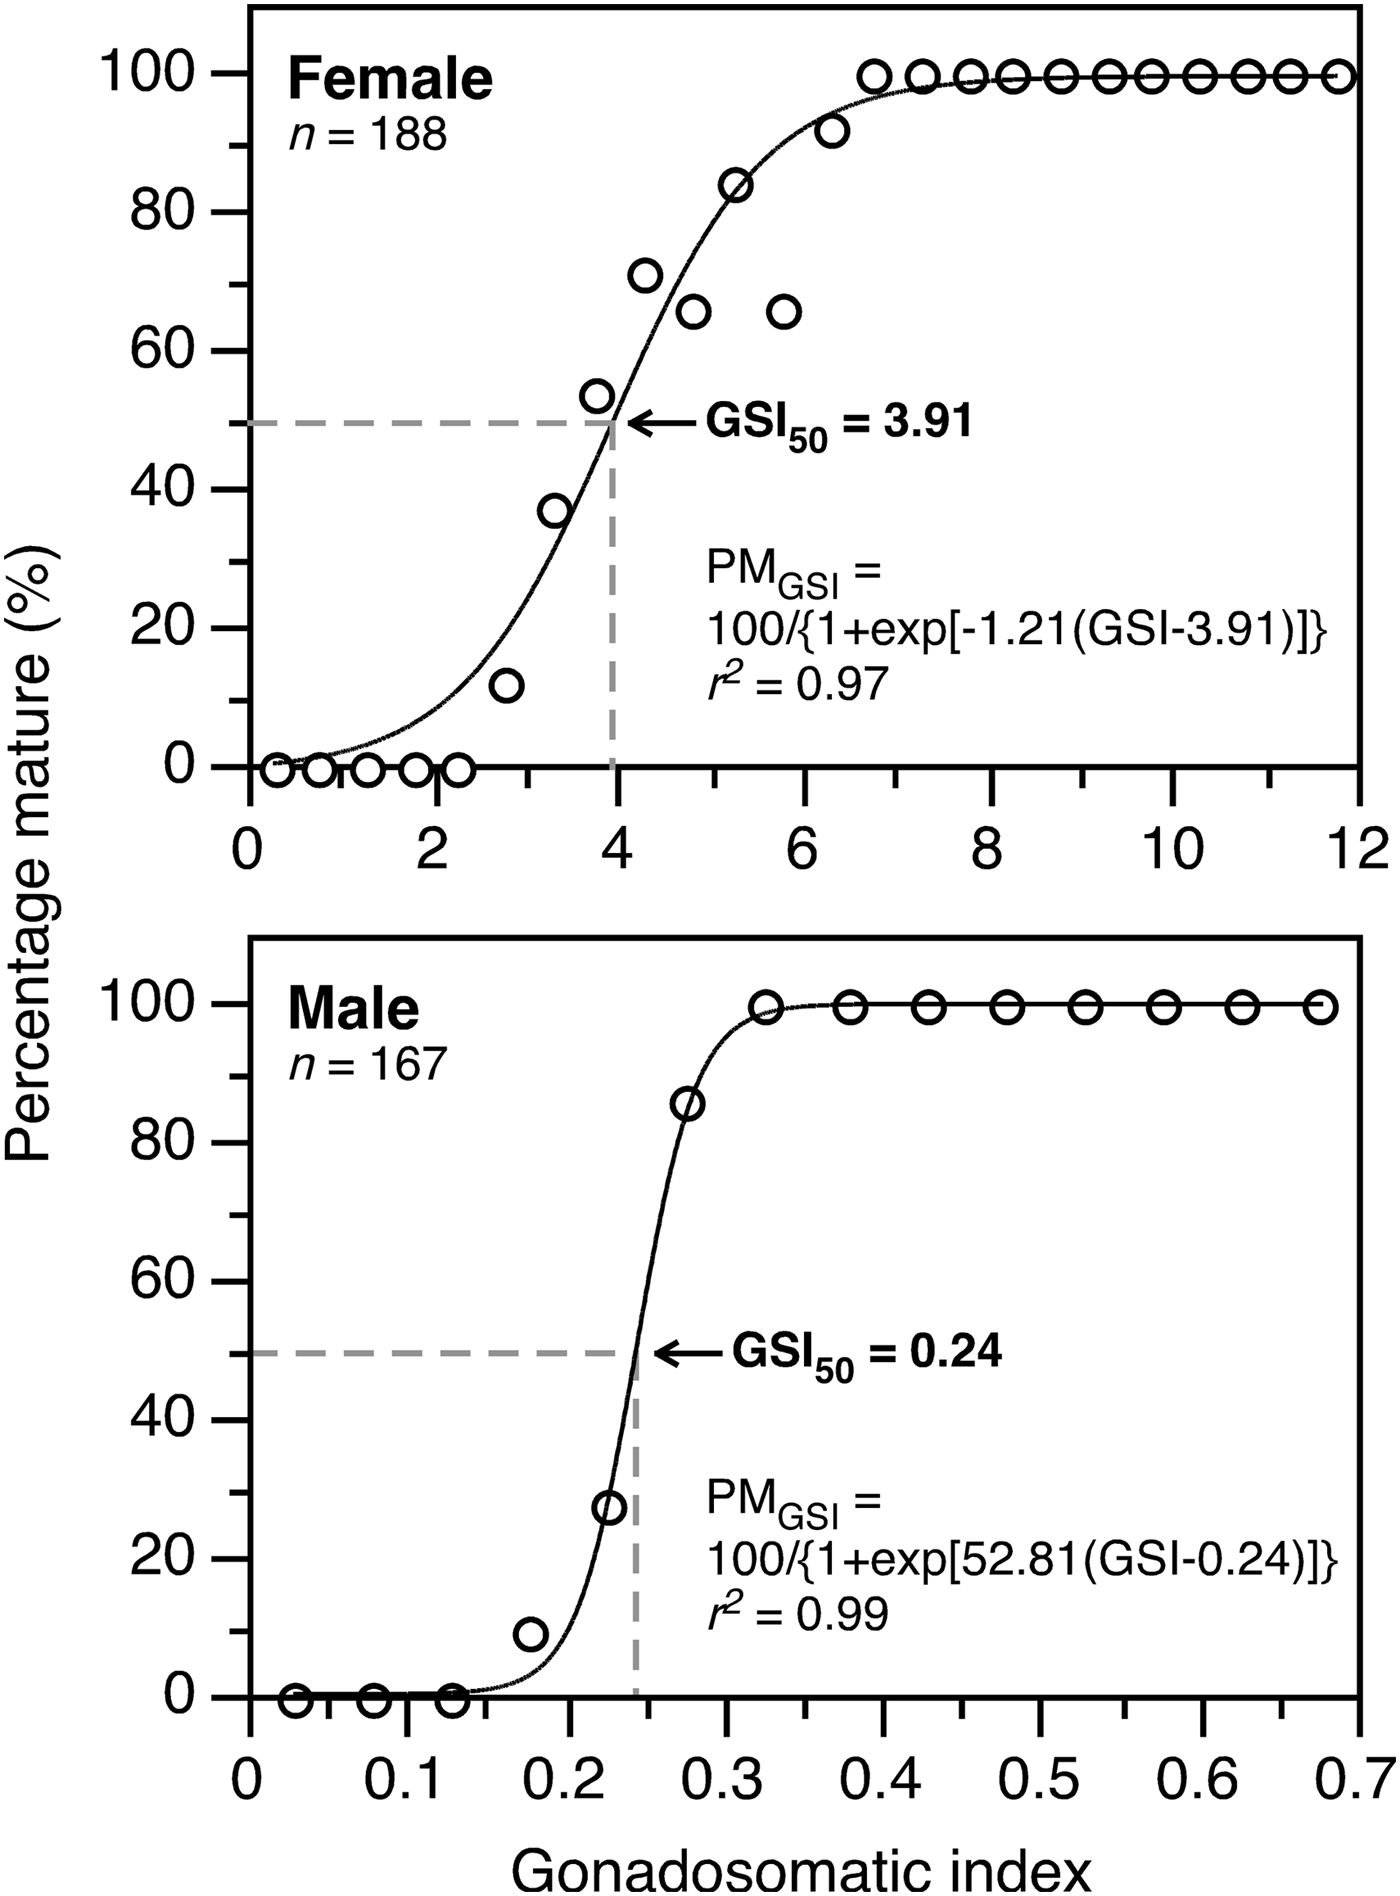
In both ovaries and testes, box and whisker plots of the GSI at each developmental stage were created to determine the GSI range at which each developmental stage occurred. In the present study, females with tertiary yolk, migratory nucleus and hydrated ovaries were considered to be reproductively mature. This is because tertiary yolk stage oocytes form a distinct batch and had completed yolk accumulation with a similar size to migratory nucleus stage oocytes (see ‘Results: size–frequency distribution of oocytes’). In males, individuals with Stages III and IV were considered to be reproductively mature, since milt ran when pressed in fresh specimens of B. pterotum at these stages (Dalpadado, Reference Dalpadado1988). To estimate GSI at 50% maturity (GSI50), a logistic function was fitted to the fraction of mature fish per 0.5 GSI interval for females and 0.05 GSI interval for males using a non-linear least-squares regression. The logistic equation was
 $$PM_{GSI} = \displaystyle{{100} \over {1 + \exp \left\{{a \times \left({GSI - b} \right)} \right\}}}$$
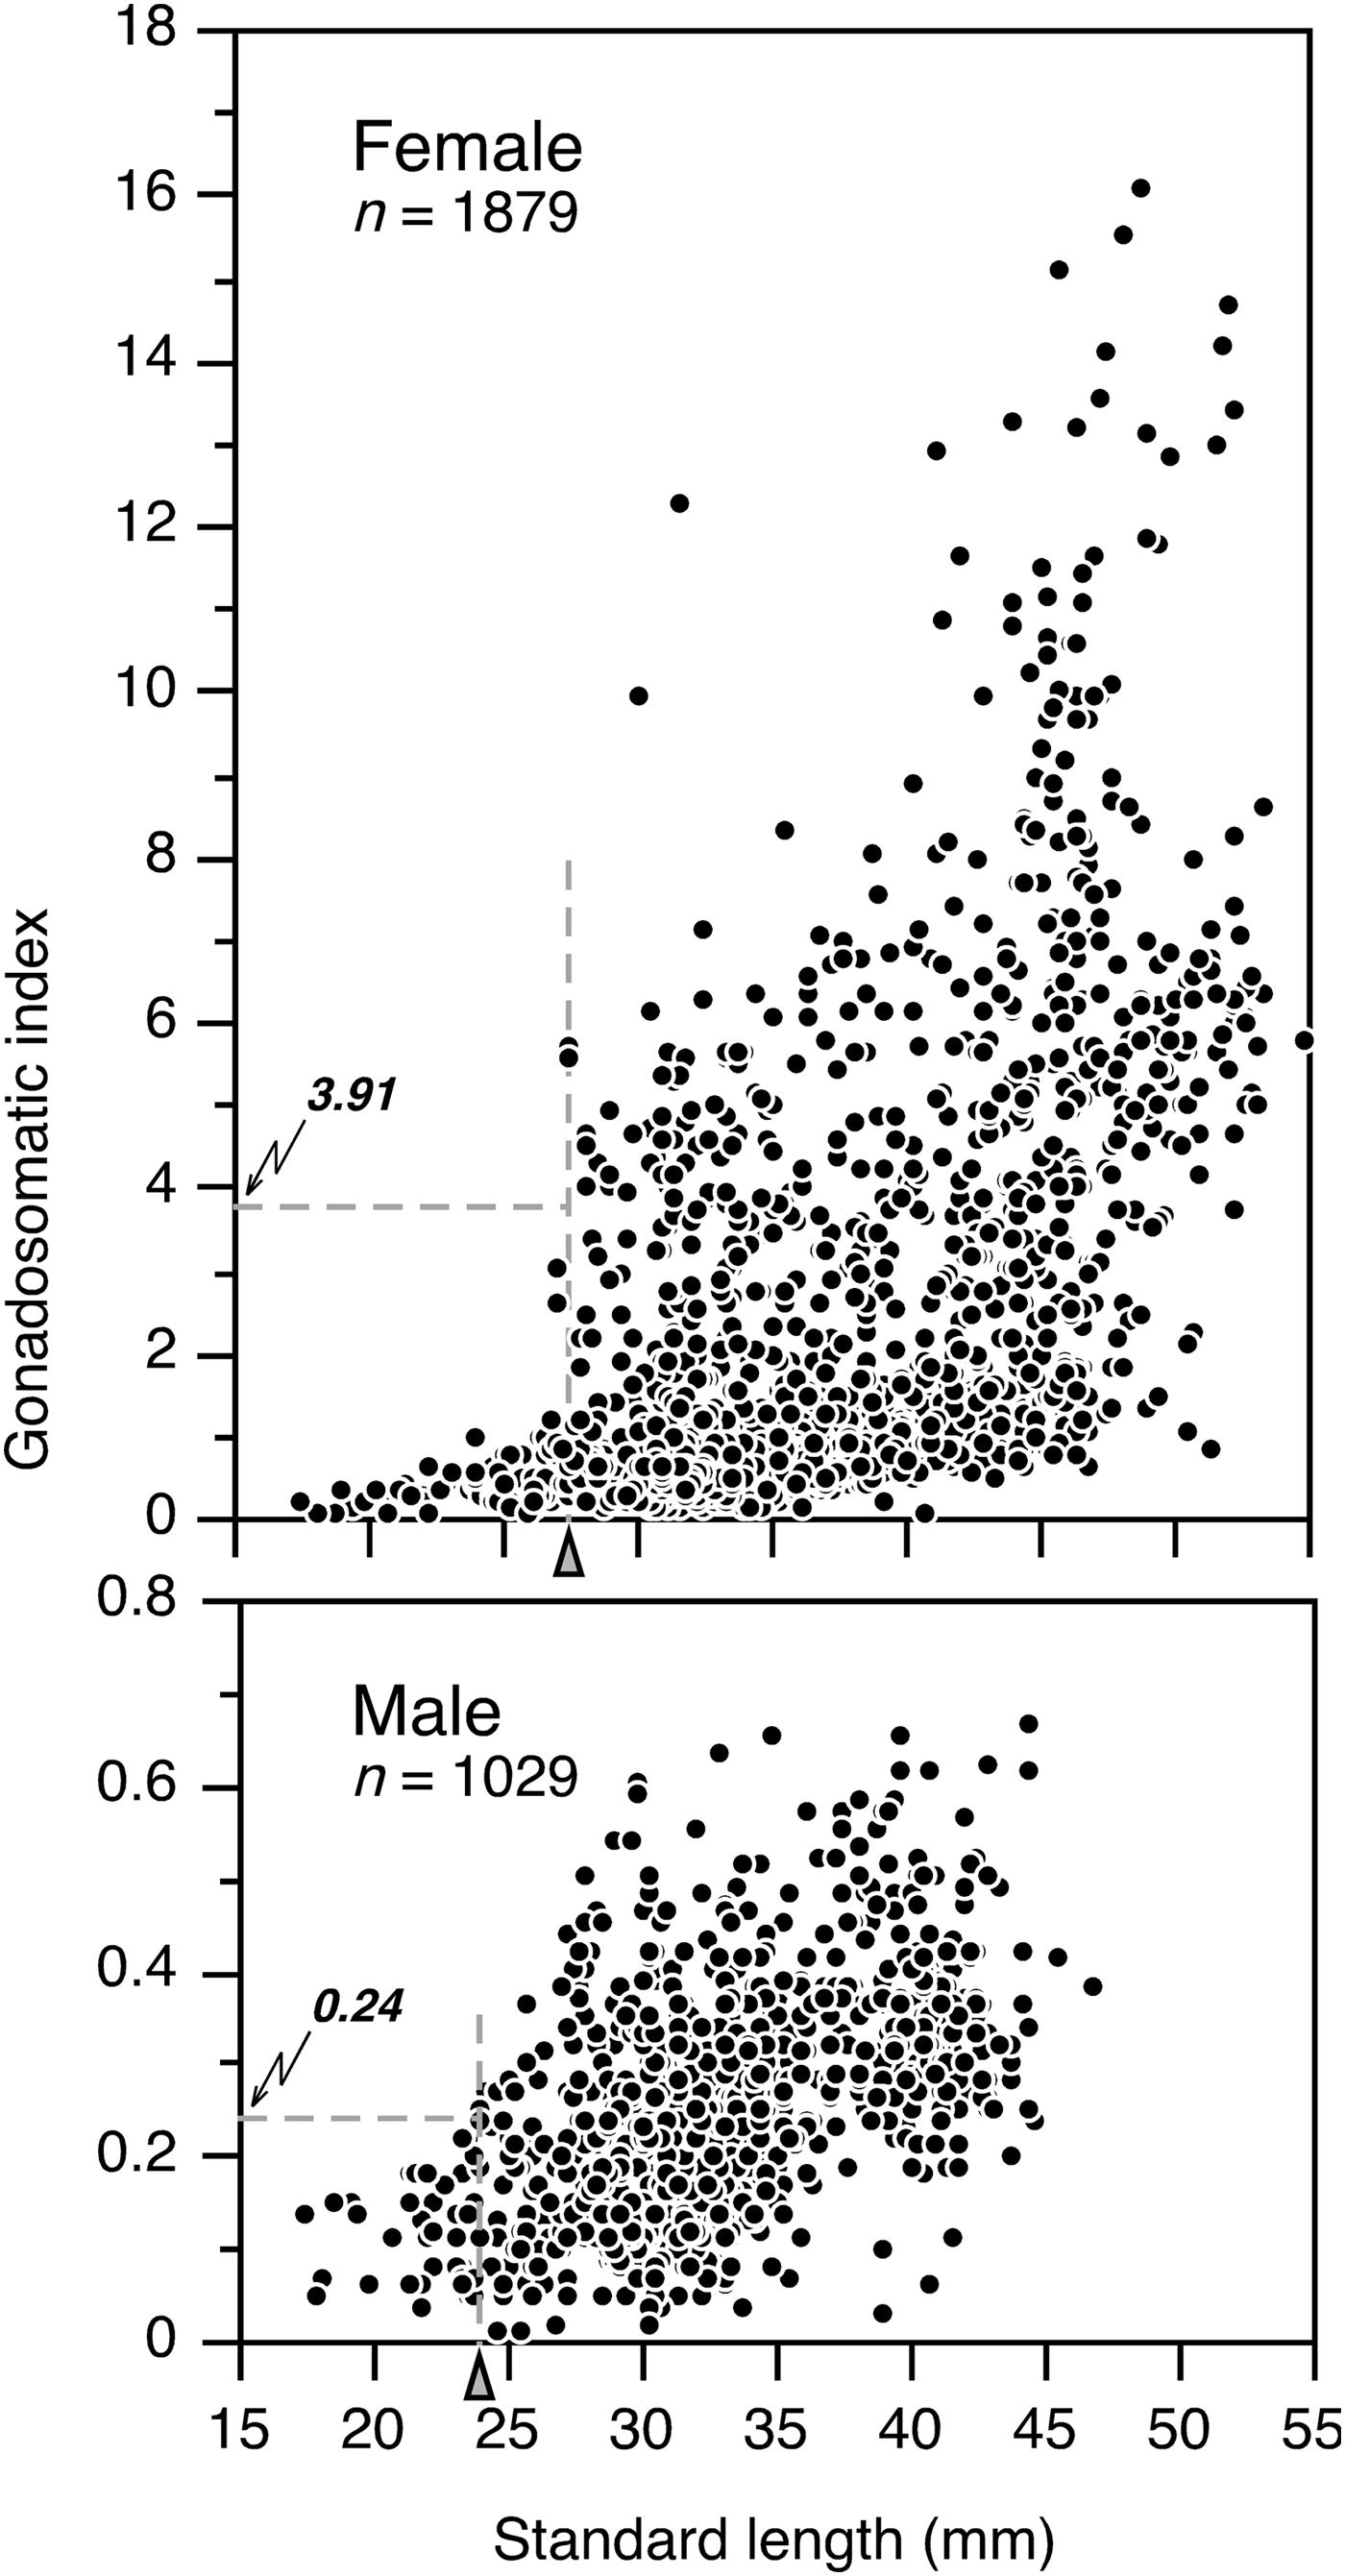
where PM GSI is the percentage mature at GSI, a is the slope and b is the GSI50. Minimum size at maturity of females and males was taken as the smallest specimen with a GSI over GSI50 based on the GSI–body length relationships.
Oocyte measurement
Size–frequency distributions of oocytes within each developmental stage were determined in order to describe the type (single or multiple batches) of maturation and spawning, based on ovaries from randomly selected specimens. The oocytes were teased apart using fine needles, then placed in a vial and shaken vigorously to complete separation. The contents of the vial were then poured into a counting chamber and the isolated oocytes were measured. Oocyte diameter was measured to the nearest 1 µm using a measurement system at 150× magnification, which was composed of a stereomicroscope and video camera connected to a monitor and computer (Nikon Instech Co. Ltd, Japan). From each ovarian stage 500 oocytes were examined. All oocytes ≥0.1 mm diameter were measured in the yolk vesicle stage, whereas at all other ovarian stages only oocytes ≥0.15 mm were measured. The 0.01 mm interval data series of the oocytes size were then smoothed using three-size interval running means. To determine the size of a hydrated egg, the maximum diameters of ~50 eggs (>0.5 mm) were also measured for 12 individuals.
Batch fecundity
To determine batch fecundity, 73 specimens with ovaries containing tertiary yolk, migratory nucleus and hydrated oocytes, collected in August 2004 and September 2005 when the primary spawning occurred, were used. Firstly, the diameter of 500 oocytes was measured to the nearest 1 µm in the mature individuals. Since the oocyte size–frequency data showed clear separate modes, we counted the number of oocytes in the most advanced mode. In our preliminary analysis, right and left lobes of the ovary were weighted separately and compared in 25 mature female fish, but there was no significant difference between them (Wilcoxon signed rank test, P > 0.05). Ishihara et al. (Reference Ishihara, Kubota and Yamada1995) also showed a similar result in B. pterotum. Therefore, in our analysis, the total number of eggs was estimated as double the count of the right lobe.
To estimate relative fecundity (eggs g−1), dry weight of B. pterotum was estimated from the body length using the following relationship:
 $$y = 0.0012x^{3.31} \lpar n = 52\comma \; r^2 = 0.983\rpar$$
where y is dry weight (mg) and x is SL (mm) (C. Sassa, unpublished data). Then, the mean and range in relative fecundity were determined and compared with the published information on populations in the Indian Ocean (e.g. Dalpadado, Reference Dalpadado1988).
Seasonal change of body size distribution
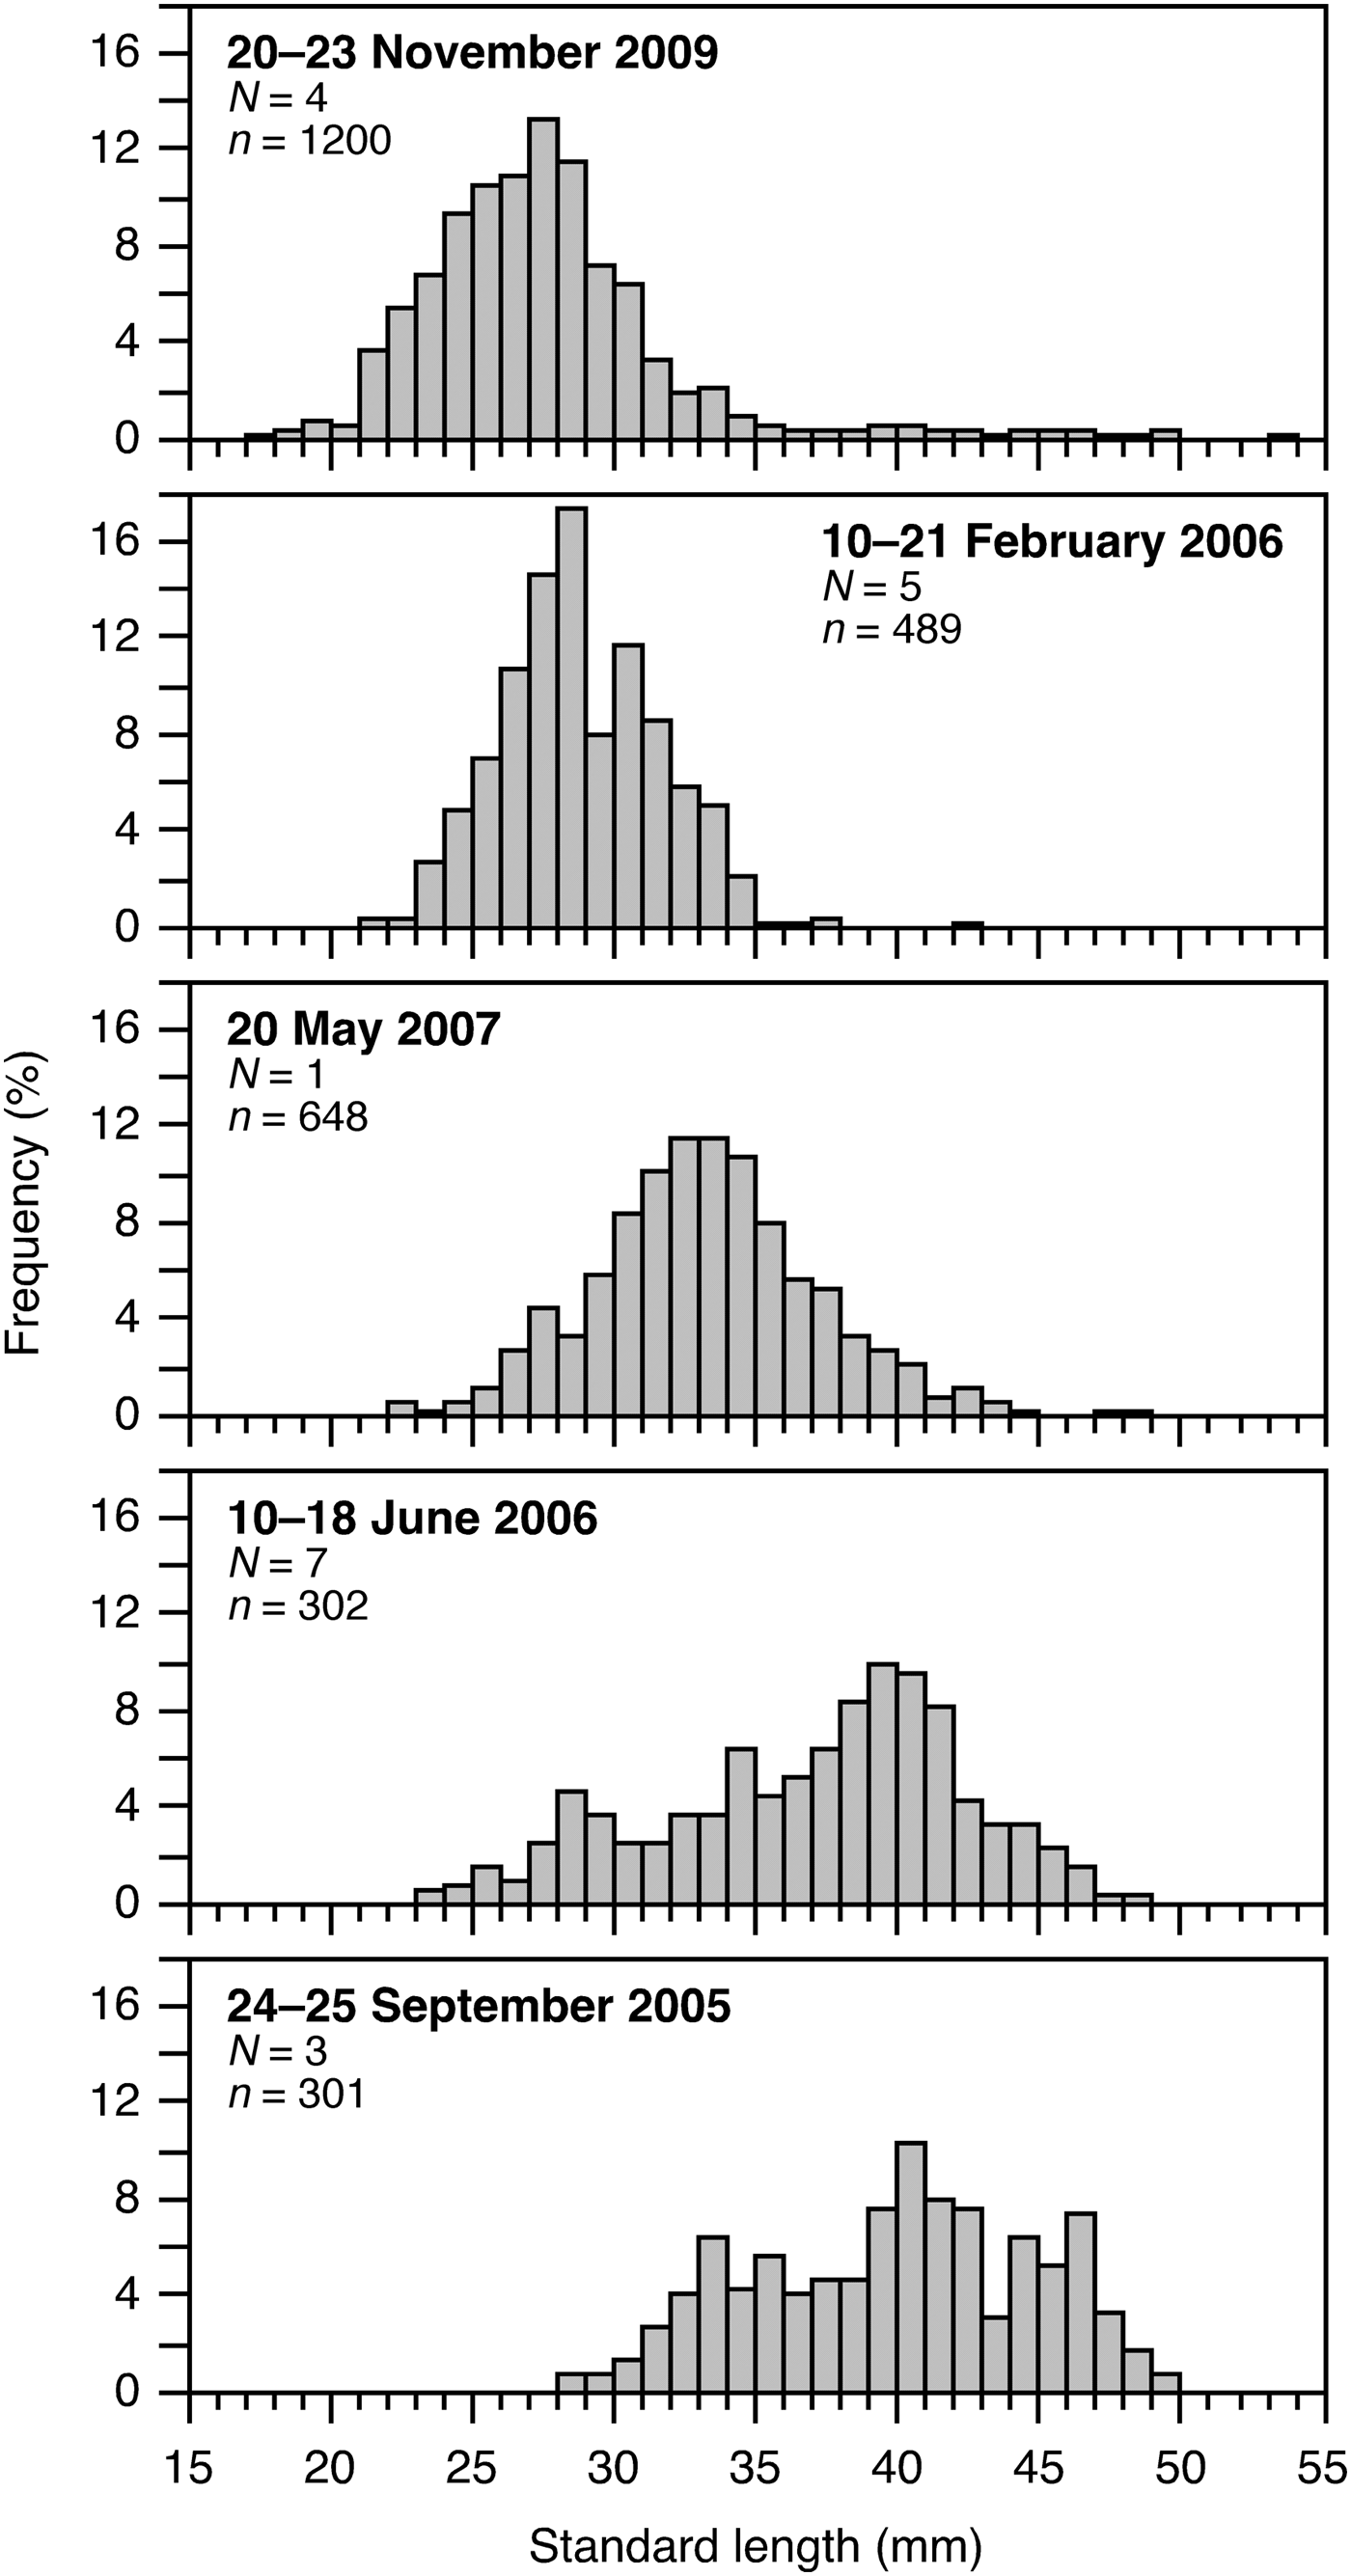
Seasonal change of SL–frequency distributions of B. pterotum was assessed based on data from daytime bottom trawling in the shelf region of the ECS between 28° and 31°30′N and between 124° and 127°E where dense distributions were observed (Figure 1; Sassa et al., Reference Sassa, Tsukamoto, Yamamoto and Tokimura2010). Random samples (301–1200 individuals) were collected at 1–7 stations in September 2005, February and June 2006, May 2007 and November 2009; SL of B. pterotum were measured to the nearest 0.1 mm with a slide caliper.
RESULTS
Sex-ratios
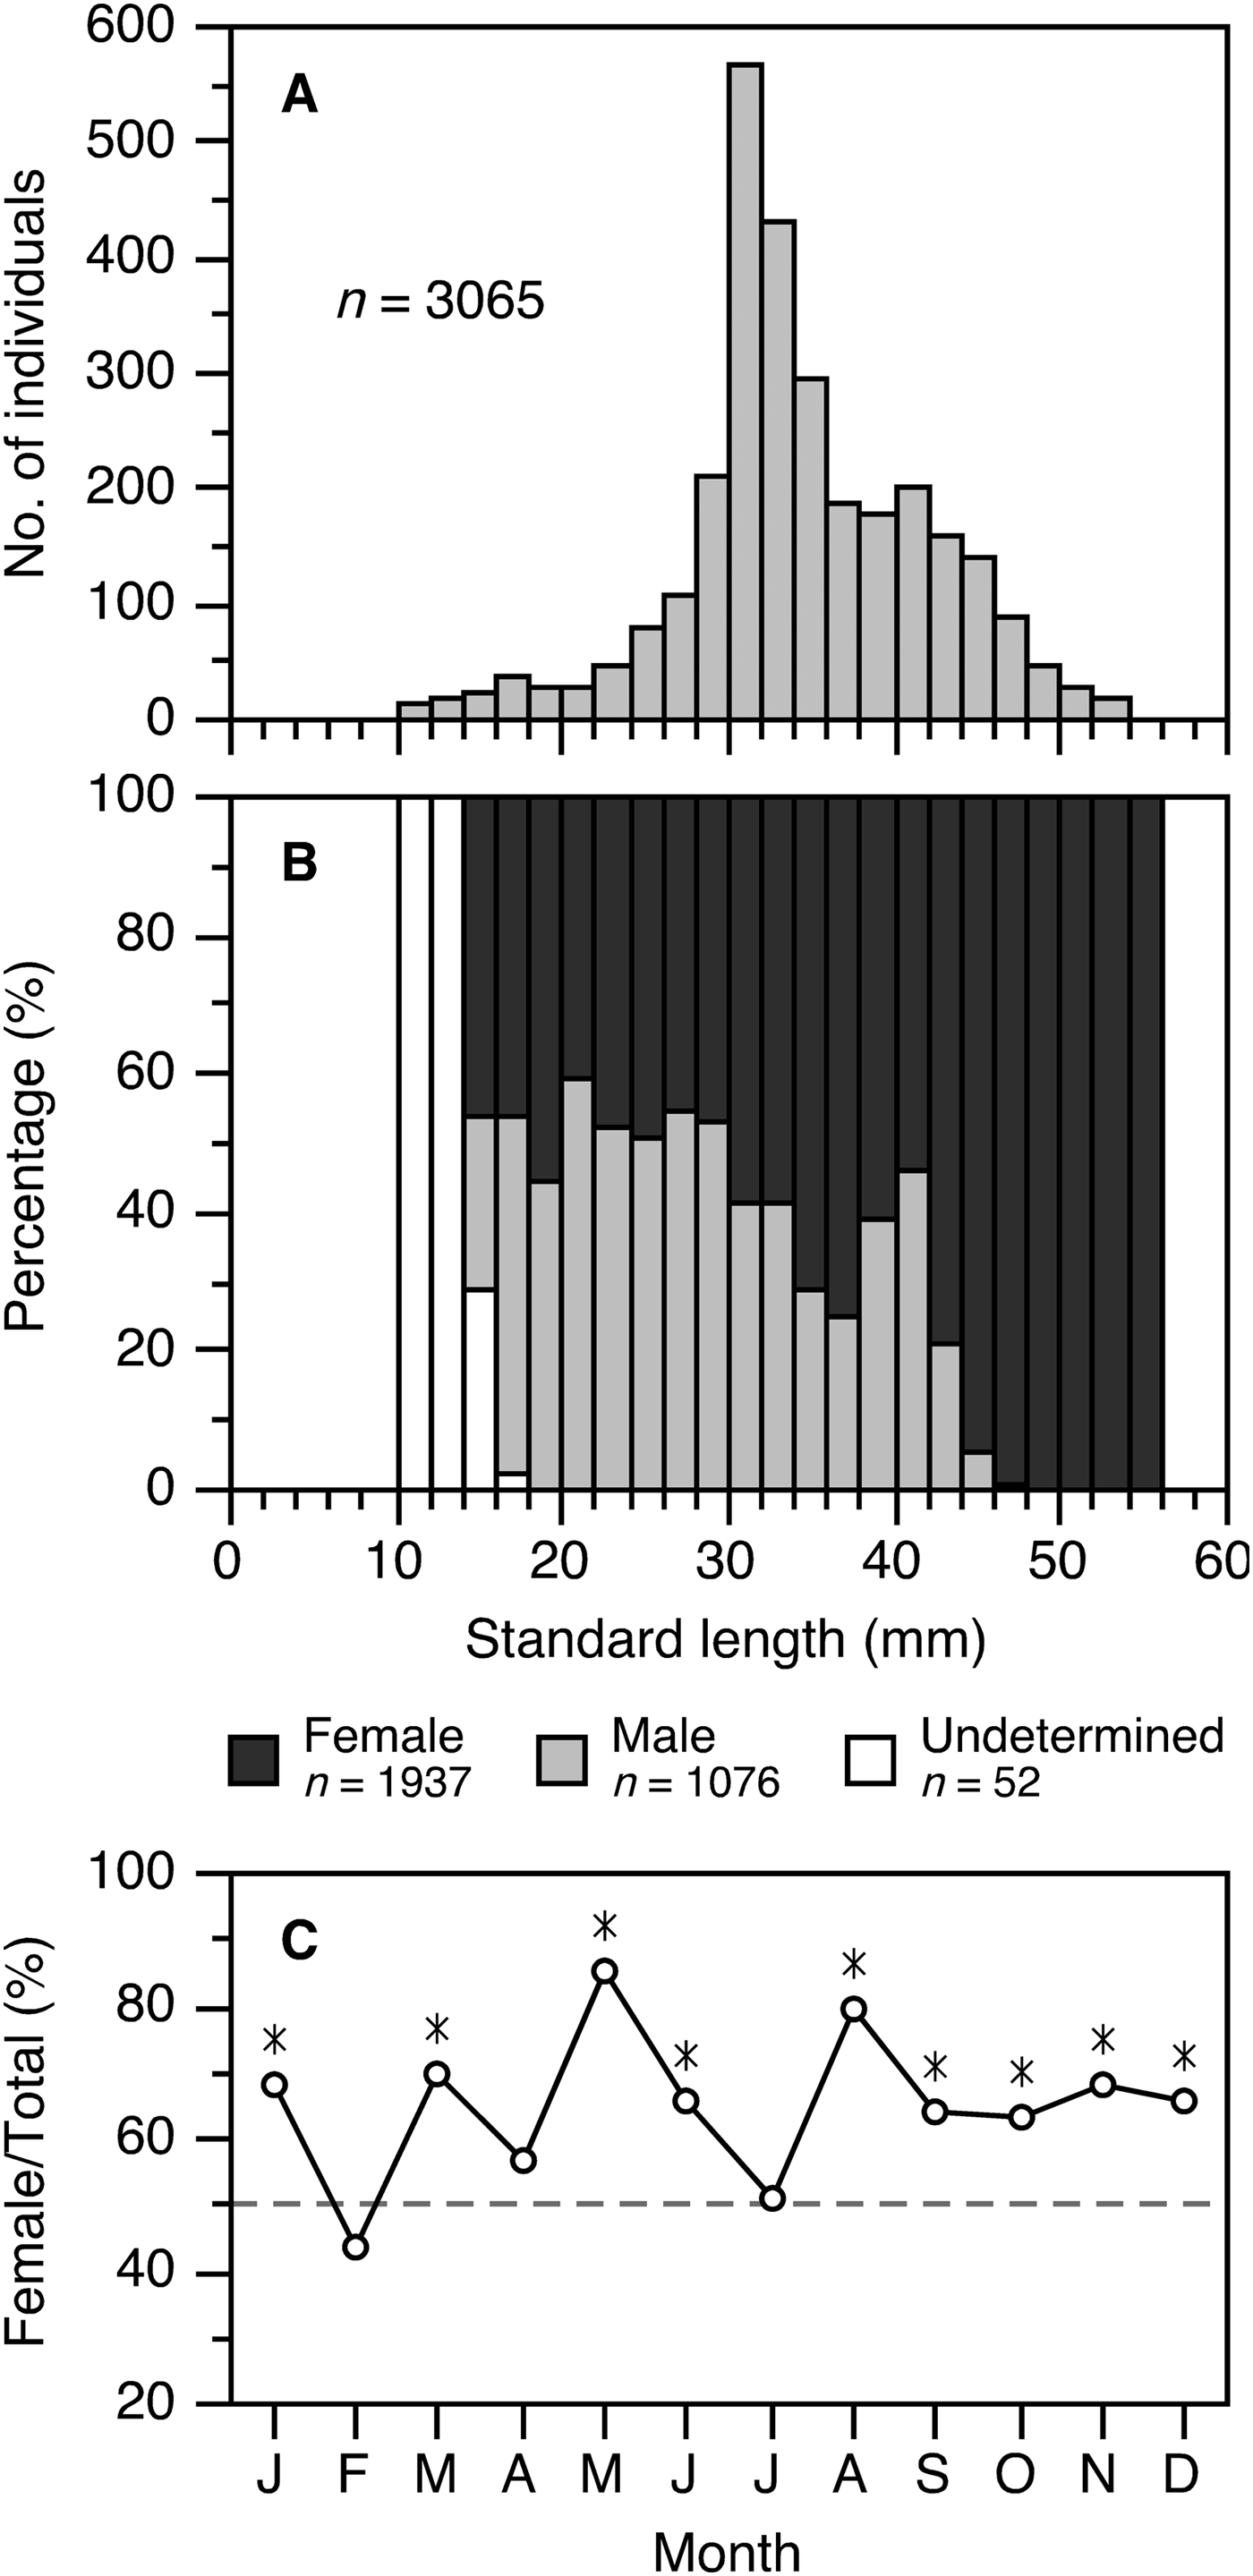
In fish <14 mm SL it was possible to distinguish between sexes from examination of the gonads (Figure 3B). An overall ratio of females to males was 1.67:1 (n = 2898), and differed significantly from parity (χ2-test, df = 1, P < 0.05). The preponderance of females over males was significant throughout the year (χ2-test, df = 1, P < 0.05), except in February, April and July when the sex-ratio was almost 1:1 (P > 0.05) (Figure 3C). Between 14 and 30 mm SL, the ratio of females to males was ~1:1; it increased with SL, and all specimens ≥46 mm SL were females (Figure 3B).
(A) Length–frequency distribution of Benthosema pterotum examined; (B) percentage of sex in relation to the standard length; (C) female/total ratio in each sampling month. Asterisks in C represent months when females were significantly more abundant than males (χ2-test, P< 0.05). n, total number of fish analysed.
Relationships between GSI and developmental stages of gonad
Gonadosomatic index was positively correlated with gonad stages in both sexes (Figure 4). In females, the GSI values of the perinucleolus and yolk vesicle stages ranged from 0.5 to 2, increasing greatly during the yolk stages, and reaching from 10 to 16 in the hydrated stage. The GSI in males was much lower than females (Figure 4). In males, the GSI values of Stages I and II were from 0.04 to 0.11 and from 0.08 to 0.28, respectively. Stages III and IV occurred at GSI from 0.15 to 0.65 and from 0.25 to 0.65, respectively, with a considerable overlap between them (Figure 4).
Relationship between developmental stages of ovary and testis and gonadosomatic index (GSI) of Benthosema pterotum. The box and whisker plots indicate the GSI range where each developmental stage occurred. Numbers beside the plots are the number of fish analysed.
The GSI50 was found to be 3.91 for females, based on fitting to a logistic function (Figure 5). The GSI50 of males was 0.24, which was only ~1/17 that of females (Figure 5). In this study, we regarded females with GSI ≥ 3.91 and males with GSI ≥ 0.24 as reproductively mature.
Relationship between gonadosomatic index (GSI) and percentage of mature females and males of Benthosema pterotum in the East China Sea. Curve is fitted to a logistic function. Females with tertiary yolk, migratory nucleus and hydrated stages and males with Stages III and IV are considered reproductively mature. GSI50, GSI at 50% sexual maturity.
Minimum size at sexual maturity
Based on the GSI–body length relationships and GSI50, females with GSI ≥ 3.91 were observed in individuals ≥28 mm SL, and males with GSI ≥ 0.24 were observed in individuals ≥24 mm SL (Figure 6). Therefore, females and males can mature at sizes larger than 28 mm and 24 mm SL, respectively.
Relationship between standard length (mm) and gonadosomatic index (GSI) of Benthosema pterotum. Horizontal dotted lines indicate the GSI at 50% sexual maturity (GSI50), and arrowheads at the horizontal axis indicate the minimum size at sexual maturity. n, total number of fish analysed.
Monthly changes in GSI and HSI
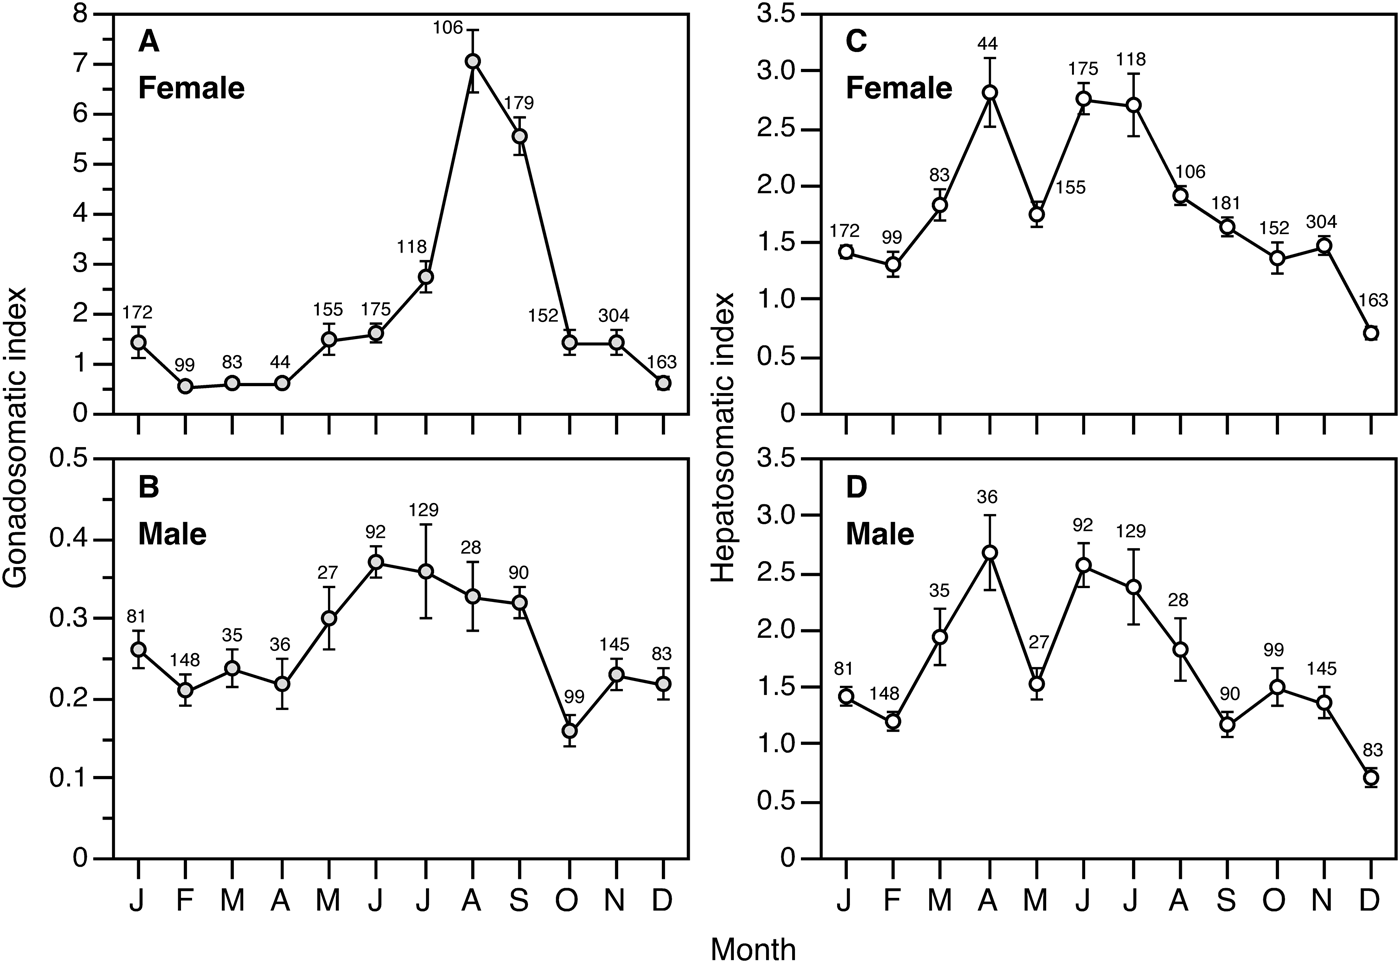
Mean GSI of females (≥28 mm SL) increased gradually from May, reaching a peak during August to September with a mean GSI of <5, then decreasing drastically and remaining at low values of <1.5 until April (Figure 7A). Although mature females having GSI of ≥3.91 occurred during May to January, the percentage of them exceeded 90% in August and September, i.e. the primary spawning period. Mean GSI of males (≥24 mm SL) during May to September showed higher values (>0.3) compared to those of other months, although the monthly change in GSI of males was less marked than that of females (Figure 7B).
Monthly changes in the mean gonadosomatic index and hepatosomatic index of females (≥28 mm standard length (SL)) and males (≥24 mm SL) of Benthosema pterotum. Data of the same months from different years were pooled for respective months. Error bars indicate 95% confidence intervals. Numbers adjacent to the error bars show the number of fish examined in each month.
Mean HSI began to increase in both sexes in March, and showed high values of 2.4–2.8 during April–July, except in May (Figure 7C, D). Mean HSI declined during August–September when the main spawning occurred.
Seasonal change of body size distribution
Although the seasonal surveys were conducted over four different years, small individuals of Benthosema pterotum (20–30 mm SL) began to occur abundantly in November, and modal body lengths increased progressively from February to September in the shelf region of the ECS (Figure 8). The seasonal change of body size distribution corresponded closely with the estimated reproductive seasonality.
Seasonal change of size–frequency distributions of Benthosema pterotum, based on data from daytime bottom trawling in the shelf region of the East China Sea between 28° and 31°30′N and between 124° and 127°E. N, total number of sampling stations; n, total number of fish measured.
Size–frequency distribution of oocytes
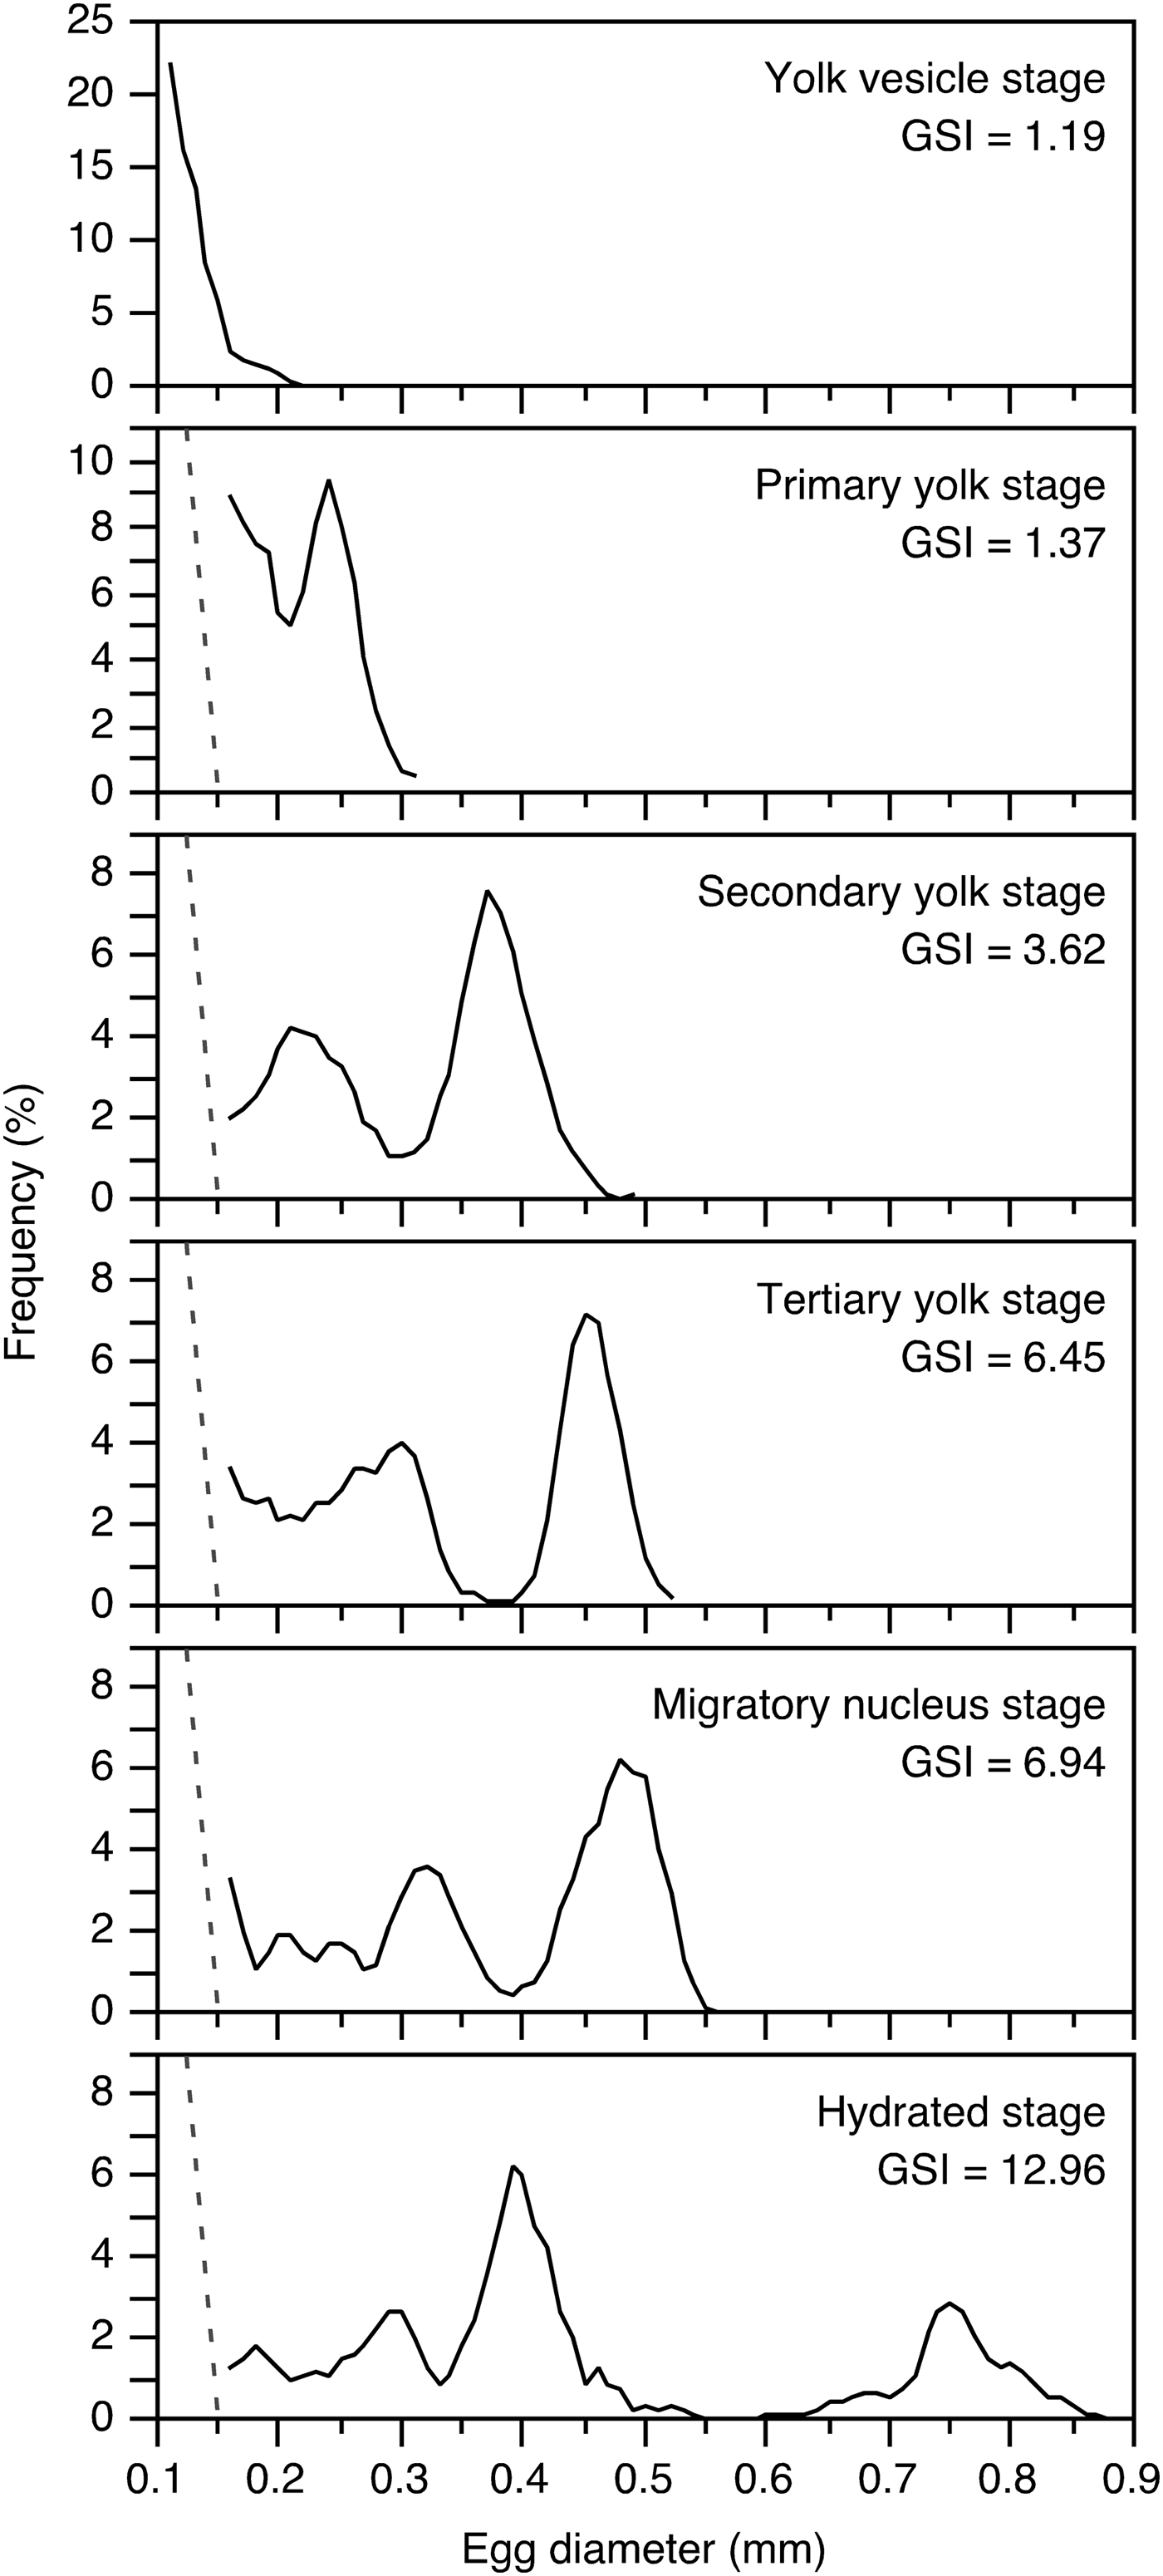
The size of all the oocytes in a cohort gradually increased in synchrony with ovarian development (Figure 9). As an advanced group of the oocytes reached the secondary yolk stage, they form a clear separate mode that is distinct from adjacent groups of smaller oocytes. Between the secondary yolk and hydrated stages, the oocytes in the most advanced batch increased in size greatly, and reached 0.6–0.85 mm in the hydrated stage (Figure 9). In addition, a secondary advanced batch also gradually increased in size, but remained smaller than 0.45 mm. This multi-modal oocyte size-frequency showed that B. pterotum are multiple spawners within a spawning season.
Size–frequency distributions of oocyte at the different stages of maturation in the ovaries of Benthosema pterotum. All oocytes ≥0.1 mm diameter were measured in the yolk vesicle stage, whereas at all other ovarian stages only oocytes ≥0.15 mm were measured.
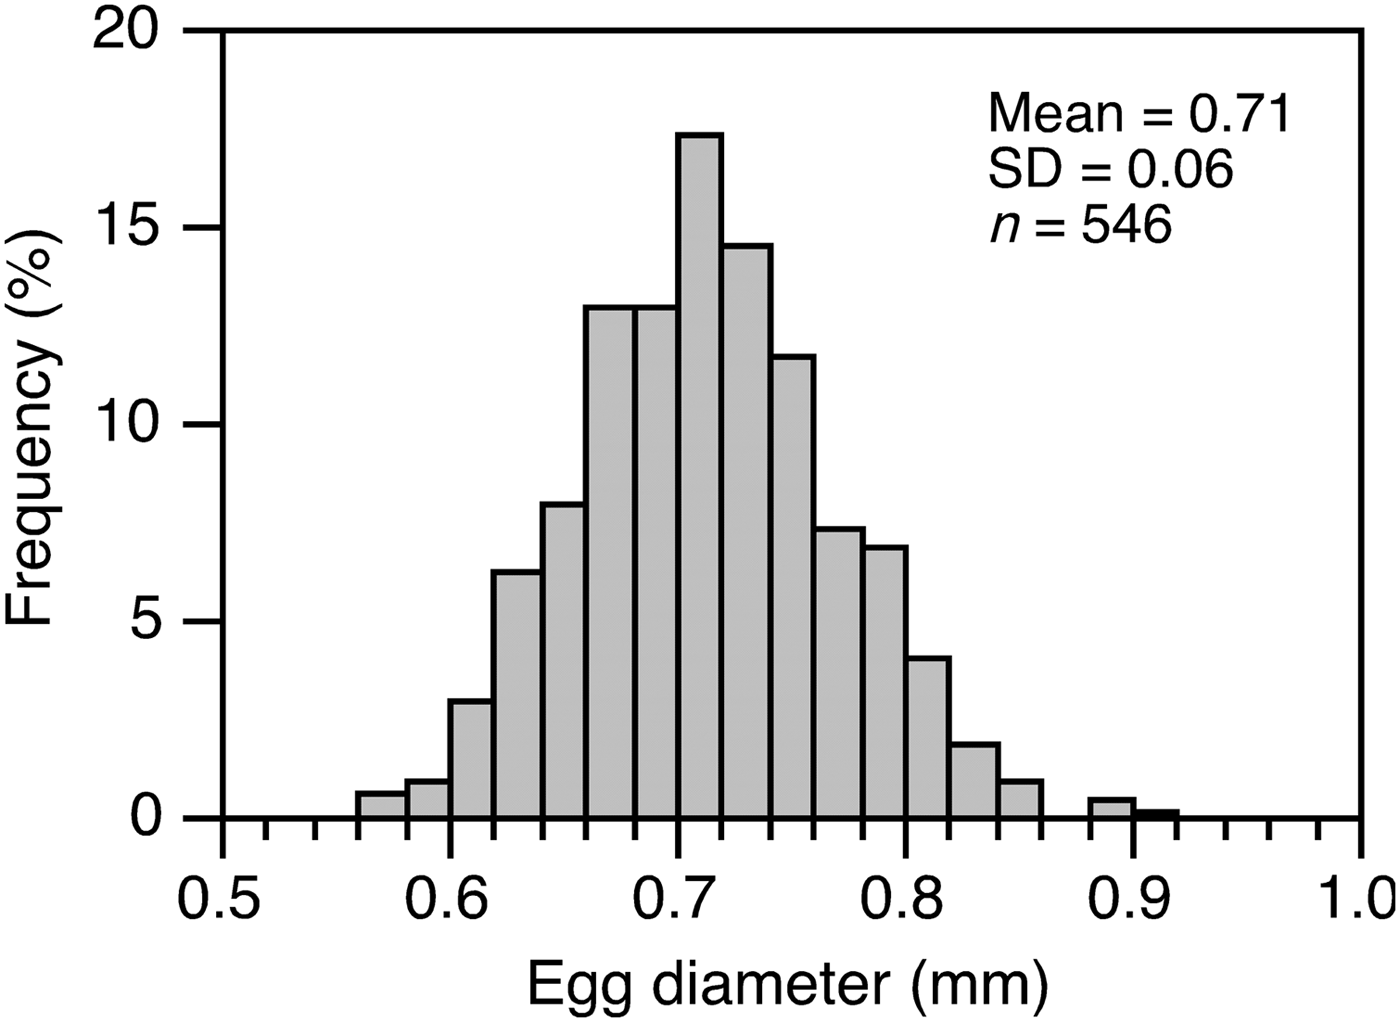
Egg size at the hydration stage ranged from 0.55 to 0.85 mm, with mean ±SD of 0.71 ±0.06 mm (Figure 10). There was no correlation between fish size and the egg size (r 2 = 0.013, df = 11, P > 0.05).
Size–frequency distribution of hydrated eggs from mature females of Benthosema pterotum. n, number of eggs measured.
Batch fecundity
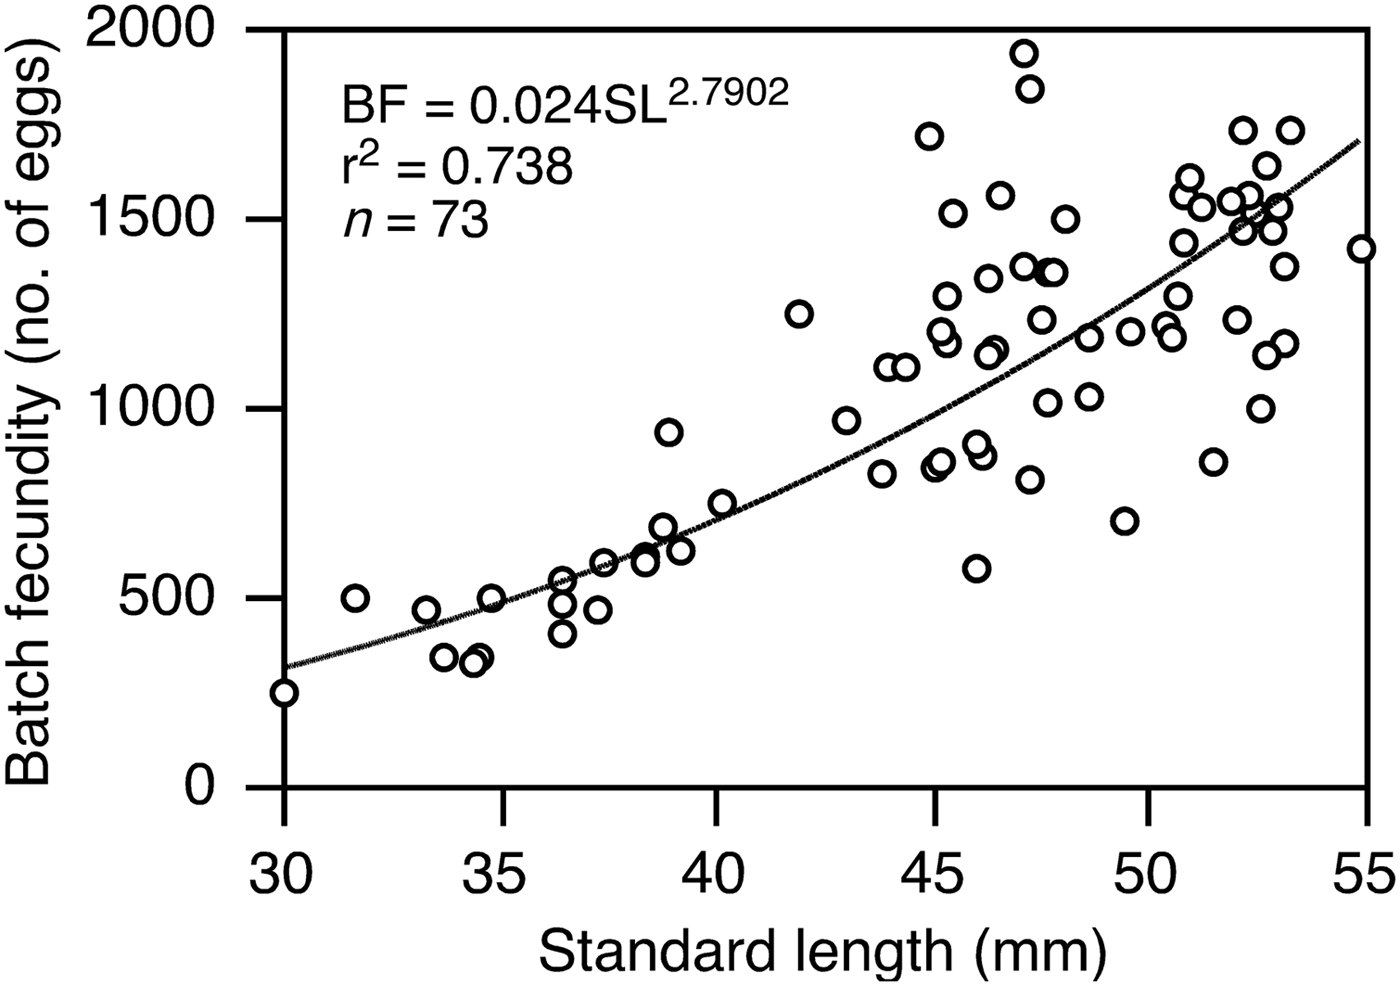
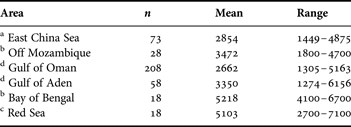
The batch fecundity was determined from 73 mature fish taken in August 2004 and September 2005 when the main spawning occurred. Batch fecundity was positively correlated with SL, ranging from 253 to 1942 eggs (1092 ±50, mean ±standard error (SE)) in fish from 30.1 to 54.8 mm SL, with a high intraspecific variability in ≥45 mm SL (Figure 11). The relationship between batch fecundity (BF) and SL was BF = 0.024SL2.7902 (r 2 = 0.74, df = 72, P > 0.05) (Figure 11). In individuals ≥40 mm SL there was a mean of 525 eggs in the ovaries, which increased to a mean of 1278 eggs in individuals ≥40 mm SL (Figure 11). Relative fecundity ranged from 1449 to 4875 eggs g−1 (2854 ±87, mean ±SE) (Table 3).
Batch fecundity (BF) as a function of standard length of Benthosema pterotum in the shelf region of the East China Sea. n, total number of fish analysed.
Summary of relative fecundity (eggs g−1) of Benthosema pterotum from different areas. n, number of fish examined.
a, this study; b, Dalpadado (Reference Dalpadado1988); c, Dalpadado & Gjøsæter (Reference Dalpadado and Gjøsæter1987); d, Hussain & Ali-Khan (Reference Hussain and Ali-Khan1987). Relative fecundity is estimated from mean batch fecundity at mean standard length (SL) and dry weight–SL relationship by Dalpadado (Reference Dalpadado1988).
DISCUSSION
Sex-ratios
Sampling design and fish behaviour can affect sex-ratios, via unequal sampling effort at depths or through sex-related capabilities related to net avoidance and escapement (Young et al., Reference Young, Blaber and Rose1987; Gartner, Reference Gartner1993). In this study, however, these factors could be eliminated as potential sources of bias because we sampled over almost the whole distribution depth range during both day and night, and net mouth opening size of the sampling gears we used was large enough to collect the entire size range of mature Benthoesema pterotum.
In the present study, there were more females than males in the catches (Figure 3C), corresponding with the previous study of this species in the Indian Ocean (Dalpadado, Reference Dalpadado1988). In addition, the ratio of females to males was ~1:1 between 14 and 30 mm SL; it increased with SL, and all individuals ≥46 mm SL were females (Figure 3B). A similar pattern was observed in B. pterotum in the Indian Ocean and the Red Sea (Dalpadado & Gjøsæter, Reference Dalpadado and Gjøsæter1987; Dalpadado, Reference Dalpadado1988), and in some other myctophid species in the world's oceans (Nakamura, Reference Nakamura1970; Clarke, Reference Clarke1983; Lisovenko & Prut'ko, Reference Lisovenko and Prut'ko1987; Young et al., Reference Young, Blaber and Rose1987; Gartner, Reference Gartner1993; Moku, Reference Moku2000). This might be related to sexual differences in growth rate and life span (Clarke, Reference Clarke1983), i.e. faster growth and longer life span of females than of males. Although information on sexual differences in growth and life span is not available for B. pterotum to confirm this conclusion, in several myctophid species females grow faster than males and reach a larger maximum size (Linkowski et al., Reference Linkowski, Radtke and Lenz1993; Linkowski, Reference Linkowski1997; Greely et al., Reference Greely, Gartner and Torres1999). The observed pattern of sex-ratio would result in a greater biomass of mature females than of males, possibly an adaptation to maximize the egg-producing biomass (Clarke, Reference Clarke1983; Young et al., Reference Young, Blaber and Rose1987).
GSI and minimum size at maturity
In myctophids there is little information on the relationship between GSI and developmental stage of gonads, although this is useful for assessing maturity. In Lampanyctodes hectoris on the continental slope of eastern Tasmania, GSI was positively correlated with gonad stage determined by morphological and histological examination in both females and males (Young et al., Reference Young, Blaber and Rose1987), corresponding with our results. In this study, GSI at maturity of B. pterotum females expressed by GSI50 was found to be 3.91. In other myctophid species of Diaphus garmani and D. chrysorhynchus that occur abundantly in the slope region of the ECS (Ohshimo et al., Reference Ohshimo, Yasuda, Tanaka and Sassa2012), GSI50 of females showed similar values of 3.6–3.9 to B. pterotum (C. Sassa, unpublished data). In B. pterotum males, GSI50 was much lower than that of females (0.24 vs 3.91). In our preliminary histological observations, spermatozoa began to occur at GSI ranging from 0.2 to 0.3, validating the GSI at maturity of males estimated in this study. A lower GSI of males than of females has been reported for several other myctophids from subtropical–tropical to subarctic waters (Clarke, Reference Clarke1983; Young et al., Reference Young, Blaber and Rose1987; Moku, Reference Moku2000). Generally, in pelagic fish (e.g. sardine and anchovy) that release eggs and sperm into the pelagic layer, males show comparable GSI values to those of females (Kawasaki, Reference Kawasaki1982; Ohshimo et al., Reference Ohshimo, Yoda, Itasaka, Morinaga and Ichimaru2006), thus the low GSI of male B. pterotum suggests that there is a mechanism related to efficient mating and fertilization.
In many myctophid species, including B. pterotum, spawning is reported to occur at night (Gjøsæter & Tilseth, Reference Gjøsæter and Tilseth1988; Gartner, Reference Gartner1993). Sexual dimorphism in luminous organs is known in many myctophids (Kawaguchi & Shimizu, Reference Kawaguchi and Shimizu1978; Herring, Reference Herring2007), and supracaudal and infracaudal luminous glands are observed only in mature females (≥28 mm SL) in B. pterotum (Ishihara et al., Reference Ishihara, Kubota and Yamada1995). The caudal organs can produce volleys of very fast, high intensity flashes, which are considered to relate to sexual recognition in myctophids (Barnes & Case, Reference Barnes and Case1974; Herring, Reference Herring2007). This bioluminescent sexual signalling might be used to facilitate communication between sexes of B. pterotum at night, and this is possibly related to efficient mating, although there have been no direct observations to verify this. In addition, Hara (Reference Hara2007) found an unusual morphology of sperm in several myctophid species, i.e. biflagellate sperm having numerous small spherical mitochondria in close contact with the nuclear membrane. These numerous mitochondria are thought to enable enhanced energy supply and relate to an extension of sperm motility, thus possibly relating to efficient fertilization in the pelagic layer, although the ultrastructure of the sperm of B. pterotum is yet to be determined.
In this study, females and males mature at sizes larger than 28 mm and 24 mm SL, respectively. Previous studies of B. pterotum in the Indian Ocean show size at sexual maturity of females to be ~27–29 mm SL, and the males mature at a smaller size of ~24–25 mm SL (Hussain & Ali-Khan, Reference Hussain and Ali-Khan1987; Dalpadado, Reference Dalpadado1988), showing no inter-regional variation in size at maturity. In some other reported myctophid species, males mature at smaller sizes than females (Clarke, Reference Clarke1983; Young et al., Reference Young, Blaber and Rose1987; Hussain, Reference Hussain1992; Gartner, Reference Gartner1993). This would also contribute to the greater biomass of mature females than of males, and to maximizing the egg-producing biomass.
Spawning season and recruitment
In this study, mean GSI of females peaked sharply during August–September, showing that the primary spawning period was during these months. Mean GSI of males was high during May–September, showing an earlier and longer peak of GSI than that of females, a pattern reported for many marine fish (e.g. Kawasaki, Reference Kawasaki1982; Yoneda et al., Reference Yoneda, Miura, Mitsuhashi, Matsuyama and Matsuura2000, Reference Yoneda, Tokimura, Fujita, Takeshita, Takeshita, Matsuyama and Matsuura2001; Shimose & Tachihara, Reference Shimose and Tachihara2006). In our study area, B. pterotum larvae occur abundantly during late summer–autumn, but rarely during winter–spring (Yamada et al., Reference Yamada, Tokimura, Horikawa and Nakabo2007; C. Sassa, unpublished data), corresponding with the present results. Occurrences of both mature females and larvae confirmed that B. pterotum reproduced in the study area, which is a markedly shallower area than previous reports for the spawning grounds of myctophids (Gjøsæter & Kawaguchi, Reference Gjøsæter and Kawaguchi1980; Brodeur & Yamamura, Reference Brodeur and Yamamura2005; Sassa et al., Reference Sassa, Tsukamoto, Yamamoto and Tokimura2010).
Differences in the spawning seasons between latitudes and areas are reported in several broadly distributed myctophid species, such as Benthosema suborbitale, Ceratoscopelus warmingii, Notolychnus valdiviae and Stenobrachius leucopsarus (Smoker & Pearcy, Reference Smoker and Pearcy1970; Clarke, Reference Clarke1973; Gartner, Reference Gartner1993). In the Indian Ocean, spawning of B. pterotum takes place throughout the year, with periods of maximum spawning—one during March–June and probably one during September–November—which correspond to the transition period between the monsoon seasons (Gjøsæter & Kawaguchi, Reference Gjøsæter and Kawaguchi1980; Gjøsæter, Reference Gjøsæter1984; Dalpadado, Reference Dalpadado1988; Gjøsæter & Tilseth, Reference Gjøsæter and Tilseth1988). Therefore, the primary spawning period of B. pterotum in the ECS which occurs during August–September was much shorter than that in the Indian Ocean. Generally, the water temperature, which reflects seasonal changes accurately, is the main factor that causes initiation and termination of the spawning period (Lam, Reference Lam, Hoar, Randall and Donaldson1983; Shimizu, Reference Shimizu2010). In the Indian Ocean, spawning of B. pterotum is expected to occur in waters of ~21–28°C (Gjøsæter & Tilseth, Reference Gjøsæter and Tilseth1988; Röpke, Reference Röpke1993). In our study area which is the northern fringe of the B. pterotum distribution (Yamada et al., Reference Yamada, Tokimura, Horikawa and Nakabo2007), water temperature reaches this optimum range during August–September when it is the highest of the year, with a mean sea surface temperature and temperature in the bottom layer of ~23–29°C and 15–22°C, respectively (Kondo, Reference Kondo1985; Sassa et al., Reference Sassa, Yamamoto, Tsukamoto, Konishi and Tokimura2009, Reference Sassa, Tsukamoto, Yamamoto and Tokimura2010; Yamashita et al., Reference Yamashita, Sakai, Katayama and Tokai2011).
Benthosema pterotum has a life cycle of one year (Gjøsæter, Reference Gjøsæter1984). In the ECS, the larvae hatched during the primary spawning period of August–September are considered to remain in the warm epipelagic layer above the seasonal thermocline for approximately one month (Ozawa & Peñaflor, Reference Ozawa and Peñaflor1990; C. Sassa, unpublished data). Based on data from seasonal daytime bottom trawl surveys, small individuals begin to occur abundantly in autumn, showing that the larvae reach the juvenile stage by autumn and undergo diel vertical migration. The modal body lengths increased progressively during spring–summer when water temperature increases and prey production is the highest of the year in the ECS shelf (Longhurst, Reference Longhurst2006; Xu & Chen, Reference Xu and Chen2007; Sassa et al., Reference Sassa, Yamamoto, Tsukamoto, Konishi and Tokimura2009). In this study, mean HSI of B. pterotum peaked during April–July, and declined during August–September, indicating that they stored materials and energy in the liver for reproduction.
Although we analysed the reproductive biology of B. pterotum based on a large number of specimens, instead of re-sampling the same population over a year, data of different annual cohorts in seven different years were pooled and analysed to obtain a seasonal picture of reproduction in this study (Table 1). However, in our data set, no large difference was observed in the seasonal pattern of GSI between the years. That is, the GSI of females was remarkably higher during August–September compared with the other months, without inter-annual variations. Therefore, we assume that the seasonal reproduction pattern described in this study is representative, although to confirm this pattern, seasonal sampling over a year of the same cohort is clearly needed.
Maturation-spawning type
In the Indian Ocean, B. pterotum is considered to spawn only once based on the frequency distribution of oocyte diameters and also the absence of spent fish (Dalpadado & Gjøsæter, Reference Dalpadado and Gjøsæter1987; Dalpadado, Reference Dalpadado1988). In this study, however, B. pterotum had oocyte size–frequencies characteristic of asynchronous oocyte development associated with the spawning of multiple batches in a spawning season, as observed in many epipelagic fish species (Wallace & Selman, Reference Wallace and Selman1981; Murua & Saborido-Rey, Reference Murua and Saborido-Rey2003; Kurita, Reference Kurita2006). Two to four modes of oocyte size–frequencies have been reported in some other myctophids, i.e. multiple spawners (Alekseyeva & Alekseyev, Reference Alekseyeva and Alekseyev1983; Clarke, Reference Clarke1984; Oven, Reference Oven1985; Young et al., Reference Young, Blaber and Rose1987; Hussain, Reference Hussain1992; Gartner, Reference Gartner1993), corresponding with our results.
In this study there were no B. pterotum females with postovulatory follicles in the histological examination, corresponding with the previous observation in the Indian Ocean (Dalpadado & Gjøsæter, Reference Dalpadado and Gjøsæter1987; Dalpadado, Reference Dalpadado1988). The absence or rarity of spent individuals is reported in many other myctophid species (Clarke, Reference Clarke1984; Gartner, Reference Gartner1993; Moku, Reference Moku2000; Brodeur & Yamamura, Reference Brodeur and Yamamura2005). Considering that B. pterotum is a multiple spawner within a spawning season, absence of spent individuals is probably related to rapid recovery from spawning in younger individuals, and to rapid onset of death in older individuals, as proposed by Clarke (Reference Clarke1984) and Gartner (Reference Gartner1993). To clarify this hypothesis, we need to determine the time course of oocyte development in detail.
Egg size and fecundity
In this study, egg size of B. pterotum at the hydration stage ranged from 0.55 to 0.85 mm. In the Indian Ocean, hydrated egg size in ovaries of B. pterotum ranged from ~0.55 to 0.9 mm (Dalpadado, Reference Dalpadado1988; Gjøsæter & Tilseth, Reference Gjøsæter and Tilseth1988; Hussain & Ali-Khan, Reference Hussain and Ali-Khan1988), showing little inter-regional variation in egg size. Clarke (Reference Clarke1984) also found that there was no difference in egg size between equatorial and near-Hawaii populations of several myctophid species. In congeneric B. suborbitale (24–32 mm SL) in subtropical–tropical oceanic waters, egg size at the hydration stage is from 0.52 to 0.6 mm (Clarke, Reference Clarke1984; Gartner, Reference Gartner1993). Furthermore, in many other myctophids, the egg size in ovaries ranges from 0.45 to 0.8 mm (Gjøsæter, Reference Gjøsæter1981; Kawaguchi & Mauchline, Reference Kawaguchi and Mauchline1982; Alekseyeva & Alekseyev, Reference Alekseyeva and Alekseyev1983; Clarke, Reference Clarke1984; Lisovenko & Prut'ko, Reference Lisovenko and Prut'ko1987; Gartner, Reference Gartner1993; Moku, Reference Moku2000; C. Sassa, unpublished data); i.e. that of B. pterotum appears to be slightly larger than these reports.
In our study, the batch fecundity of B. pterotum was positively correlated with body length, as in some other reported myctophid species (Nakamura, Reference Nakamura1970; Gjøsæter & Kawaguchi, Reference Gjøsæter and Kawaguchi1980; Hussain & Ali-Khan, Reference Hussain and Ali-Khan1987; Lisovenko & Prut'ko, Reference Lisovenko and Prut'ko1987; Young et al., Reference Young, Blaber and Rose1987; Dalpadado, Reference Dalpadado1988; Gartner, Reference Gartner1993). The batch fecundity ranged from 253 to 1942 eggs in fish from 30 to 55 mm SL, and this fell within the reported ranges of other myctophids of similar-sized species (Gjøsæter & Kawaguchi, Reference Gjøsæter and Kawaguchi1980; Clarke, Reference Clarke1984; Hussain & Ali-Khan, Reference Hussain and Ali-Khan1987; Lisovenko & Prut'ko, Reference Lisovenko and Prut'ko1987; Gartner, Reference Gartner1993). Considering that B. pterotum produce slightly larger but a similar number of eggs compared to other myctophids, they might have a correspondingly higher energetic cost for reproduction.
There were regional differences in the relative fecundity of B. pterotum among the ECS and various parts of the Indian Ocean and its adjacent sea areas (Table 3) (Dalpadado & Gjøsæter, Reference Dalpadado and Gjøsæter1987; Hussain & Ali-Khan, Reference Hussain and Ali-Khan1987; Dalpadado, Reference Dalpadado1988). Mean relative fecundity in the ECS (2854 eggs g−1) was a similar level to that in the area off Mozambique, in the Gulf of Oman and in the Gulf of Aden (2662–3472 eggs g−1), while it was approximately half of the values in the Bay of Bengal and the Red Sea (5103–5218 eggs g−1). Generally, fish species with asynchronous oocyte development largely depend on acquired energy from food during the spawning season for egg formation (Witthames et al., Reference Witthames, Greer-Walker, Dinis and Whiting1995; Kjesbu et al., Reference Kjesbu, Witthames, Solemdal and Greer-Walker1998; Kurita, Reference Kurita2006). Therefore, the observed regional difference in relative fecundity possibly relates to differences in habitat conditions, although the data are insufficient to conduct detailed analysis. In some myctophids (Ceratoscopelus warmingii, Notolychnus valdiviae, Hygophum proximum, and Triphoturus nigrescens), the Hawaiian population has higher relative fecundity than that from the equatorial upwelling area (Clarke, Reference Clarke1984). In future studies the relationship between food availability, fecundity and spawning frequency of B. pterotum needs to be studied to understand the reproductive strategy of myctophid fish (Clarke, Reference Clarke1984).
ACKNOWLEDGMENTS
We are grateful to the captains, officers, and crews of the RVs ‘Yoko-Maru’, ‘Soyo-Maru’, ‘Hokkou-Maru’, ‘Kumamoto-Maru’ and ‘Kaiyo-Maru No. 7’ for their assistance in the field. Drs K. Nishiuchi, Y. Aonuma, T. Hasegawa and K. Hoshino of the Seikai National Fisheries Research Institute and K. Yamamoto of the National Research Institute of Fisheries and Environment of Inland Sea kindly provided Benthosema pterotum specimens. We also thank Ms Y. Hashiguchi and Ms N. Takahashi of the Seikai National Fisheries Research Institute for helping with the biometric procedure.