Introduction
The objective of the study was to investigate the brain activation associated with reading comprehension and different orthographies in two Japanese writing systems, and in English, a second language. A remarkable characteristic of the Japanese writing systems (kanji, katakana, and hiragana) is that they present readers with the cognitive challenge of decoding different types of mappings of words to sound and to meaning. In the study, participants read kanji sentences and hiragana sentences, in their native language (L1 Japanese), and English sentences, in their second language (L2 English). The investigation of Japanese readers of English as a second language allows for a unique three-faceted comparison of reading different writing systems, with the L1 being written in a logographic system and in a non-alphabetic, syllabary system, and the L2 in an alphabetic, syllabic system.
Two hypotheses motivated this investigation. First, there should be differences in brain activation associated with the processing of Japanese kanji and Japanese hiragana writing systems. Even though kanji and hiragana are orthographies of the same language, the different mapping of print to phonology and to meaning requires readers to rely on different cognitive processes. Second, there should be differences in brain activation associated with the processing of English compared with Japanese. The L2–L1 differences are expected to reflect additional cognitive processes of reading in a foreign language, and in a different writing system in which the readers are relatively less proficient.
Logographic and syllabic writing systems and their brain representations
The brain activation associated with reading syllabic and logographic systems has both universal and orthography-specific characteristics. Syllabic systems have print mapped to sound at the level of a single letter and of letter combinations (graphemes) with varying degrees of regularity between languages (assembled phonology, see Tan, Laird, Li and Fox, Reference Tan, Laird, Li and Fox2005a). Logographic systems have print mapped to sound at the level of meaning (morphemes) (morpho-syllabic systems, see Perfetti et al., Reference Perfetti, Liu, Fiez, Nelson, Bolger and Tan2007). Reading logographic characters requires processing of visual and spatial information to access the mental lexicon and to access the pertinent lexical and phonological information to sound-out a word (addressed phonology, see Tan et al., Reference Tan, Laird, Li and Fox2005a).
The dual-coding model (Yamadori, Reference Yamadori2000; Thuy et al., Reference Thuy, Matsuo, Nakamura, Toma, Oga, Nakai, Shibasaki and Fukuyama2004) proposes a representation of the different cognitive processes of processing ideographic and syllabic systems in Japanese, i.e., kanji and katakana (kana), respectively. According to the model, the processing of kanji requires that readers access word semantics first (semantics-first system) during reading. Kana, in its turn, requires that readers access the phonology of the words first (phonology-first system) (Yamadori, Reference Yamadori2000). Meaning in kanji is intrinsic, or irregular, as determined by sound. Kana has definite phonetic values, and its syllabograms are unique (an extreme form of regular words) (Thuy et al., Reference Thuy, Matsuo, Nakamura, Toma, Oga, Nakai, Shibasaki and Fukuyama2004).
Two companion meta-analyses by Bolger, Perfetti and Schneider (Reference Bolger, Perfetti and Schneider2005) and Tan et al. (Reference Tan, Laird, Li and Fox2005a) reviewed neuroimaging studies of word-reading in Western European languages and in Chinese logographic, Japanese kana, and Japanese kanji. There were three regions of robust convergence of brain activation from the different orthographies: (1) mid-anterior aspect of the left superior temporal lobe; (2) left inferior frontal gyrus (LIFG); and (3) left occipito-temporal region (Bolger et al., Reference Bolger, Perfetti and Schneider2005). The left occipito-temporal network (including the left visual word form area, see Cohen and Dehaene, Reference Cohen and Dehaene2004) is postulated as an area that is universally responsible for feedback between phonology and print.
The diverging loci of activation accommodate some of the variances between the printed forms. Right-hemisphere occipital and temporal lobe areas were associated with visuospatial processing of logographic systems (Matsuo et al., Reference Matsuo, Kato, Okada, Moriya, Glover and Nakai2003; Tan et al., Reference Tan, Laird, Li and Fox2005a). Left-hemisphere temporal and parietal areas were associated with phonological processing of alphabets. Tan et al. (Reference Tan, Laird, Li and Fox2005a) found differences in (a) posterior aspect of the superior temporal lobe activated only in syllabic systems (alphabetic and non-alphabetic); this activation is possibly associated with the retrieval of phonological information; (b) left anterior-dorsal frontal region recruited in Chinese character reading; this activation may be associated with the coordination of the processing of the unique combination of graphic, phonological, and semantic information in logographic characters; and (c) right occipito-temporal region (Brodmann Area (BA) 37) activated in reading Chinese logographs compared with syllabic languages; this activation is possibly associated with spatial processing of logographs (Bolger et al., Reference Bolger, Perfetti and Schneider2005). In a brain imaging study of European languages, Paulesu et al. (Reference Paulesu, McCrory, Fazio, Menoncello, Brunswick, Cappa, Cotelli, Cossu, Corte, Lorusso, Pesenti, Gallagher, Price, Frith and Frith2000) found differences in brain activation associated with the regularity of Italian, and the irregularity of English orthographies.
Bolger et al.'s (Reference Bolger, Perfetti and Schneider2005) meta-analysis reported common right-hemisphere occipito-temporal areas for reading Chinese logographs. This activation was not found in the meta-image generated for the studies of reading kanji logographs. The absence of right occipito-temporal activation for reading kanji may have been an effect of the averaging over results in the meta-analysis. One of the studies included in the meta-analysis did report right medial occipital activation for Japanese kanji (Nakamura et al., Reference Nakamura, Honda, Okada, Hanakawa, Toma, Fukuyama, Konishi and Shibasaki2000). The authors of the study argued that the right occipital activation was a result of the visual processing differences between reading kanji words and reading single kana characters. Other studies have also reported more activation of bilateral fusiform areas (BA 37) for kanji (Thuy et al., Reference Thuy, Matsuo, Nakamura, Toma, Oga, Nakai, Shibasaki and Fukuyama2004; Nakamura, Dehaene, Jobert, Bihan and Kouider, Reference Nakamura, Dehaene, Jobert, Bihan and Kouider2005).
The unique right occipito-temporal activation in reading kanji is evidence that there are additional visual processes associated with reading this type of orthography. The distinctive visual processing demands of reading logographs are also mirrored developmentally. Learning to read the Chinese logographic system depends on developing good handwriting skills (Tan, Spinks, Eden, Perfetti and Siok, Reference Tan, Spinks, Eden, Perfetti and Siok2005b), and on the ability to integrate visuospatial information (Tan et al., Reference Tan, Liu, Perfetti, Spinks, Fox and Gao2001).
Clinical studies have also shown that visual and spatial processes are fundamental for reading kanji characters. Sakurai et al. (Reference Sakurai, Takeuchi, Takada, Horiuchi, Nakase and Sakuta2000), in an investigation of alexia and agraphia in Japanese, reported the case of a fusiform lesion patient who had an equally impaired ability to understand written kanji and kana (alexia), but who made more paragraphic errors for kanji, had minor agraphia for kanji, and could write kanji that he could not read. The patient used kinesthetic reading (or facilitation) as a strategy to overcome kanji reading difficulties. The importance of kinesthetic reading for processing logographic characters was also shown by Matsuo et al. (Reference Matsuo, Kato, Okada, Moriya, Glover and Nakai2003), who reported that finger movements lightened the cognitive load of reading logographic characters.
Evidently, Chinese and Japanese logographs are systems of two different languages. But Chinese and Japanese logographs do have a similarity that is of interest for the study, that is, they are morpho-syllabic writing systems. The similarity between Japanese kanji and Chinese logographs has historical origins: kanji characters were originally Chinese characters. The review of brain imaging studies of reading Chinese logographs is, in our understanding, pertinent to the discussion of brain representations for reading kanji logographs.
In the present study, it was expected that there would be differences in brain activation associated with the unique characteristics of Japanese kanji and hiragana writing systems. The different mapping of print to phonology and meaning elicits different cognitive processes for reading in the two systems. The different processes for reading hiragana and kanji were expected to be associated with differences in brain activation. To our knowledge, there are no previous studies that contrasted the brain activation from reading kanji and hiragana sentences.
Brain representation of language in bilinguals
Brain activation in bilinguals varies with the specific processing demands of each language, as well as with proficiency, age of acquisition (Perani and Abutalebi, Reference Perani and Abutalebi2005) and writing systems (Meschyan and Hernandez, Reference Meschyan and Hernandez2006). Brain imaging studies of bilinguals have been carried out on the cortical representation of different language-pairs (Kim, Relkin, Lee and Hirsch, Reference Kim, Relkin, Lee and Hirsch1997); on bilingual auditory sentence comprehension (Hasegawa, Carpenter and Just, Reference Hasegawa, Carpenter and Just2002); bilingual reading comprehension (Meschyan and Hernandez, Reference Meschyan and Hernandez2006); and on bilingual phonetic, lexical, and phonological processing (Marian, Spivey and Hirsch, Reference Marian, Spivey and Hirsch2003; Tham et al., Reference Tham, Rickard Liow, Rajapakse, Leong, Ng, Lim and Ho2005). In a precursor to this paper, Hasegawa et al. (Reference Hasegawa, Carpenter and Just2002) showed that the workload of listening comprehension in the less-proficient L2 resulted in activation of additional cortical areas in comparison with L1. Meschyan and Hernandez (Reference Meschyan and Hernandez2006) reported increased cortical activity associated with differences in the orthographic transparency of Spanish (shallow orthography) and English (deep orthography).
Participants were late bilinguals and self-rated their reading skill in L2 at an intermediate level of proficiency (see Methods section). Few studies (Chee et al., Reference Chee, Caplan, Soon, Sriram, Tan, Thiel and Weekes1999; Shieh et al., Reference Shieh, Luke, Tan, Wai, Wan and Liu2001; Yokoyama et al., Reference Yokoyama, Okamoto, Miyamoto, Yoshimoto, Kim, Iwata, Jeong, Uchida, Ikuta, Sassa, Nakamura, Horie, Sato and Kawashima2006) have investigated bilinguals reading logographic and alphabetic systems at a level above that of words. Yokoyama et al. (Reference Yokoyama, Okamoto, Miyamoto, Yoshimoto, Kim, Iwata, Jeong, Uchida, Ikuta, Sassa, Nakamura, Horie, Sato and Kawashima2006) contrasted the brain activation associated with reading in Japanese and English. The study focused on the differences between processing structurally complex sentences (active and passive sentences) in the two languages. Others have investigated listening comprehension effects in the English–Japanese language pair (Hasegawa et al., Reference Hasegawa, Carpenter and Just2002), and the Chinese–English and Korean–English language pairs (Jeong et al., Reference Jeong, Sugiura, Sassa, Yokoyama, Horie, Sato, Taira and Kawashima2007). It was expected that the results of the present study would provide evidence of an increased phonological processing workload in L2 sentence reading comprehension in a different writing system (English), in which participants are less proficient than in the L1.
Method
Participants
Ten right-handed (Edinburgh Handedness Inventory, see Oldfield, Reference Oldfield1971) bilingual speakers of Japanese (first language) and English participated in the study. The results are reported for nine participants (age M = 27.4 years, SD = 4.27, range 24–38 years). One participant was excluded due to excessive head movement greater than 3.0 mm. All gave signed, informed consent approved by the University of Pittsburgh and Carnegie Mellon Institutional Review boards. Participants in this study were the same as those in a previous study (Hasegawa et al., Reference Hasegawa, Carpenter and Just2002).
Participants were enrolled as university undergraduate or graduate students in the United States. At the time of the study, they had been in the US for 0.5–3 years (M = 1.13, SD = 0.8). Age of acquisition of the second language showed that participants were late bilinguals, as defined by Paradis (Reference Paradis, Banich and Mack2003) (second language learned after the age of seven years) (M = 26.9, SD = 4.8, range 21–38). Proficiency in the L2 was assessed using a language background questionnaire (Hasegawa et al., Reference Hasegawa, Carpenter and Just2002), in which bilinguals were asked to self-rate their reading ability in English. The rating was on a scale of 1.0–5.0 with 0.5 intervals, where 5.0 was excellent and 1.0 poor. Overall, participants rated their proficiency at an intermediate level (M = 3.0, SD = 0.9).
Materials
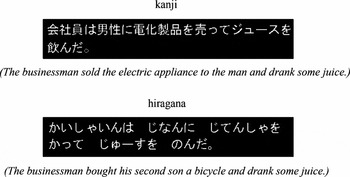
Two-clause target sentences were presented in English, and Japanese hiragana and kanji scripts (see Figure 1 for examples). The kanji sentences had mixed in katakana and hiragana characters, but still were mostly kanji. This mixed kanji text is the typical manner in which modern Japanese logograph is written. Kana characters are used together with kanji to, for example, transcribe neologisms. Japanese sentences written only with hiragana, however, are unusual. Sentences in hiragana were included to focus on the brain activation associated with reading of L1 syllabograms. Sentences had either a negative statement, for example, The uncle didn't take out a notebook and lent an umbrella to the doctor, or an affirmative statement, for example, The worker read a magazine and showed some pictures to the brother. Half the sentences in the experiment stimuli were negative, half positive.
Examples of the kanji and hiragana sentences.

To assess L1 and L2 comprehension accuracy, and to ensure that participants were performing the comprehension task (rather than just superficially reading the sentences), a single-clause probe sentence followed the target sentence, to which participants had to respond true or false. The probe sentence always referred to the agent–patient relationship in the sentence. For example, the negative sentence above was followed by the probe The uncle lent an umbrella. Forty percent of the probes were false. The nouns and verbs for English sentences were chosen to be at beginner or lower intermediate levels (junior high school level), and therefore would be familiar to the participants. In the precursor to this study, English sentences were found to be quite comprehensible to native speakers (Hasegawa et al., Reference Hasegawa, Carpenter and Just2002). Translation equivalents were used to make the lexical level of sentences comparable.
Procedure
There were three separate fMRI scans, one for each writing system. The presentation order of the conditions was balanced across participants. In all cases, sentences were displayed in full on a screen, one at a time, using Coglab Experimental Control software (www.ccbi.cmu.edu). Participants were familiarized with the scanner before the actual study. The experiment was self-paced; the display of a sentence was terminated by the participant clicking a mouse button. The first sentence was then followed by a probe sentence. Display of the probe sentence was terminated by the participant making a true or false response, also by clicking mouse buttons. The durations of each of the two instances of sentence presentation were labeled target-sentence reading time and probe-sentence reading time. There was no feedback to the participant following response to the probe sentence. Target and probe sentences were separated by 500 ms, and an additional 1500-ms interval followed the probe sentence before display of the next target–probe pair.
Each of the three conditions consisted of eight epochs; each epoch had a series of five successively presented trials of either affirmative or negative target sentences. Participants were given one epoch of affirmative sentences, then one epoch of negative sentences. Two additional epochs were presented to four participants who showed considerably fast reading times in both kanji and hiragana during the practice session. The additional epochs were presented to ensure the acquisition of at least 40 images per participant for each Japanese condition. Sentence epochs were alternated with fixation periods of either six or 30 seconds. The 30-second fixation periods were inserted after every two epochs. The shorter six-second fixation was included to allow the hemodynamic response to decrease between the epochs that were not followed by a 30-second fixation, before the next epoch began. Fixation consisted of the display of a crosshair in the middle of the screen.
Image acquisition
Images for all three scans were acquired on a 1.5-T scanner (with quadrature birdcage head coil) at the MR Research Center at the University of Pittsburgh Medical Center. The acquisition parameters for gradient-echo EPI with 14 oblique axial slices were TR = 3000 ms, TE = 50 ms, flip angle 90°, 128 × 64 acquisition matrix, FOV 40 × 20 cm, 5-mm slice thickness, 1-mm gap, in-plane voxel resolution of 3.125 × 3.125 mm, and RF whole-head coil. Four disabled acquisitions preceded each scan.
fMRI data analysis
To compare the distribution of activation, data were analyzed using SPM99 (Wellcome Department of Cognitive Neurology, University College London). Images were corrected for slice acquisition timing, motion-corrected, normalized to the Montreal Neurological Institute (MNI) template, resampled to 2 × 2 × 2 mm voxels, and smoothed with an 8-mm Gaussian kernel to decrease spatial noise. The model for each participant included regressors for each of the six conditions scanned (kanji negative and positive, hiragana negative and positive, English negative and positive) and for the fixation condition. The regressors were convolved with the canonical SPM99 hemodynamic response function. The length of the regressors was the individual box car function convolved with each subject's self-paced reading time for each sentence in the eight or ten-epoch blocks.
Statistical analysis was performed on individual and group data by using the general linear model and Gaussian random field theory as implemented in SPM99 (Friston et al., Reference Friston, Ashburner, Frith, Poline, Heather and Frackowiak1995). The extent threshold was 20 voxels. Group analyses were performed using a random-effects model. Statistical maps were superimposed on normalized T1-weighted images. Group images were generated for each condition relative to fixation (the common baseline condition). After group analyses were carried out, we collapsed across the images for negative and affirmative sentences relative to fixation in each writing system, Japanese hiragana, Japanese kanji, and English. Images were collapsed across the two types of sentences because there were no systematic effects of negative versus affirmative sentences. The collapsed images for each individual subject were used to carry out the condition subtractions in SPM99: kanji > hiragana; hiragana > kanji; English >hiragana; and English > kanji (paired t-test; p = .005, uncorrected). An additional direct contrast was carried out between English and the average of the two Japanese conditions. We further collapsed the images for each individual subject across the two Japanese writing system conditions by generating an average contrast file for each individual subject, and the collapsed images were subsequently used to carry out the L2 > L1 subtraction in SPM99: English > Japanese (average of hiragana and kanji) (paired t-test; p = .005, uncorrected). Due to the more modest number of participants, a more liberal height threshold of p = .005, uncorrected, was applied in the analysis of fMRI results. The activation clusters that remained significant (p < .05) after cluster-level correction for multiple representations are marked with an asterisk (*) in the tables of results.
Results and discussion
Behavioral results
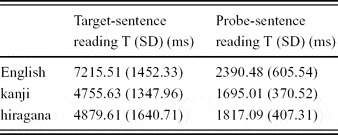
Comparison of target- and probe-sentence reading times across languages showed that L2 reading comprehension was significantly more time-consuming than L1 reading comprehension. Total target-sentence reading time comparison: English versus kanji, t(8) = 4.74, p < .05; English versus hiragana, t(8) = 3.75, p < .05. Probe-sentence reading time: English versus kanji, t(8) = 3.98, p < .05; English versus hiragana, t(8) = 2.80, p < .05. Comprehension accuracy was not affected in L2 (there were no significant differences in the accuracy of the responses in the comparison between Japanese writing systems and English). The bilinguals were slower to read in English, but were still able to understand the sentences (hiragana error M = 0.11, SD = 0.08; kanji error M = 0.10, SD = 0.07; English error M = 0.10, SD = 0.07). There were no differences in reading times or accuracy between the two Japanese writing systems (kanji and hiragana). English and Japanese target- and probe-sentence reading times are shown in Table 1.
Target-sentence and probe-sentence reading times for English and Japanese.

fMRI results
Kanji and hiragana
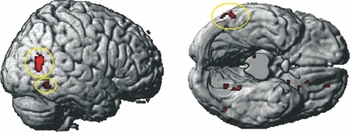
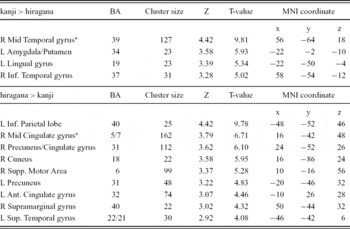
The direct contrasts between the Japanese writing systems indicate that the brain activation reflects the differences in the mapping of print to sound and to meaning in the two orthographies. The contrast between kanji and hiragana shows more activation for kanji in right inferior (BA 37) and mid temporal gyri (BA 39). The cortical response to kanji sentences may be associated with the visuospatial processing associated with logographic characters. More activation of right BA 37 for kanji corroborates previous studies that reported activation in this area for reading logographs (Nakamura et al., Reference Nakamura, Dehaene, Jobert, Bihan and Kouider2005; Tan et al. Reference Tan, Laird, Li and Fox2005a). The activation of right-hemisphere areas in kanji logograph reading can be associated with the specialization of the right side of the brain for pictorial and spatial processing. This interpretation of the results is supported by the findings of imaging, developmental, and clinical studies of reading logographs (Bolger et al., Reference Bolger, Perfetti and Schneider2005; Sakurai et al., Reference Sakurai, Takeuchi, Takada, Horiuchi, Nakase and Sakuta2000; Tan et al., Reference Tan, Liu, Perfetti, Spinks, Fox and Gao2001, Reference Tan, Laird, Li and Fox2005a, Reference Tan, Spinks, Eden, Perfetti and Siokb; Matsuo et al., Reference Matsuo, Kato, Okada, Moriya, Glover and Nakai2003). Figure 2 and Table 2 report the results for the comparison of kanji with hiragana.
Brain areas showing activation for kanji > hiragana (p < .005 uncorrected; T = 3.36; extent threshold voxels = 20; right, a view of the inferior surface of the brain without the cerebellum; ellipses highlight the activation of right-hemisphere inferior and mid temporal gyri).

Clusters of activation for the Japanese writing system contrasts.

p < .005 uncorrected; T = 3.36; extent threshold voxels = 20; Z, T-value, and MNI coordinate are for the peak activated voxel in each cluster only. AAL labeling (Tzourio-Mazoyer et al., Reference Tzourio-Mazoyer, Landeau, Papathanassiou, Crivello, Etard, Delcroix, Mazoyer and Joliot2002) clusters marked with * were also significant at p < .05 after cluster-level correction for multiple representations.
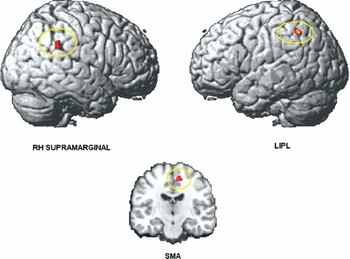
The contrast between hiragana and kanji shows more activation for hiragana in left inferior parietal lobe (LIPL), right supramarginal gyrus, and right supplementary motor area (SMA). The LIPL activation indicates that there is an additional demand on phonological coding of words in hiragana, relative to kanji. The activation of right-hemisphere supramarginal gyrus may be a spill-over of activation from the left-hemisphere supramarginal area, which is associated with phonological processing. In language tasks, the additional, less-specialized right-hemisphere area may be recruited because it is capable of performing similar types of cognitive functions to the first, well-specialized area (Just, Carpenter, Keller, Eddy and Thulborn, Reference Just, Carpenter, Keller, Eddy and Thulborn1996). Figure 3 and Table 2 report the activation of hiragana compared with kanji.
Brain areas showing activation for hiragana > kanji (p < .005 uncorrected; T = 3.36; extent threshold voxels = 20; top, surface renderings; bottom, coronal view showing SMA activation (MNI coordinate: x = 10; y = –16; z = –56)).

Reading a sentence requires comprehension processes that are not in effect at the word level, such as integration of sentence information and inference-making. Thus, the brain activation differences associated with single- word reading in different writing systems could have been less evident at the level of sentence reading. But direct comparison of brain activation from comprehending sentences in the two Japanese writing systems shows activation that mirrors differences at the level of processing logographic and syllabic words. The results for the contrast between kanji and hiragana corroborate the dual-coding model of different routes to meaning in processing logographs and syllables (Yamadori, Reference Yamadori2000; Thuy et al., Reference Thuy, Matsuo, Nakamura, Toma, Oga, Nakai, Shibasaki and Fukuyama2004).
English > hiragana and English > kanji
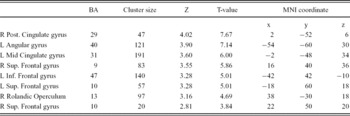
The L2–L1 comparisons show recruitment of cortical areas that may be associated with the greater workload imposed by reading comprehension processes in the less-proficient L2. The results show systematic brain activation in the L2 in relation to each of the L1 writing systems. English activated more left angular, bilateral superior frontal, and left inferior frontal gyri in comparison with kanji, and in comparison with hiragana. The differences between L2 and L1 reading may be associated with the additional demand on internal phonological rehearsal processes and verbal working memory in reading a second-language, alphabetic system. English orthography is characteristically irregular (deep orthography) in its mapping of print to sound; it possibly places additional cognitive demand on phonological processes in comparison with either first-language system. The longer reading times in English might have been expected to produce more activation in the visual cortex (longer duration of visual input on the screen), but no such differences emerged.
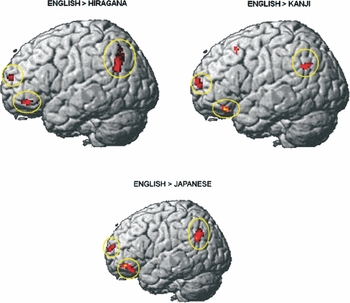
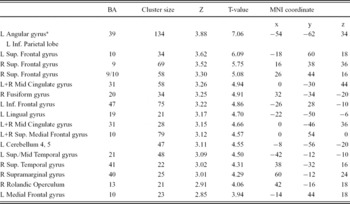
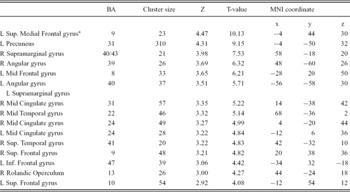
English showed more activation than hiragana in a cluster surrounding the left angular gyrus and extending anteriorly to the LIPL, which was mirrored laterally in the right supramarginal gyrus. In the comparison with kanji, not only did the extra activation of left angular gyrus in English extend anteriorly to the left supramarginal gyrus, but it was also mirrored laterally in the right hemisphere (right angular and supramarginal gyri). A similar activation in the left supramarginal gyrus (BA 40) has been reported in association with phonological processing in English versus Chinese logographs (Tham et al., Reference Tham, Rickard Liow, Rajapakse, Leong, Ng, Lim and Ho2005). Figure 4 shows the activation from reading English compared with reading Japanese hiragana and kanji (see also Tables 3 and 4). wrap>
Brain areas showing activation for English > hiragana, English > kanji, and English > Japanese (average hiragana + kanji) (p < .005 uncorrected; T = 3.36; extent threshold voxels = 20; ellipses highlight the loop of activation in the left frontal lobe and left angular gyrus).

Clusters of activation for English > hiragana.

p < .005 uncorrected; T = 3.36; extent threshold voxels = 20; Z, T-value, and MNI coordinate are for the peak activated voxel in each cluster only. AAL labeling (Tzourio-Mazoyer et al., Reference Tzourio-Mazoyer, Landeau, Papathanassiou, Crivello, Etard, Delcroix, Mazoyer and Joliot2002) clusters marked with * were also significant at p < .05 after cluster-level correction for multiple representations.
Clusters of activation for English > kanji.

p < .005 uncorrected; T = 3.36; extent threshold voxels = 20; Z, T-value, and MNI coordinate are for the peak activated voxel in each cluster only. AAL labeling (Tzourio-Mazoyer et al., Reference Tzourio-Mazoyer, Landeau, Papathanassiou, Crivello, Etard, Delcroix, Mazoyer and Joliot2002) clusters marked with * were also significant at p < .05 after cluster-level correction for multiple representations.
Studies of reading syllabic systems in a native language show that the angular gyrus is one of the areas associated with phonological processes and graphophoneme conversion (Bolger et al., Reference Bolger, Perfetti and Schneider2005). In the present study, activation of the angular gyrus was found in both contrasts of English with Japanese. Activation of the angular gyrus was also found in the analysis of English > Japanese (average of kanji + hiragana) (Table 5 and bottom rendering in Figure 4). The consistent activation of the angular gyrus may be associated with the cognitive load of phonological processes of reading an alphabetic system in a second language.
Clusters of activation for English > Japanese (average hiragana + kanji).

p < .005 uncorrected; T = 3.36; extent threshold voxels = 20; Z, T-value, and MNI coordinate are for the peak activated voxel in each cluster only.
The peaks for the two clusters of angular gyrus activation in the English > kanji and the English > hiragana contrasts are relatively close (approximately 18 mm in both cases) to the left inferior parietal region where Mechelli et al. (Reference Mechelli, Crinion, Noppeney, O'Doherty, Ashburner, Frackowiak and Price2004) reported an increase in the density of grey matter for both early and late bilinguals. It is possible that the cortical region that includes the left inferior parietal lobe and the angular gyrus plays a role in the access to L2 phonology.
The activations of the left inferior frontal, of the superior frontal, and of the angular gyri form a network of areas that were consistently more activated in L2. The activation of this network suggests that for the Japanese bilinguals in the study there was an increase in cognitive demand stemming from phonological rehearsal processes. The additional phonological processes might have made the comprehension of the sentences slower and more demanding in L2, as the significant differences between English and Japanese reading times also indicate. The network of frontal lobe and angular gyrus activation indicates that the readers may be resorting to a phonological rehearsal process in reading in the L2 (a phonological rehearsal loop). Activation in areas associated with a phonological rehearsal loop, just prior to the probe processing, indicates that in these intermediately proficient bilinguals there may be a cognitive mechanism that assists comprehension processes in the less-proficient L2 by keeping sound-to-meaning representations active.
Conclusion
Sentence reading in the Japanese logographic and syllabic systems produces orthography-specific activation. The brain differentially responds to the two orthographies, activating right-hemisphere areas associated with the pictorial and visuospatial characteristic of kanji characters, and activating left- and right-hemisphere areas associated with the syllabic nature of hiragana.
Direct comparison across languages and different writing systems shows that there is activation that indicates a brain response to reading in the less-proficient L2. For the Japanese bilinguals in question, reading in English poses a cognitive challenge of processing in a language in which they are less proficient, and a language which uses a different orthography. What the brain activation indicates is that there is activation in cortical areas that may be associated with the recognition and processing of words and letter-to-sound mappings, and with the additional working memory load of keeping these mappings active. Ultimately, the data indicate that within the same language, sentence-level processing can elicit differential cognitive responses associated with word-level comprehension processes, and across languages, with more cognitively demanding phonological rehearsal processes.