Introduction
Vertigo is a multi-faceted disorder. In order to determine the exact aetiology of vertigo, a series of clinical, vestibular and imaging studies must be performed, and different probable causes must be eliminated. Based on the anatomical site, vertigo is described as central or peripheral. Failure of co-ordination between visual, cervical and vestibular sensory receptors and their pathways is one of the causes of central vertigo. One recent series study found that 25 per cent of dizziness experienced by patients is due to central causes.Reference Karatas1 Central vertigo can indicate serious pathologies such as tumours, stroke, vertebrobasilar insufficiency, migraine and demyelinating diseases.
Patient history and clinical examination findings are often the key to diagnosis. A vestibular test battery is routinely used to evaluate dizzy patients and can help to identify whether the cause of the dizziness is peripheral or central. Imaging strategies depend upon the onset of presentation, with computed tomography (CT) being the first modality if acute stroke is suspected. Magnetic resonance imaging (MRI) may miss acute ischemic changes in 20 per cent of cases in the first 24 hoursReference Newman-Toker2 but has proven its reliability in the diagnosis of vertigo. MRI can identify lesions in the central nervous system with greater accuracy than before. For neurotologists, this means that lesions in the cerebellopontine angle and retrocochlear lesions can be detected early. Because patients with central vertigo form a significant percentage of neurotology practice patients, it is imperative for neurotologists to include a detailed evaluation of the brain, in addition to the cerebellopontine angle, in their MRI workup.
This paper discusses whether central findings on vestibular tests predict: abnormal findings on MRI; central disorders from amongst the vestibular tests; and the type of central lesions seen in these patients.
Materials and methods
Study population
A retrospective review of electronic health records of patients attending the vestibular testing laboratory and hearing and balance centre in a tertiary care hospital between January 2015 and June 2018 was undertaken. Approval was obtained from the Institutional Review Board of the Louisiana State University Health Sciences Center prior to commencing the study.
Inclusion criteria
The inclusion criteria were: patients with at least two or more central findings on vestibular tests; and patients who had undergone MRI of the brain and internal auditory canal and whose results were available for review.
Of the 192 electronic health records reviewed, the data of 157 patients who fulfilled the inclusion criteria were analysed in the present study. The following data were extracted from the electronic health records: demographic data including age and gender; history of hypertension, diabetes, migraine, vertebrobasilar disease and cardiac disease; and results of pure tone audiometry, videonystagmography, rotational chair and infrared video tests. All audiovestibular tests were performed by audiologists. MRI results for this study were recorded as the neuroradiologist's interpretation of the MRI at the time of the patients’ initial evaluation.
Audiometry
All patients underwent audiometric testing to obtain pure tone hearing threshold levels using air conduction and bone conduction followed by speech audiometry. For this study, only the presence or absence of hearing loss was recorded.
Videonystagmography
Binaural bithermal caloric irrigation was performed with either air or water irrigation, depending on the middle-ear status of the patient. In order to determine the presence of reduced vestibular response and fixation suppression, slow phase velocities induced by the caloric irrigation as well as slow phase velocities with fixation were measured and recorded.
Rotational chair
An oculomotor screening battery for spontaneous nystagmus, gaze nystagmus, saccades, optokinetic nystagmus and smooth pursuit eye movement was assessed. The gain, phase and symmetry of the slow phase velocities of the vestibulo-ocular reflex were assessed via sinusoidal harmonic acceleration (0.01–0.64 Hz), visual fixation suppression (0.04 Hz) and visual-vestibular ocular reflex (0.04–0.16 Hz). The slow phase velocity gain and the decay of the gain over time was assessed via step velocity.
Infrared video
Eye movement patterns were assessed via an infrared video recording to provide objective analysis of nystagmus or other abnormalities during static positional assessments and the Hallpike manoeuvre. Some, but not all, of the patients underwent Tullio, fistula and vibration tests, and only data of the available results were included in the final statistical analysis. The results of tests for spontaneous nystagmus, gaze nystagmus, possible vibration induced nystagmus, positional nystagmus and Hallpike manoeuvres were recorded in our study.
The criteria for diagnosing central vestibular dysfunction in our clinic include: hyperactive vestibular ocular reflex defined by elevated slow phase velocity gain; hyperactive visual-vestibular ocular reflex defined by elevated slow phase velocity gain; hyperactive warm water (44°C), cool water (33°C) or ice water (17°C) caloric response; rebound gaze nystagmus of more than 3 degrees; and failure of fixation suppression (defined as the inability to suppress nystagmus by at least 50 per cent for caloric irrigation or by at least 80 per cent for vestibular fixation suppression). Note also that a bilateral reduced response with the total slow phase velocities of all four irrigations of less than 30 degrees per second was considered a central finding when in conjunction with normal or elevated visual ocular reflex gain and normal step velocity gain and decay.
Data analysis
Statistical analysis of the demographic data, vestibular test findings and presence or absence of MRI abnormalities was performed. Data are given as the mean, standard deviation, number and percentage. SPSS® (version 25) statistical software and Microsoft Excel® spreadsheet software were used for statistical analyses. Differences and associations were considered significant for p-values less than 0.05.
Results
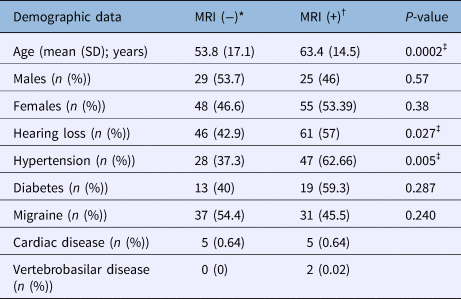
Of the 157 patients, 103 (65 per cent) were women and 54 (35 per cent) were men (Table 1). The age of the study population ranged from 15 to 96 years with a mean age of 58 years. The patients were divided into three age groups: aged less than 40 years; aged 40 to 59 years; and aged 60 years or older. In addition, the patients were divided into two groups based on MRI results: those with MRI findings were labelled as MRI (+) (n = 80), and those without MRI findings were labelled as MRI (−) (n = 77).
Demographic data

*n = 77; †n = 80; ‡significant. MRI = magnetic resonance imaging; SD = standard deviation
Table 1 shows the demographic data of the study population. The mean age of individuals in the MRI (+) group was 63.4 years (± 14.5 years) and in the MRI (−) group was 53.8 years (± 17.1 years) (p = 0.0002). Amongst clinical findings, hypertension (p = 0.005) and hearing loss (p = 0.027) were statistically significant in MRI (+) patients.
Central vestibular findings had a 50.9 per cent positive predictive value (odds ratio = 1.0; 95 per cent confidence interval (CI) = 0.02–53) for MRI abnormalities across all age groups. The positive predictive value of central findings in relation to MRI abnormalities was: 20 per cent (odds ratio = 0.26; CI = 0.004–15.1) for the group aged less than 40 years; 50 per cent (odds ratio = 1.0; CI = 0.02–52.2) for the group aged 40–59 years; and 38.4 per cent (odds ratio = 0.62; CI = 0.01–32.5) for the group aged 60 years or older (Table 2).
Central vestibular test findings in relation to MRI findings

MRI = magnetic resonance imaging; PPV = positive predictive value; OR = odds ratio; CI = confidence interval
Videonystagmography and rotational chair results were compared in the MRI (+) and MRI (−) groups, as well as across the three age groups and in all the age groups combined. The positive predictive value of videonystagmography results (Table 3) for MRI abnormalities was 57 per cent (odds ratio = 34.7; CI = 1.4–809.6; p = 0.02) in the group aged less than 40 years; 50 per cent (odds ratio = 1.1; CI = 0.3–4.1; p = 0.8) for the group aged 40–59 years; 69.5 per cent (odds ratio = 1.9; CI = 0.62–6.3; p = 0.2) for the group aged 60 years or older; and 60 per cent (odds ratio = 2.2; CI = 1.05–4.9; p = 0.03) for patients in all age groups combined.
Central findings on videonystagmography tests in relation to MRI findings

*Significant. MRI = magnetic resonance imaging; PPV = positive predictive value; OR = odds ratio; CI = confidence interval
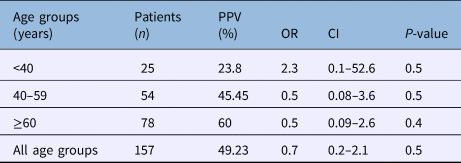
The positive predictive value of the rotational chair test for MRI abnormalities (Table 4) was: 23.8 per cent (odds ratio = 2.3; CI = 0.1–52.6; p = 0.5) for the group aged less than 40 years; 45.45 per cent (odds ratio = 0.5; CI = 0.08–3.6; p = 0.5) for the group aged 40–59 years; 60 per cent (odds ratio = 0.5; CI = 0.09–2.6; p = 0.4) for the group aged 60 years or older; and 49.23 per cent (odds ratio = 0.7; CI = 0.2–2.1; p = 0.5) in all age groups combined. The rotational chair test had high sensitivity with values ranging from 86 to 100 per cent across all age groups.
Central findings on rotational chair tests in relation to MRI findings

MRI = magnetic resonance imaging; PPV = positive predictive value; OR = odds ratio; CI = confidence interval
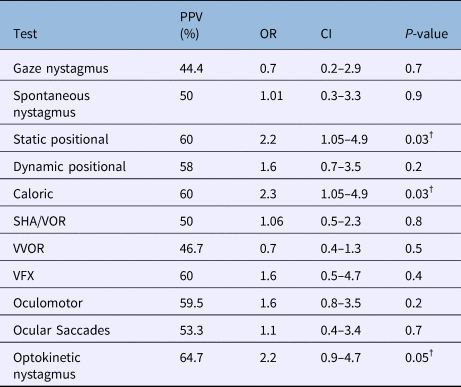
In the MRI (+) group, unilateral caloric weakness was noted in 12 patients, and hyperexcitable response was noted in 18 patients on caloric test (positive predictive value = 60 per cent; odds ratio = 2.3; CI = 1.05–4.9; p = 0.03) (Table 5). Abnormal visual fixation was recorded in nine patients in the MRI (+) group versus six patients in the MRI (−) group. Static positional test abnormality and dynamic positional tests were associated with the most frequent abnormalities on videonystagmography tests.
Vestibular tests in MRI (+) and MRI (−) groups*

Patients whose test result data was unavailable for specific tests are excluded.
* Total patients = 157; †significant. MRI = magnetic resonance imaging; PPV = positive predictive value; OR = odds ratio; CI = confidence interval; SHA = slow harmonic acceleration test; VOR = visual ocular reflex; VVOR = visual vestibulo ocular reflex; VFX = vestibular visual fixation
Twenty-five versus 17 patients showed impaired oculomotor test results in MRI (+) group versus MRI (−) group, respectively. Abnormal ageotropic nystagmus with and without fixation was recorded during the Hallpike manoeuvre in two MRI (+) patients and one MRI (−) patient. Disconjugate eye movements were recorded in a patient with MRI findings that were suggestive of multiple sclerosis. Four patients in the MRI (+) group and one patient in the MRI (−) group had vertical nystagmus. Saccades were observed in eight patients with MRI abnormalities versus seven patients without MRI abnormalities.
The positive predictive value of the various vestibular tests in relation to the MRI (+) and MRI (−) groups is shown in Table 5. Among the vestibular tests, the static positional test (positive predictive value = 60 per cent; odds ratio = 2.2; CI = 1.05–4.9; p = 0.03), abnormal caloric test (positive predictive value = 60 per cent; odds ratio = 2.3; CI = 1.05–4.9; p = 0.03) and optokinetic nystagmus test (positive predictive value = 64.7 per cent; odds ratio = 2.2; CI = 0.9–4.7; p = 0.05) were the main predictors of central lesions on MRI with p ≤ 0.05.
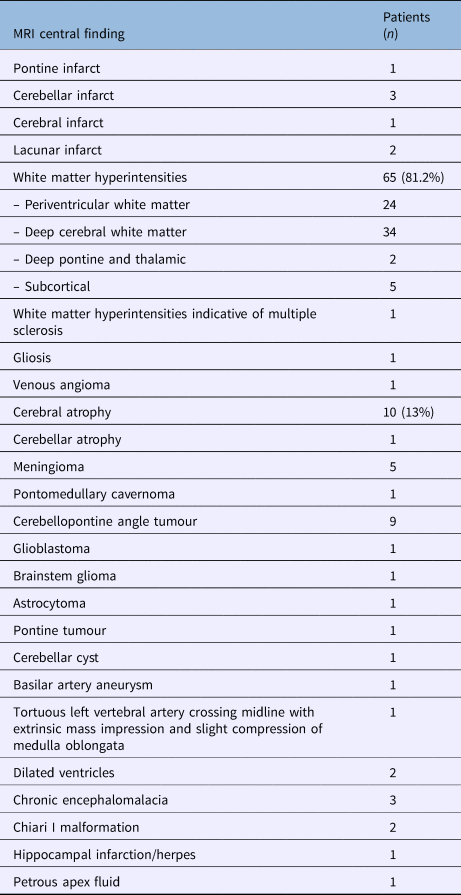
MRI abnormalities were identified in 80 patients in the MRI (+) group (Table 6). Thirty patients had multiple abnormalities. Two patients had a lacunar infarct, three had a cerebellar infarct, one had a pontine infarct and one had a cerebral infarct. Chronic microangiopathic changes with white matter hyperintensities were reported in 65 out of the 80 MRI (+) patients. Periventricular white matter lesions were seen in 24 and deep cerebral white matter lesions were seen in 34 patients. Two patients had deep pontine and thalamic white matter lesions. One patient had white matter lesions indicative of multiple sclerosis. Cerebral atrophy was reported in 10 patients and cerebellar atrophy in 1 patient. Three patients had chronic encephalomalacia.
MRI findings in the MRI (+) group*

Thirty patients had more than one finding.
* n = 80. MRI = magnetic resonance imaging
Intracranial tumours were seen in nine patients with cerebellopontine angle tumour, five with meningioma, and there was one patient each with a glioblastoma, astrocytoma, pontine tumour, pontomedullary cavernoma and a cerebellar cyst. There were two patients with a Chiari type I malformation, one patient with a tortuous left vertebral artery crossing the midline with extrinsic mass impression and slight compression of the medulla oblongata, and one patient with a basilar artery aneurysm.
Discussion
Central vertigo can be caused by brainstem, cerebellum, basal ganglia, cortex and neck lesions, migraines, seizures, toxins, and vascular, degenerative, developmental, paraneoplastic and other unknown aetiologies.Reference Cherchi and Hain3 These causes account for vertigo in almost one fourth of the patients experiencing dizziness.Reference Karatas1
Central vertigo can manifest in three ways: by acute onset of vertigo and dizziness, by recurrent attacks and through chronic vertigo.Reference Strupp and Brandt4 In a clinical setting, a detailed history provides clues to differentiate between peripheral and central causes of vertigo.Reference Rosenberg and Gizzi5 Physical, neuro-ophthalmological and neuro-otological examination at the bedside can help to confirm the diagnosis.
Some studies suggest that the presence of neurological signs indicates central vertigo and their absence indicates a peripheral cause of vertigo.Reference Rosenberg and Gizzi5 Similarly, auditory symptoms may suggest a peripheral cause of vertigo. However, auditory symptoms such as hearing loss can be misleading. One study found that 22.58 per cent of patients with MRI abnormalities had hearing loss compared with 40 per cent of patients without MRI abnormalities.Reference Mohamed6
In the present study, 57 per cent of patients with MRI abnormalities had hearing loss compared with 46 per cent without MRI abnormalities (p = 0.027). This could also be explained by the large population of older patients with hearing loss in the current study population. Our study also found that hypertension was present in 62.66 per cent (p = 0.005) of MRI (+) patients. This association has also been reported in other studies.Reference Mohamed6,Reference Lopes, Moreira, Trelha and De Moraes Marchiori7 This is important to consider because hypertension and diabetes are two of the commonest comorbidities affecting the elderly population worldwide.
Rotational chair and videonystagmography testing algorithms are used by clinicians to study the gamut of peripheral and central findings. A previous study by our senior author (MA Arriaga) focusing on peripheral vestibular pathology, reported 71 per cent sensitivity for rotational chair tests and 31 per cent for electronystagmography (ENG).Reference Arriaga, Chen and Cenci8 The present study, which focuses on MRI abnormalities in patients with central findings in rotational chair and videonystagmography tests, shows sensitivity of 87.67 per cent and 56.6 per cent for rotational chair and for videonystagmography tests, respectively, although these results vary depending on the age group tested (Table 3 and Table 4).
The most common causes of central vertigo with recurrent attacks are vestibular migraine and episodic ataxia type 2.Reference Strupp and Brandt4,Reference Hain, Cherchi and Biller9 A study by Swartz and Kern showed that those with migraine are four times more likely than those without migraine to have white matter hyperintensities in MRI scans.Reference Swartz and Kern10 This is in contrast to our findings where 31 individuals (45.5 per cent) with migraines had white matter hyperintensities in MRI scans versus 37 individuals with migraines (54.4 per cent) who did not have MRI abnormalities (Table 1).
During clinical evaluation of a dizzy patient, the focus of an MRI scan is directed towards the cerebellopontine angle and eighth cranial nerve, with less attention given to other parts of the vestibular pathway. Although white matter changes on T2-weighted MRI scans are sometimes dismissed as unimportant, a recent cross-sectional observational study of young patients without clinical evidence of cerebrovascular disease identified an association of cardiovascular risk factors with white matter hyperintensities or ‘leukoaraiosis’ in young adults.Reference Williamson, Lewandowski, Forkert, Griffanti, Okell and Betts11 Degenerative changes in small vessels and penetrating arteries are believed to cause white matter hyperintensities. Gait disturbance and dizziness have been attributed to white matter hyperintensities.Reference Ahmad, Cerchiai, Mancuso, Casani and Bronstein12,Reference Gong, Liu and Fang13
According to Colledge et al.,Reference Colledge, Lewis, Mead, Sellar, Wardlaw and Wilson14 routine MRI is unlikely to reveal a specific cause of dizziness, and further study is required when white matter lesions in the midbrain are observed in dizzy patients. They recruited volunteer subjects above the age of 65 years with and without vertigo and performed brain MRI. They reported that some degree of cerebral atrophy was observed in 75 per cent of dizzy as well as non-dizzy subjects. However, midbrain white matter lesions (both pons and brain stem lesions) were significantly more common in dizzy patients.
In a retrospective analysis, Ahmad et al. Reference Ahmad, Cerchiai, Mancuso, Casani and Bronstein12 reported increased severity and frequency of white matter hyperintensities in individuals with unexplained dizziness. Although the relationship between white matter hyperintensities and vestibular disorders is not yet clear, several mechanisms have been proposed.Reference Gamba and Pavia15 It has been suggested that by interfering with central processing of sensorimotor signals, white matter hyperintensities could cause a disconnection between the vestibular and locomotor regions of the brain. This in turn could result in impairment of postural response.Reference Ahmad, Cerchiai, Mancuso, Casani and Bronstein12 Another mechanism suggests that white matter hyperintensities may be interfering with higher cortical functions by disrupting the multiple neuronal networks involved in motor, visuospatial ability and other neurobehavioral functions.Reference Kim, MacFall and Payne16
White matter hyperintensities are divided into periventricular white matter lesions and deep white matter or subcortical lesions.Reference Kim, MacFall and Payne16 A study by Gamba and PaviaReference Gamba and Pavia15 reported that the most frequent sites of white matter hyperintensities in their study population with a mean age of 75 years were frontal and capsule areas. In our study, the most frequent sites were periventricular and deep cortical white matter hyperintensities with a mean age of 64.5 years.
In addition to white matter hyperintensities, cerebellar and cortical atrophy, and cerebellar, pontine and lacunar infarcts were observed in 17 of 74 of our MRI (+) group. Cerebellar atrophy has been reported to be a cause of central vestibular dysfunction.Reference Baloh, Honrubia and Kerber17 Luxon and BamiouReference Luxon, Bamiou and Schapira18 reported that vertigo associated with posterior circulation ischemia is common, with the commonest cause being atherosclerosis of the subclavian, vertebral or basilar arteries. However, dissection, arteritis, emboli, polycythaemia and hyperviscosity syndromes may also manifest in a similar way. Although generalised ischemia is not believed to be a specific cause of central vestibular dysfunction, an ischemic event could cause disturbance of the central vestibular pathway resulting in dysfunction.Reference Kinney, Wallace, Ross, Kinney and Hamid19
An older study by Stoddart et al.Reference Stoddart, Baguley, Beynon, Chang and Moffat20 reported that the incidence of structural abnormality identification using MRI in patients with central ENG findings is low. Currently, videonystagmography, video head impulse tests and vestibular evoked myogenic potentials are used for vestibular testing and advances in MRI technology have improved its sensitivity in identifying abnormal white matter lesions compared to CT.Reference Fazekas, Barkhof, Wahlund, Pantoni, Erkinjuntti and Scheltens21
Akoglu et al.Reference Akoglu, Akoglu, Cimilli Ozturk, Onur, Eroglu and Onur22 have suggested that diffusion-weighted MRI is warranted in patients with acute vertigo who are unresponsive to treatment in the emergency department, especially if they have a history of hypertension and coronary artery disease. MohamedReference Mohamed6 reported that 31 out of 51 (60 per cent) patients with videonystagmography tests suggestive of a central finding had a positive finding on MRI. This corroborates the results of the present study, where 30 out of 50 (60 per cent) patients with central findings on videonystagmography testing had abnormalities on MRI (positive predictive value 60 per cent; odds ratio = 2.2; CI = 1.05–4.9; p = 0.03).
Although the sensitivity of rotational chair tests was higher in relation to MRI abnormalities, their positive predictive value varied depending on the age group tested, ranging from 23.8 per cent (odds ratio = 2.3; CI = 0.1–52.6) in the group aged less than 40 years to 45.4 per cent (odds ratio = 0.5; CI = 0.08–3.6) in the group aged 40–59 years to 60 per cent (odds ratio = 0.5; CI = 0.09–2.6) in the group aged 60 years or older.
In the present study, the positive predictive value of central findings in relation to MRI lesions was 20 per cent (odds ratio = 0.26; CI = 0.004–15.1) for the group aged less than 40 years; 50 per cent (odds ratio = 1.0; CI = 0.02–52.2) for the group aged 40–59 years; and 38 per cent (odds ratio = 0.62; CI = 0.01–32.5) for the group aged 60 years or older. This could be explained by the fact that not all the older patients could undergo the entire gamut of vestibular tests compared to individuals under the age of 50.
Finally, this study identifies a relatively high predictive value for central vestibular findings and MRI abnormalities. In other neurotological cases, we justify performing MRI with even lower predictive values; for example, when there is asymmetric sensorineural hearing loss, an indicator for a cerebellopontine angle lesion, which can be significantly impactful to patients. Many of the lesions identified in this cohort are quite impactful. Accordingly, central findings on vestibular tests are a reasonable basis for requesting MRI in these patients.
The limitations of the current study include the retrospective design, which has a potential for bias, and the lack of a control group. In future, a prospective cohort study with age matched controls may help refine this retrospective pilot data.
• Central vestibular findings had a 50.9 per cent positive predictive value for magnetic resonance imaging (MRI) abnormalities across all age groups
• White matter hyperintensities, cerebellar and cortical atrophy, cerebellar, pontine and lacunar infarcts, and other central lesions can be identified on MRI scans in patients with central vestibular findings
• MRI is medically justified to further evaluate patients with central vestibular findings, and it is reasonable to request MRI for these patients
Author ORCIDs
G Mankekar, 0000-0001-6993-6622.
Acknowledgements
The authors would like to thank Dr Timothy Hain for sharing his publications and Mr Corey McGill for assisting with the statistical analysis.
Competing interests
None declared