Implications
The evaluation of conformation takes a central position in equine breeding programs. Because the classifications are not purely objective there is need for objective methods to evaluate rater assessments within the refinement of classification procedures. In this paper, we present novel methods from image analysis, which can be used for these purposes. The shape of horses, distilled here as coordinate data from standardized digital pictures, and methods from ‘geometric morphometrics’ provide an objective scale on which the subjective rating scores of different classifiers or different scoring protocols can be tested for their reliability and concordance.
Introduction
Breeding objectives and selection criteria in horses are mainly based on indicator or secondary traits, which are accessible at an early stage during a horse’s life cycle. Performance data, like the number of placings or earnings, depend on the activity of the horse and its owner and become available at a significant later stage of age, and they are also characterized by a complicated structure and a high number of environmental factors. Due to this situation, typical for horse breeding programs, several studies analyzed the relationship of indicator traits derived from linear type trait scoring procedures with performance data collected in the field or at standardized test situations (Koenen et al., Reference Koenen, VanVeldhuizen and Brascamp1995; Molina et al., Reference Molina, Valera, Dos Santos and Rodero1999; Cervantes et al., Reference Cervantes, Baumung, Molina, Druml, Gutiérrez, Sölkner and Valera2009; Viklund et al., Reference Viklund, Braam, Näsholm, Strandberg and Philipsson2010; Sanchez et al., Reference Sanchez, Gomez, Molina and Valera2013). The derived correlation structures are still strong strategic and economic arguments for breeding organizations to focus on conformational evaluations of type, leg and gait traits. The rationale behind scoring procedures is the transformation of morphological and psychological features of horses into numerical data suitable for ranking and analyzing procedures. Classification as an act, presupposes the perception of similarities as well as differences between individual animals, and it is directly related to the process of identification, definition, abstraction and systematization. Another criterion for classifications is that rankings should be objective and not be affected by the rater’s attitudes. In horse breeding, selection is based firmly on the ‘type concept’, but the trait type itself cannot be easily described on a morphological or biological scale (Brem and Kräußlich, Reference Brem and Kräußlich1998).
Beyond this background, the question of objectification in conformational evaluation is a permanent issue within scientific literature (Koenen et al., Reference Koenen, Aldridge and Philipsson2004; Druml et al., Reference Druml, Baumung and Sölkner2008; Kristjansson et al., Reference Kristjansson, Bjornsdottir, Sigurdsson, Crevier-Denoix, Pourcelot and Arnason2013; Duensing et al., Reference Duensing, Stock and Krieter2014). With regard to the ‘measuring problem of type’, we approach in this study an image-based analysis of equine shape. During the late 2010s, the impact of facial shape on human perception opened a new field of inquiry, which is being titled ‘Darwinian aesthetics’ (Schäfer and Bookstein, Reference Schäfer and Bookstein2009; Schäfer et al., Reference Schäfer, Mitteröcker, Fink and Bookstein2009). Here, shape or conformation, expressed by a set of homologous landmarks, preferably as points in a two-dimensional (2D) coordinate system or as bounding curves of outlines, is transferred into ‘shape coordinates’ (Bookstein, Reference Bookstein1991), which can be regressed one by one on the biological factors that cause them, or where it is assumed that they play a role in the feature’s expression. By merging regression analysis with ‘geometric morphometrics’ (GM) methodologies, it became possible to work backward from perception to form – to map a rating onto the image – and to visualize the aspects of shape encoded in the rating (Schäfer et al., Reference Schäfer, Mitteröcker, Fink and Bookstein2009). In this study, GM methods were adapted for the analyses of horse shape in order to first characterize equine shape variation within a cohort of 44 stud farm-bred Lipizzan mares. We further use the ‘empirical judgements’ and the ‘judgments of taste’ (compared with the definition of Kant, Reference Kant1790; Zangwill, Reference Zangwill2003) from conformation rating procedures for the association with 2D horse phenotypes derived as coordinates from image data. Our question is to test whether it is possible to define the shape variation in our horse sample and whether we are able to assign the ratings meaningfully to the biological variation captured via digital imaging.
Material and methods
Conformation scoring and imaging
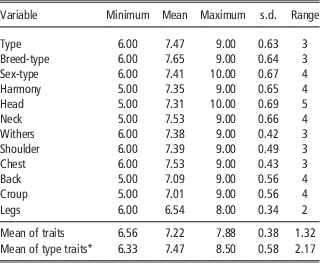
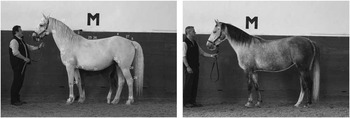
For this analysis, 44 Lipizzan mares from the Austrian state stud farm Piber were classified for 12 linear type traits by six classifiers according to a valuating scale resulting in 3156 individual scores (one judgment of a horse was missing). Trait descriptors and their mean values and standard deviations are presented in Table 1. The assessment of conformation was carried out separately by a total of six classifiers, three directors from Lipizzan state stud farms and three classifiers from private Lipizzan breeding organizations, using a structured score sheet at a scale of 10 points by one unit increase. Directly before and after the assessment of conformation, standardized pictures were taken of every single horse using a digital single-lens reflex camera according to the following principles: distance between horse and camera=18 m; focal width of camera lens=100 mm; camera set at the center of gravity of the horse. The horses were groomed according to the standard protocol for the evaluation of conformation during stud book registrations. In order to standardize the posture of the horses, they were subsequently handled to be captured in the so-called ‘open posture’, where the left foreleg stands vertical, the hoof of the right foreleg is located one to two hoof lengths behind the left foreleg, the cannon bone of the right hind leg is near the vertical and the hoof of the right hind leg is located two to three hoof lengths before the left hind leg (Figure 1). Neck and head should be presented in a natural way. For each animal, several photos were taken and minimum two line-ups were performed. Selection of pictures used for further analysis was based on an optimal-fit criterion, according to previously mentioned guidelines.
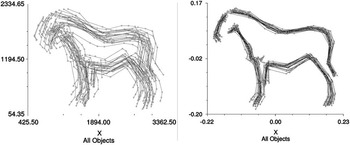
Digitized dataset (somatometric ‘horse model’, test data) before applying the Procrustes fit (on the left) and optimal superimposed specimens of unit size and minimum distance to the sample mean (on the right).

Mean values (from 263 observations: 44 animals, six classifiers, one classifier missed one animal), minimum, maximum values, standard deviations and range for 12 trait descriptors evaluated by six classifiers using a scale of 10 points by one unit increase

* Type traits: type, breed-type, sex-type and harmony.
Definition of horse shape: landmarks and outlines
The definition of landmarks, the x and y positions of the anatomical and shape features, is an essential question when studying biological shape variation. In general, there are five criteria landmarks should fulfil for GM studies: (a) homologous anatomical position – well defined anatomical features, which can be reproduced on all specimens under study; (b) consistent somatometric position – landmarks that are replicable relative to the topological positions along outlines of a morphological feature; (c) adequate morphological coverage of landmarks that are representative of the shape within the sample; (d) chosen landmarks should be reliable and repeatable; (e) all landmarks should be coplanar (Zelditch et al., Reference Zelditch, Swiderski and HWLF2004). The question of landmark selection was solved in a preceding iterative analysis of the test data comprising 21 samples (data not published), validating the variances at each landmark and correlating the shape variables from different landmark datasets. For this purpose, three different datasets were generated as follows: (1) anatomical horse model: a set of 25 purely anatomical landmarks; (2) somatometric horse model: a set of 40 anatomical and somatometric landmarks; (3) outline horse model: 18 anatomical and 15 somatometric landmarks combined with eight outlines (head upper side, neck, back, hindquarter, belly, chest and neck lower side, jaws and head lower side), summing up to 246 landmarks in total.
The anatomical horse model was lacking with respect to the general principles of landmark selection: (c) ‘adequate morphological coverage of landmarks’ and (d) ‘repeatability and reliability’. Due to higher informativeness and accurate representation of features, the comprehensive ‘outline horse model’ was chosen for further analyses (Figure 3). In order to focus on the specific trait descriptors (see Table 1 and Table 2) and to follow the principles of equine conformation classification where several morphological features are being classified separately from each other, seven sub-datasets out of the final dataset were created. Type traits and general mean of traits were analyzed on the basis of the original ‘outline horse model’. The ‘sub-datasets’ correspond in their landmark configurations to the following morphometric features: head, neck, withers, shoulder, back, croup and chest.
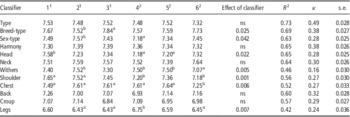
Multiple comparisons of means by classifier per trait and κ values per trait (44 scores/classifier and trait, except for classifier 1, who had 43 scores, in total 263 scores/trait)

Different superscripts indicate significant differences (P<0.05) after correction for multiple testing, significance level of the classifier effect from the linear model, R 2 from the linear model, κ value and standard error for the κ value.
1 Stud farm directors.
2 Private breeding organizations.
In total, 10.824 2D landmark coordinates were extracted from the digital images using the software tpsDig, version 2.17 (Rohlf, Reference Rohlf2005). Outlines of the specimens were transformed into semi-landmarks using the software package tpsUtil, version 1.58 (Rohlf, Reference Rohlf2004).
Statistical analysis of ratings and shape variation
Most studies evaluating classifier ratings of equine conformation traits were applying ANOVA or mixed models (Grundler and Pirchner, Reference Grundler and Pirchner1991; Kristensen et al., Reference Kristensen, Dueholm, Vink, Andersen, Jakobsen, Illum-Nielsen, Petersen and Enevoldsen2006; Sanchez et al., Reference Sanchez, Gomez, Molina and Valera2013). However, it has to be stated that the assumptions for these approaches in smaller datasets may be violated due to heterogeneity of variance among classifiers and due to the discrete scale of trait descriptors, where scores are not normally distributed. In order to assess the exact agreement among classifiers, and because the trait descriptors represent ordinal scores, the κ statistics according to Fleiss (Reference Fleiss1971) were calculated using the SAS macro mkappa (SAS Inc., 2003; Chen et al., Reference Chen, Zaebst and Seel2005), which is stable to multiple raters and missing data. In evaluations of classifying results, measures like repeatability or intra- and inter-class correlation (ICC) coefficients were commonly being cited (Grundler and Pirchner, Reference Grundler and Pirchner1991; Sanchez et al., Reference Sanchez, Gomez, Molina and Valera2013). With regard to this situation in the scientific literature, we also calculated the ICC adjusted to the formula of Spearman. The differences between the classifiers mean ratings were analyzed applying a linear model with classifier and horse as fixed effects. Multiple pairwise comparisons of means were adjusted according to Tukey & Kramer. All analyses and the graphical scatterplots were carried out using the SAS software packages, version 9.1 (SAS Inc., 2003).
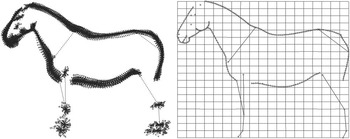
The central issue in the theory of GM is the optimal superimposition of the single specimens. Superimposition methods eliminate non-shape variation in configurations of landmarks by overlaying them according to some optimization criterion. Generalized Procrustes analysis (GPA) superimposes landmark configurations using least-squares estimates for translation and rotation parameters (Rohlf and Slice, Reference Rohlf and Slice1990). At the end of this process, the original coordinate data were replaced by ‘substitute Cartesian coordinates’ (shape coordinates; Bookstein, Reference Bookstein1991), as they vary around their own sample mean, being corrected for effects of scale (centroid size), for effects of orientation and for effects of location (Figure 1).
The somatometric ‘horse model’ at the left and the outline ‘horse model’ used for this study on the right.

Further, GM methods are firmly grounded in a statistical theory for how shape is defined and how patterns of shape variation may be analyzed (Kendall, Reference Kendall1984 and Reference Kendall1985; Small, Reference Small1996). Shape can be defined as a point in a k×p dimensional space (k dimensions, p number of landmarks), the basic assumption of ‘Kendall’s shape space’ (Goodall, Reference Goodall1991). When variation in shape is sufficiently small, it is possible to make a good linear approximation to the space and then use standard multivariate methods. The resulting space is of the same dimensionality as the shape space and may be viewed as tangent to it. The projections of the points corresponding to the observed shapes are used for subsequent statistical analyses. The most convenient shape variables in morphometric studies are ‘partial warp scores’, ‘uniform components’, ‘centroid size’ and ‘relative warp scores’. Documentation of this well-developed GM approach of image analysis is comprehensive. For further information and details see the reviews of Mitteröcker and Gunz (Reference Mitteröcker and Gunz2009) and Slice (Reference Slice2007).
After performing a GPA, the 213 semi-landmarks were slid to minimize the amount of bending energy between each configuration and the average of all specimens in an iterative process. The slid semi-landmarks can be treated in further analyses as conventional landmarks. The resulting shape coordinates were used for an analysis of principal components, also referred to as relative warp analysis in the literature, in order to investigate the natural shape variation within our sample of horses. The axes of principal components (PCs) summarize the main variation within the dataset. By using thin-plate splines, the shape patterns (linear combination of shape coordinates) moving along each PC axis can be described, quantified and visualized. Each score on the PC axis corresponds to an individual, and therefore to a point of a specific shape pattern curve. Further, we calculated multivariate regressions of shape coordinates onto evaluations for each trait descriptors. The association between classifier ratings and horse shape was depicted by thin-plate spline deformation grids along the valuating scale. Analyses and graphics were conducted using the SAS package, morphometric analyses were performed using tpsRelw v1.53 (Rohlf, Reference Rohlf2013a), tpsRegr v1.40 (Rohlf, Reference Rohlf2011), Morpheus et al. (Slice, Reference Slice1999) and tpsSuper v2.00 (Rohlf, Reference Rohlf2013b).
Results
Classifier ratings and reliability
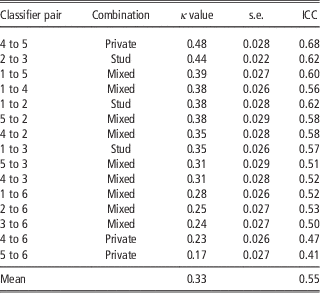
Consistency and reliability between ratings are of major concern in the selection procedure in small populations and especially in stud farms. In this case, we approached to use three different statistical methods to define the concordance of classifying results and to compare the results from each model. In Table 2, a conventional method, based on a linear model where the fixed effects classifier and horse accounted for 73% and 42% of variance (R 2), respectively, within the scoring data, is presented. In the traits type, harmony, neck, back and croup, the classifiers did not show differences in their mean ratings. The κ coefficients and ICC coefficients in Table 3 reflect the rater reliability within every pairwise combination of all six classifiers. In comparison with these results, Kristensen et al. (Reference Kristensen, Dueholm, Vink, Andersen, Jakobsen, Illum-Nielsen, Petersen and Enevoldsen2006) reported weighted κ coefficients for body condition scores within three cattle herds that ranged between 0.17 and 0.78. According to Fleiss (Reference Fleiss1971), values of 1 or 0 represent perfect or no agreement, values of 0.4 to 0.8 indicate moderate agreement and above 0.8 indicate excellent agreement. In Table 3, we see that classifier 6 achieved the lowest concordance with all others, showing pairwise κ values ranging between 0.17 and 0.28. All other rater pairs varied between 0.31 and 0.48. In total, the κ coefficient for all raters and all scores was 0.33, split into stud farm directors and private raters, this value reached 0.39 and 0.28, respectively.
Classifier uniformity between the six raters in all traits and horses (3156 scores in total, 528 scores/classifier – 12 traits×44 horses, except for classifier 1, who had 516 scores), represented by κ coefficients plus standard error and inter-correlation coefficient (ICC) adjusted to Spearman

The κ test accounts for the exactness of agreement between scores given by different classifiers.
The ICC coefficients showed a similar ranking of concordance. In Table 2, the agreements of all six classifiers according to each trait descriptor are shown. Lowest agreement was found in the traits withers, legs, shoulder, chest, sex-type and head. The same traits proved to differ significantly in their means. Without classifier 6, the agreement could be increased. Only the traits legs, croup and back did not improve substantially, underlining the disagreements between the remaining five raters. In total, the results considering the similarity of ratings reflect the difficulties of conformational evaluation. The presented κ and ICC coefficients imply only moderate-to-low concordance compared with results from body condition scoring in dairy cattle (Kristensen et al., Reference Kristensen, Dueholm, Vink, Andersen, Jakobsen, Illum-Nielsen, Petersen and Enevoldsen2006). As the κ statistics are known to be sensitive for the choice of scale, the results presented in Table 2 describe that classifiers differ in their mean ratings and in their use of scales. In a small-scale experiment based on rating data from 16 students of 12 Lipizzan horses during a teaching workshop (data not published), the κ values ranged from 0.02 to 0.09. These observations underline the difficulty in achieving consistent results in the evaluation of horse conformation in small-sized horse breeds.
The Lipizzan horse shape space
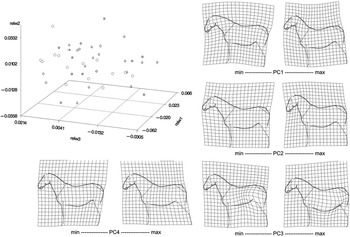
Shape variation can be reconstructed and visualized along the PC axes of the shape coordinates. In the ‘Lipizzan horse shape space’, where the single animal configurations rotate against their mean (Figure 3), the first four PCs account for 73.53% of the total shape variation within the sample (Figure 4). PC 1 illustrates the contrast between neck and head postures a horse can take during handling. This major source of posture variation accounts for 43.61% of the variation in the dataset, and is, therefore, a severe effect that has to be considered in future studies. PC 2 (accounting for 13.16% of variation) represents the conformational differences between two types of horse models: the more compact, muscular type, often referred as to the ‘baroque type’, with a concave and heavy neck line, and a more ordinary horse type showing a long and light neck, with stiff connection to the head and weaker hindquarters. There are also differences in posings of the head, which can in this case be drawn back to anatomical reasons. PC 3 (accounting for 10.03% of variation) reflects two sources of variation as follows: one is the differentiation between mares in training and mares in breeding, the second is rooting in the sexual dimorphism, which is clearly visible in the two splines of Figure 4. Along PC 4 (6.74% of variation), differences are mostly due to effects of leg posture variability, another source of error that has to be considered in subsequent study designs. In Figure 4, a 3D scatter plot of PC 1 to PC3 is shown, where the horses are marked by colors according to their ratings: blue=mean score >8; red=mean score ⩾7.5 to 8; green=mean score ⩾7 to 7.5; and black=mean score ⩾6.5 to 7.
Aligned, scaled and unit sized configurations of 44 Lipizzan mares on the left, the resulting mean configuration, the mean Piber mare, at the right.

PCA of partial warp scores based on the data pool of 44 Lipizzan horses. Shape changes are shown along PCA axes 1, 2 and 3, which account for 67% of shape variation within this sample of mares from the Austrian stud farm of Piber. PCA=principle component analysis.

Encoded ratings: regression analysis
The next step in the analysis was to perform a regression analysis of each single shape coordinate on the rating data in order to determine the shape variation that is associated with the classifying results (shape regression). The target figures are corresponding to the original scale of the score sheet, where the negative examples account for a score of 4 points and the positive examples account for the maximum number of 10 points. Other studies are using scales of three and more standard deviations from the mean (Schäfer et al., Reference Schäfer, Mitteröcker, Fink and Bookstein2009; Windhager et al., Reference Windhager, Schäfer and Fink2011). In this analysis, the regression variables did not refer to the pool of variance caused by differences in posture, which shows that the rating variables are sensitive to specific shape coordinates responsible for variation within trait descriptors.
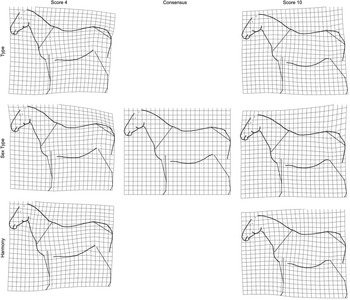
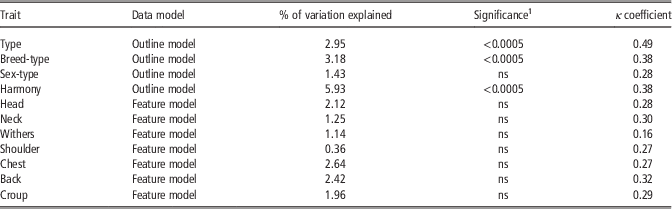
Within the type traits (type, breed-type, sex-type and harmony), which are by nature more related to a ‘judgment of taste’ than to an ‘empirical judgment’, we observed quite similar deformations, except for the variable sex-type, where the grid deformation differentiates clearly between head and neck shape (see Figure 5). Horses with low ratings have a head with a bony and heavy structure and their neck is elevated with prominent withers. On the contrary, the target configuration of score 10 at the right shows a refined morphology of skull, less prominent withers and an articulated hindquarter. All regressions of type-related trait ratings on shape were significant (P<0.05), except for sex-type, where ratings accounted for 1.43% of shape variation. The ratings of breed-type explained 3.18%, of harmony 5.93% and of type 2.95% of the shape variation within the sample. Compared with shape regressions on ratings in humans, dominance ratings explained 8%, masculinity 7.3% and attractiveness 3.3% of shape variation (Windhager et al., Reference Windhager, Schäfer and Fink2011). In Table 4, results from the shape regression are presented. Three of the regressions achieved a significant coefficient. When the significant models were compared with measures of agreement like the κ coefficient, an association between levels of concordance of classifiers and the ability to regress the mean rating of the trait onto the shape coordinates was evident. Subsequently, it becomes clear that raters in ‘judgments of taste’ tend to share their opinion more than in ‘empirical judgments’ and their rankings can successfully be regressed onto shape.
Female Lipizzan horse shape changes according to the valuating score sheet based on the full horse model. The consensus is deformed to a target configuration of score 4, respectively, 10 points. Shape changes between type and breed-type were highly similar; therefore, the graphical representation for the trait descriptor breed-type is not shown here.

Significance levels of regressions of shape models onto ratings, percentage of variation explained by the regression, significance level of the regression and κ coefficients (all classifiers) of rating data, within the sample of 44 Lipizzan mares

1 ***P<0.001.
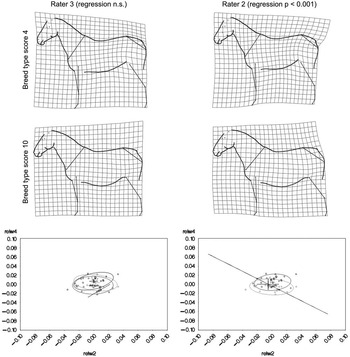
The difference between two ratings is shown by the example of shape regressions from rater 2 and 3 within the trait breed-type (Figure 6; see also Table 2). Rater 2 ranked the animals in a way that his scores resulted in a significant (P<0.05) shape regression, whereas the ranking of rater 3 yielded a non-significant regression. Figure 6 points out the difference in perception, where rater 2 clearly emphasizes the croup and hindquarters being long and heavily muscled and the neck showing a well-curved upper line. Rater 3 was not that precise in his encodings onto the shape coordinates. Assuming that a precise and significant ranking results in a better differentiated clustering of relative warp scores (PCs of shape coordinates) than a non-significant ranking does, a cluster analysis should reflect to this difference. In this preliminary study, we present the clustering by using PC scores of the 488 partial warp scores (Figure 6). In the two corresponding scatterplots of PC2 and PC4, we can see that rater 3 was using a wider scale with overlapping ratings. Rater 2 was scoring nearly on two levels only, but achieving a relatively clear order of individual shapes.
Shape regressions of the trait breed-type of two significantly (P<0.05) differing raters. Their ratings are plotted onto the shape space of PC 2 and PC 4 (compare with Figure 4). Orange=score 7; green=score 8; blue=score 9; and red=score 6. Ellipsoids are chosen for better visualization of ratings and contain 75% of the data. PC=principal component.

The shape deformations of the feature traits regressed on their trait descriptors are shown in Supplementary Figures S1 and S2. Although they are not significant (P>0.05), plotted differences agree with the principles of equine conformation evaluation. For the variation explained by these shape regressions of the feature traits see Table 4.
Discussion and conclusions
In this preliminary study, we successfully applied image analyzing methods and GM methods on a set of standardized photographs of Lipizzan horses in order to characterize the shape variation and to analyze its covariation with rating scores from expert Lipizzan conformation classifiers. As conformation scoring procedures and the underlying classification protocols are objects of an intensively led discussion since the 1970s (Grundler and Pirchner, Reference Grundler and Pirchner1991; Molina et al., Reference Molina, Valera, Dos Santos and Rodero1999; Viklund et al., Reference Viklund, Braam, Näsholm, Strandberg and Philipsson2010; Sanchez et al., Reference Sanchez, Gomez, Molina and Valera2013; Duensing et al., Reference Duensing, Stock and Krieter2014), we aimed to test the major statements frequently reported within this issue. One central requirement within classifications of conformation is the reliability of ratings. In the past, several approaches were used to characterize this measure. In general, two methods were applied in order to estimate the agreement among and within classifiers: repeatability analysis and ICC. Repeatability measures reflect the accuracy of a single rater to reproduce the same scores within one animal several times, and it stands for the consistency of a rating. Grundler and Pirchner (Reference Grundler and Pirchner1991) reported values ranging from 43% to 64%, Sanchez et al. (Reference Sanchez, Gomez, Molina and Valera2013) listed repeatabilities from 61% to 100% and ‘reproducibility of traits’ ranging from 0.89 to 0.99. When revoking the definition of classification (identification, definition, abstraction and systematization), the measurement of repeatability is strongly associated with a person’s ability for definition, systematization and identification, and the latter has to be carefully taken into account when referring to this measurement, because classifiers are also highly trained to rank and remember numbers and they do not only rely on their visual perception alone. The agreement among classifiers is a major task in animal breeding, and associations respond to this by organizing intensive education and training programs. The underlying principles for this measure are definition, abstraction and systematization. Designing trait descriptor sheets, splitting the animal model into different segments and the establishment of linear trait profiling procedures were all means for the enhancement of the concordance of ratings among raters. Statistically it has been described by ICC coefficients, and reported values vary from 0.10 to 0.99. Training courses especially focus on the definition of traits (use and definition of means) and on the use of scale. In our study, we applied, besides the Spearman correlation, the κ statistics in order to account for differences in scale. The resulting values between 0.16 and 0.53 imply only low-to-moderate agreement among the six classifiers, whereas the correlation coefficients propose a moderate-to-good agreement according to the definition of Fleiss (Reference Fleiss1971). The differences in means reflect the rater’s individual weightings within traits, whereas the differences in scale are the effects of training and experience. In our case, we could prove the difference between experienced stud directors and raters from private breeding organizations, and both – differences in scale and in means – result in different rankings of animals, when using mean scores across raters as well.
There are several solutions how to model the effect of rater within breeding programs using BLUP breeding value estimation. Generally the effect of classifier itself is considered as a confounding effect of the testing day where the variation of the presented horses and the variation of mean ratings of classifiers are merged together. Veerkamp et al. (Reference Veerkamp, Gerritsen, Koenen, Hamoen and De Jong2002) proposed as a correction method for the classifier effect (consistency, mean and scale effect) to calculate the heritability and variance components of each classifier, which can be included into the mixed model equation. The same authors also introduced a decision diagram how to enhance the quality (reliability and consistency) of rating data. In small-sized populations, as it is the typical case in horses, statistical modeling is mostly not possible and the selection program purely relies on the raw rankings based on conformational traits. Besides the numerical and statistical analysis of rating data, there remains the question how the ratings do correspond to the situation in reality. Are ranking scores clearly describing the biological differences in morphology of horses?
In this study, we first introduced an objective scale – the ‘horse shape space’ – on which the different ratings and rankings can be evaluated and visualized. By the use of shape regressions on the ratings, we could demonstrate with our preliminary results which trait descriptors significantly correspond to a specific Lipizzan horse shape. As previously mentioned, several levels of concordance and significant differences in means existed within the rating data. In addition, it was astonishing that only the traits with high reliability (κ value >0.32) did significantly regress to the shape variables. These trait descriptors were type, breed-type and harmony, all traits that cannot be ranked empirically and generally are not measurable. In the literature, it is well documented that these so-called ‘type traits’ (‘judgments of taste’; Kant, Reference Kant1790) show higher heritabilities than functional traits, or as introduced in this study feature traits (empirical judgments) (Molina et al., Reference Molina, Valera, Dos Santos and Rodero1999; Koenen et al., Reference Koenen, Aldridge and Philipsson2004; Druml et al., Reference Druml, Baumung and Sölkner2008). Low consistency within the scoring data had a major effect on the mean ranking order, which was used for the regression analysis. Finally, both, the fact that type traits can better be defined and ranked on a biological scale and that they are more agreed on between classifiers, contradicted the principles cited in the literature, where for the refinement of phenotype classification procedures the following principles are proposed (Veerkamp et al., Reference Veerkamp, Gerritsen, Koenen, Hamoen and De Jong2002; Duensing et al., Reference Duensing, Stock and Krieter2014): (1) increasement of scale; (2) improvement of trait definition; (3) enlargement of number of traits. According to our results, the scale or the number of traits are not the limiting factors in equine conformation assessment. The highest impact for the validation of ranking scores on a biological scale is the consistency between ratings and raters, and here improvement will be needed in order to enhance the quality of data.
Finally, the ‘horse shape space’ offers the possibility to assist in trait definition and in rating evaluation, as it is an adequate biological and objective pendant to human perception of conformation, which is expressed in rankings only. In this preliminary study, there are still questions to be solved, such as the variance caused by different postures of individuals and the optimization of landmark definition; however, with this dataset, it was possible to highlight some basic concerns within the visual process of conformation scoring in horses.
Acknowledgements
The authors acknowledge the financial support by the Austrian Research Promotion Agency (FFG) and by Xenogenetik. For assistance and cooperation, the authors thank the stud farm of Piber and the Lipizzan International Federation (LIF).
Supplementary material
To view the supplementary material for this article, please visit http://dx.doi.org/10.1017/S1751731114003309