1. Introduction
The Great Depression of 1930s, followed by the Second World War (1939–1945) had jeopardized the economic and financial health of the world. In order to revive and develop the world economic order in the post-war situation, the Bretton Woods Conference was held in July of 1944 (World Bank, 2020), which led to the birth of international multilateral institutions such as the World Bank and the International Monetary Fund. The first worldwide multilateral free trade agreement, known as the General Agreement on Tariffs and Trade (GATT) also grew out of this conference in the year 1948. In 1995, the World Trade Organization (WTO) replaced the GATT as a multilateral institution with the primary objective to promote freer trade worldwide. The principles of the multilateral trading system include the ‘most favoured nation (MFN)’ and the ‘national treatment (NT)’ clauses.
Ideally, signatories to the WTO must have the proclivity to endorse liberal trade policies in terms of lower tariffs and non-tariff barriers. However, the observed reality is quite different. For instance, in India, the MFN weighted average advalorem tariff profile for all products imported show an overall downward trend from 56.36% in 1990 to 20.14% in 1997. This was followed by a rise to 24.34% in 1998. Post 1998, tariff rates tended to fall and reached 8.99% in 2006 and then rose to 11.99% in 2007. The year 2015 also experienced a rise in tariff rate to 7.49% as opposed to 6.34% in the preceding year. Hence, the tariffs exhibit a non-monotonic movement. More recently, the instances of tariff retaliation in 2018 by countries such as India and China in the event of hikes in the United States (US), import tariffs on steel and aluminium are a manifestation of the dwindling role of WTO to promote free trade. The US has imposed an import tariff of 25% on steel and 10% on aluminium on grounds of national security concerns.
The above instances give rise to anomalies since nations are reluctant to give up protectionist trade policies completely despite such policies being largely inefficient and in conflict with the principles of the WTO. Apparently, policies are set in political contexts and cannot be analysed solely from the viewpoint of economics. The objectives of the policy makers differ from that of pure social welfare maximization. The policies set are contingent upon a number of factors, the political support from individual groups being a prominent one. Generally, incumbent governments seek to maximize political support to be in power. Similarly, interest groups in the industry are assumed to overcome the free rider problem and organize themselves into lobbies that make campaign contributions to the incumbent government to sway policies in their favour. Consequently, the policy maker may set policies that maximize the weighted sum of pure social welfare and campaign contributions from lobbies. The members of these lobby groups may be the owners of specific inputs within an industry who influence the government to choose policies which serve their interests. These policies can be in the form of concessions, tax credits, subsidies, domestic protection, laxer regulatory norms, etc. The interests of different lobby groups can be conflicting in nature and are contingent upon the share of each group in the population as well as its bargaining power as to which group emerges to be the ultimate beneficiary.Footnote 1 Interest groups can also emerge outside the production sector. These include lobbies formed by civil society, e.g. environmental groups such as the Greenpeace.
Trade protection also emanates from the flow of certain goods and services that are hazardous to human health, flora and fauna, and cause environmental damage. In fact, Article XX of the GATT included exceptions to free movement of goods and services in case they induce harm to human, plant, or animal life. However, it was through the General Agreement on Trade in Services (GATS) during the Uruguay Round of trade negotiations (1986–1994), which came into force in the year 1995, that the aspect of trade in ‘environmental services’ gained prominence. This was followed by the formation of the Committee on Trade and Environment (CTE) in 1994 with the objective of ‘identifying and understanding the relationship between trade and the environment in order to promote sustainable development’.
A study by Stevens (Reference Stevens1993) outlines the effects of trade on the environment, namely product effect, scale effect, and structural effect. Based on the argument that trade serves as an engine of growth, countries with liberalized trade regimes perform better in terms of higher national income. Rising incomes increase demand for a cleaner environment, which is assumed to be a normal good and hence improves environmental quality. However, trade expansion also results in a rise in world production of goods and services and hence aggravates the rate of resource extraction in order to meet demand. Besides, the services of the ecosystem are not priced properly, thereby causing market failure. This causes adverse impacts on the ecology and the environment. This is known as the scale effect. The structural effect is associated with the geography and location of production and consumption activities based on the inherent carrying capacity of the environment. Consequently, there are product- as well as process-related trade measures, which are aimed at protecting the environment. Apparently, nations have repeatedly used and misused these measures in order to impose barriers to free trade. As members of the WTO are circumscribed by trade negotiations, they take refuge in non-tariff barriers (NTBs) such as sanitary and phyto-sanitary measures (SPS), technical barriers to trade (TBT), and counter-veiling duties for domestic protection. The dolphin–tuna controversyFootnote 2 is a leading example in this case. Hence, the setting of both trade and environment policies displayed interdependencies.
While the earliest theoretical and empirical research mainly focuses on political incentives that act as a driving force in the determination of trade policies, the potential inter-linkages between trade and environmental policies when the incumbent government is politically motivated have been explored much later. Primarily, the political economy factors contributing to the variation in the level of trade protection across industries can be classified under two broad categories, i.e. demand-driven factors and supply-side factors. Demand-driven factors could be explained by the theory of special interest politics. Individuals or entities, who have direct stakes in the policies that are chosen, tend to bribe the policy maker to tweak policies in their favour. Incumbent governments, however, maximize political support to come to power. Decisions of policy makers in power are also driven by possibilities of re-election. Earlier studies on demand-driven trade protection include Olson (Reference Olson1965), Caves (Reference Caves1976), Grossman and Helpman (Reference Grossman and Helpman1994, Reference Grossman and Helpman1995), Maggi and Rodriguez-Clare (Reference Maggi and Rodriguez-Clare1998), and Celik et al. (Reference Celik, Karabay and McLaren2013). However, the government might also resort to adopting variegated populist measures in order to gain political mileage. These supply-side factors coincide with the government's objective to promote equity, social justice, and efficiency (Ball, Reference Ball1967; Constantopoulos, Reference Constantopoulos1974; Fieleke, Reference Fieleke1976). Thus, the government offers more protection to sectors where the proportion of unskilled workers is higher or wages are lower. Sometimes, the government might be wary of uncertainties associated with any policy change that results in a cascading effect where the present level of trade protection is contingent upon its past levels (Corden, Reference Corden1974; Lavergne, Reference Lavergne1983). On grounds of efficiency, the government protects those sectors in which the import penetration ratio is higher and the export to production ratio is lower. This has been empirically validated by Trefler (Reference Trefler1993). In addition, the supply-side motivations may well be purely electoral in nature as in Caves (Reference Caves1976), where the elected government offers more protection to industries with the largest vote base.
Empirical studies by Baldwin (Reference Baldwin1985) and Trefler (Reference Trefler1993) suggest that factors, such as number of workers per unit of output, share of unskilled workers employed, wages, seller concentration, import penetration ratio, and levels of intitial protection, are statistically significant in explaining trade protection. The theoretical predictions by Grossman and Helpman (Reference Grossman and Helpman1994) have been empirically tested by Goldberg and Maggi (Reference Goldberg and Maggi1999) and Gawande and Bandyopadhyay (Reference Gawande and Bandyopadhyay2000), who find that the ratio of inverse of import penetration ratio to import elasticity of demand is positive and significant for industries that have organized lobby groups. The reverse is true for industries that could not form lobbies. Other factors such as the import elasticity of demand are inversely related to the level of protection (which is based on the Ramsey pricing rule). and campaign contributions have a positive and significant impact on trade protection.
1.1 Trade-Environment Linkages amid Special Interest Politics
As the trade–environment debate drew interest from both researchers and policy makers, the underlying policy distortions emanating from the political process emerged as an offshoot of policy linkages. There were consistent attempts to theorize the interplay of trade and environmental policies with a thrust on special interest politics (Schleich, Reference Schleich1999; Schleich and Orden, Reference Schleich and Orden2000; Conconi, Reference Conconi2003; Mehra, Reference Mehra2010). Under the assumption of a small open economy, Schleich (Reference Schleich1999) argues that endogenously determined trade policies lead to higher environmental quality than production policies aimed to address pollution problems. However, the endogeneity of both the policies may also result in the policy maker facing a trade-off between lower protection and less stringent environmental regulation versus higher tariffs and higher environmental regulations (Mehra, Reference Mehra2010). A large country analysis undertaken by Schleich and Orden (Reference Schleich and Orden2000) and Conconi (Reference Conconi2003) reinstate policy linkages and interdependencies. Schleich and Orden (Reference Schleich and Orden2000) show that inefficient trade policy results in higher environmental quality than efficient domestic policy (environmental policy). In the presence of green lobbies, the political equilibrium is characterized by lower environmental taxes on account of emission leakages and reduced incentive for higher environmental taxes by green lobbies (Conconi, Reference Conconi2003).
In light of the above, there have been some useful contributions in theorizing interactions between trade and environmental policies when interest groups negotiate with the government over both. However, the existing literature does not investigate these interdependencies using data. Broadly speaking, a majority of empirical studies on policy distortions driven by the political incentives of interest groups have been confined to either trade policies or environmental policies, but not both. Moreover, another vast strand of literature on trade–environment linkages is confined to examining the effect of environmental regulations on trade flows, namely, the widely popular ‘pollution-haven effect’ and the Porter's hypothesis (Xing and Kolstad, Reference Xing and Kolstad2002; Cole and Elliott, Reference Cole and Elliott2003; Levinson and Taylor, Reference Levinson and Taylor2008; Costantini and Crespi, Reference Costantini and Crespi2008). Since political action groups have direct stakes in trade policies, the use of trade flows for understanding trade–environment policy linkages seems to be imprecise. Consequently, the aspect of trade and environmental policy interdependencies, if any, as well as the underlying ramifications of domestic politics on these interdependencies are hitherto unexplored empirical questions. While some theoretical studies on the political economy of trade and environmental policy linkages have been illuminating, e.g. Damania (Reference Damania, Fredriksson and List2003) and Mehra (Reference Mehra2010), the corresponding empirical questions are still unanswered. This sets the motivation for the present study, which aims to inspect the empirical validity of the potential linkages between trade and environmental policies in the presence of industry as well as firm-level lobbying. In a way, this study complements the well-established theory that postulates that the incumbent government faces a trade-off between distortionary policies driven by political considerations and the social welfare of the citizenry (Mehra, Reference Mehra2010).
The rationale for this study also stems from the fact that there has been a considerable thrust on linking a diverse range of aspects, including gender, wildlife, labour, ecology, environment, and sustainability, to bilateral as well as multilateral trade negotiations. For instance, the 11th ministerial conference of the WTO held in Buenos Aires, Argentina in December 2017 has brought to the fore the aspect of inclusive development as one of the key objectives while promoting free and fair trade. In fact, Hauer and Runge (Reference Hauer and Runge1999) and Vogel (Reference Vogel, Vig and Faure2002) point out that it is the developed nations who are in favour of linking trade and the environment as far as multilateral negotiations are concerned. In contrast, developing economies around the world are quite wary of the ramifications of such linked negotiations. This is due to the structural constraints faced in meeting the stringent health and safety standards set by the former. What is more worrisome is that these standards/trade rules may be deem to be discriminatory. Apparently, an upshot of a linked negotiation between two trading partners, typically between a developed and a developing/underdeveloped economy, unlocks the likelihood of misuse of health and safety standards as substitutes of protectionist policies by the former. Further, such strict standards in developed nations restrict market access to domestic producers of the less developed economies. Consequently, the aspect of linking trade and environment has been met with strong opposition from the developing nations. For example, in the context of the 11th ministerial conference of the WTO, unlike countries such as the US and Canada, India expressed dissent to the health and safety standards associated with labour inputs, promotion of female entrepreneurship, especially in case of micro, small, and medium enterprises (MSMEs), and inclusive development.
Moreover, the fear of foreign competition also impels domestic producers to bid for policies that favour their own interests, e.g. trade restrictions, tax credits, rebates, concessions. The politically motivated incumbent government relies on the implicit contract with these special interest groups and sets policies that maximize the prospects for re-election. The political welfare, being a function of both campaign funds and welfare of the average voter, the incumbent faces a trade-off between policies that exclusively favour the interest groups vis-à-vis policies beneficial to the general electorate. For instance, a higher level of domestic protection in an import competing sector that is pollution-intensive would increase pollution and environmental damage owing to a rise in domestic production. Since deterioration of environmental quality adversely affects the average welfare of a voter, the policy maker may contain the loss in social welfare by setting a relatively stringent environmental policy. However, stringent environmental norms entail higher compliance costs that adversely affect the competitiveness of domestic firms and industries. In fact, the burden of environmental regulations falls disproportionately on the import-competing sectors of the less developed economies owing to the structural constraints embedded in harnessing industrial skills and technologies. Not surprisingly, the immediate effect is a rise in production costs. Hence, the fundamental challenge faced by policy makers in such countries is to strike a balance between competitiveness and compliance. Presumably, the incidence of rampant corruption (Bertrand et al., Reference Bertrand, Djankov, Hanna and Mullainathan2007) coupled with considerable emphasis on meeting growth targets tend to understate the significance of environmental safety and compliance. Consequently, in the present context, it is quite unlikely that policy makers would consider environmental regulations while choosing trade policies for the nation.
In order to test the hypothesis, I consider the case of India, a large developing economy, which faces stiff competition in the manufacturing sector when it comes to developed economies like the US and Japan, as well as South Korea and, notably, its immediate neighbour, China. India's manufacturing sector, albeit characterized by a sizeable potential for growth under the government's flagship programme, ‘Made in India’, barely contributes to the gross domestic product (GDP) in comparison to the service sector.Footnote 3 Its share in the GDP stood at around 17% for the period 2006–2010 and experienced a steady decline to 13% in 2019 with minor fluctuations, which further dipped owing to the unanticipated shock with the outbreak of COVID-19 (World Bank, 2021). This, in effect, envisages the need for protection in the manufacturing sector. In fact, the data on the simple average of the industry tariff rates corroborate the proposition. Tariffs rates exhibit a sustained increase from 2010 to 2011 onwards. It stood at 8.9% in 2010–2011, which further increased to 9.5% in 2014–2015, 10.8% in 2019–2020, and 11.1% in 2020–2021 (EXIM Bank, 2021). Moreover, the involvement of industrial groups, such as the Confederation of Indian Industries (CII), the Associated Chambers of Commerce in India (ASSOCHAM), and the Federation of Indian Chambers of Commerce and Industries (FICCI), makes it discernible that industrial lobbying is quite common in India. Amid the outbreak of the COVID-19 pandemic in India in early 2020 and the border tensions with China, FICCI has focused on import substitution policies in order to make domestic firms more competitive. In its industry wide five-point action plan, ‘PEACE’, an acronym for Productivity, Efficiency, Alternates, Competitiveness, and Exports, FICCI extends support to the government's ‘Atmanirbhar Bharat Abhiyan’ to promote efficiency and resilience in domestic industries. In order to achieve resilience, it is necessary to identify a product that is imported and boost manufacturing of it in India. In addition to this, the action plan also states the need for industries to explore alternatives to supplies from abroad through market diversification and domestic procurement. The proposal also suggests that Indian industries should export 5% of their output and ramp up the country's share in global exports to 10% through market diversification (The Economic Times, 26 June 2020).
Historically, India has witnessed the highest trade barriers until the economic reforms of 1991 integrated the nation with the world market. The average most favoured nation (MFN) applied tariff rates for the manufacturing sector at the four-digit NIC was around 85% in the year 1990 (EXIM Bank Research Brief, 2018). Yadav (Reference Yadav2008) and Gowda and Sridharan (Reference Gowda and Sridharan2012) outline qualitatively how political action groups emerged in India during the liberalization era beginning in the 1990s. Trade openness was perceived as a threat for domestic industries in the light of facing competition from the foreign counterparts. For instance, the ‘Bombay Club’ formed in 1992 comprised members from a diverse set of industries, such as the Bajaj industries, the Birla group, and the Tatas and Reliance Industries (Milner and Mukherjee, Reference Milner, Mukherjee and Mukherjee2011). Furthermore, a research brief by the Export–Import (EXIM) Bank of India finds strong empirical evidence of industry lobbying in the Indian manufacturing sector and, more particularly, in the context of negotiations for trade policies (EXIM Bank Research Brief, 2018).
While industrial protection spurs domestic production in the import-competing sectors, which is driven by a rise in domestic prices, it is a nemesis to environmental quality, particularly in case of sectors that are pollution intensive, e.g. chemicals, iron and steel, cement, paper and pulp. This necessitates the urgency for institutional regulations to control and mitigate the large negative externalities associated with pollution-intensive sectors. Notwithstanding the legislative efforts to control pollution including the Water (Prevention and Control of Pollution) Act (1974), the Water (Prevention and Control of Pollution) Cess Act (1977), the Air (Prevention and Control of Pollution) Act (1981), and the Environment Protection Act (EPA) (1986), the Indian economy reeks of poor enforcement mechanisms, primarily due to the nature of regulations, i.e., command-and-control directives (Priyadarshini and Gupta, Reference Priyadarshini and Gupta2003). Unlike price-based instruments for environmental regulation such as carbon tax or abatement subsidies, command-and-control measures are typically less effective in mitigating pollution, especially when institutions are weak – a common feature of a developing economy.
Notably, environmental regulations have a minimal impact on pollution when the probability of detection of polluting firms is low or the non-compliance charges are negligible (Priyadarshini and Gupta, Reference Priyadarshini and Gupta2003). As it stands, weak institutions and corrupt governance benefit polluting firms by cutting down costs associated with compliance, which adversely affects the environmental quality. It is in this milieu that the government of India launched the National Action Plan for Climate Change in the year 2008 as a reform policy to mitigate environmental damage through a gradual transition to greener energy use.
In recent years, there has been a dramatic shift in the discourse on green policies in India. It has made substantial progress in harnessing and deploying cleaner energy. The government has set an ambitious target of 450 gigawatts (GW) of renewable energy generation by 2030 (Economic Times, 31 January 2020). Such measures send a strong message to the international fora with regard to commitment and probity of nations to combat the pertinent issues of climate change and greenhouse gas (GHG) emissions (Mehra and Bhattacharya, Reference Mehra and Bhattacharya2019). As a result, prospects of international competition in achieving smoother transition to clean energy have expanded. Both developed and developing countries are embracing policies related to cleaner energy generation and deployment. As nations compete in green industrial policies in terms of subsidies, tax concessions, and R&D expenditures, and engage in trade in equipments used in renewable energy generation, trade and environment conflicts become inevitable and more complex (Hajdukiewicz and Pera, Reference Hajdukiewicz and Pera2020). While the energy transition driven by green industrial policies would have an impact on environmental quality, it would have severe implications on trade flows as well as trade policies. The most compelling evidence in favour of the above argument is episodes of trade disputes between China, India, and the US for the period 2018–2022. The dominance of China in the renewable energy market has challenged the domestic industry of its major trading partners, India and the US. In the year 2012, the US slapped countervailing duties and anti-dumping tariffs on solar panels in defence of its domestic manufacturers. The US has also dragged India into the dispute settlement body of the WTO against the local content requirement for solar cells in India's Jawaharlal Nehru National Solar Mission (JNNSM) Programme in 2013. In October 2020, India banned imports of completely built units of air conditioners with refrigerant from Japan on grounds of its obligation under the Montreal Protocol (The Hindu, 5 October 2021).
As Hajdukiewicz and Pera (Reference Hajdukiewicz and Pera2020) point out that these contentious issues are also driven by domestic lobbying by solar manufacturers; growing protectionism and economic nationalism have also affected trade relations between trading partners who are signatories to a host of regional trade agreements (RTAs). For example, amidst growing border tensions between India and China, who are members of the Asia-Pacific Trade Agreement (APTA) with effect from 1 January 2002, trade relations between the Asian giants have soured since May 2020. In August 2020, India raised tariffs on imports of green energy equipments from China (a 20% basic customs duty on solar modules, cells, and inverters) (Bhaskar, Reference Bhaskar2020; Stoker, Reference Stoker2020).
Given this as a background, this study aims to test the interdependencies between trade and environmental policies in India. This is the first contribution to the literature on trade–environment linkages – the existing studies investigate the causal links between trade flows and/or foreign direct investment (FDI) flows and environmental regulations. Moreover, it studies how these linkages unfold amid interactions between the stakeholders, namely, the politically motivated incumbent government and firm lobbies. This study also makes a novel attempt to investigate the impact of firm lobbying on trade policy outcomes for pollution intensive industries by controlling for environmental regulations.
For a sample comprising firms classified under five digit NIC 2008 industries for the period 2008–2019, I find empirical support in favour of endogeneity of trade policy (measured by export incentives such as duty drawbacks) [see Appendix B for the list of manufacturing industries]. These results are unaltered for a subset of firms that are pollution intensive (based on the Centre for Pollution Control Board classification). These industries include the manufacture of food products, tobacco products, textiles, leather and related products, paper and paper products, printing and reproduction of recorded media, coke and refined petroleum products, chemicals and chemical products, pharmaceuticals, rubber and plastic products, other non-metallic mineral products, basic metals, and fabricated metal products.
There exists substantial variation in the level of trade protection across firms within an industry. The estimation results affirm the role of firm size in influencing the level of trade protection. Larger firms have greater resources to participate in politics and are more likely to form lobbies in order to influence government policies. In contrast, I do not find any empirical evidence on interdependencies in trade and environmental policies. In defence of this finding, it can be argued that in developing economies such as India, environmental safety assumes less priority in the overall policy basket. It is quite unlikely that policy makers would consider environmental regulations while choosing trade policies for the nation. More specifically, trade and environmental policy decisions fall in the domain of independent ministries of the government.Footnote 4 While decisions on trade flows and trade policies come under the domain of the Directorate General of Foreign Trade, Ministry of Commerce and Industry, it is the Ministry of Environment, Forest and Climate Change that is responsible for the planning, promotion, coordination, and overseeing of the implementation of environmental policies. Apparently, there is little coordination between trade and environment ministries of the government to allow for these interdependencies. Further, the federal structure of the government might result in environmental regulation being a state subject while trade remains a central subject matter, thus undermining any possible policy integration.
The remaining sections of the paper are organized as follows. Section 2 gives a brief overview of trade policies in India. The econometric specification is discussed in Section 3. Section 4 describes the datasets and variables used in the analysis. I estimate the impact of firm-level lobbying on trade protection for all manufacturing firms in Section 5. In Section 6, I dig deeper by estimating the hetergeneous impacts of lobbying on trade protection at the firm level after controlling for environmental regulations and firm characteristics. Section 7 suggests a few policy implications and concludes.
2. Pattern of Trade Policies in India
Until the economic reforms of 1991, the Indian policy makers followed the model of import substitution for development. Inward orientation was considered to be the focus of the policy makers as opposed to export promotion. Customs duties were extremely high with a basic peak rate of 300%. The moving average of the un-weighted tariff rate from the mid of 1970s to 1990 was 130% (Milner and Mukherjee, Reference Milner, Mukherjee and Mukherjee2011). Milner and Mukherjee (Reference Milner, Mukherjee and Mukherjee2011) suggest that such high levels of protection was on account of the party-centred nature of India's democracy that strengthened the incentive for policy makers to favour the interests of industry owners and business groups. Political parties had access to corporate contributions subject to some restrictions and transparency of expenditure accounts. After independence, there were more than 1500 business and trade groups and over 1000 peasant and labour unions in India. The Representation of the People Act of 1951 had introduced limits on the amount of election campaign spending. The initial camaraderie between the then Congress party and business groups decayed gradually with the adoption of aggressive socialist ideology. This was followed by a complete ban on business contributions for political purposes by the government in 1968.
In the 1990s, as the economy experienced a policy overhaul on account of the balance of payment (BOP) crisis, there was a strong opposition from a large number of domestic industries following the threat from international competition. The outward orientation and a sharp decline in trade protection across industries triggered fear amongst the domestic importable sectors that would now compete with the foreign players. In 1992, several industries, such as the Bajaj industries, the Birla group, the Tatas and Reliance Industries, formed an industry body called the ‘Bombay Club’ to raise a voice against trade reforms (Milner and Mukherjee, Reference Milner, Mukherjee and Mukherjee2011). Another significant feature of trade policy reforms was that tariff movements were not uniform in the post liberalization period. Trade protection measures in 1999–2001 were used selectively across sectors in order to protect less efficient industries.
Overtime, there has been a consistent policy push towards phased reductions of protectionist measures across different sectors of the Indian economy by supranational institutions such as the World Trade Organization (WTO) and the International Monetary Fund (IMF). India's increased involvement in the international negotiations had also filliped the growth of industrial groups that represent the interest of business groups in the international arena as far as protectionist measures are concerned (Saha, Reference Saha2015), such as the Confederation of Indian Industry (CII), the Federation of Indian Chambers of Commerce and Industries (FICCI), Confederation of Indian Textile Industry (CITI), and Council for Leather Exports.
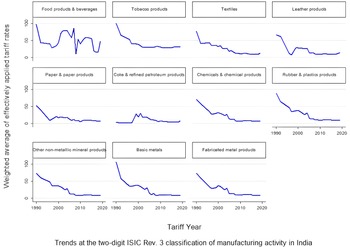
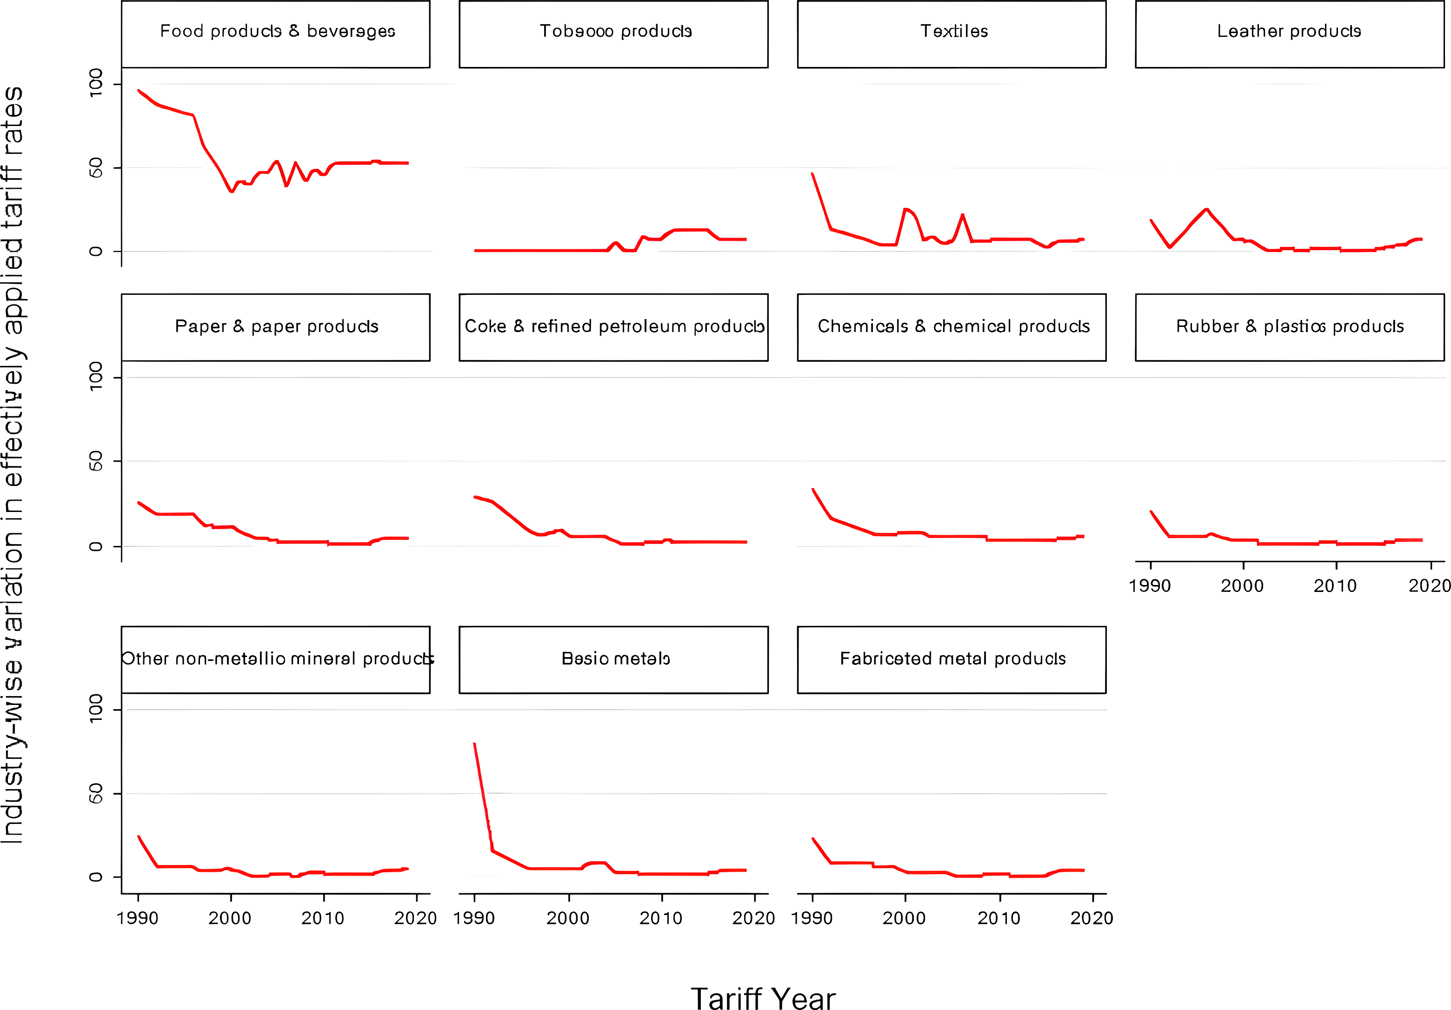
Figure 1 shows the trend of effectively applied tariff rates for the polluting industries in India at two-digit ISIC Revision 3 classification (WITS database, 14 December 2020). An important observation here is that there has been a sustained fall in tariffs across most of the industries except for food products and beverages. Manufacture of food products and beverages is highly protected, followed by manufacture of tobacco products. This throws some light on the supply-side aspects of protection, where the government's policy makes an attempt to insulate the vulnerable primary sector from foreign competition.
Tariff barriers across industries.
Source: WITS database and authors’ calculations

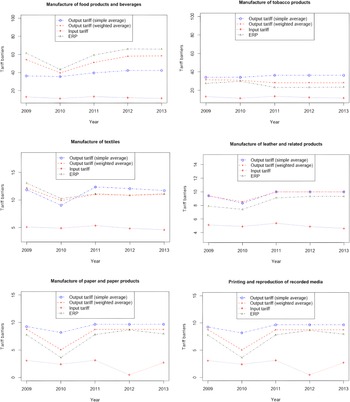
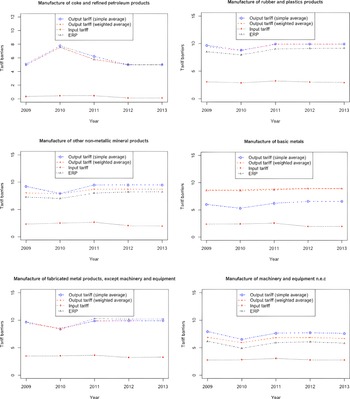
Figures 2 and 3 illustrate the trends in tariff barriers in India across the subset of manufacturing industries over the period 2009–2013. Data suggest that nominal output tariffs for the sample of manufacturing industries have been higher than input tariffs during this period, which implies that these industries are not subject to an inverted duty structureFootnote 5 resulting in positive effective rates of protection [see Appendix C for calculation of effective rates of protection]. Based on the definition of effective rate of protection, it is evident that an increase in the divergence between the output and input tariff lines in the graph indicates a rise in the effective rate of protection. Apart from industries such as the manufacture of tobacco products, coke and refined petroleum products, and basic metals, there was a decline in the effective rate of protection in the year 2010 followed by a steady increase over the years. For tobacco products and coke and refined petroleum products, the effective rate of protection experienced an increase in the year 2010 followed by a decline in the subsequent years. Protection rates for basic metals have been almost stable over the years. Except for tobacco products and coke, there has been a considerable rise in most protectionist measures (tariff barriers) since the year 2010.
Tariff barriers across industries
Source: WITS database and authors’ calculations.

Tariff barriers across industries
Source: WITS database and authors’ calculations.

3. Endogeneity of Trade Policy
The existing literature on the political economy of trade protection reinforces the argument that trade policies are endogenous. There has been empirical evidence that variables such as the concentration ratio, export intensity, import penetration, capital stock, wage rate, unionization, employment, and output growth contribute to the industry-wide variation in trade policies (Baldwin, Reference Baldwin1985; Trefler, Reference Trefler1993). The trade policy apparatus in India also warrants endogeneity that is driven by the complex interaction between policy makers and interest groups, including industries and business associations. Several pieces of evidence in the context of the Indian manufacturing sector highlight the synergies between interest groups and trade policy makers. In their study on the Indian manufacturing sector, Topalova and Khandelwal (Reference Topalova and Khandelwal2011) establish endogeneity in trade policies on the grounds of the considerable variation in tariffs across industries from the year 1997 onwards. They consider factors such as political strength of labour and business interests as potential determinants of trade policy in India. Saha (Reference Saha2015) finds primary evidence of firm-level lobbying for trade policy for a sample of 146 manufacturing firms for the period 2013–2014. Utilizing a primary survey design, the study suggests that about 94% of the manufacturing firms in the sample actively lobbied the government for trade protection. Another solid ground in favour of endogeneity in trade policy in India draws from the study by Gupta et al. (Reference Gupta, Patnaik and Shah2018). For the period 1989–2015, they find that only 5.47% of the sample of 8134 Indian manufacturing firms exhibited transition from being a non-exporter to an exporter. In contrast, about 32% of the firms did not enter the export market at all and only catered to the demand in the home market. Therefore, it is quite straightforward to infer that a majority of these firms were less productive, which ties in with the argument by Melitz (Reference Melitz2003) on firm behaviour and export performance. Since less productive firms only cater to the domestic market, it is more likely for industry lobbies in India to bid for trade protection (Shukla, Reference Shukla2021). Time series data on duty drawbacks on exports, nominal output tariffs, input tariffs, and effective rates of protection also show substantial variation across industries. Therefore, endogeneity of trade policies can be explained using the standard formulation:
 $$Trade\,policy_{it} = f\left(\matrix{Unionisation_{it}, \;Concentration\,ratio_{it}, \;\hfill \cr Capital\,stock_{it}, \;Wage_{it}, \;Employment_{it}, \;Output\,growth_{it}, \;\hfill \cr Import\,penetration\,ratio_{it}, \;Exports\,to\,value\,added_{it}, \;Other\,controls \hfill} \right) \;$$
where, trade policy has been measured using tariffs, non-tariff barriers, and tariff cuts for an industry or a country i at time t. Here, unionization captures the impact of special interest groups on trade policy. When industry workers organize themselves into political action groups, they enjoy some bargaining power over trade policy. This results in a positive impact on trade protection. Similarly, as firm concentration within an industry and the capital–labour ratio rise, all possibilities of free riding are diluted and increases lobbying and trade protection. In contrast, wages, employment, and output growth affect are supply driven factors. Policy makers provide more protection to sectors where wage rates, employment, and output are lower. Finally, industries with lower import penetration ratios and higher export intensities receive less protection, in view of the comparative costs of industries engaging in international trade.
Given this framework, we develop an econometric model by including environmental policy as one of the explanatory variables in order to study the endogeneity of trade policy in the presence of political action groups.
4. Variables and Data
Using a disaggregated firm-level dataset, I empirically examine the factors which determine the level of trade protection. A subset of firms of manufacturing industries that are polluting in nature (based on the Central Pollution Control Board classification) has been included to test for interdependencies in trade policy and environmental regulations at the firm level. These include manufacture of food products, tobacco products, textiles, leather and related products, paper and paper products, printing and reproduction of recorded media, coke and refined petroleum products, chemicals and chemical products, pharmaceuticals, rubber and plastic products, other non-metallic mineral products, basic metals, and fabricated metal products. The data are obtained from the Annual Survey of Industries (ASI)Footnote 6 as well as the Centre for Monitoring Indian Economy Pvt. Ltd. (CMIE) Prowess database.Footnote 7 The ASI database has been utilized to obtain data on the number of workers, total output and gross value added, and gross fixed capital formation. One of the distinctive features of the ASI database is that it also provides detailed information on the physical units produced by a factory at the five-digit level of disaggregation of industrial activity. However, from the viewpoint of our study, it provides limited information on government regulations pertaining to trade flows and environmental compliance. The data on production subsidies, provided by ASI, cannot be attributed to government policies for trade related matters. Moreover, very few factories report the gross value of fixed capital designated for pollution control: 7.7% of the total number of factories in 2009–2010, 6.7% in 2011–2012, and 6.8% in 2013–2014 (based on author's calculations). As a result, I resort to the Prowess database that provides data on duty drawbacks on exports and environment and pollution control related expenses, which I discuss in detail in the following sections. On an average, approximately 2% of 14,000 firms, over the entire timespan of the study, report environment and pollution control related expenses. Another advantage of this database is that it also provides the corresponding NIC codes up to five-digits for each firm, which help in mapping the data with ASI. I have aggregated the five-digit data to the four-digit level and obtained a balanced panel of 66 four-digit industrial activities for the time period 2008–2013.
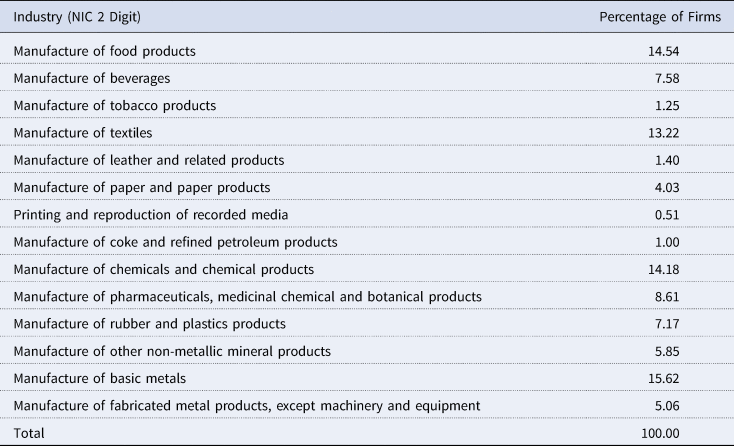
The sample comprises firms belonging to the following sectors: food products, beverages, tobacco products, textiles; leather products, paper, printing, coke and refined petroleum products,; chemicals, pharmaceuticals, rubber and plastics, non-metallic mineral products, basic metals (Table 1 gives the composition of firms in the sample).
Industry-wise composition of firms

Source: Author's calculation from CMIE Prowess database.
4.1 Measuring Trade Policy
The dependent variable in our model is trade policy. The most common measure of trade policy is import tariffs, known as the ad valorem tariff which is expressed as a percentage of the value of the product imported. This would encompass both output tariffs and input tariffs. Hence, an ideal measure of protection would the effective rate of protection (ERP) since it would control for the effect of input tariffs on overall protection. The estimate of the impact of industry lobbies would have a downward bias if I do not control for input tariffs (Topalova and Khandelwal, Reference Topalova and Khandelwal2011). However, there are two issues associated with this measure of protection. First, tariffs have become less popular instruments for protection owing to WTO negotiations and commitments. Instead, countries such as the US and the UK possess an extensive array of non-tariff regulations in terms of health and safety standards, environmental regulations, etc. which are executed time and again in order to protect domestic interests (Vogel, Reference Vogel, Vig and Faure2002). Moreover, there is little variation in tariffs over time since implementation of negotiations is inherently sluggish in nature. This is evident from Figure 1. Except for manufacture of food products and beverages, all other industries in India have been subject to tariffs that show negligible variation over time. For manufacture of tobacco products, the weighted average effectively applied tariff rate was as high as 100% in 1990, with a sharp decline to 38.5% in 2000, 30.82% in 2010, and 30.72% in 2017. The sharp decline in tariffs, owing to the economic reforms of 1991, is uniform across all industries except manufacture of coke, refined petroleum products, and nuclear fuel. Being highly import dependent, this sector was subject to extremely low tariffs at 2.78% in 1990, 1.17% in 1992, and 1.02% in 1997 (WITS Database). Figure 4 shows industry wise standard deviation of effectively applied tariff rates for the period 1990–2019. Second, the ERP calculation is possible only by utilizing the input–output coefficients from the Input–Output Transactions Table. The tables available for the relevant period are for the years 2007–2008 and 2013–2014, which implies that the issue of lack of variation in tariffs still remains. Consequently, the alternative measure of protection would be NTB coverage ratios. However, Gawande and Krishna (Reference Gawande, Krishna, Choi and Harrigan2003) argue that high NTB coverage ratios may not reflect high levels of protection. A sector in which a large number of goods are protected by large non-binding quotas would reflect a higher value of the NTB coverage ratio, albeit that the actual level of protection might be zero. Hence, I use export incentives such as duty drawbacks as a measure of trade policy.
Tariff dispersion across industries
Source: WITS database.

The duty drawback scheme is one of the export promotion schemes implemented by the Government of India under Section 75 of the Customs Act, 1962 and Section 37 of the Central Excise Act, 1944. This scheme allows exporters to claim refund of duties on inputs used in the manufacture of the exported good. Under this scheme, an exporter can opt for an All Industry Rate (AIR) or brand rate. While, the AIR scheme compensates the exporters with the average incidence of customs and central excise duties on inputs, the brand rate is allowed under special situations when the exported product has no AIR or duty drawback or the AIR notified is insufficient to compensate for the duty suffered on inputs used in the manufacture of the exported good (Department of Commerce, Ministry of Commerce and Industry, Government of India, 2018).
Broadly speaking, a rise in duty drawbacks on exports improves the competitiveness of exporting firms in the foreign market as it provides a cost advantage to the exporters. On the one hand, this scheme stimulates exports, and, at the same time, tempers the anti-competitive effects of tariffs on the imported inputs used in the manufacture of the export goods (Ianchovichina, Reference Ianchovichina2007; Hatta, Reference Hatta2018). In a way, a duty drawback scheme works in favour of exporting firms as the remission acts as an incentive for exporters to sell abroad rather than in the domestic market. Moreover, since the remission accrues only to inputs used in the manufacture of the export good and not to the exportable sold in the domestic market, the effect of a duty drawback would roughly be the same as of an export subsidyFootnote 8 (Panagariya, Reference Panagariya1992). In fact, it can be shown that a duty drawback on an export good would drive up its domestic price relative to the international price (a price distortion equivalent to the one typically generated by an export subsidy) [see appendix D for detailed proof]. Therefore, like export subsidies, duty drawbacks on exports may serve as a measure of trade protection. CMIE Prowess provides firm-level data on duty drawbacks on exports (in million INR).
4.2 Industry/Firm Lobby
The study by Grossman and Helpman (Reference Grossman and Helpman1995) argues that a fraction of owners of sector specific inputs overcome the free rider problem and organize themselves into lobbies and bribe the policy maker to sway policies in their favour. Despite the theoretical prediction, it is extremely difficult to measure bribery in the real world. Goldberg and Maggi (Reference Goldberg and Maggi1999) and Gawande and Bandyopadhyay (Reference Gawande and Bandyopadhyay2000) use political contributions in a cross sectional study of the US industries. As an improvement over Goldberg and Maggi's (Reference Goldberg and Maggi1999) study who use corporate political contributions as an explanatory variable, Gawande and Bandyopadhyay (Reference Gawande and Bandyopadhyay2000) mapped political contributions associated with trade flows and imports to capture the trade policy induced campaign contributions. The industries for which the relationship between campaign spending and trade flows was positive were identified as organized. The political economy effects are relatively easier to capture in cross-country studies where the degree of disaggregation is much lower. For instance, Bjørnskov (Reference Bjørnskov2012) use the corruption perceptions index (CPI) as a proxy for a political variable to examine the political economy effects on non-tariff barriers in a cross country study for the period 1995–2005. Since it is most likely that the data on campaign contributions at the industry/firm level would either be under-reported or not reported at all, econometric issues pertaining to measurement errors are unavoidable.
As far as studies in India are concerned, the data on campaign contributions are unreported. The data on election expenditures do not reflect the true levels of contributions to political parties. Table 2 reports the corruption perception index (CPI) scores and ranks for India from 2010– 2019. Launched in the year 1995, this index measures perceived levels of public sector corruptions across 180 countries around the world. The index scores range from 0 (highly corrupt) to 100 (least corrupt). It is constructed by an independent, non-government body called the Transparency International using the method of principal component analysis based on a number data sources, namely, African Development Bank Country Policy and Institutional Assessment, Bertelsmann Foundation Sustainable Governance Index, Bertelsmann Foundation Transformation Index, Economist Intelligence Unit Country Ratings, Freedom House Nations in Transit Ratings, Global Insight Country Risk Ratings, Institute for Management Development World Competitiveness Yearbook, Political and Economic Risk Consultancy Asia Risk Guide, Political Risk Services International Country Risk Guide, Varieties of Democracy Project, World Bank Country Policy and Institutional Assessment, World Economic Forum Executive Opinion Survey, and World Justice Project Rule of Law Index. In 2019, India's rank dipped to 80 from 78 in 2018. While the CPI is a comprehensive measure of corruption, it does not capture the dynamics of corruption at the micro-level, i.e. industry/firm-level corruption. Hence, I use some indirect measures of industry lobby.
Corruption perceptions index for India (2010–2019)

Source: Country report, Corruption perceptions index, Transparency International.
The empirical literature on industry and firm lobbying suggests a host of factors that influence lobbying activity. These broadly include factors such as the size of the firm, market concentration, and age of the firm. Firm size has been found to be the most important aspect that captures political influence by Salamon and Siegfried (Reference Salamon and Siegfried1977). Evidently, larger firms have greater incentives and larger resources to participate in lobbying activity. Furthermore, factors such as industry size, market concentration, profit rate, capital–output ratio, and geographical concentration have been found to capture political influence. Market concentration has also been found to be a significant determinant of political rents accruing to the incumbent in a study by Pittman (Reference Pittman1977). Campos and Giovannoni (Reference Campos and Giovannoni2007) find that the likelihood of firms forming lobbies is positively related to firm size, age of the firm, foreign ownership of the firm, and level of economic development. Similarly, Hill et al. (Reference Hill, Kelly, Lockhart and Ness2013) find significant correlation between lobbying activity and factors such as firm size, investment opportunities, and industry affiliation. Both firm specific characteristics, such as firm size, cash flow, and investment opportunities, as well as industry specific characteristics, such as industry affiliation, degree of government regulation, and market concentration have been found to be associated with lobbying activity. In order to measure firm size, Dang et al. (Reference Dang, Li and Yang2018) use total sales, total assets and market value of equity. Therefore, these factors may be used to capture lobbying activities in case of non-availability of reported data. Consequently, I use the value of gross fixed assets (in million INR) reported in CMIE Prowess as an indicator of industry size which is a proxy for industry lobby.
4.3 Measuring Environmental Policy
On account of unavailability of data on direct measures of environmental policy, empirical studies on environmental policy have used a number of proxy measures of formal and informal regulations. Pargal and Mani (Reference Pargal and Mani2000) use indicators such as voter turnout, level of education, and per capita state domestic product for measuring the degree of environmental awareness among common citizenry. This study also utilizes data on the number of lawsuits filed by the pollution control agencies as a measure of environmental stringency. There are studies by Cole et al. (Reference Cole, Elliott and Shimamoto2005) and Cole et al. (Reference Cole, Elliot and Shanshan2008) who have measured environmental activism through the number of public interest litigations filed in the court of law in countries such as the UK and prosecutions in countries such as China. Besides lawsuits and public interest litigations, several indirect measures capturing environmental regulations have been employed, e.g. grams of lead content per unit of gasoline, unemployment rate, population density, age structure, and level of education. Moreover, macroeconomic indicators such as per capita gross state domestic product, CO2 emissions, and the level of State Plan outlay on environment and ecology have been used as indirect measures of environmental stringency in studies by Kahn and Matsusaka (Reference Kahn and Matsusaka1997), Mani et al. (Reference Mani, Pargal and Huq1997), Costantini and Crespi (Reference Costantini and Crespi2008), Fredriksson et al. (Reference Fredriksson, List and Millimet2003). Energy based measures, such as emissions intensity and the share of conventional and/or alternative sources of energy in total installed capacity have been used by Harris et al. (Reference Harris, Konya and Matyas2002), Xing and Kolstad (Reference Xing and Kolstad2002), Cole and Elliott (Reference Cole and Elliott2003), and Brunel and Levinson (Reference Brunel and Levinson2013). Pollution abatement expenditure has also been a popular indicator for environmental stringency for sector specific studies (Levinson and Taylor, Reference Levinson and Taylor2008).
CMIE Prowess reports environment and pollution control related expenses in million INR. I use this variable as a measure of environmental stringency. A higher pollution abatement expenditure is indicative of a relatively stringent environmental regulation, which implies that the government cares for environmental quality.
4.4 Other Controls
The other control variables are as follows: capital labour ratio expressed as a ratio of capital employed as compensation to employees, exports per unit of gross value added, ownership of firms, and age and age-squared. Gross fixed assets and capital employed have been deflated by the wholesale price index (WPI) for machinery and imported inputs by the index of industrial production (IIP) for intermediate goods with base year 2004–2005. The remaining variables in INR have been deflated by the WPI (2004–2005) for the manufacturing sector. The data for WPI and IIP have been obtained from the Ministry of Statistics and Programme Implementation, (Government of India), and the Database on the Indian Economy, (Reserve Bank of India), respectively. Table 10 in Appendix A provides descriptive statistics of the relevant variables.
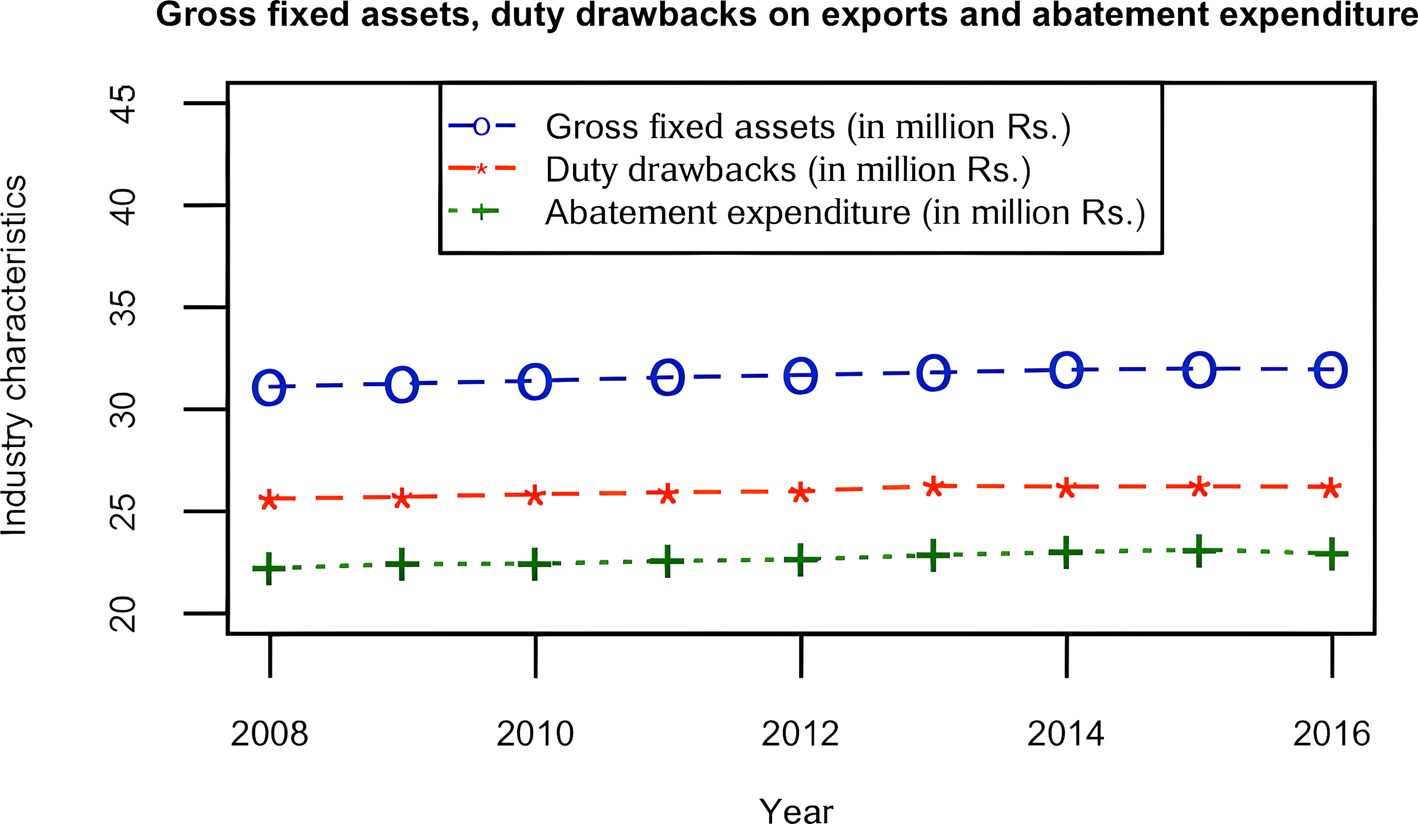
Figure 5 shows the trend of the relevant variables. I have used natural logarithm of the actual values of gross fixed assets, duty drawbacks on exports, and abatement expenditure expressed in INR. It seems that these variables tend to move together and there is a relatively slow rise in the each of these variables from 2008 to 2016.
Gross fixed assets, duty drawbacks on exports and abatement expenditure
Source: CMIE Prowess database.

5. Firm Level Protection in India
In addition to the industry level variations in the level of protection, firms within an industry may be subject to differential treatment with regard to trade policy. A closer look at the data on duty drawbacks on exports shows that there is substantial variation in the level of protection across firms within an industry. Under the duty drawback scheme, exporters can claim a refund of duties on inputs used in the manufacture of the exported good. However, the firm-level data show that there are several instances where some firms receive no refund despite their exports being higher than those receiving the refund. This observation precludes the possibility of unreported data or missing values since the entries are zero and hence are reported. For example, in the year 2012, Narmada Gelatines Ltd. procured around 0.005 million rupees as export duty drawback against exports of worth 0.3 million rupees. In contrast, for exports worth 0.4 million rupees, Vivid Global Inds. Ltd. received no export protection. Similarly, Bhagiradha Chemicals & Inds. Ltd. received no protection despite its exports standing at 5.5 million rupees.Footnote 9 These firms come under the classification of manufacture of chemicals and chemical products (NIC 2008 Division 20) under subclasses manufacture of gelatin and its derivatives, resinoids, glues, prepared adhesives, including rubber-based glues and adhesives (NIC 20295), manufacture of organic and inorganic chemical compounds not elsewhere classified (20119), and manufacture of pesticides and other agrochemical products (NIC 2021). Similarly, in 2011, under the manufacturing activity classified as manufacture of fabricated metal products, except machinery, and equipment (NIC 2008 Division 25) Skipper Ltd. received no refund for exports of 0.6 million rupees as opposed to Techno Forge Ltd. which received 0.003 million rupees for exports worth 0.1 million rupees. These firms belong to subclasses of manufacture of other fabricated metal products not elsewhere classified and forging, pressing, stamping, and roll-forming of metal; and powder metallurgy. Such differences have also been found across other firms belonging to the same industry. There are a few firms that are subject to positive duty drawbacks despite their exports being reported as zero. This anomaly may lead to perverse results and hence these observations were dropped.
The above observations throw some light on intra-industry variation in the level of protection. The existing literature on firm-level protection has mainly focussed on the fact that import competing firms lobby in favour of protection while the exporting firms put liberalisation for sale. These studies include Hillman (Reference Hillman1982), Mayer (Reference Mayer1984), Baldwin (Reference Baldwin1985), Magee et al. (Reference Magee, Brock and Young1989), and Trefler (Reference Trefler1993). However, this explanation has been contested by a recent work attributed to Kim (Reference Kim2017) who has tapped into firm-level heterogeneity in order to explain intra-industry variation in the level of protection. Such firm-level heterogeneity can be attributed to the differences in productivity, export intensity, level of product differentiation, and firm-level lobbying. Based on the argument that more productive firms enter the export market and that less productive firms supply the domestic market and eventually exit (Melitz, Reference Melitz2003), Kim (Reference Kim2017) validates that productive exporting firms are more likely to lobby for a liberalized trade regime. Furthermore, the lobbying activity is increasing in the degree of product differentiation. The productive exporting firms favour open markets abroad for the following reasons: they can reach out to the foreign market where ‘consumers love variety’; there exists increasing returns to scale from production. With substantial product differentiation, even those firms operating in the import competing sector are less vulnerable to open markets since there is less likelihood of foreign competition compared to the situation where domestic markets get flooded with cheaper versions of substitutable foreign products.
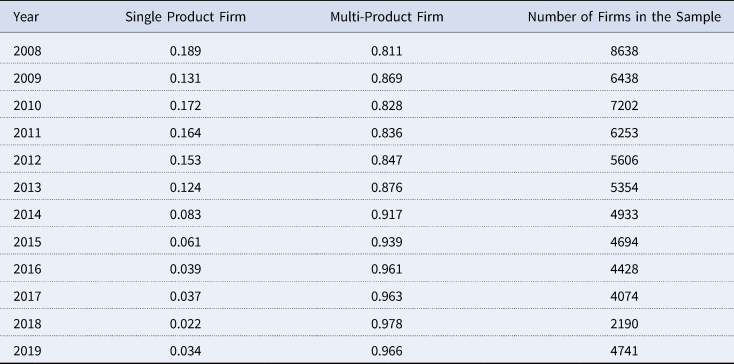
The study by Kim (Reference Kim2017) includes all publicly traded firms in the manufacturing and the agricultural sector in the US between 1999 and 2014. The analysis, thus, controls for product-mix of the firms and tests whether firm size determines the level of trade protection. The firm-level dataset used in our analysis shows that most of these firms are multi-product firms and the share of such firms has been rising since the year 2010 (Table 3).
Year wise share of single product and multi-product firms in the manufacturing sector

Source: Author's calculation from CMIE Prowess database.
Unlike Kim (Reference Kim2017), I do not identify which firms are more/less likely to lobby in order to influence trade policies. Instead, I check the interdependencies in trade and environmental policies at the firm level. I expect that firm size has a positive impact on the level of firm-level protection. Also, environmental regulations captured through abatement expenditures are expected to be stricter for firms availing greater trade protection. Typically, firms in the export sector are more efficient and hence less polluting. In order to control for product mix, I define a variable known as product scope, denoted by Scopeijt which refers to the total number of products manufactured by firm i in industry j at time t. Firm controls include age, age-squared, export intensity, product scope, and ownership structure. The time period for the analysis is 2008–2019. I estimate the following equation with the help of an unbalanced panel dataset.
Given that our research question revolves around the political economy and interdependencies in trade and environmental policy, I incorporate environmental regulations and a variable capturing the political economy effects in our econometric analysis and, thereby, estimate the following equation:
 $$T_{ijst} = \alpha + \beta _i + \gamma _j + \delta _s + \psi _t + \theta _j^t + \eta _s^t + \mu _s^j + \lambda \;L_{ijt} + \zeta E_{ijt} + X\phi + \epsilon _{ijst}$$
where βi, γj, δs,and ψt denote firm, industry, state, and time fixed effects, respectively.  $\theta _j^t , \;\;\;\eta _s^t \;$ and
 $\mu _s^j $ capture the interactions between industry fixed effects and time effects, state fixed effects and time effects, and industry fixed effects and state fixed effects, respectively. Industry (state) and time effect interactions control for the time varying unobserved industry (state) characteristics. Similarly, interaction between industry and state fixed effects control for unobserved variations in industry characteristics across states. Tijst, Lit, and Eijt are our variables of interest, namely, trade policy, firm lobbying, and environmental policy, respectively. Based on the theoretical propositions, both λ and ζ are expected to be positive.
X is a vector of control variables which include product mix, export intensity, capital intensity, ownership, age, and age squared of the firm.
5.1 Econometric Issues
One major pitfall associated with trade and environmental policies is the potential endogeneity problem. There are instances where trade disputes are broached at the dispute settlement body of the WTO that are linked to environmental concerns.Footnote 10 On the one hand, trade policies can escalate or mitigate environmental issues (say, diffusion of renewable energy (RE) through exchange of cutting-edge low carbon technologies in order to promote transition towards greener economies). On the other hand, environmental safety standards for traded goods and services restrict trade flows. For instance, an assessment by the European Commission suggests that the Transatlantic Trade and Investment Partnership (TTIP) will exacerbate greenhouse gases emissions through scale effects and emission intensities of industries (European Commission, 2017). Hence sound and less distortionary environmental policies serve as complimentary tools to atone for the environmental effects of trade policy.Footnote 11 The presence of political action groups further alters the dynamics of policy formulation and contributes to trade-offs faced by the policy makers. On the one hand, stringent environmental regulations call for greater domestic protection to contain the loss emanating from cost disadvantages. On the other hand, higher level of trade protection may be accompanied by more stringent environmental regulations. Such policies are commonplace when the government cares for the average voter's welfare, which is a function of the environmental damage from domestic production of the traded good. This highlights the reverse causality problem that leads to biased ordinary least squares (OLS) estimates.
The second hurdle in accounting for interdependencies in trade and environmental policies is that certain omitted variables may affect both of these policies.Footnote 12 Unobserved characteristics like identity, history, and culture may have their impact on both trade policies and environmental regulations. For instance, prior to 1990, the government of India laid strong emphasis on protectionist trade policies accompanied with a thrust on rapid industrialization. Environmental concerns could hardly achieve a spotlight amid social and economic policies. While there has been a diametric reversal in India's orientation towards foreign trade policy in the post-liberalization period, there has not been a commensurate rise in environmental valuation. The extant environmental regulations, mostly in forms of command and control instruments have been inadequate and less effective. Unlike trade policies, environmental policies in India are hardly designed as market-based instruments. Poor institutions, bureaucracy, corruption, and high monitoring and inspection costs entail poor environmental quality. As a developing economy, a primary reason for lax environmental regulation and hence low environmental quality is economics. Ambitious growth targets and a meteoric rise in energy demand in India have contributed to the trade-off between economic growth and environmental quality. However, there are political and cultural factors that affect both trade and environmental policies. Environmental valuation may also stem from the non-pecuniary factors aesthetic value, psychological benefits, sense of social and cultural identity (O'Hara, Reference O'Hara1996; Park et al., Reference Park, Russell and Lee2007; Schaub, Reference Schaub2022). Similarly, outward orientation of an economy may be an off-shoot of culture, political ideology, and attitude (Acheson and Maule, Reference Acheson and Maule2006; Kónya, Reference Kónya2006; Correa da Cunha et al., Reference Correa da Cunha, Ruzgar and Singh2022). In a democracy, policies adopted by the government would essentially reflect these non-monetary attributes.
Consequently, the above issues lead to a bias in OLS estimates. In order to control for time invariant (or slowly moving) unobserved heterogeneity such as attitude and culture, I use state fixed effects. Unobserved industrial characteristics (historical relevance of industries such as iron and steel post-independence) are controlled by industry fixed effects. Linear time trends, interacted with industry fixed effects account for any time varying industry-level regulation. I adopt a fixed effects instrumental variable approach to solve the potential endogeneity in trade and environmental policies. To find valid instruments that have considerable variation over time as well as across firms and industries, the following conditions must be fulfilled: (a) the instrument must be correlated with the endogenous variable, i.e. abatement expenditure; (b) the instrument must be uncorrelated with the time varying, firm and industry specific unobservable characteristics that are included in the error term  $\epsilon _{ijst}$ of equation (2); and (c) the instrument must affect the outcome variable, duty drawbacks on exports only through the environmental policy and not directly.
Abatement expenditure, a measure of environmental policy in our case, is closely associated with environmental regulations. Firms spend more on abatement if the production process is more polluting in nature, and are hence subject to relatively stricter environmental regulations. The fact that environment is a state subject in India, there exists variation in the degree of environmental regulations across states. Alluding to the Environmental Kuznets Curve Hypothesis, it can be stated that the demand for environmental quality rises with a rise in income, assuming environmental quality as a normal good (Shafik and Bandyopadhyay, Reference Shafik and Bandyopadhyay1992; Grossman and Krueger, Reference Grossman, Krueger and Garber1993, Reference Grossman and Krueger1995; Copeland and Taylor, Reference Copeland and Taylor2004). However, the variation in environmental regulations across states does not necessarily translate to variation in regulations across firms. As a result, I use net state domestic product at constant prices (2004–2005 prices) and then, construct a firm-level indicator for environmental regulations by using the share of a firm's gross value added to the two-digit industry's gross value added as a weight. Contrary to the standard theory that environmental regulations that vary positively with income, it is found that the first stage regression results indicate otherwise. It is found that richer states host firms that spend less on abatement. One possible justification could be the meteoric rise in the services sector in India and its contribution to the state domestic product. The negative sign of the coefficient could be driven by the growth of the less polluting services sector and outperforming the manufacturing sector that leads to lower abatement expenditure.Footnote 13 Moreover, there is no significant difference in the coefficients when the sample of firms is classified as: all manufacturing firms, i.e., the full sample of firms, and the sample of firms that are polluting in nature. Moreover, the state wise variation in income is also correlated with omitted unobservable characteristics such as culture and attitude. Therefore, state domestic product does not qualify as a potential instrument for abatement expenditure.
The next possible alternative is to use an instrument that has variation across firms and over time. Unlike income that affects demand for environmental quality, I examine supply factors that affect environmental regulations. Pollution supply is one of the potential factors that affects environmental regulations. The existing literature suggests that supply of pollutants is a key determinant of pollution policy (Copeland and Taylor, Reference Copeland and Taylor2004). One of the major sources of pollution is power and fuel use. Most industries rely heavily on coal-based energy sources, which have severe implications on emissions, effluent discharge, and energy sustainability. Interestingly, CMIE Prowess provides information on fuel expenses by firms. I compute fuel expensesFootnote 14 per unit of gross value added by each firm and use it as an instrument for abatement expenditure. Unlike state domestic product, fuel expenses vary across firms. It is quite unlikely that fuel expenses will be correlated the unobservables included in the error term. Variation in fuel expenses will be driven by the pollution intensity of firms, which is exogenous. The production structure will exhibit the exogenous variation in pollution intensity.Footnote 15 Finally, fuel expenses affect duty drawbacks on exports only through abatement expenditure.
6. Results: Firm Size and Trade Policy
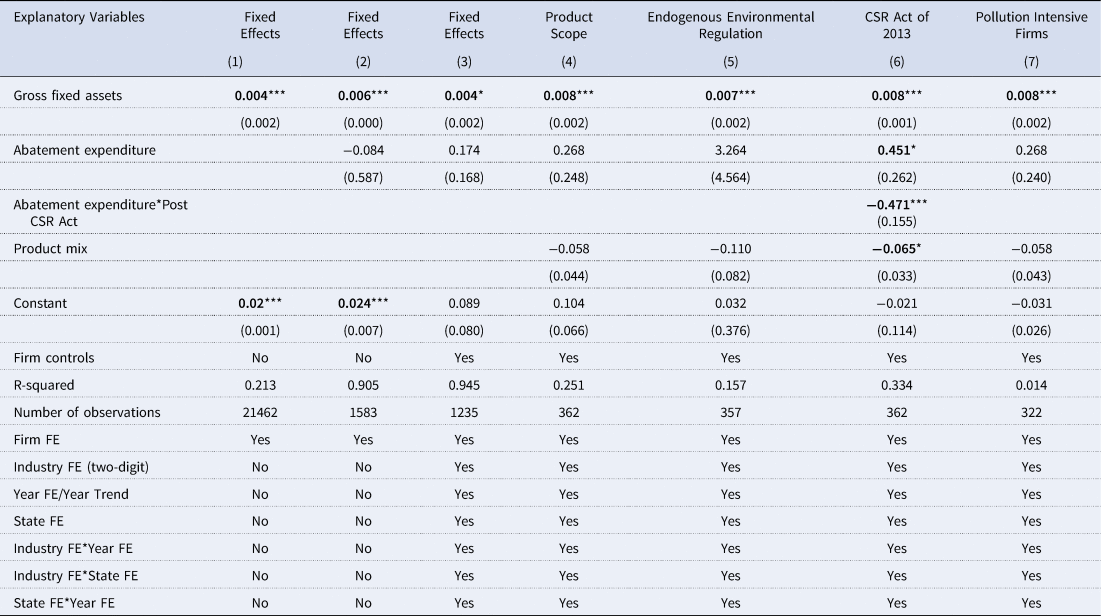
The estimation results are presented in Table 4.
Estimation results: Duty drawbacks on exports as the dependent variable

Notes: Post CSR Act is a dummy variable taking a value 1 when the year is greater than 2013. Pollution intensive firms include firms belonging to the list of category red industries as classified by the Centre for Pollution Control Board. Firm controls include age, age-squared, export intensity, capital intensity, and ownership. Standard errors are clustered at the firm level and reported in parentheses. Statistically significant estimates have been reported in bold characters. *, **, and *** denote 10%, 5%, and 1% level of significance, respectively.
Columns (1)–(3) present alternative specifications with respect to firm controls, industry, year, and state fixed effects as well as their interactions. Column (3) illustrates results of fixed effects estimation when I control for firm specific characteristics. In each of these cases, firm size, measured by gross fixed assets is statistically significant. The positive sign of the coefficient throws light on how trade protection rises with a rise in firm size. Environmental policy, measured by abatement expenditure is statistically insignificant.
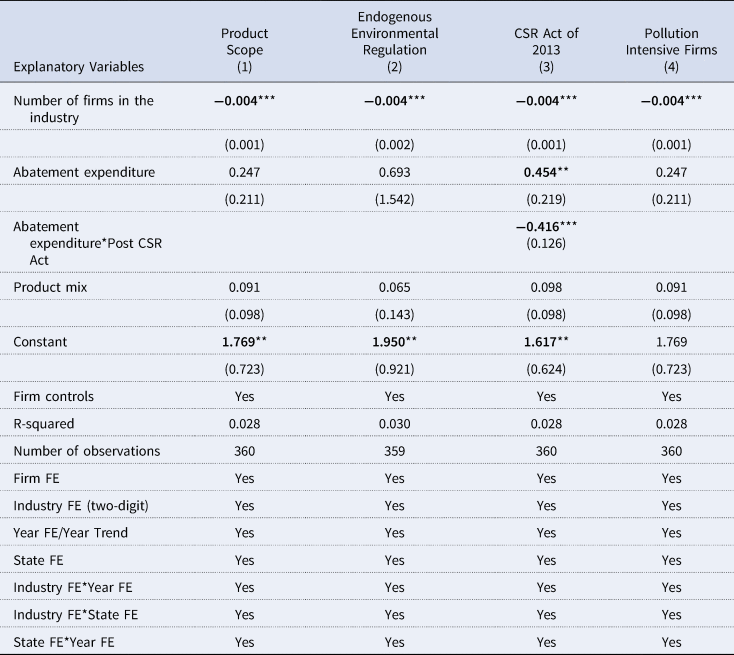
In column (4), I take into account a firm's product mix and estimate equation (2). The negative sign of the estimate, albeit insignificant corroborates the argument that multi-product firms lobby for trade liberalization since it expands its market access. Consumer's love for variety tempers competition with rival firms who sell differentiated products.
Column (5) reports the two-stage least squares (2SLS) estimates for the model. The result is obtained by employing an OLS regression on the model specification in equation (2) using the predicted value of the environmental policy variable, that is, abatement expenditure. The predicted value is derived from the first stage regression (reported in Table 5) using fuel expenses as one of the regressors along with other firm, industry, and state specific controls that have a bearing on environmental policy. The results suggest that a rise in firm size contributes to a statistically significant rise in duty drawbacks on exports (by approximately, 0.7%). Environmental policy (used as a predicted value from the first stage regression) does not have any significant impact on trade policy, i.e., duty drawbacks on exports.
First stage regression: Abatement expenditure as the dependent variable

Note: Firm controls include age, age-squared, export intensity, capital intensity, product scope, and ownership. Standard errors are clustered at the firm level and reported in parentheses. Statistically significant estimates have been reported in bold characters. *, **, and *** denote 10%, 5%, and 1% level of significance, respectively.
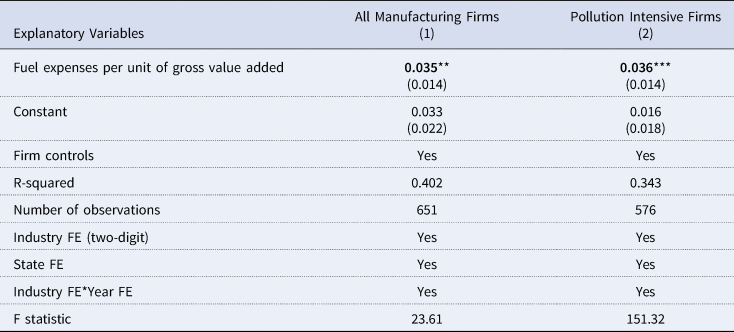
The first stage regression estimates of the effect of fuel expenses per unit of gross value added have been reported in Table 5. The estimates suggest that a higher level of expenditure on fuels leads to significant rise in abatement expenditure. The result is quite intuitive. Higher fuel expenses per unit of gross value added disincentivizes firms to emit more effluents. As a result, firms spend more on abatement technologies in order to contain the rise in fuel expenses that inflates costs of production. It must be noted that the level of statistical significance rises for the sub-sample of polluting firms.
Column (6) reports results that control for the landmark intervention by the government, i.e., the Corporate Social Responsibility Act of 2013, a section of the Companies Act that mandates larger companies to contribute to economic, social, and environmental progress with the company's growth. Our results suggest that the level of protection has fallen with the implementation of the CSR law in 2013. The mandatory CSR contribution dilutes the obligation of the politically motivated policy maker to grant more protection to firms who spend more on abatement technologies.
Finally, column (7) reports the estimates for a sub-sample of pollution intensive firms. A subset of manufacturing industries that are polluting in nature (based on the Central Pollution Control Board classification) has been included to test for interdependencies in trade policy and environmental regulations at the firm level. These include manufacture of food products, tobacco products, textiles, leather and related products, paper and paper products, printing and reproduction of recorded media, coke and refined petroleum products, chemicals and chemical products, pharmaceuticals, rubber and plastic products, other non-metallic mineral products, basic metals, and fabricated metal products. Our results remain unaffected under each of the alternative specifications.
To sum up, industrial lobbying has a positive impact on the level of trade protection. This is in conformity with both theoretical and empirical studies by Ray (Reference Ray1981), Baldwin (Reference Baldwin1985), Trefler (Reference Trefler1993), Grossman and Helpman (Reference Grossman and Helpman1994), Grossman and Helpman (Reference Grossman and Helpman1995), Goldberg and Maggi (Reference Goldberg and Maggi1999), Gawande and Bandyopadhyay (Reference Gawande and Bandyopadhyay2000), and Bjørnskov (Reference Bjørnskov2012). However, I do not find empirical evidence of policy interdependencies in the Indian context. Such a result manifests the argument that developing economies such as India are wary of linking trade and environmental policies. It is costly for policy makers to contain the welfare loss from protection by raising environmental standards, and hence environmental safety assumes less priority in the overall policy basket. Whilst in some cases, environmental regulations are in place, weaker institutions translate into poor enforcement mechanisms. Moreover, there are independent ministries that deal in each of these policies.
6.1 Heterogeneous Impacts
In this section, I consider heterogeneous impacts of firm size and environmental regulations on domestic protection.
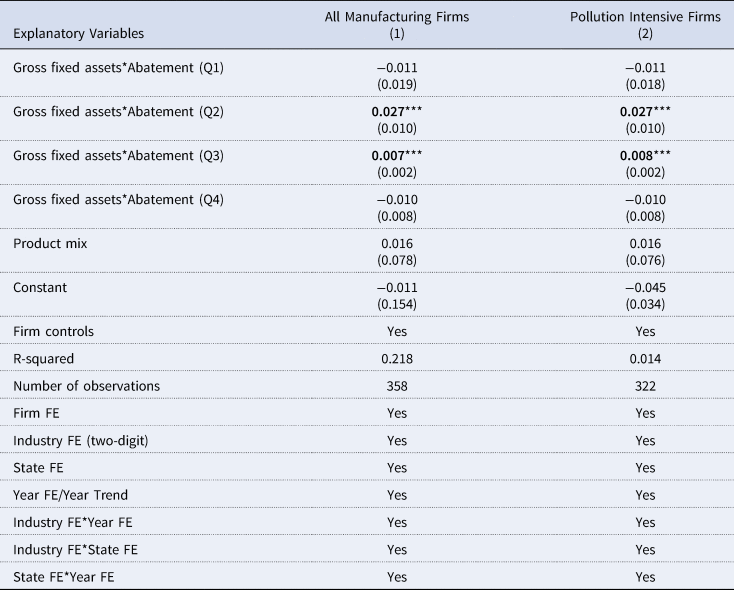
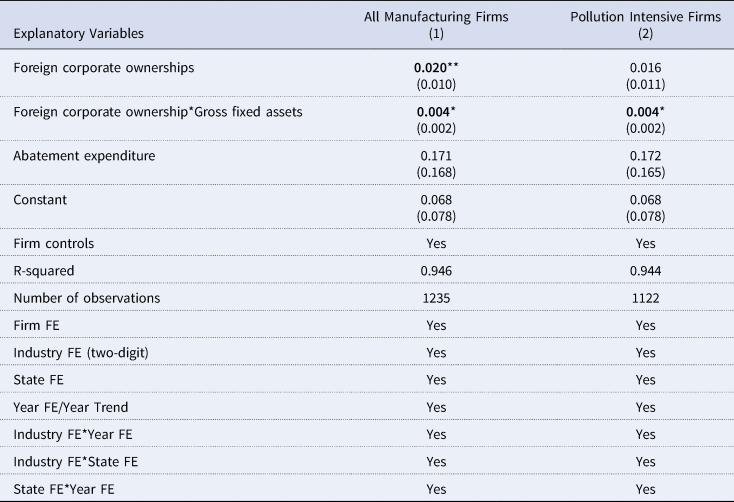
Firstly, I consider the heterogeneous impact of firm size on the level of trade protection. In Table 6, I report results of the interaction between firm size and abatement expenditure of firms into four different bins based on their abatement expenditure. The quartile regression based on abatement expenditure constructs a distribution of firms across four quartiles. The coefficients of the interaction terms of each quartile with the firm size variable, i.e., gross fixed assets, shows how the impact of firm size on trade protection varies by the level of expenditure on pollution abatement. If I consider the estimate corresponding to the second quartile in Table 6, it is found that firms whose abatement expenditure is less than or equal to the median abatement expenditure of firms in the sample, lobby for trade protection (given by firm size). Results show that domestic protection rises for firms that belong to the second and the third quartile of the distribution on abatement expenditure, the highest effect being for those firms belonging to the second quartile. I do not find any effect on firms in the first and the fourth quartile. This implies that firms in the second and the third quartile of the abatement expenditure distribution lobby aggressively for domestic protection.
Estimation results: Heterogeneity in the impact of firm size by abatement expenditure

Notes: Abatement (Q i); i = 1, 2, 3, 4 indicates four quartiles based on abatement expenditure made by firms in our sample. Firm controls include age, age-squared, export intensity, capital intensity, and ownership. Standard errors are clustered at the firm level and reported in parentheses. Statistically significant estimates have been reported in bold characters. *, **, and *** denote 10%, 5%, and 1% level of significance, respectively.
A counter-intuitive result emerges with respect to the distribution of multi-product firms. It is evident that only those firms belonging to the fourth quartile of the product mix distribution are highly protected (Table 7). A plausible argument in favour of this outcome could be the nature of trade protection used as our dependent variable. I use duty drawbacks on exports as a measure of trade protection. While this policy serves as an export promotion scheme, the existing literature that suggests that multi-product firms are more likely to lobby for trade liberalization is primarily true for import competing firms. Our sample includes only exporting firms who import intermediate inputs. This could be a possible explanation for the counter-intuitive result.
Estimation results:Heterogeneity in the impact of firm size by product mix

Notes: Product mix (Q i); i = 1, 2, 3, 4 indicates four quartiles based on the number of products manufactured by the firms in our sample. Firm controls include age, age-squared, export intensity, capital intensity, and ownership. Standard errors are clustered at the firm level and reported in parentheses. Statistically significant estimates have been reported in bold characters. *, **, and *** denote 10%, 5%, and 1% level of significance, respectively.
Next, I check if the effect a firm's export intensity on the duty drawback earned varies by firm size. I classify firms based on the level of gross fixed assets into four quartiles. Now, I interact these with export intensity of firms. The coefficients indicate that the impact of export intensity on trade protection is higher for large firms, whose gross fixed assets correspond to the upper tail of the distribution. The estimates corresponding to the second the fourth quartile are statistically significant. However, the statistical significance rises for the fourth quartile (Table 8).
Estimation results: Heterogeneity in the impact of export intensity by firm size

Notes: Firm size (Q i); i = 1, 2, 3, 4 indicates four quartiles based on the gross fixed assests of firms in our sample. Firm controls include age, age-squared, export intensity, capital intensity, and ownership. Standard errors are clustered at the firm level and reported in parentheses. Statistically significant estimates have been reported in bold characters. *, **, and *** denote 10%, 5%, and 1% level of significance, respectively.
Lastly, Table 9 reports that firms owned by foreign corporate bodies are highly protected. Moreover, it is primarily the bigger firms owned by foreign corporate bodies who are subject to greater trade protection. This throws light on the intensity of lobbying by foreign corporate bodies that have greater access to resources used to bid for policies in their favour.
Estimation results: Foreign corporate ownership

Notes: Foreign corporate ownership is a dummy variable that takes a value 1 if the percentage of shares held by foreign corporate bodies is greater than 50 and 0 otherwise. Firm controls include age, age-squared, export intensity, and capital intensity. Standard errors are clustered at the firm level and reported in parentheses. Statistically significant estimates have been reported in bold characters. *, **, and *** denote 10%, 5%, and 1% level of significance, respectively.
6.2 Sensitivity Analysis
Table 10 uses number of firms in the industry (4 digit) as an indicator of lobbying behaviour to examine whether the baseline specification is robust. The negative sign of the coefficient across alternative specifications indicate that firm-level lobbying has a statistically significant impact on the level of trade protection. Firm concentration is directly related to the level of trade protection. If an industry comprises a few firms, they are more likely to overcome the free rider problem and organize politically to bid for trade policies in their favour. Across all specifications, a rise in the number of firms leads to a decrease in duty drawbacks on exports by approximately 0.4%. Again, abatement expenditure is not statistically significant across specifications.
Firm concentration as a proxy for lobbying behaviour

Notes: Post CSR Act is a dummy variable taking a value 1 when the year is greater than 2013. Pollution intensive firms include firms belonging to the list of category red industries as classified by the Centre for Pollution Control Board. Firm controls include age, age-squared, export intensity, capital intensity, and ownership. Standard errors are clustered at the firm level and reported in parentheses. Statistically significant estimates have been reported in bold characters. *, **, and *** denote 10%, 5%, and 1% level of significance, respectively.
7. Conclusions
The present study examines the empirical validity of interdependence in trade policy and environmental policy when industries have direct stakes in policies undertaken. Empirical studies on India have focused on lobby group formation and its impact on trade policies. The trade and environment linkage has been explored through the impact of environmental regulations on trade flows. In contrast, our emphasis has been on the aspect of policy linkages in the presence of special interest groups. We use a panel dataset at the firm level for the time period 2008–2019 in order to estimate the impact of special interest groups on trade policy as well as the interdependencies in trade and environmental policies in India. Our sample includes a set of manufacturing industries based on the National Industrial Classification 2008.
The impact of industry level characteristics on trade protection has been estimated under alternative model specifications. We have found evidence of firm size (captured by gross fixed assets) having a statistically significant impact on the trade policy variable, duty drawbacks on exports, i.e., greater the size of the industry, higher is the protection it receives. However, the argument of policy trade-off in the presence of firm lobby does not seem to be statistically significant across different models. Finally, we do not find any empirical evidence on interdependencies between trade and environmental policies. Our results are robust across alternative specifications.
To sum up, firm size is a statistically significant determinant of trade protection. Larger firms/industries have greater incentives and larger resources to participate in politics and influence policy outcomes. Consequently, these firms/industries enjoy greater protection in terms of trade policy. In contrast, environmental regulations do not influence trade policy in the sample of Indian manufacturing industries (and firms). This makes sense given the nature of the Indian economy which is an emerging economy and the policy makers are always wary of linking these two policies in the international forum. One of the primary features of developing economies such as India is the prevalence of weaker institutions that translates into poor enforcement mechanisms. Moreover, trade and environmental policies come under the domain of independent ministries of the government. Apparently, environmental regulations are less stringent in developing economies and raising standards to counter the inefficiencies emanating from increased protection is costly and jeopardizes international competitiveness. Sometimes, compliance could be in response to being a signatory to international environmental treaties and is not linked to trade. Further research is needed to understand the situation on the ground at the round table where policy makers peddle a particular policy.
Supplementary Materials
To view supplementary material for this article, please visit https://doi.org/10.1017/S1474745622000465.