1. Introduction
A better understanding of mechanisms of chemical weathering related to global climatic changes can be obtained by investigating the sediment and sedimentary rock composition during the present (e.g. Perri et al. Reference Perri, Critelli, Dominici, Muto, Tripodi and Ceramicola2012, Reference Perri, Dominici, Le Pera, Chiocci and Martorelli2016 b) and over the geologic past (e.g. Perri et al. Reference Perri, Cirrincione, Critelli, Mazzoleni and Pappalardo2008, Reference Perri, Critelli, Mongelli and Cullers2011, Reference Perri, Critelli, Martìn-Algarra, Martìn-Martìn, Perrone, Mongelli and Zattin2013, Reference Perri, Caracciolo, Cavalcante, Corrado, Critelli, Muto and Dominici2016 a; El Talibi et al. Reference El Talibi, Zaghloul, Perri, Aboumaria, Rossi and El Moussaoui2014; Perri & Ohta, Reference Perri and Ohta2014; Bi et al. Reference Bi, Yang, Li, Guo, Wang, Liu and Yin2015). Chemical weathering is an important earth surface process caused by interactions between rainwater and the mineral grains of a rock, with a consequent formation of new minerals (neoformed clay minerals). The mineralogy of neoformed clays in a weathering environment is a function of climatic conditions (e.g. Eberl, Reference Eberl1984). Thus, the mineralogical and chemical variations of a suite of sedimentary rocks can help in the evaluation of the palaeoweathering and palaeoclimatic conditions (e.g. Perri & Ohta, Reference Perri and Ohta2014). The continuously deposited sedimentary rocks in a restricted area have been regarded as an ideal archive for the investigation of continental weathering and palaeoclimate change at various temporal and spatial scales (e.g. Colin et al. Reference Colin, Turpin, Blamart, Frank, Kissel and Duchamp2006; Bi et al. Reference Bi, Yang, Li, Guo, Wang, Liu and Yin2015; Wan et al. Reference Wan, Toucanne, Clift, Zhao, Bayon, Yu, Cai, Yin, Révillon, Wang, Li and Li2015). For example, alternation of climatic conditions has been observed during the Permo-Triassic period, characterized by a global switch to a more humid climate at the end of the middle Permian enhancing chemical weathering processes (e.g. De la Horra et al. Reference De la Horra, Galan-Abellan, Lopez-Gomez, Sheldon, Barrenechea, Luque, Arché and Benito2012; Sinisi et al. Reference Sinisi, Mongelli, Memeli and Oggiano2014).
The Mesozoic continental redbeds represent an ideal sedimentary succession for studying the palaeoweathering and palaeoclimatic conditions of the Western-Central Mediterranean area during the Triassic–Jurassic rift-valley stage of Tethyan rifting, which led to the Pangaea break-up and subsequent development of a mosaic of plates and microplates. The Middle Triassic to Lowermost Jurassic redbeds preserve key geodynamic signatures from Pangaea break-up to Tethys opening. Thus, these sediments constitute an important stratigraphic marker characterizing the base of the Alpine cycle in many internal units of the Western-Central Mediterranean Alpine Chains, from the Gibraltar Arc to the Calabria–Peloritani Arc (e.g. Martín-Algarra, Solé de Porta & Maate, Reference Martín-Algarra, Solé de Porta and Maate1995; Mongelli et al. Reference Mongelli, Critelli, Perri, Sonnino and Perrone2006; Perrone et al. Reference Perrone, Martin-Algarra, Critelli, Decandia, D'errico, Estevez, Iannace, Lazzarotto, Martin-Martin, Martin-Rojas, Mazzoli, Messina, Mongelli, Vitale, Zaghloul, Chalouan and Moratti2006; Aldinucci, Gandin & Sandrelli, Reference Aldinucci, Gandin and Sandrelli2008; Critelli et al. Reference Critelli, Mongelli, Perri, Martìn-Algarra, Martìn-Martìn, Perrone, Dominici, Sonnino and Zaghloul2008; Perri et al. Reference Perri, Cirrincione, Critelli, Mazzoleni and Pappalardo2008, Reference Perri, Critelli, Mongelli and Cullers2011, Reference Perri, Critelli, Martìn-Algarra, Martìn-Martìn, Perrone, Mongelli and Zattin2013; Zaghloul et al. Reference Zaghloul, Critelli, Perri, Mongelli, Perrone, Sonnino, Tucker, Aiello and Ventimiglia2010; Perri, Reference Perri2014). The studied Mesozoic continental redbed mudrocks belong to the ‘Pseudoverrucano-type deposits’ (Perrone et al. Reference Perrone, Martin-Algarra, Critelli, Decandia, D'errico, Estevez, Iannace, Lazzarotto, Martin-Martin, Martin-Rojas, Mazzoli, Messina, Mongelli, Vitale, Zaghloul, Chalouan and Moratti2006) outcropping within the Internal Units of the Gibraltar Arc (Moroccan Rif and Betic Cordillera terranes) and Calabria–Peloritani Arc (Calabria–Peloritani terranes) areas (e.g. Perrone et al. Reference Perrone, Martin-Algarra, Critelli, Decandia, D'errico, Estevez, Iannace, Lazzarotto, Martin-Martin, Martin-Rojas, Mazzoli, Messina, Mongelli, Vitale, Zaghloul, Chalouan and Moratti2006; Critelli et al. Reference Critelli, Mongelli, Perri, Martìn-Algarra, Martìn-Martìn, Perrone, Dominici, Sonnino and Zaghloul2008; Perri et al. Reference Perri, Cirrincione, Critelli, Mazzoleni and Pappalardo2008, Reference Perri, Critelli, Mongelli and Cullers2011, Reference Perri, Critelli, Martìn-Algarra, Martìn-Martìn, Perrone, Mongelli and Zattin2013).
The distribution of major and trace elements coupled with the mineralogical composition of a sedimentary rock preserves key information for reconstructing and evaluating the palaeoweathering and palaeoclimatic conditions as well as the source-area composition and the diagenetic processes (e.g. Crichton & Condie, Reference Crichton and Condie1993; Cullers, Reference Cullers1995; Mongelli, Reference Mongelli1995; Bauluz et al. Reference Bauluz, Mayayo, Fernandez-Nieto and Gonzalezlopez2000; Perri et al. Reference Perri, Critelli, Mongelli and Cullers2011, Reference Perri, Critelli, Martìn-Algarra, Martìn-Martìn, Perrone, Mongelli and Zattin2013, Reference Perri, Caracciolo, Cavalcante, Corrado, Critelli, Muto and Dominici2016 a; Caracciolo et al. Reference Caracciolo, Von Eynatten, Tolosana-Delgado, Critelli, Manetti and Marchev2012; Amendola et al. Reference Amendola, Perri, Critelli, Monaco, Cirilli, Trecci and Rettori2016).
This paper aims to characterize and reconstruct the chemical weathering conditions of the Triassic–Jurassic boundary in the Western-Central Mediterranean area using various geochemical proxies based on the chemical and mineralogical composition of Mesozoic continental redbed mudrocks (Pseudoverrucano-type deposits). The major purpose of this work is to investigate the intensity of chemical weathering registered in these mudstones and further to reveal the general driving mechanism of chemical weathering conditions during the Triassic–Jurassic period in the Western-Central Mediterranean area further characterized by complex tectonic processes.
2. Sampling and methods
The chemical and mineralogical composition of 52 mudstone samples (32 from the stratigraphic sections of the Calabria–Peloritani Arc and 20 from the stratigraphic sections of the Gibraltar Arc) was used to evaluate the chemical weathering during the Lower Mesozoic in the Western-Central Mediterranean area (data from Mongelli et al. Reference Mongelli, Critelli, Perri, Sonnino and Perrone2006; Perri, Reference Perri2008; Perri et al. Reference Perri, Cirrincione, Critelli, Mazzoleni and Pappalardo2008, Reference Perri, Critelli, Mongelli and Cullers2011, Reference Perri, Critelli, Martìn-Algarra, Martìn-Martìn, Perrone, Mongelli and Zattin2013; Zaghloul et al. Reference Zaghloul, Critelli, Perri, Mongelli, Perrone, Sonnino, Tucker, Aiello and Ventimiglia2010; Perri & Ohta, Reference Perri and Ohta2014).
The mudstones were crushed in an agate mill to a very fine powder for X-ray diffraction (XRD) and X-ray fluorescence (XRF) spectrometry at the Laboratories of the DiBEST (University of Calabria). For XRD studies, the randomly oriented whole-rock powders and the clay fractions (<2 μm) were analysed. The occurrence of expandable clays was determined after treatment with ethylene glycol at 25°C for 15 h; the slides of the clay fractions (<2 μm) were further heated at a temperature of 550°C for 30–40 min to distinguish the chlorite and kaolinite peaks (Moore & Reynolds, Reference Moore and Reynolds1997). Elemental analyses for major- and some trace-element concentrations were obtained by XRF spectrometry on pressed powder discs of whole-rock samples. Total loss on ignition (LOI) was determined after heating the samples for 3 h at 900°C.
3. Geology of the study area
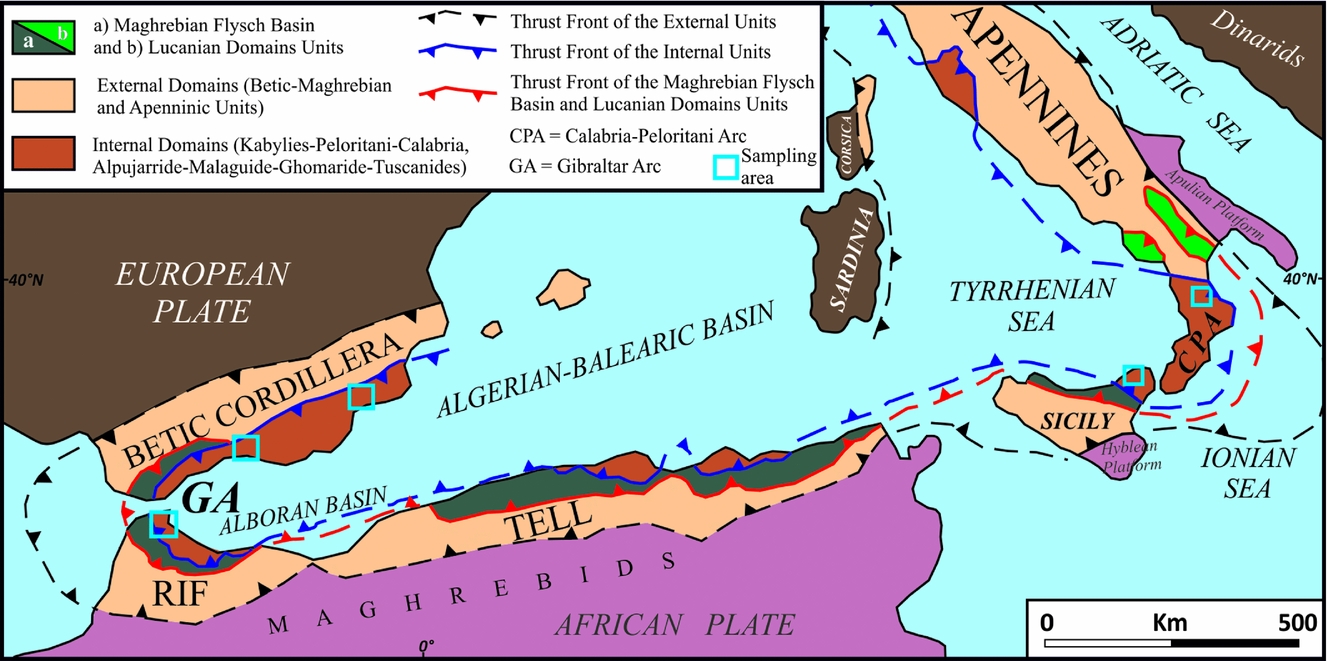
The Central-Western Mediterranean area is bordered by three alpine systems (Betic Cordillera, Maghrebian Chain and Apennines) that are linked by two main tectonic features with an opposed direction, the Gibraltar Arc to the west and the Calabria–Peloritani Arc to the east (e.g. Guerrera, Martín-Algarra & Perrone, Reference Guerrera, Martín-Algarra and Perrone1993; Guerrera & Martín-Martín, Reference Guerrera and Martín-Martín2014). The Gibraltar Arc and the Calabria–Peloritani Arc are composed of Mesozoic and Tertiary terrains deposited in three major palaeogeographic realms: the Internal Domain, Flysch Domain and External Domain (Guerrera, Martín-Algarra & Perrone, Reference Guerrera, Martín-Algarra and Perrone1993; Guerrera & Martín-Martín, Reference Guerrera and Martín-Martín2014). This work focuses on the mudrock continental redbeds (Pseudoverrucano-type; Perrone et al. Reference Perrone, Martin-Algarra, Critelli, Decandia, D'errico, Estevez, Iannace, Lazzarotto, Martin-Martin, Martin-Rojas, Mazzoli, Messina, Mongelli, Vitale, Zaghloul, Chalouan and Moratti2006) from the Mesozoic cover of selected units representative of the Internal Domains (Fig. 1). The terranes of the Internal Domains are derived from the dismemberment of the ‘Mesomediterranean Microplate’ (e.g. Guerrera, Martín-Algarra & Perrone, Reference Guerrera, Martín-Algarra and Perrone1993), which was tectonically and palaeogeographically independent of the main plates of the Central-Western Mediterranean area (e.g. Europa–Iberia and Africa–Adria plates) starting from the Middle Jurassic (e.g. Guerrera, Martín-Algarra & Perrone, Reference Guerrera, Martín-Algarra and Perrone1993).
Geological sketch map of the Alpine Chains in the Central-Western Mediterranean area (after, e.g., Perrone et al. Reference Perrone, Martin-Algarra, Critelli, Decandia, D'errico, Estevez, Iannace, Lazzarotto, Martin-Martin, Martin-Rojas, Mazzoli, Messina, Mongelli, Vitale, Zaghloul, Chalouan and Moratti2006; Critelli et al. Reference Critelli, Mongelli, Perri, Martìn-Algarra, Martìn-Martìn, Perrone, Dominici, Sonnino and Zaghloul2008; Guerrera & Martín-Martín, Reference Guerrera and Martín-Martín2014; Perri & Ohta, Reference Perri and Ohta2014).

The Gibraltar Arc is characterized by the Alboran Basin situated in the internal part of the Arc that subdivides the Betic Cordillera of southern Spain at the north and the Rif Chain of northern Morocco at the south (Guerrera, Martín-Algarra & Perrone, Reference Guerrera, Martín-Algarra and Perrone1993; Vera, Reference Vera2004).
The Betic Cordillera is composed of three different complexes defined on the basis of their lithostratigraphic characteristics and metamorphic signature: in ascending order, the Nevado–Filabride, Alpujarride and Malaguide complexes (e.g. Martín-Algarra, Reference Martín-Algarra1987; Vera, Reference Vera2004). The studied mudrocks belong to the Malaguide Complex that constitutes the highest tectonic element of the Betic Internal Domain, and is composed of a Palaeozoic basement unconformably covered by Mesozoic to Paleogene sedimentary successions that did not suffer pervasive deformation and/or metamorphism (Chalouan & Michard, Reference Chalouan and Michard1990). In particular, the Meso-Cenozoic sedimentary cover starts with well-developed Middle–Upper Triassic continental redbeds (Pseudoverrucano-type; Perrone et al. Reference Perrone, Martin-Algarra, Critelli, Decandia, D'errico, Estevez, Iannace, Lazzarotto, Martin-Martin, Martin-Rojas, Mazzoli, Messina, Mongelli, Vitale, Zaghloul, Chalouan and Moratti2006) that have been formally grouped into the Saladilla Formation (e.g. Roep, Reference Roep1972; Martín-Algarra, Solé de Porta & Maate, Reference Martín-Algarra, Solé de Porta and Maate1995; A. Maate, unpub. Ph.D. thesis, Granada Univ., 1996). This formation varies from tens of metres up to a few hundred metres, is composed of quartzose conglomerates, followed by red sandstones and mudstones (siltstones and claystones), and also includes some conglomerate and sandstone with carbonate clasts, limestone, marl and gypsum (Martín-Algarra, Reference Martín-Algarra1987).
The Internal Domains of the Rifian Chain are composed, from bottom to top, by three structural complexes: the Sebtide, ‘Dorsale Calcaire’ and Ghomaride complexes (Fallot, Reference Fallot1937; Didon, Durand Delga & Kornprobst, Reference Didon, Durand Delga and Kornprobst1973; Suter, Reference Suter1980). The Internal ‘Dorsale Calcaire’ Nappes are characterized by Meso-Cenozoic sedimentary successions showing a tectono-sedimentary evolution similar to that of the Ghomaride Nappes (Maate & Martín-Algarra, Reference Maate and Martìn-Algarra1992; A. Maate, unpub. Ph.D. thesis, Granada Univ., 1996). In particular, the Ghomaride Complex is composed of a Palaeozoic basement made up of slates, phyllites, metarenites and metalimestones, unconformably covered by Middle to Upper Triassic continental redbeds (Pseudoverrucano-type; Perrone et al. Reference Perrone, Martin-Algarra, Critelli, Decandia, D'errico, Estevez, Iannace, Lazzarotto, Martin-Martin, Martin-Rojas, Mazzoli, Messina, Mongelli, Vitale, Zaghloul, Chalouan and Moratti2006) followed by Lower Jurassic shallow-marine sediments (A. Maate, unpub. Ph.D. thesis, Granada Univ., 1996). The Middle to Upper Triassic continental redbeds belong to the Saladilla Formation, defined by Martín-Algarra, Solé de Porta & Maate (Reference Martín-Algarra, Solé de Porta and Maate1995) and Maate (unpub. Ph.D. thesis, Granada Univ., 1996) for the Western Betics and also for the Rifian Ghomarides (e.g. Zaghloul et al. Reference Zaghloul, Critelli, Perri, Mongelli, Perrone, Sonnino, Tucker, Aiello and Ventimiglia2010).
The Calabria–Peloritani Arc represents an exotic terrane separated from the NW–SE-trending Southern Apennines and the E–W-trending Sicilian Maghrebids by the Sangineto and Taormina tectonic lineaments, respectively (e.g. Bonardi et al. Reference Bonardi, Cavazza, Perrone, Rossi, Vai and Martini2001; Elter et al. Reference Elter, Grasso, Parotto and Mezzani2004; Carminati et al. Reference Carminati, Lustrino, Cuffaro, Doglioni, Beltrando, Peccerillo, Mattei, Conticelli and Doglioni2010). The Calabria–Peloritani Arc is composed of Jurassic to Cretaceous ophiolitic sequences and Palaeozoic metamorphic and plutonic terranes representing the remnants of Caledonian, Hercynian and Alpine orogens (e.g. Messina et al. Reference Messina, Russo, Borghi, Colonna, Compagnoni, Caggianelli, Fornelli and Piccarreta1994; Bonardi et al. Reference Bonardi, Cavazza, Perrone, Rossi, Vai and Martini2001; Critelli et al. Reference Critelli, Muto, Tripodi and Perri2013), that have drifted from the southern European – Iberic plate and accreted since the upper Oligocene over the Adria–Africa plate. Mesozoic to Cenozoic sedimentary successions cover these basement rocks (e.g. Critelli, Reference Critelli1999).
The northern sector of the Calabria–Peloritani Arc is characterized by the Sila Unit consisting of a Hercynian crystalline basement composed of low- to high-grade metamorphic rocks intruded by intermediate to felsic plutonic rocks (Sila Batholith) (e.g. Bonardi et al. Reference Bonardi, Cavazza, Perrone, Rossi, Vai and Martini2001). A thick Mesozoic sedimentary succession (Longobucco Group), made at the base of the Upper Triassic to Lowermost Jurassic (e.g. Zuffa, Gaudio & Rovito, Reference Zuffa, Gaudio and Rovito1980; Young, Teale & Bown, Reference Young, Teale and Bown1986; Santantonio & Teale, Reference Santantonio, Teale, Leggett and Zuffa1987; Baudelot et al. Reference Baudelot, Bouillin, Delga, Giunta and Olivier1988; Bouillin et al. Reference Bouillin, Mouterde, Olivier and Majesté-Menjoulas1988; Mariotti, Santantonio & Weis, Reference Mariotti, Santantonio and Weis2007; Santantonio, Fabbi & Aldega, Reference Santantonio, Fabbi and Aldega2016) continental redbeds (Pseudoverrucano-type; Perrone et al. Reference Perrone, Martin-Algarra, Critelli, Decandia, D'errico, Estevez, Iannace, Lazzarotto, Martin-Martin, Martin-Rojas, Mazzoli, Messina, Mongelli, Vitale, Zaghloul, Chalouan and Moratti2006), unconformably overlies the Sila Unit.
The southern sector of the Calabria–Peloritani Arc is characterized by the Peloritani Mountains consisting of several Alpine units where the San Marco d'Alunzio and the Longi-Taormina Units are the Lowermost tectonic nappes (e.g. Bonardi et al. Reference Bonardi, Cavazza, Perrone, Rossi, Vai and Martini2001; Messina et al. Reference Messina, Somma, Macaione, Carbone and Careri2004; Mongelli et al. Reference Mongelli, Critelli, Perri, Sonnino and Perrone2006; Perri et al. Reference Perri, Critelli, Mongelli and Cullers2011 and references therein). These units show a similar stratigraphic succession composed of a Palaeozoic polymetamorphic basement with a Mesozoic–Cenozoic sedimentary cover (e.g. Bonardi et al. Reference Bonardi, Cavazza, Perrone, Rossi, Vai and Martini2001; Messina et al. Reference Messina, Somma, Macaione, Carbone and Careri2004; Perri et al. Reference Perri, Critelli, Mongelli and Cullers2011 and references therein). The base of these Mesozoic sedimentary successions is characterized by Upper Triassic to Lowermost Jurassic (e.g. Lentini & Vezzani, Reference Lentini and Vezzani1975; Baudelot et al. Reference Baudelot, Bouillin, Delga, Giunta and Olivier1988; Santantonio, Fabbi & Aldega, Reference Santantonio, Fabbi and Aldega2016 and references therein) continental redbeds (Pseudoverrucano-type; Perrone et al. Reference Perrone, Martin-Algarra, Critelli, Decandia, D'errico, Estevez, Iannace, Lazzarotto, Martin-Martin, Martin-Rojas, Mazzoli, Messina, Mongelli, Vitale, Zaghloul, Chalouan and Moratti2006) particularly thick (>100 m) and well exposed, that pass upward into a carbonate facies (e.g. Messina et al. Reference Messina, Somma, Macaione, Carbone and Careri2004; Mongelli et al. Reference Mongelli, Critelli, Perri, Sonnino and Perrone2006; Perri et al. Reference Perri, Critelli, Mongelli and Cullers2011 and references therein).
This paper uses the geochemical and mineralogical data of the mudrock samples belonging to the Pseudoverrucano sub-domains of the Internal Domains in the central-western Mediterranean chains (Fig. 1), collected along the Mesozoic sedimentary successions of the Malaguide and Ghomaride units (Gibraltar Arc) and Sila, Longi–Taormina and San Marco d'Alunzio units (Calabria–Peloritani Arc) (e.g. Mongelli et al. Reference Mongelli, Critelli, Perri, Sonnino and Perrone2006; Critelli et al. Reference Critelli, Mongelli, Perri, Martìn-Algarra, Martìn-Martìn, Perrone, Dominici, Sonnino and Zaghloul2008; Perri et al. Reference Perri, Cirrincione, Critelli, Mazzoleni and Pappalardo2008, Reference Perri, Critelli, Mongelli and Cullers2011, Reference Perri, Critelli, Martìn-Algarra, Martìn-Martìn, Perrone, Mongelli and Zattin2013; Zaghloul et al. Reference Zaghloul, Critelli, Perri, Mongelli, Perrone, Sonnino, Tucker, Aiello and Ventimiglia2010; Perri & Ohta, Reference Perri and Ohta2014).
4. Evaluation of chemical weathering processes using several geochemical proxies
The bulk chemical and mineralogical composition of sedimentary rocks generally records the intensity of chemical weathering in the source areas due to the climatic changes that took place during a period (e.g. Nesbitt & Young, Reference Nesbitt and Young1982). Thus, the chemical and mineralogical variations of sedimentary rocks can potentially be used as a proxy for climate change (e.g. Rieu et al. Reference Rieu, Allen, Plötze and Pettke2007).
The mobility of soluble elements is a function of the relationships between climatic and weathering conditions. For example, wet humid environments produce intense weathering conditions, and the secondary phases formed by incongruent dissolution of silicates are minerals that do not incorporate major cations (i.e. Ca, Na, K, Mg), such as kaolinite and Al and Fe hydroxides (e.g. Gaillardet, Dupré & Allégrea, Reference Gaillardet, Dupré and Allégrea1999). Gaillardet, Dupré & Allégrea (Reference Gaillardet, Dupré and Allégrea1999) define weathering indices for several mobile elements by comparing their concentration to that of an immobile element with a similar magmatic compatibility. The weathering (mobility) indices, denoted as α, are calculated using the upper continental crust (UCC) composition of Taylor & McLennan (Reference Taylor and McLennan1985): α Mg=(Al/Mg)sed/(Al/Mg)UCC; α K=(Th/K)sed/(Th/K)UCC; α Ba=(Th/Ba)sed/(Th/Ba)UCC (Gaillardet, Dupré & Allégrea, Reference Gaillardet, Dupré and Allégrea1999). Samples characterized by values of these indices greater than 1 mean a depletion relative to the UCC and, thus, more intense weathering conditions than the samples with values lower than 1 that mean an enrichment relative to the UCC (e.g. Gaillardet, Dupré & Allégrea, Reference Gaillardet, Dupré and Allégrea1999).
To better characterize the chemical weathering processes that occurred during the Triassic–Jurassic boundary, the chemical and mineralogical composition of the redbed mudrocks collected along the lower portions of the sedimentary successions (Middle Triassic) of the Malaguide and Ghomaride units (Gibraltar Arc) and the composition of the redbed mudrocks collected along the higher portions of the sedimentary successions (Upper Triassic – Lowermost Jurassic) of the Sila, Longi-Taormina and San Marco d'Alunzio units (Calabria–Peloritani Arc) have been used (e.g. Mongelli et al. Reference Mongelli, Critelli, Perri, Sonnino and Perrone2006; Perri, Reference Perri2008; Perri et al. Reference Perri, Cirrincione, Critelli, Mazzoleni and Pappalardo2008, Reference Perri, Critelli, Mongelli and Cullers2011, Reference Perri, Critelli, Martìn-Algarra, Martìn-Martìn, Perrone, Mongelli and Zattin2013; Zaghloul et al. Reference Zaghloul, Critelli, Perri, Mongelli, Perrone, Sonnino, Tucker, Aiello and Ventimiglia2010; Perri & Ohta, Reference Perri and Ohta2014).
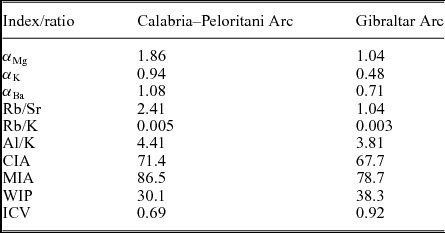
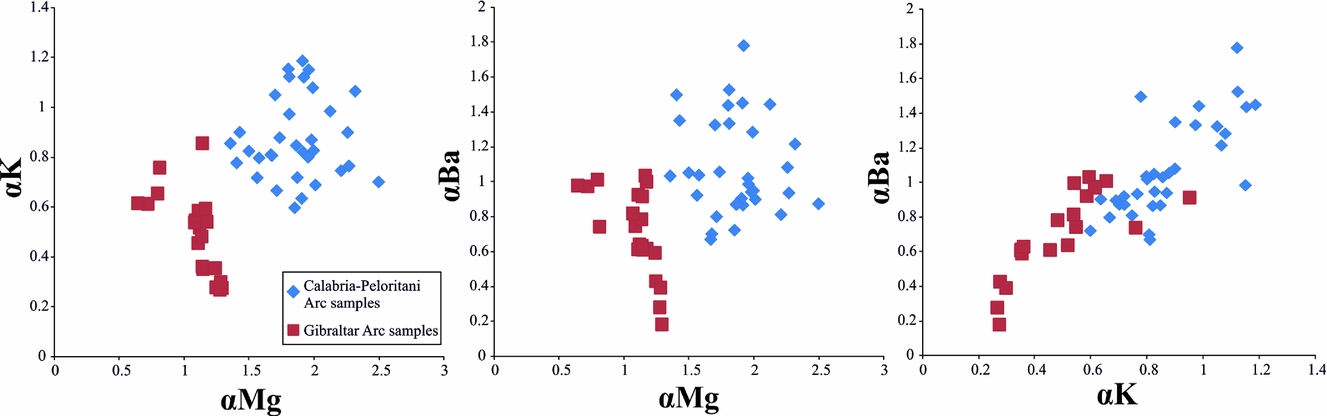
The studied mudrocks from the Calabria–Peloritani Arc display an average value >1 for the α Mg (1.86) and α Ba (1.08) and close to 1 for the α K (0.94), whereas the Gibraltar Arc samples are characterized by an average value <1 for the α Ba (0.55) and α K (0.44) and close to 1 for the α Mg (1.04) (Table 1). The studied mudrock samples show positive correlations (Fig. 2) among these α values, indicating that these indices of weathering give consistent information on the degree of weathering conditions.
Average values of weathering indices (α Mg, α K, α Ba, CIA, MIA, WIP, ICV) and elemental ratios (Rb/Sr, Rb/K, Al/K) relative to the chemical composition of the Mesozoic mudrock redbeds used in this work (data from Mongelli et al. Reference Mongelli, Critelli, Perri, Sonnino and Perrone2006; Perri et al. Reference Perri, Cirrincione, Critelli, Mazzoleni and Pappalardo2008, Reference Perri, Critelli, Mongelli and Cullers2011, Reference Perri, Critelli, Martìn-Algarra, Martìn-Martìn, Perrone, Mongelli and Zattin2013; Zaghloul et al. Reference Zaghloul, Critelli, Perri, Mongelli, Perrone, Sonnino, Tucker, Aiello and Ventimiglia2010; Perri & Ohta, Reference Perri and Ohta2014).

Diagrams showing the correlations among the weathering (mobility) indices (α Mg, α Ba and α K) for the studied mudrock redbeds (data from Mongeli et al. Reference Mongelli, Critelli, Perri, Sonnino and Perrone2006; Perri et al. Reference Perri, Cirrincione, Critelli, Mazzoleni and Pappalardo2008, Reference Perri, Critelli, Mongelli and Cullers2011, Reference Perri, Critelli, Martìn-Algarra, Martìn-Martìn, Perrone, Mongelli and Zattin2013; Zaghloul et al. Reference Zaghloul, Critelli, Perri, Mongelli, Perrone, Sonnino, Tucker, Aiello and Ventimiglia2010; Perri & Ohta, Reference Perri and Ohta2014). (a) α Mg vs α K, (b) α Mg vs α Ba and (c) α K vs α Ba.

5. Relationships between the geochemical proxies and the mineralogical composition of the mudrocks
Many indices of chemical alteration have been further used to evaluate the climatic variations based on the chemical composition of sedimentary rocks coupled with their mineralogical data. Among these indices the Chemical Index of Alteration (CIA) is the most used to monitor the source-area weathering related to the climate change (Nesbitt & Young, Reference Nesbitt and Young1982). Generally, high CIA values indicate the removal of mobile elements (e.g. Ca, Na, K) relative to stable residual constituents (Al, Ti) during chemical weathering related to humid and warm climate conditions, that further produce residual minerals like kaolinite. In contrast, very low CIA values reflect the absence of source-area weathering and consequently might indicate cool and/or arid conditions (e.g. Rieu et al. Reference Rieu, Allen, Plötze and Pettke2007). During progressive chemical weathering, plagioclase and potassium feldspar are altered to form clay minerals (e.g. kaolinite) with little change in the amount of stable quartz. Thus, the ratio of quartz/(quartz + K-feldspar + plagioclase) (the Mineralogical Index of Alteration; MIA) is also expected to be influenced by the intensity of chemical weathering (Johnsson, Reference Johnsson, Johnsson and Basu1993; Nesbitt et al. Reference Nesbitt, Young, McLennan and Keays1996; Nesbitt & Markovics, Reference Nesbitt and Markovics1997; Rieu et al. Reference Rieu, Allen, Plötze and Pettke2007).
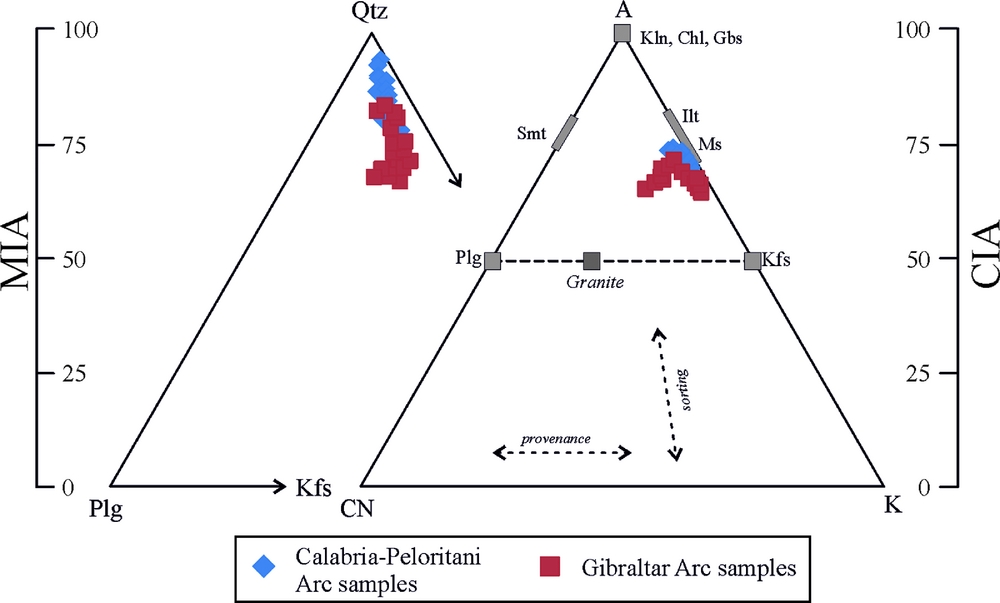
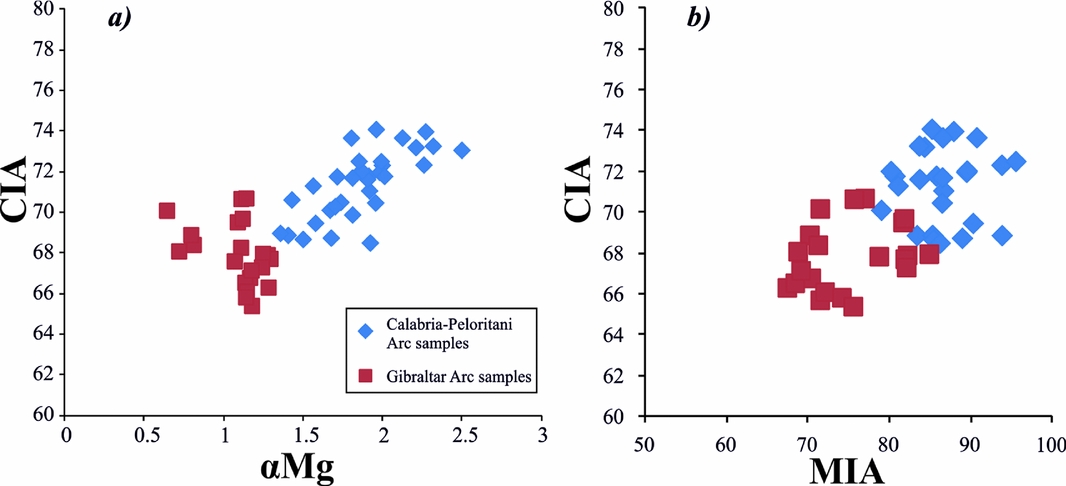
The studied mudrocks from the Calabria–Peloritani Arc show higher CIA (average = 71.4; Table 1) and MIA (average = 86.5; Table 1) values than the Gibraltar Arc samples (CIA, average = 67.7; MIA, average = 78.7) and fall in the A–CN–K diagram (Fig. 3) close to the muscovite–illite fields along the A–K side, suggesting diagenetic K-enrichment during burial (e.g. Mongelli et al. Reference Mongelli, Critelli, Perri, Sonnino and Perrone2006; Critelli et al. Reference Critelli, Mongelli, Perri, Martìn-Algarra, Martìn-Martìn, Perrone, Dominici, Sonnino and Zaghloul2008; Perri et al. Reference Perri, Critelli, Mongelli and Cullers2011, Reference Perri, Critelli, Martìn-Algarra, Martìn-Martìn, Perrone, Mongelli and Zattin2013). These values suggest an increase in palaeoclimatic humidity that favoured chemical weathering conditions from the Triassic to the Jurassic. The studied mudrock samples show positive correlations between these weathering indices (CIA-α Mg, Fig. 4a; CIA-MIA, Fig. 4b) suggesting that these element ratios give consistent information on the degree of weathering conditions.
Distribution of the studied mudrock redbeds in the ternary A–CN–K and Qtz–Plg–Kfs diagrams. Legend: Ms, muscovite; Ilt, illite; Kln, kaolinite; Chl, chlorite; Gbs, gibbsite; Smt, smectite; Kfs, K-feldspar; Plg, plagioclase; Qtz, quartz; A, Al2O3; CN, CaO + Na2O; K, K2O; CIA, Chemical Index of Alteration; MIA, Mineralogical Index of Alteration. (Data from Mongelli et al. Reference Mongelli, Critelli, Perri, Sonnino and Perrone2006; Perri, Reference Perri2008; Perri et al. Reference Perri, Cirrincione, Critelli, Mazzoleni and Pappalardo2008, Reference Perri, Critelli, Mongelli and Cullers2011, Reference Perri, Critelli, Martìn-Algarra, Martìn-Martìn, Perrone, Mongelli and Zattin2013; Zaghloul et al. Reference Zaghloul, Critelli, Perri, Mongelli, Perrone, Sonnino, Tucker, Aiello and Ventimiglia2010; Perri & Ohta, Reference Perri and Ohta2014.)

(a) Plot showing correlation between CIA and α Mg, and (b) correlation between CIA and MIA (data from Mongelli et al. Reference Mongelli, Critelli, Perri, Sonnino and Perrone2006; Perri, Reference Perri2008; Perri et al. Reference Perri, Cirrincione, Critelli, Mazzoleni and Pappalardo2008, Reference Perri, Critelli, Mongelli and Cullers2011, Reference Perri, Critelli, Martìn-Algarra, Martìn-Martìn, Perrone, Mongelli and Zattin2013; Zaghloul et al. Reference Zaghloul, Critelli, Perri, Mongelli, Perrone, Sonnino, Tucker, Aiello and Ventimiglia2010; Perri & Ohta, Reference Perri and Ohta2014).

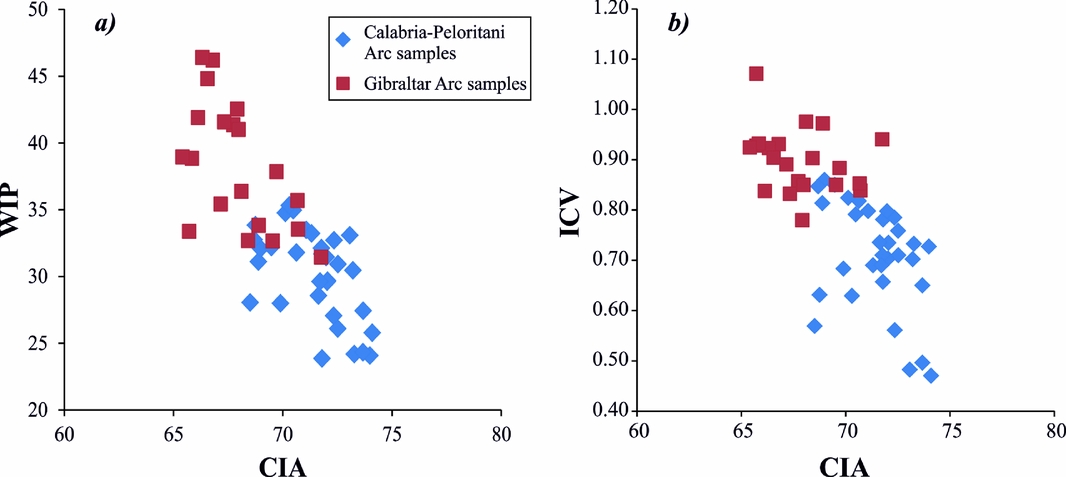
The weathering intensity of silicate rocks based upon the proportions of alkali and alkaline earth elements in a weathered product is also evaluated using the Weathering Index of Parker (WIP) (Parker, Reference Parker1970; Hamdan & Burnham, Reference Hamdan and Burnham1996). The smaller WIP values indicate stronger chemical weathering, which is opposite to CIA values; thus, the gradual increase in CIA and decrease in WIP values enhanced weathering intensity in a set of samples (e.g. Shao, Yang & Li, Reference Shao, Yang and Li2012). The studied mudrocks from the Calabria–Peloritani Arc show lower WIP values (average = 30.1; Table 1) than the Gibraltar Arc samples (average = 38.3; Table 1) and are inversely related to the CIA distribution (Fig. 5a). Cox, Lowe & Cullers (Reference Cox, Lowe and Cullers1995) proposed a measure called the Index of Compositional Variability (ICV), where the weight per cents of the oxides are used rather than moles, and the ICV values decrease with increasing degree of weathering (e.g. Potter, Maynard & Depetris, Reference Potter, Maynard and Depetris2005). The studied mudrocks from the Calabria–Peloritani Arc show lower ICV values (average = 0.69; Table 1) than the Gibraltar Arc samples (average = 0.92; Table 1) and are inversely related to the CIA distribution (Fig. 5b), according to the WIP vs CIA distribution.
(a) Plot showing correlation between CIA and WIP, and (b) correlation between CIA and ICV (data from Mongelli et al. Reference Mongelli, Critelli, Perri, Sonnino and Perrone2006; Perri, Reference Perri2008; Perri et al. Reference Perri, Cirrincione, Critelli, Mazzoleni and Pappalardo2008, Reference Perri, Critelli, Mongelli and Cullers2011, Reference Perri, Critelli, Martìn-Algarra, Martìn-Martìn, Perrone, Mongelli and Zattin2013; Zaghloul et al. Reference Zaghloul, Critelli, Perri, Mongelli, Perrone, Sonnino, Tucker, Aiello and Ventimiglia2010; Perri & Ohta, Reference Perri and Ohta2014).

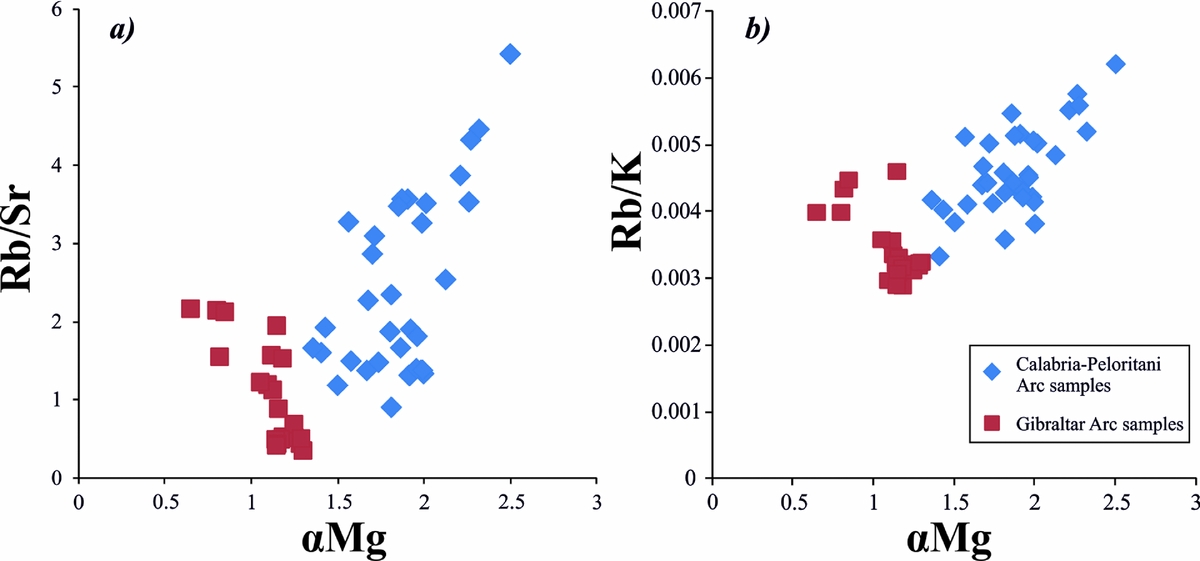
During weathering there is a substantial increase in the ‘Rb-type indices’ (e.g. Rb/Sr and Rb/K ratios) of most rocks due to the chemical behaviour of the Rb+ that is more readily retained on exchange sites of clay minerals than the smaller Sr2+ and K+ sites that are preferentially leached (e.g. McLennan et al. Reference McLennan, Hemming, McDaniel, Hanson, Johnsson and Basu1993; Perri, Dominici & Critelli, Reference Perri, Dominici and Critelli2015 and references therein). The increase of Rb/Sr and Rb/K ratios for the studied mudrocks is related to the increase of the α Mg (Fig. 6) that monitor the weathering conditions. In particular, the studied mudrocks from the Calabria–Peloritani Arc show higher Rb/Sr (average = 2.41; Table 1) and Rb/K (average = 0.005; Table 1) ratios than the Gibraltar Arc samples (Rb/Sr average = 1.04 and Rb/K average = 0.003; Table 1), suggesting a climatic change that favoured chemical weathering conditions from the Triassic to the Jurassic.
(a) Plot showing correlation between the Rb/Sr ratio and α Mg, and (b) correlation between Rb/K ratio and α Mg (data from Mongelli et al. Reference Mongelli, Critelli, Perri, Sonnino and Perrone2006; Perri et al. Reference Perri, Cirrincione, Critelli, Mazzoleni and Pappalardo2008, Reference Perri, Critelli, Mongelli and Cullers2011, Reference Perri, Critelli, Martìn-Algarra, Martìn-Martìn, Perrone, Mongelli and Zattin2013; Zaghloul et al. Reference Zaghloul, Critelli, Perri, Mongelli, Perrone, Sonnino, Tucker, Aiello and Ventimiglia2010; Perri & Ohta, Reference Perri and Ohta2014).

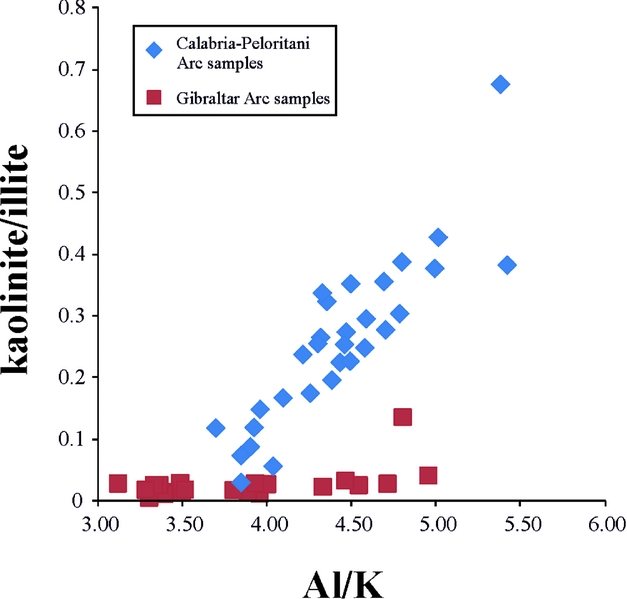
Mineralogical analyses highlight significant variations in the kaolinite and kaolinite/illite (K/I) ratios for the mudrock redbeds of the Gibraltar Arc and Calabria–Peloritani Arc (e.g. Perri, Reference Perri2008; Perri et al. Reference Perri, Cirrincione, Critelli, Mazzoleni and Pappalardo2008, Reference Perri, Critelli, Mongelli and Cullers2011, Reference Perri, Critelli, Martìn-Algarra, Martìn-Martìn, Perrone, Mongelli and Zattin2013). A significant increase in kaolinite content and therefore in the K/I ratio related to the Al/K ratio (Fig. 7) is recognized through the Uppermost Triassic to Lowermost Jurassic, since the Calabria–Peloritani Arc samples show higher value of kaolinite than the Gibraltar Arc samples. Clay minerals such as kaolinite and illite are primarily derived from weathered crystalline rocks containing feldspars and micas (e.g. Millot, Reference Millot1964). However, many authors show that illite is also commonly formed as a diagenetic product from the illitization of kaolinite and smectite (e.g. Hurst & Irwin, Reference Hurst and Irwin1982; Frey & Robinson, Reference Frey and Robinson1999; Decou et al. Reference Decou, Andrews, Alderton and Morton2016).
Plot showing correlation between the kaolinite/illite content and Al/K ratio (data from Mongelli et al. Reference Mongelli, Critelli, Perri, Sonnino and Perrone2006; Perri, Reference Perri2008; Perri et al. Reference Perri, Cirrincione, Critelli, Mazzoleni and Pappalardo2008, Reference Perri, Critelli, Mongelli and Cullers2011, Reference Perri, Critelli, Martìn-Algarra, Martìn-Martìn, Perrone, Mongelli and Zattin2013; Zaghloul et al. Reference Zaghloul, Critelli, Perri, Mongelli, Perrone, Sonnino, Tucker, Aiello and Ventimiglia2010; Perri & Ohta, Reference Perri and Ohta2014).

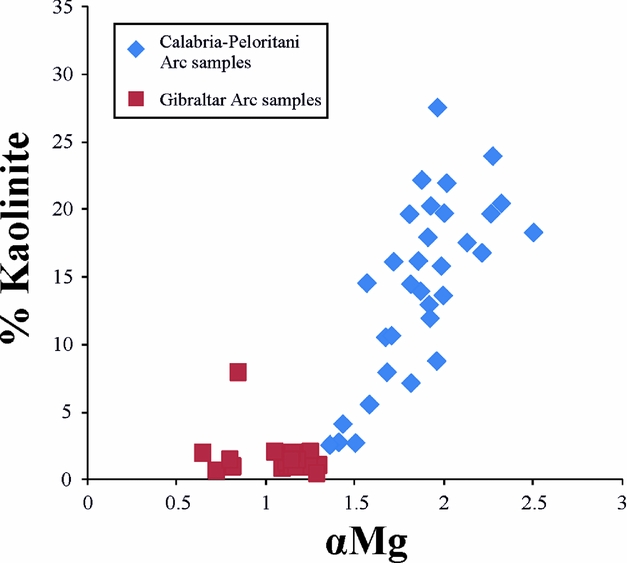
Generally, during burial diagenesis, kaolinite becomes unstable and is converted to illite depending on the temperature and depth (e.g. Hurst & Irwin, Reference Hurst and Irwin1982; Ehrenberg et al. Reference Ehrenberg, Aagard, Wilson, Fraser and Duthie1993; Frey & Robinson, Reference Frey and Robinson1999; Decou et al. Reference Decou, Andrews, Alderton and Morton2016). The studied mudrock samples from the Gibraltar Arc and Calabria–Peloritani Arc are characterized by similar diagenetic conditions (e.g. Perri et al. Reference Perri, Cirrincione, Critelli, Mazzoleni and Pappalardo2008, Reference Perri, Critelli, Mongelli and Cullers2011, Reference Perri, Critelli, Martìn-Algarra, Martìn-Martìn, Perrone, Mongelli and Zattin2013). Thus, the differences among the illite and kaolinite contents for the Gibraltar Arc and Calabria–Peloritani Arc mudrocks seem not strictly related to diagenetic effects, but are probably related to seasonal climatic changes characterized by an increase in humid conditions from the Uppermost Triassic to Lowermost Jurassic. The kaolinite content in the studied mudrocks is correlated to the α Mg (Fig. 8) that monitor the weathering conditions; thus, the higher kaolinite values recorded an increase of weathering effects due to the climatic change towards humid conditions through the Uppermost Triassic to Lowermost Jurassic, according to the above-mentioned considerations.
Plot showing correlation between the percentage of kaolinite and α Mg (data from Mongelli et al. Reference Mongelli, Critelli, Perri, Sonnino and Perrone2006; Perri, Reference Perri2008; Perri et al. Reference Perri, Cirrincione, Critelli, Mazzoleni and Pappalardo2008, Reference Perri, Critelli, Mongelli and Cullers2011, Reference Perri, Critelli, Martìn-Algarra, Martìn-Martìn, Perrone, Mongelli and Zattin2013; Zaghloul et al. Reference Zaghloul, Critelli, Perri, Mongelli, Perrone, Sonnino, Tucker, Aiello and Ventimiglia2010; Perri & Ohta, Reference Perri and Ohta2014).

The chemical compositions of the studied mudrock redbeds further indicate a gradual advancement in sediment recycling effect from the Uppermost Triassic to the Lowermost Jurassic and, thus, that the depositional environments for the Calabria–Peloritani Arc samples were probably more suitable for sediment recycling (Perri & Ohta, Reference Perri and Ohta2014). The difference among the ICV values of the studied samples, shown above, could also be related to sedimentary recycling effects. The seasonal climate alternations during the Triassic–Jurassic boundary correspond to an increase in palaeoclimatic humidity that favoured palaeoweathering conditions and recycling processes. However, since diagenetic and sediment recycling effects can overprint proxy signals, a full reconstruction of the chemical weathering process has not been accomplished in this region. This is mainly due to the difficulties in separating the signatures of the palaeoclimate change and the sediment recycling effect (Perri & Ohta, Reference Perri and Ohta2014).
Alternation of climatic conditions has been observed during the Permo-Triassic where redbeds outcropping in Sardinia island (central Mediterranean) show palaeoweathering proxies that suggest weak source-area weathering for the sediments of the Escalaplano Basin (Lower Triassic) under dry conditions (e.g. Sinisi et al. Reference Sinisi, Mongelli, Memeli and Oggiano2014). These conditions probably persist for the Lower to Middle Triassic, with a switch to a more humid climate at the end of the Upper Triassic which was characterized by enhanced chemical weathering. Furthermore, the transition to more humid conditions is recognized in the Tethyan Realm from δ18O data (Mutti & Weissert, Reference Mutti and Weissert1995) and clay mineralogy (Haas, Budai & Raucsik, Reference Haas, Budai and Raucsik2012) and in the Southern Permian Basin in southern Germany (Hornung & Aigner, Reference Hornung and Aigner2002) and is believed to begin in the Uppermost Triassic (e.g. Decou et al. Reference Decou, Andrews, Alderton and Morton2016).
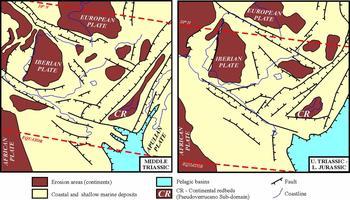
These climatic changes were probably related to the palaeogeographic restoration during the Upper Triassic to Lowermost Jurassic transition of the Western-Central Mediterranean area (Fig. 9) as well as to the palaeotectonic changes with important structural modifications within the sedimentary basin that could have fostered more humid conditions which in turn enhanced palaeoweathering conditions in the source areas (e.g. Sinisi et al. Reference Sinisi, Mongelli, Memeli and Oggiano2014).
Palaeogeographic sketch maps of the westernmost Tethys area during the Middle Triassic to Uppermost Triassic – Lowermost Jurassic transition (e.g. Vera, Reference Vera2004; Critelli et al. Reference Critelli, Mongelli, Perri, Martìn-Algarra, Martìn-Martìn, Perrone, Dominici, Sonnino and Zaghloul2008; Perri et al. Reference Perri, Critelli, Martìn-Algarra, Martìn-Martìn, Perrone, Mongelli and Zattin2013; Perri & Ohta, Reference Perri and Ohta2014).

6. Concluding remarks
The Middle Triassic – Lowermost Jurassic continental redbeds, preserved in rifted-margin prisms of many tectonic units from the internal domains of the Gibraltar Arc and Calabria–Peloritani Arc, have palaeogeographical significance at the scale of the Western-Central Mediterranean. The studied continental redbed mudrocks belong to the Pseudoverrucano-type deposits and constitute an important stratigraphic marker characterizing the base of the Alpine cycle in many internal units of the Western-Central Mediterranean Alpine Chains.
The purpose of this paper is to reconstruct the chemical weathering conditions of the Triassic–Jurassic boundary in the Western-Central Mediterranean area using the geochemical and mineralogical compositions of the Mesozoic Pseudoverrucano-type deposits. These Middle–Upper Triassic to Lowermost Jurassic mudrocks provide an opportunity to trace climatic variations and their impact on the compositional evolution of these sedimentary successions. The mudrocks from the Calabria–Peloritani Arc (Upper Triassic – Lowermost Jurassic) show higher values of weathering indices, such as α Mg, α Ba, α K, CIA and MIA values and the ‘Rb-type indices’ (e.g. Rb/Sr and Rb/K ratios), than the Gibraltar Arc samples (Middle–Upper Triassic). Furthermore, the mineralogical composition of these Mesozoic mudrocks is characterized by similar variations relative to the kaolinite and kaolinite/illite contents that are a further marker for the climatic changes. All these geochemical proxies are related to each other and to the clay mineral variations. The observed variations are consistent with a trend towards more humid conditions through the Uppermost Triassic to Lowermost Jurassic enhancing chemical weathering processes in the Western-Central Mediterranean area.
Acknowledgements
The author is indebted to Robert Cullers, two anonymous referees and the Editor Chad Deering for their reviews, discussions and suggestions on the manuscript.