INTRODUCTION
Despite the large number of population-based studies of depression, there is little consensus as to prevalence estimates in the older population. In an analysis of existing European community-based studies using Geriatric Mental State – Automated Geriatric Examination for Computer-Assisted Taxonomy (GMS-AGECAT), the European Collaborative Group on Depression (EURODEP) consortium reported a combined prevalence of 12·3% (14·1% in women and 8·6% in men) (Copeland et al. Reference Copeland, Beekman, Dewey, Hooijer, Jordan, Lawlor, Lobo, Magnusson, Mann, Meller, Prince, Reischies, Turrina, deVries and Wilson1999). Included in this analysis was the Liverpool-based Medical Research Council (UK) Ageing in Liverpool Project – Health Aspects (MRC-ALPHA) study (Copeland et al. Reference Copeland, Dewey, Wood, Searle, Davidson and McWilliam1987), which reported a prevalence of 10·0% (7·6% in men and 10·6% in women), and the London-based Gospel Oak study (Livingston et al. Reference Livingston, Hawkins, Graham, Blizard and Mann1990), which reported the considerably higher figure of 17·3% (14·3% in men and 19·2% in women), suggesting that prevalence may vary across the UK.
The prevalence in the very old is uncertain as many studies lack adequate community samples over the age of 85. Only four of the EURODEP studies report figures for the oldest-old and findings were inconsistent. A review of studies in the elderly (Palsson & Skoog, Reference Palsson and Skoog1997) found inconsistencies, some showing a rise over age 75, some a fall. More recent studies have shown constant rates (Steffens et al. Reference Steffens, Skoog, Norton, Hart, Tschanz, Plassman, Wyse, Welsh-Bohmer and Breitner2000), and an increased prevalence in women (Wu & Anthony, Reference Wu and Anthony2000).
Many of the EURODEP studies excluded those living in institutions, therefore the resulting estimate does not include all members of the community. People living in these settings are particularly likely to suffer from severe physical illness and dementia, both of which are associated with depression (Beekman et al. Reference Beekman, Penninx, Deeg, Ormel, Smit, Braam and van Tilburg1998; Olin et al. Reference Olin, Katz, Meyers, Schneider and Lebowitz2002; Freedland et al. Reference Freedland, Rich, Skala, Carney, Davila-Roman and Jaffe2003).
Other factors, such as socio-economic group and deprivation, also affect the occurrence of depression. The MRC-ALPHA study (Wilson et al. Reference Wilson, Chen, Taylor, McCracken and Copeland1999) reported that deprivation was associated with the prevalence of depression. Similarly, findings from the Hampshire Depression Project suggested that those visiting a surgery in a deprived area were more likely to suffer from depression than those visiting a practice in an affluent area (Ostler et al. Reference Ostler, Thompson, Kinmonth, Peveler, Stevens and Stevens2001).
This paper reports findings from a large epidemiological study in old age in several areas in England and Wales. The individual and inter-related effects of associated factors are examined.
METHOD
Participants
The Medical Research Council Cognitive Function and Ageing Study (MRC CFAS) is a population-based multicentre prospective cohort study from General Practice Registers at six sites across the UK, of which 13 004 subjects selected from five sites (Cambridgeshire, Gywnedd, Newcastle, Nottingham and Oxford) are reported here. The Cambridgeshire (Fen villages and areas adjacent to Ely) and Gwynedd samples were rural, the remainder urban. Initial screening of the entire sample took place between 1990 and 1994. Inclusion criteria were that participants should be in their 65th year and above on a specified date and living in a defined geographical area. Older individuals were over-sampled, with 50% of those screened aged 75 and over.
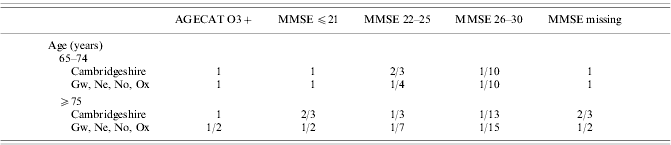
The current analysis was carried out on a stratified random subsample of 2640 participants (20% of the original sample) who took part in a detailed assessment interview at which depression items from the GMS-AGECAT (Copeland et al. Reference Copeland, Dewey and Griffiths-Jones1986) were administered. As the primary purpose of the study was to assess cognitive functioning, the selection of this subsample was based on AGECAT organicity and the Mini-Mental State Examination (MMSE) score, with an over-sampling of those with greater cognitive impairment (see Table 1).
Proportion of the screened subjects selected for assessment, by AGECAT Organicity Score and MMSE score
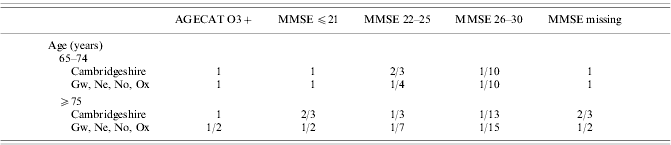
AGECAT, Automated Geriatric Examination for Computer Assisted Taxonomy; MMSE, Mini-Mental State Examination; Gw, Gwynedd; Ne, Newcastle; No, Nottingham; Ox, Oxford.
Detailed information regarding the response rate can be found elsewhere (MRC CFAS, 1998). In brief, 20 234 people were selected from a sampling frame of 1 23 691. Of these, 16 258 were eligible and available for the study. Eighty per cent (n=13 004) completed the screening interview. The response rate for the assessment interview was 83%.
Assessment of depression
Trained nurses administered a version of the GMS examination (GMS-B3; Copeland et al. Reference Copeland, Kelleher, Kellett, Gourlay, Gurland, Fleiss and Sharpe1976; Gurland et al. Reference Gurland, Copeland, Sharpe and Kelleher1976) comprising 157 items. These responses could then be used to generate a diagnosis of depression (as well as dementia and anxiety) using the AGECAT system (Copeland et al. Reference Copeland, Dewey and Griffiths-Jones1986). There are six levels of increasing severity associated with depression that can be separated into three groups:
(1) No symptoms (level d0): where no or very few depressive symptoms are evident.
(2) Subclinical depression (level d1–d2): characterized by minor mood symptoms and some non-specific symptoms (e.g. loss of interest, lack of enjoyment/lack of energy).
(3) Case level depression comprising a neurotic subtype, with two levels of severity (dn3 and dn4), and a psychotic subtype, with three levels of severity (dp3, dp4 and dp5). The higher the level, the greater the confidence in the case diagnosis. In practice, the symptoms that raise the diagnosis to level 4 or above are those that indicate severity (e.g. suicide attempt).
The AGECAT diagnostic algorithm assesses the severity of each psychiatric condition in relation to others, in order to determine which is the primary diagnosis. The main results relate only to those with a primary diagnosis of depression. Generally, case-level dementia overrides all but the most severe levels of depression.
Assessment of other factors
History of depression was recorded at the baseline screening interview, from the full 13 004, with two self-report questions. The first asked whether the participant had ever consulted a doctor regarding their nerves. If they answered ‘yes’, the interviewer asked them to describe these symptoms and noted whether it appeared to be depression or anxiety. The second question related to whether participants reported that they had ever received a diagnosis of depression from their doctor.
Sociodemographic factors were reported at the screening interviews. Socio-economic status (SES) was assessed by past employment history. Women were assigned SES based on their partner's occupation unless they were divorced or single, in which case it was assigned based on their own occupation. The Townsend Deprivation Index (Townsend et al. Reference Townsend, Phillimore and Beattie1988) was also measured; it is derived from the assessment of a number of factors (such as unemployment, car ownership and number of people per room) within each postal district. This gives an indication of the affluence of the area in which participants live, but does not necessarily reflect their own situation. Co-morbid medical conditions (excluding psychiatric conditions) were obtained from the baseline interview. Functional disability was measured by the Townsend Disability Scale (Townsend, Reference Townsend1979), which comprises nine questions relating to tasks such as housework, cooking and washing. Dementia diagnoses were obtained from the GMS examination using the AGECAT algorithm. Version 8.2 of the data was used.
Analysis
Prevalence rates of case-level depression were weighted to account for the sampling procedure used for the assessment interview. Where possible, prevalence estimates were stratified by sociodemographic factors, although occasionally this was not possible because of the small sample sizes. Odds ratios (ORs) with 95% confidence intervals (CIs) were calculated for sociodemographic factors using logistic regression, and again some analyses were excluded because of small sample sizes. Sensitivity analyses were conducted to assess the potential introduction of bias through missing data and interviewer effects.
For the main analyses, only those with a primary diagnosis of depression were considered to be cases, those with dementia and a secondary diagnosis of depression were not considered to be cases.
A further analysis including those with a secondary diagnosis of depression as cases was conducted. Participants who did not respond to the depression section of the questionnaire due to severe cognitive impairment were excluded from the denominator on the basis that it was not possible to make a diagnosis. This issue did not affect the main analysis as almost all of those participants had a primary diagnosis of dementia.
RESULTS
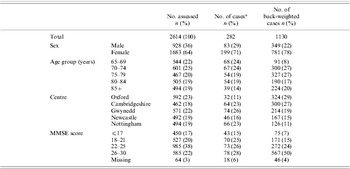
Full interviews were conducted in 2614 participants. The descriptive statistics for this subsample are given in Table 2. The high proportion of women (64%) reflects the population structure and the over-sampling of those aged 75 and above. Of those interviewed at baseline, 282 were given a primary diagnosis of depression. Back-weighting gives estimated numbers and proportions for the total number screened, adjusting for over-sampling of those aged 75 and above.
Numbers assessed, number of actual cases at assessment interview and number of cases back-weighted to the whole sample

a Cases of AGECAT depression level 3 and above, without concurrent dementia.
Prevalence of depression
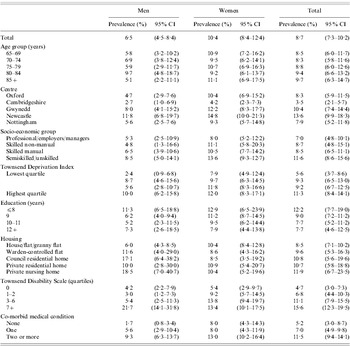
The prevalence of clinical depression (i.e. those with an AGECAT primary diagnosis of depression) is presented in Table 3. The overall prevalence estimate, which has been age and sex standardized to the 1991 population of England and Wales, was 8·7% (95% CI 7·3–10·2). There did not appear to be a relationship between prevalence and age.
Prevalence of a primary depression diagnosis

CI, Confidence interval.
Differences in prevalence were noted between the five centres, with Cambridgeshire reporting the lowest prevalence (3·5%), and Newcastle reporting the highest (13·6%). The difference between centres was significant (test for heterogeneity χ2(4)=34·8, p<0·001). High deprivation, high disability, and two or more co-morbid illnesses were associated with a greater prevalence of depression.
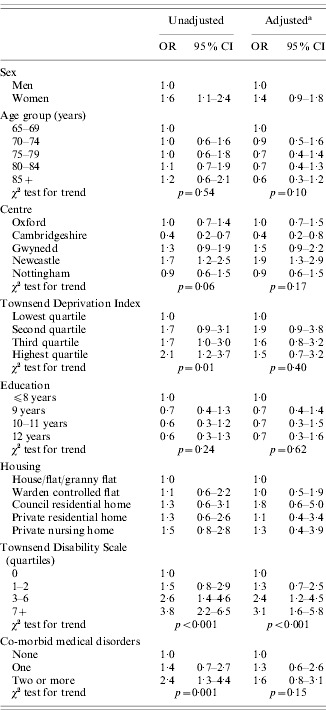
These factors were investigated further using univariate and multivariable logistic regression (Table 4). Women were significantly more likely to suffer from depression than men (OR 1·6, 95% CI 1·1–2·4); however, after adjustment for confounders, there was no difference between the sexes (OR 1·4, 95% CI 0·9–1·8). In the univariate analysis there appeared to be no difference in the level of depression across the age groups (p=0·54). However, when other factors are included in a multivariable analysis, a non-significant inverse trend emerges (p trend=0·10). This suggests that the high prevalence of depression that is sustained in very old age may be due to the accumulation of risk factors in the aged.
Factors associated with depression in the elderly

a Adjusted for all other risk factors.
Cambridgeshire reported a significantly lower prevalence compared to Newcastle, but not the other three centres. Adjustment for other factors had little effect. Two sensitivity analyses were conducted to ensure that these centre differences were not due to missing data. This had only a marginal effect. The rates of depression diagnosis did vary across interviewers but this was consistent with random variation.
After adjustment for other factors, the Townsend Deprivation Scale (p trend=0·40), socio-economic group (p trend=0·17), years of education (p trend=0·62), and number of co-morbid medical disorders (p trend=0·15) were not related to depression. However, there was an association between depression and severity of disability (p trend<0·001).
History of depression
Nineteen per cent (n=2474) of participants in the baseline sample had consulted a doctor about emotional problems. Logistic regression analysis indicated that those who consulted their doctor regarding depressive symptoms were more than four times more likely to suffer from depression at the assessment interview than those who had not (OR 4·2, 95% CI 2·7–6·4).
Severe depression
The prevalence of severe depression (AGECAT dn4 and dp4) was 2·7% (95% CI 1·9–3·5). Although lower rates of severe depression were reported in Cambridgeshire and Gwynedd, these differences were not significant. Adjusted ORs for sex, age and centre are shown in Table 5. After adjustment for sex and centre, severe depression remained constant with age; however, adjustment for health status was not possible because of the small number of cases. Analysis of other variables showed that similar trends were evident for severe depression as for depression of lesser severity, but the CIs were wide and none of these associations was significant.
Prevalence of severe depression
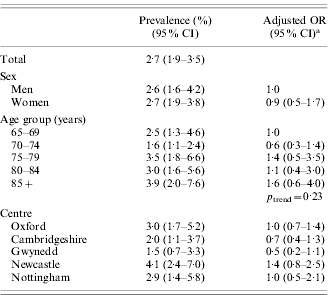
a Adjusted for age and sex.
OR, odds ratio; CI, confidence interval.
Prevalence including those with a secondary diagnosis of depression
An additional 105 participants (4%) who took part in the assessment interview were excluded from the denominator, as they were unable to answer the depression section of the questionnaire due to severe cognitive impairment. The inclusion of those with a secondary diagnosis of depression increases the overall prevalence to 9·7% (95% CI 8·2–11·1). Of those with dementia, 28·0% also met the case-level diagnosis of depression.
DISCUSSION
The prevalence of depression in the MRC CFAS was 8·7%. Severe depression was rare, affecting just 2·7% of the population. Depression was associated with female gender, functional disability, medical co-morbidity, centre, high deprivation and report of depressive symptoms to the doctor. Disability was the most strongly associated factor. Depression prevalence remained constant with age, but once other factors were included in a multivariate model, there was a weak inverse association between age and prevalence.
Methodological issues
Structured interviews were conducted by non-clinical interviewers and diagnoses were derived by computerized algorithm and not by medical clinicians. Such a procedure is necessary to achieve reliability across many interviewers and centres, in a study of this scale. The purpose of the AGECAT algorithm is to identify individuals who require intervention. When applied to a community sample, the AGECAT algorithm has been shown to have good agreement with psychiatrists' ratings of a need for intervention, with a κ value of 0·8 for depression (Copeland et al. Reference Copeland, Dewey and Griffiths-Jones1986).
Depression could not be assessed in some individuals with severe dementia. This would have little effect on the main analysis, as primary diagnoses were of dementia and not depression; however, these participants had to be excluded from the denominator in the analysis that included secondary cases of depression.
Prevalence of depression
The prevalence rate in MRC CFAS (8·7%) was slightly lower than that reported for the EURODEP meta-analysis. These studies all used the GMS-AGECAT. Prevalences reported in the literature vary considerably, partly depending on assessment scales and criteria, with symptom scales finding higher rates, predominantly in the milder range, than rates based on diagnostic criteria, such as ICD, DSM or AGECAT (Girling et al. Reference Girling, Barkley, Paykel, Gehlhaar, Brayne, Gill, Mathewson and Huppert1995).
Subjects with a diagnosis of dementia also frequently had a diagnosis of case-level depression and their inclusion increased the prevalence to 9·7%. It is likely that this increase would be more marked in the older age groups, as the prevalence of dementia rises with age. Using the widely adopted concept of co-morbidity of disorders, it is reasonable that these subjects should be included, as their depression is severe enough to warrant treatment. However, some symptoms that contribute to a depression diagnosis, such as muddled thinking, memory problems and communication difficulties, may be confounders, better attributed to the presence of cognitive impairment.
Factors associated with depression
The factors other than age that we found associated with depression in the univariate analyses – female gender, disability, medical co-morbidity, and higher social deprivation – have also been found to be associated with depression in many studies (see reviews by Jorm Reference Jorm1995; Palsson & Skoog Reference Palsson and Skoog1997; Cole & Dendukuri Reference Cole and Dendukuri2003; Blazer & Hybels Reference Blazer and Hybels2005). In this community sample of 2640, we could not assess properly another factor that has received considerable recent attention, brain disease. However, a smaller neuropathological study addressing this relationship will follow.
Disability was the factor most strongly associated with depression. We found depression prevalence constant with age, unlike several EURODEP studies, which reported that depression decreased during old age. Including additional risk factors in the multivariate analysis resulted in a reduced rate of depression with increasing age, largely due to the inclusion of functional disability, itself strongly related to both age and depression. The reduction in the rates by age when other risk factors were controlled was also found by others (Blazer et al. Reference Blazer, Burchett, Service and George1991; Jorm, Reference Jorm1995). Functional disability is commonly a result of physical disorder but an analysis of EURODEP studies also found functional disability more strongly related to depression than were chronic physical disorders (Braam et al. Reference Braam, Prince, Beekman, Delespaul, Dewey, Geerlings, Kivela, Lawlor, Magnusson, Meller, Peres, Reischies, Roelands, Schoevers, Saz, Skoog, Turrina, Versporten and Copeland2005). The very old are increasing in numbers, and suffer from much ill health, so the high rate of depression, its detection and amelioration are important for clinicians and for public health.
Higher deprivation was associated with greater levels of depression in the community but not after the inclusion of other factors in the multivariate model. The association between sociodemographic factors and depression may largely be due to those in the higher social class groups being less likely to suffer from other illness than those in lower groups (Doran et al. Reference Doran, Drever and Whitehead2004).
We found some variation by geographical area, with the lowest rates in a rural Fen area of Cambridgeshire. The reason is unclear. It is possible that other variables not included in these measures are responsible, such as rurality. Only Cambridgeshire and Gwynedd were rural, among the areas included in this study. Gwynedd did not have a lower rate of depression but there is other evidence of lower rates of psychiatric disorder in rural areas in the UK, for instance in the National Morbidity Survey (Paykel et al. Reference Paykel, Abbott, Jenkins, Brugha and Meltzer2000). In a community-based sample of the elderly, the presence of more elderly people in the neighbourhood was associated with lower levels of depression (Kubzansky et al. Reference Kubzansky, Subramanian, Kawachi, Fay, Soobader and Berkman2005). This was suggested to be the consequence of greater social support for the elderly in these areas. However, an inspection of the age structure in the areas from which our samples were drawn does not support this as an explanation for the centre differences.
Consistent with previous findings (Jongenelis et al. Reference Jongenelis, Pot, Eisses, Beekman, Kluiter, van Tilburg and Ribbe2003, Reference Jongenelis, Pot, Eisses, Beekman, Kluiter and Ribbe2004), depression prevalence was high in residential and nursing homes although only in men. The majority of institutionalized participants had a primary diagnosis of dementia and therefore were not considered cases in this analysis, which perhaps accounts for the weak association between accommodation status and depression.
CONCLUSION
Depression in the elderly is common, particularly in those experiencing a high level of functional disability. In contrast to many previous studies, the prevalence of depression appears to remain high into old age. These findings emphasize the importance of addressing the psychological effects of disability in old age and also of investigating efficacy of treatment with antidepressants.
DECLARATION OF INTEREST
Eugene Paykel was Editor of Psychological Medicine at the time that this manuscript was submitted. He was not involved in its consideration for publication.